Unravelling the white light emission in a single-phase new stoichiometric vanadate phosphor synthesized by rapid low-temperature one-pot synthesis and its W-LED prototype with high CRI and luminous efficacy†
Asish K.
Dehury
 ab,
Manas K.
Sahoo
a,
Rajeswari
Kainda
ab and
Yatendra S.
Chaudhary
 *ab
*ab
aMaterials Chemistry Department, CSIR-Institute of Minerals and Materials Technology, Bhubaneswar 751013, India. E-mail: yschaudhary@immt.res.in
bAcademy of Scientific and Innovative Research (AcSIR), Ghaziabad – 201002, India
First published on 1st October 2024
Abstract
A vacancy-activated intrinsic white light emitting phosphor – a new stoichiometric single-phase Ba3V4O13, has been synthesized by rapid and efficient microwave synthesis in 15 min at 200 °C. The phosphor exhibits long-range disorder and morphology transformation from rod to sheet-like in 30 min and to spherical shape (∼50 ± 5 nm) upon raising the temperature to 220 °C, owing to dissolution and subsequent recrystallization. There is the appearance of a V4+ state, formed by the reduction of V5+, implying the creation of oxygen vacancies (VO). The detailed first-principal calculations and experimental data reveal rearrangement in the band structure following the generation of VO, resulting in the narrowing of the EVB maxima and ECB minima. The optimized BVO-200-15 exhibits white light emission with CIE (0.333, 0.368) and 23.3% internal quantum efficiency, resulting from charge transfer-based blue-green emission within the tetrahedral VO43− moiety, along with VO related red emission, and is stable up to 250 °C. The mechanistic investigations reveal two radiative states at low temperatures (90–270 K), and three radiative states at room temperature further confirmed by time resolved emission spectra (TRES). By employing a down-conversion BVO-200-15 phosphor, a stable single-phosphor-based white light-emitting prototype was fabricated, exhibiting a high color rendering index (CRI) of 86.1, correlated color temperature (CCT) of 5998 K, and high luminous efficacy (LE) of ∼128.4 lm W−1.
1. Introduction
White LEDs, being fabricated by integrating a blue-emissive LED chip with yellow-emissive phosphors or an amalgamation of two or three phosphors with a blue/UV LED chip, are energy-efficient and have better luminous efficacy (LE) than that of traditional incandescent and fluorescent lamps.1,2 Nevertheless, achieving both superior color rendering index (CRI) and stability in these W-LEDs remains a significant challenge. They also suffer from a bluish tinge (which can be harmful to the human eye retina), self-absorption, intensity dampening, complex manufacturing processes, and component degradation.3–5 Furthermore, their high CRI often comes at the expense of LE due to trade-offs in broad emission sources.Single-phase phosphors capable of generating broad white emission can address these issues by eliminating the need for multiple phosphors and the bluish tinge, while also providing better color balance with high luminous efficacy. When integrated with nUV/UV LEDs, they can overcome the aforementioned shortcomings and simplify the manufacturing process.6,7
Recently, self-activated (intrinsic) phosphors have captured tremendous interest over rare earth-activated phosphors due to their cost-effectiveness, eco-friendliness, and simplified purification process.8–24 Tetrahedral/octahedral clusters such as CeO6, VO4, WO6, TiO6, PO4, etc can produce broad emission by facilitating efficient charge transfer-related emissions, which can be achieved by tuning the defects/vacancies, bond lengths, and lattice distortion in these clusters and, therefore, they are potential alternative host materials to rare earth elements.25 In particular, vanadates have garnered significant attention in next-generation solid-state lighting due to their exceptional optoelectronic properties and ease of processing. Specifically, the tetrahedral VO43− exhibits excitation and absorption in the UV/nUV region with emission in the visible spectral range via a broad charge transfer band from ligand (O2−) to metal (V5+). This makes it a promising candidate for intrinsic white light-emitting devices. Nevertheless, the radiative relaxation from the triplet excited state (3T1, 3T2) to the singlet ground state (1A1) is only allowed when the lattice is a little distorted, enabling radiative pathways that enhance the intensity and internal quantum efficiency. Various classes of vanadate material, such as M2V2O7, M3V2O8, MVO3, and M10V6O25 (where M = Mg, Ca, Sr, Ba, Cs, etc., give rise to the emission of different regions-colors), have been investigated extensively.26–40 However, to obtain white-light emission, doping of rare earth metal ions, heavy metals, and defect engineering at high temperatures have been explored by energy-intensive, time-consuming, and/or labor-intensive approaches.
It is well established that the microwave generates a homogeneous heating zone that essentially enables heating at the atomic and molecular level, which may eventually lead to the controlled distortion of the molecular bonds and trigger the formation of vacancies at the small reaction time scale of minutes.34 Considering these prospects, the one-pot microwave-based synthesis strategy has been explored to synthesize an intrinsic white-light-emitting phosphor with a new stoichiometry of barium vanadate that exhibits bright white light emission (over 400–750 nm spectral region). Such broad emission arises from the combination of host charge transfer emission and oxygen vacancy-activated contribution. To the best of our knowledge, no study on the emission and photophysical properties of tri barium tetravanadate phosphors has been reported, except its solid-state synthesis for probable applications in IR lasers and ferroelectric devices.31
The distinct morphologies formed as a function of reaction time and temperature have been studied using field emission scanning electron microscopy (FESEM) and high-resolution transmission electron microscopy (HRTEM). The formation of defects, and structure have been investigated using X-ray diffraction (XRD), Raman spectroscopy, X-ray photoelectron spectroscopy (XPS), and electron paramagnetic resonance spectroscopy (EPR). In order to gain a deeper understanding of the geometry, electronic structure, and optical properties of Ba3V4O13 crystals, density functional theory (DFT) based on first principles has been carried out alongside the experimental findings. Additionally, cryoscopic photoluminescence emission and lifetime studies have been undertaken to elucidate the underlying mechanism of triple-band emission in the synthesized single-phase phosphor, which further corroborates with the theoretical simulation results and provides new comprehensive insight into the structure, properties, and origin of white light emission in the new stoichiometric phosphor. Furthermore, the W-LED prototype has been fabricated using the optimized phosphors that demonstrate high CRI (86.1), neutral CCT (5998 K), and high luminous efficacy (∼128.4 lm W−1).
2. Results and discussion
2.1. Elucidating the structure, phase and morphology of the synthesized phosphors
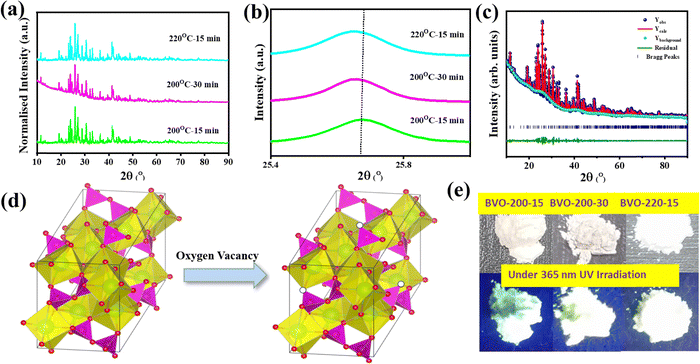
The nanostructured phosphors have been synthesized, varying the temperature, time, and pressure in the alkaline aqueous medium using a microwave reactor, where the homogeneous heating zone generated by the acceleration of the diffusion mechanism enables their formation within 15–30 min, Fig. S1 (ESI†). Under the optimized conditions at 200 °C for 15 and 30 min, and at 220 °C for 15 min reaction time and pressure of 12.5 mbar, the single phase monoclinic Ba3V4O13 is formed, as confirmed by the appearance of (110), (011), (202), (121), (202), (−411), (022), (200), (022), (−321), (013), (510), (130), (−123), (004), (521), (611), (530), (−532), (242), (−732) and (444) XRD peaks. It consists of two Ba–O units, e.g., Ba2+–[O2−]11 (diminished icosahedron) and Ba2+–[O2−]8 (tricapped triangular prism) with the bond length of Ba–O ranging from 2.70–3.26 Å and 1.66–1.80 Å, respectively, Fig. 1(a).31,32 There is a gradual shifting of the peaks toward a higher 2θ value due to the compression of the crystal lattice when the reaction temperature and time increase. This is because of dissolution and subsequent recrystallization upon prolonged microwave exposure at elevated temperatures, Fig. 1(b).41–43Whereas, at lower or higher temperatures and reaction times, other commonly known Ba3V2O7 and Ba2V2O6 phases are formed. To elucidate the degree of deformation in the unit cell, the Rietveld refinement analysis was performed, and the refinement parameters obtained are summarised in Tables S1 and S2 (ESI†) and Fig. 1(c). There are two inequivalent V5+–[O2−]4 tetrahedra units with bond lengths ranging from 1.66 to 1.80 Å, and corner-sharing V5+–[O2−]4 tetrahedra with bond lengths ranging from 1.69 to 1.82 Å. Besides this, there are seven inequivalent O2− sites with three inequivalent oxygens bonded in a distorted single-bond geometry to three Ba2+ and one V5+ atom, two inequivalent oxygens bonded to two Ba2+, and one V5+ atom, one oxygen in a distorted bent 152° geometry to two V5+ atoms and one oxygen bonded to one Ba2+ and two equivalent V5+ atoms, respectively (Fig. 1(c)). Moreover, the gradual reduction of cell parameters (a, b, c) and volumes (V) can be observed in Table S1 (ESI†). The V–O–Ba, Ba–O–Ba, and O–V–O structural units in the crystal lattice have slightly different lengths, implying the long-range disorder in the phosphor, Table S3 (ESI†). The diffraction peak gradually shifts toward a higher 2θ due to the compression of the crystal lattice, a phenomenon triggered by the dissolution and recrystallization during extended microwave exposure at higher temperatures, Fig. 1(b).41–43 Interestingly, when subjected to UV irradiation, the synthesized Ba3V4O13 phosphor powder emits bright white light (Fig. 1(e)). The synthesized phosphors are referred to as BVO; for example, BVO-200-15 for Ba3V4O13 synthesized at 200 °C with 15 min exposure time.
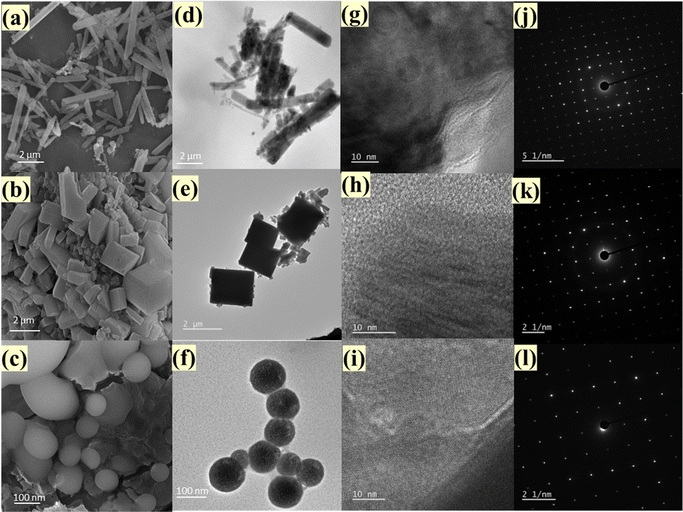
The field emission scanning electron microscopy (FESEM) and high-resolution transmission electron microscopy (HRTEM) images show the growth process of Ba3V4O13 phosphors from rod shape (average radius of 45 ± 3 nm and length of the order of 3 ± 0.5 μm) to sheet-like morphology (with length of 2 ± 0.8 μm, breadth of 1.8 ± 0.2 μm and thickness of 15 ± 5 nm) with the increase in the microwave exposure time from 15 to 30 min. Additionally, a transition to a spherical shape (∼50 ± 5 nm) occurs when the temperature is raised from 200 to 220 °C. These transformations are attributed to the dissolution and subsequent recrystallization taking place, which causes small distortions in bond length and angles in the Ba2+–[O2−]11, Ba2+–[O2−]8, and V5+–[O2−]4 clusters of the crystal lattice, eventually resulting in a modification in the orientations of the clusters. As a consequence, this enables morphology transition through growth along a specific (low-energy) facet, coalescence, or oriented attachment of the clusters, Fig. 2(a)–(f).34,36,44,45 The interplanar distances calculated from the HRTEM lattice fringes are of the order of 7.43, 7.62, and 7.43 Å that correspond to the (200), (110), and (200) planes of BVO-200-15, BVO-200-30, and BVO-220-15, respectively. The formation of a monoclinic structure is further supported by the SAED pattern, Fig. 2(g)–(l). Energy dispersive spectroscopy and elemental mapping results show that the Ba, V, and O elements are present and distributed evenly throughout the Ba3V4O13 phosphor (Fig. S2 and S3, ESI†).
2.2. Exploring the defect chemistry
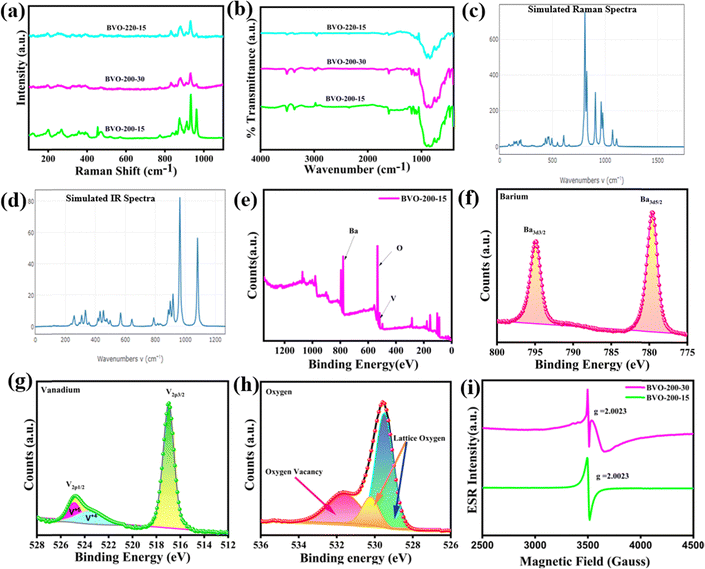
The bands in the Raman spectrum observed between 967–874, 777–850, 407, and 471 cm−1 attributed to the symmetric, weak asymmetric stretching, symmetric bending vibration of VO43− ions, and symmetric bending vibrations of VO43− anions, respectively, Fig. 3(a). The asymmetric bending is observed at 525 and 572 cm−1, and 400 cm−1 is assigned to lattice mode vibrations of the Ba3V4O13 crystal.34,36 The presence of bands between 400–1000 cm−1 in the FT-IR spectrum corresponds to vibration modes in the VO43− unit. The asymmetric stretching of the O–V–O unit is generally observed at 540 cm−1, Fig. 3(b).33,34,36 It is observed that both Raman and FT-IR spectra have nearly the same energy value for the V–O bond stretching and bending of polarization of the spheroid and bonds, respectively, which corroborates with theoretical simulation values obtained from the DFT calculation, Fig. 3(c) and (d).However, the broadening in the Raman and FT-IR bands with an increase in reaction time and temperature is due to increased defects, as discussed above. The X-ray photoelectron spectroscopy survey spectrum of BVO-200-15 and BVO-200-30 is shown in Fig. 3(e) and Fig. S4 (ESI†), in which the signals associated with Ba, O, and V elements were detected. The X-ray photoelectron spectroscopy (XPS) peaks at a binding energy of 530.1 and 531.4 eV correspond to the O 1s, because of the presence of Ba–O or V–O (from VO43− clusters) and oxygen vacancies in the crystal, respectively, Fig. 3(e) and (f). Further analysis reveals the +2 oxidation state of barium having Ba 3d3/2 and Ba 3d5/2 (peaks at 794 and 778.6 eV, respectively), Fig. 3(g). In the V2p spectrum, the peaks that appeared at 515.8, and 523.4 eV correspond to V 2p3/2 and V 2p1/2, respectively, confirming the V5+, Fig. 3(h).43,46–50 In general, the oxygen vacancy is represented as two electrons in place of the vacated space of oxygen, which was confirmed by the derivative EPR spectra with g = 2.003 for BVO-200-15. Conversely, the more distorted phosphor BVO-200-30 exhibits contribution from V4+, which is formed by the reduction of V5+ by the electrons available in the vicinity of the oxygen vacancy, resulting in the formation of a single positive oxygen vacancy, Fig. 3(i).51–53 Furthermore, quantification from XPS gives an atomic ratio of Ba/V/O (3.00![[thin space (1/6-em)]](https://www.rsc.org/images/entities/char_2009.gif) :
:![[thin space (1/6-em)]](https://www.rsc.org/images/entities/char_2009.gif) 3.98
3.98![[thin space (1/6-em)]](https://www.rsc.org/images/entities/char_2009.gif) :
:![[thin space (1/6-em)]](https://www.rsc.org/images/entities/char_2009.gif) 12.61) and (3.00
12.61) and (3.00![[thin space (1/6-em)]](https://www.rsc.org/images/entities/char_2009.gif) :
:![[thin space (1/6-em)]](https://www.rsc.org/images/entities/char_2009.gif) 4.09
4.09![[thin space (1/6-em)]](https://www.rsc.org/images/entities/char_2009.gif) :
:![[thin space (1/6-em)]](https://www.rsc.org/images/entities/char_2009.gif) 11.02) for BVO-200-15 and BVO-200-30, respectively, indicating higher oxygen deficiency in BVO-200-30 upon prolonged microwave exposure.
11.02) for BVO-200-15 and BVO-200-30, respectively, indicating higher oxygen deficiency in BVO-200-30 upon prolonged microwave exposure.
2.3. Absorption, electronic structure, and first principle calculations
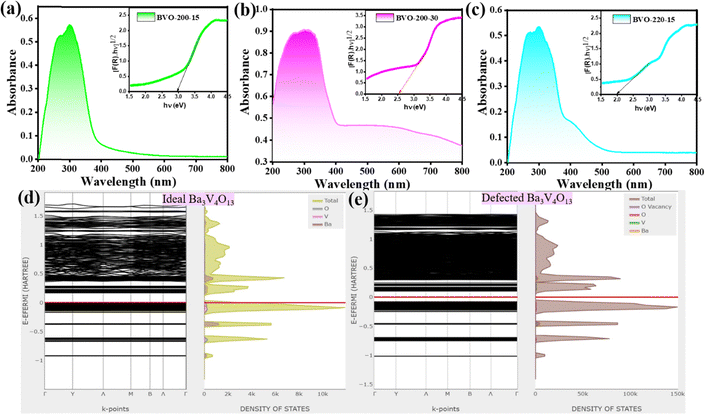
The absorption observed at the 200–500 nm spectral region is due to charge transfer and transition of electrons from O2− to V5+ in VO43−. There is a slight red shift at the 300 nm peak, accompanied by the emergence of a shoulder at 400 nm and beyond with an increase in reaction temperature and time, enabled by the defects, Fig. 4(a)–(c). There is a decrease in the optical band gap value from 3.0 eV (BVO-200-15) to 2.5 eV (BVO-200-30) and 2.0 (BVO-220-15) with an increase in oxygen vacancy concentration, Fig. 4(a)–(c).47,54 Furthermore, to understand the photophysical properties of the synthesized Ba3V4O13, the electronic structures were computed by first-principles calculations, resulting in the energy band diagram, Fig. 4(d) and (e). The highest valence band 0Eh (0 eV) and the lowest conduction band 0.143 Eh (3.9 eV) points for the non-defected ideal crystal of Ba3V4O13 are shown in Fig. 4(d). There is a decrease in the bandgap value compared to that of the ideal non-defected crystal observed in the synthesized samples, which corroborates with the creation of defects. Moreover, the broader peaks observed in the experimental XRD and Raman data, unlike the single line observed for the defect-free one, indicate the presence of defects in the synthesized phosphor.Furthermore, the defects as confirmed by XPS and EPR investigations, have introduced energy level modulation while deducing the optical band gap, band position, and density of state (DOS) by theoretical simulations. The detailed analysis exhibits the rearrangement in the band structure shown upon oxygen vacancy creation, Fig. 4(e). The origin of the optical band gap from the Fermi energy (0 eV) to the lowest CB can be comprehended by partial DOS analysis and corroborates with the experimental findings (Eg ∼ 2.5 eV for BVO-200-30). The electronic states (HOMO) overlapping with the Fermi energy mainly comprise O2p and a small amount of Ba3p states. Whereas, the bottom of the CB consists primarily of V3d states mixed with traces of O2p states. This implies the band gap transition, O2p → V3d transition in Ba3V4O13. In other words, the energy states in the lowest forbidden bands are mainly due to VO43− groups. While Ba atoms do not contribute to these states or the electronic orbitals within Ba(2)O8 and Ba(1)O11 groups and are rather localized.
2.4. Evaluation of the emission phenomenon in the synthesized single-phase phosphors
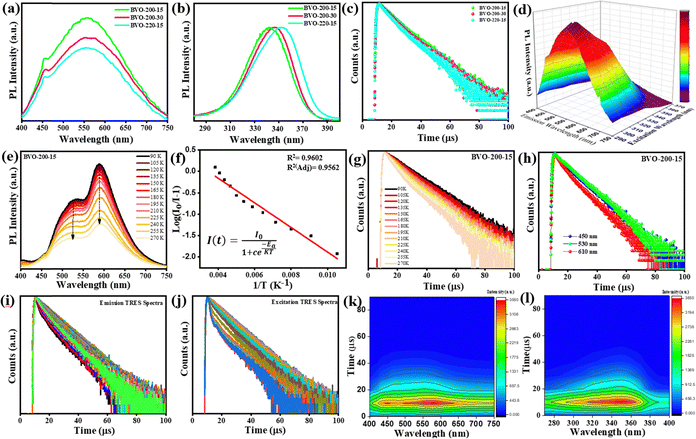
The optimized phosphor BVO-200-15 displays a broad emission (400–750 nm) upon excitation at 350 nm, a large full width at half-maximum (FWHM) of 212 nm, and Stokes shift of ∼202 nm, resulting from the charge transfer emission within the VO43− tetrahedral unit, Fig. 5(a). The FWHM, or in other words, the emission spectral range, increases with the increase in microwave temperature and reaction time, owing to the increasing oxygen vacancies. It is known that the ground state of the tetrahedral VO43− moiety in Ba3V4O13 comprises the V5+ state with no electron in its d-orbital. Hence, it acts as an acceptor, and the connected O2− ion in the tetrahedral structure serves as an electron donor eventually leading to ligand-to-metal-type charge transfer.The Ba3V4O13 exists in a twisted U shape, where 3 oxygens are shared by four VO43− tetrahedral moieties forming a polyanionic [V4O13] structure. It comprises 3T1, 3T2, 1T1, and 1T2 as excited energy states and 1A1 ground energy states. The broad excitation band starting from 280 to 400 nm is spin-allowed 1A1 to 1T1 and 1T2 transition, whereas transitions to 3T1 and 3T2 are spin-forbidden, Fig. 5(b).26,39,40,54 Moreover, upon distortion of the tetrahedral structure, the emission from these spin-forbidden states arises. The red emission becomes more prominent with increasing oxygen vacancies, which is also apparent from the change in average lifetime (τavg), Fig. 5(c).54 The change in the excitation wavelengths from 290 to 370 nm leads to a red shift in the broadband emission, Fig. 5(d).54 Similarly, the red shift in the excitation bands is observed with a change in emission maxima and is tunable with the change in the defect concentration and excitation wavelength.
The optimized BVO-200-15 phosphor exhibits the maximum PL quantum efficiency (PLQE) of 24.3%, τavg of the order of 6.35 μs, which decreases with increasing defect concentration to (20.1 and 16.7%) and (5.37 and 4.62 μs), owing to increasing probability of nonradiative transition, (Table 1), as per the following equations55
 | (1) |
| Φ = Kr × τavg | (2) |
| Φ ∝ τavg | (3) |
| Phosphor | τ 1 (μs) | τ 2 (μs) | τ 3 (μs) | τ avg (μs) | K r | K nr | PLQE (%) | ξ a | EQE | CIE |
|---|---|---|---|---|---|---|---|---|---|---|
| BVO-200-15 | 2.07 | 4.26 | 11.02 | 6.35 | 0.038 | 0.119 | 24.3 | 81.1 | 19.7 | (0.333, 0.368) |
| BVO-200-30 | 1.89 | 4.43 | 9.90 | 5.37 | 0.037 | 0.149 | 20.1 | 78.0 | 16.1 | (0.351, 0.372) |
| BVO-220-15 | 1.57 | 4.32 | 7.09 | 4.62 | 0.036 | 0.180 | 16.7 | 69.4 | 11.6 | (0.358, 0.393) |
To underpin the underlying mechanism of the emission, the temperature-dependent PL spectra were recorded both at high temperatures (298–737 K) and low (cryoscopic) temperatures (80–273 K). The two intense emission bands (600 nm, 530 nm) can be seen at low cryoscopic temperatures (90–270 K), and a weak emission band (450 nm) due to electron–phonon coupling and defect (oxygen vacancy) formation, Fig. 5(e). The cryo measurements imply higher concentrations of electrons populated in the lower energy state. A more obvious blueshift of emission also reflects the stronger electron–phonon coupling due to the favored probability of high energy relaxation pathways upon increasing temperature. There is also a quenching of emission with increasing temperature. Electrons in the excited state T1, which are initially excited from the ground state 1A1, undergo relaxation to the T3 state. Subsequently, they relax back to the ground state A1. However, as the temperature increases, the electrons are elevated to the crossover point between the ground state (A1) and the excited state (T1). Consequently, the emission is quenched with a temperature rise, as the electrons are relaxed through a non-radiative relaxation process, where energy is transferred from the phonon mode to the ground state. From the Arrhenius plot, the value of activation energy of quenching calculated is 0.22 eV for the optimized BVO-200-15 phosphor, Fig. 5(f).
There is a remarkable change in the τavg of the optimized phosphor from 9.19 to 6.46 μs with the temperature rising from 90 K to 270 K, Fig. 5(g). This phenomenon can be attributed to the temperature dependence of the spin-forbidden and spin-orbital allowed transitions, which occur between the thermally-coupled VO, 3T1, and 3T2 levels, respectively, to the 1A1 ground level. At low temperatures, the electrons mainly populate the VO level, and 3T1, giving rise to the two-lifetime components (τ1 and τ2) and in agreement with the cryo emission spectra. The bi-exponential fitting of the decay at low temperatures implies the presence of two dominant populated excited states. With decreasing temperature, the nonradiative processes are effectively suppressed, eventually making energy transfer more efficient, and thus higher τavg value is observed. Whereas, with an increase in temperature to RT (298 K), the 3T2 level is populated, which gives rise to an additional small energy gap (ΔE) between 3T2 and 3T2, and eventually to three-lifetime components. There is a remarkable decrease in the lifetime components and τavg (6.35 μs) due to the activation of non-radiative relaxations at RT or higher temperatures.34,36 At room temperatures also, a substantial decrease in PL lifetime occurs due to the cross-over of the excited electrons to the crossover point, which favors non-radiative relaxation as explained before. It is worth noting that with the increase in temperature, the green emission band becomes more intense, and the red emission band intensity decreases. In contrast, the blue emission band emerges at RT, and a similar trend is followed by the corresponding τ values, Table 2. It is further confirmed by the highest τavg (10.2 μs), intermediate τavg (4.8 μs), and low τavg (2.7 μs) corresponding to blue (450 nm), green (530 nm), and red (600 nm) emission bands, respectively, as observed in the emission dependent lifetime studies, Fig. 5(h).
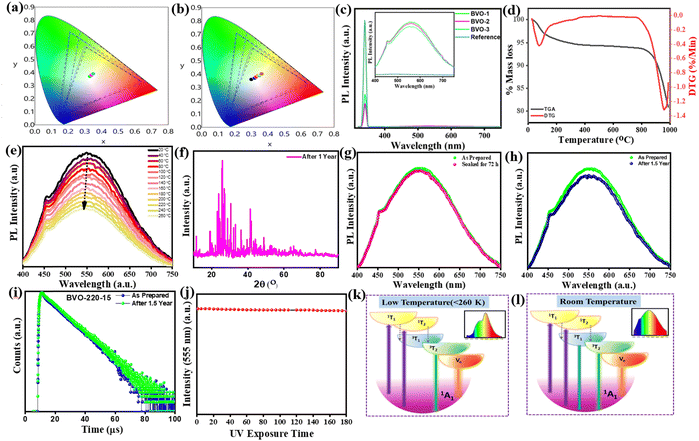
Furthermore, the TRES of BVO-200-15 was measured at λex = 350 nm to understand the emission phenomenon in detail. Fig. 5(i) and (j) show a 2D contour map of normalized TRES in the range of 9.9–89.95 μs, revealing a constant decrease in FWHM of the excitation spectra with the increment of the decay time due to the dominant defect level excitation in the excitation TRES spectra. The series of normalized sliced spectra reveals the existence of the same type of luminescence centers (Fig. 5(k) and (l)). Hence, the TRES sliced emission spectra and excitation spectra further confirm the underlying mechanism of white light emission in the phosphors. A plausible mechanism based upon the discussed experimental evidence as well as theoretical studies is depicted in Fig. 6(k) and (l).
The Commission Internationale de L’Eclairage (CIE) coordinates were also calculated and are tunable from white (0.333, 0.368) to yellow-white (0.351, 0.372) by changing the reaction duration and to yellow-white (0.358, 0.393) by increasing the reaction temperature via instigating extensive oxygen vacancies, Fig. 6(a) and (b). This is because of the fact that the VO emission contributes more, owing to increasing oxygen vacancy concentration, which governs the relative intensity of the other two recombination channels. The detailed CIE coordinates, PLQE, photon absorption efficiency, and external quantum efficiency (EQE) of BVO-200-15, BVO-200-30, and BVO-220-15 are summarised in Table 1. The physical mapping of the phosphors under different excitation energies reflects their emission tunability, as revealed by the shift in CIE values in Table S4 (ESI†). It is evident from these results that the three emitting centers can be tuned by changing the excitation wavelength or controlling the distortion of the lattice by altering the reaction temperature and time and exhibiting the potential of the synthesized phosphors for white light emission applications. The synthesized phosphors also show high absorption efficiency (ξa) and external quantum efficiencies (EQE), as shown in Table 1, calculated using the following equations.
 | (4) |
| ηext = ηint × ξa | (5) |
 | (6) |
2.5. Stability of the synthesised phosphors
To evaluate the potential of optimized phosphors BVO-200-15 as down-conversion phosphors for W-LEDs, the stability was examined as a function of temperature, exposure to moisture, and aging. The thermogravimetric – differential thermogravimetric (TG-DTG) curves of BVO-200-15 show that the sample remains thermally stable up to 850 °C (Fig. 6(d)), suggesting much better stability than that of other reported vanadate-based phosphors. The photoluminescence spectra of BVO-200-15 measured at high-temperature exhibit a gradual decrease in the emission intensity with increasing temperature from 273 to 737 K, up to 13.7% at 373 K and 34% at 473 K, and 68% at 737 K with a small change in CIE coordinates, Fig. 6(e), Table S5 (ESI†). Furthermore, such a decrease in the emission is recoverable upon cooling the phosphor to room temperature, implying excellent emission stability of the phosphor. Furthermore, even after 10 heating/cooling cycles, there is no significant change in emission. Also, the BVO-200-15 possesses excellent chemical stability, as no change in emission and structure is observed after 18 months while storing it under ambient conditions and even after soaking it in water for 90 days (Fig. 6(f)–(i)). Furthermore, the BVO-200-15 phosphor was irradiated continuously by UV light for 3 h, and the emission intensity was sustained, confirming its photostability, Fig. 6(j). These findings exhibit good stability of the optimized phosphor.2.6. Fabrication of the white light emitting prototype and emission characteristics
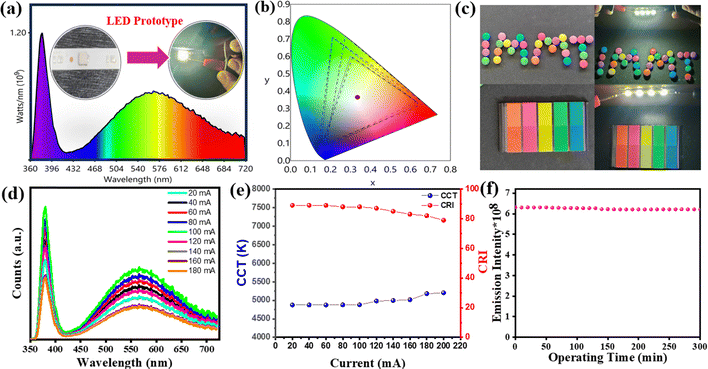
To demonstrate the potential application of BVO-200-15 as a single-phosphor-based intrinsic white light emitting W-LED, the synthesized phosphor was mixed with equimolar mass ratio with a 1![[thin space (1/6-em)]](https://www.rsc.org/images/entities/char_2009.gif) :
:![[thin space (1/6-em)]](https://www.rsc.org/images/entities/char_2009.gif) 1 ratio of silicone A and silicone B and subsequently cured on a commercial 350 nm UV chip at 150 °C for 4 h to make a W-LED prototype. The emission spectrum of the W-LED prototype operated at 20 mA, and the inset displaying the working W-LED prototype showcases vivid white light emission with CIE coordinates of (0.334, 0.370), as seen in Fig. 7(a) and (b). The BVO-200-15 W-LED prototype shows a remarkable CRI of 86.1 with excellent color resolution and color quality, in which the objects are much more vivid and realistic. Fig. 7(c) illustrates the emission spectra of the W-LED prototype across different current levels, and a consistent increase in emission intensity is observed up to 100 mA. This is due to effective charge recombination that enables a greater number of photons to emit through efficient input of exciting photons from the UV-LED. This process results in more luminous white light emission, although a decrease in the emission intensity above this current level is observed owing to the drooping effect, Fig. 7(d). Additionally, the variation in CRI and CCT at different currents is observed, Fig. 7(e). There is no change in the emission intensity of the W-LED even after 48 h of continuous operation, Fig. 7(f). The luminous efficacy refers to the brightness of the prototype calculated per watt of energy sources. When the applied current is increased, a little change in CIE, CRI, CCT, and luminous efficacy (LE) is observed, as summarised in Table 3. The fabricated W-LED exhibits an increasing trend in luminous efficacy (LE) up to 100 mA. Such enhancement is attributed to the effective recombination of electrons and holes that facilitate charge transfer and emission related to oxygen vacancies, which eventually results in enhanced photon flux. However, above 100 mA, the luminous efficacy (LE) starts decreasing owing to thermal effects associated with the drooping effect. In other words, the internal temperature rises with increasing current, which eventually causes transient instability in the phosphor.39,56 It is noteworthy that this value is better than that of the ever-reported vanadate W-LEDs (Table S6, ESI†). These findings provide insight into the origin of white light emission as well as an energy-efficient synthesis approach of a stable single-phase white light phosphor using microwave radiation, and also the potential of the optimized BVO-200-15 phosphor to develop W-LED prototypes.
1 ratio of silicone A and silicone B and subsequently cured on a commercial 350 nm UV chip at 150 °C for 4 h to make a W-LED prototype. The emission spectrum of the W-LED prototype operated at 20 mA, and the inset displaying the working W-LED prototype showcases vivid white light emission with CIE coordinates of (0.334, 0.370), as seen in Fig. 7(a) and (b). The BVO-200-15 W-LED prototype shows a remarkable CRI of 86.1 with excellent color resolution and color quality, in which the objects are much more vivid and realistic. Fig. 7(c) illustrates the emission spectra of the W-LED prototype across different current levels, and a consistent increase in emission intensity is observed up to 100 mA. This is due to effective charge recombination that enables a greater number of photons to emit through efficient input of exciting photons from the UV-LED. This process results in more luminous white light emission, although a decrease in the emission intensity above this current level is observed owing to the drooping effect, Fig. 7(d). Additionally, the variation in CRI and CCT at different currents is observed, Fig. 7(e). There is no change in the emission intensity of the W-LED even after 48 h of continuous operation, Fig. 7(f). The luminous efficacy refers to the brightness of the prototype calculated per watt of energy sources. When the applied current is increased, a little change in CIE, CRI, CCT, and luminous efficacy (LE) is observed, as summarised in Table 3. The fabricated W-LED exhibits an increasing trend in luminous efficacy (LE) up to 100 mA. Such enhancement is attributed to the effective recombination of electrons and holes that facilitate charge transfer and emission related to oxygen vacancies, which eventually results in enhanced photon flux. However, above 100 mA, the luminous efficacy (LE) starts decreasing owing to thermal effects associated with the drooping effect. In other words, the internal temperature rises with increasing current, which eventually causes transient instability in the phosphor.39,56 It is noteworthy that this value is better than that of the ever-reported vanadate W-LEDs (Table S6, ESI†). These findings provide insight into the origin of white light emission as well as an energy-efficient synthesis approach of a stable single-phase white light phosphor using microwave radiation, and also the potential of the optimized BVO-200-15 phosphor to develop W-LED prototypes.
| Current (mA) | CIE | CCT (K) | CRI | LE (lm W−1) |
|---|---|---|---|---|
| 20 | (0.334, 0.370) | 5563 | 84.5 | 107.9 |
| 40 | (0.331, 0.368) | 5673 | 85.3 | 113.1 |
| 60 | (0.330, 0.366) | 5710 | 85.7 | 117.2 |
| 80 | (0.329, 0.364) | 5747 | 85.8 | 126.5 |
| 100 | (0.323, 0.361) | 5998 | 86.1 | 128.4 |
| 120 | (0.319, 0.358) | 6177 | 84.0 | 99.7 |
| 140 | (0.313, 0.352) | 6471 | 83.4 | 87.1 |
| 160 | (0.310, 0.346) | 6642 | 82.2 | 81.9 |
| 180 | (0.306, 0.341) | 6883 | 81.3 | 78.0 |
3. Conclusion
The single-phase vanadate phosphors with high CRI, high luminous efficacy, stability and bright white light emission were synthesized by tailoring the microwave reaction time and temperature. The new stoichiometric phase pure Ba3V4O13 phosphor forms at the optimized temperature of 200 °C in 15 min of microwave synthesis. Further variation in the reaction time, temperature, and pressure leads to the formation of commonly known stoichiometries Ba3V3O7 and Ba2V2O6 of vanadate phosphors. Morphological changes are observed, transitioning from a rod-shape optimized phosphor to sheet-like with increased reaction time (15 to 30 min) and finally to spherical shape (∼50 ± 5 nm) upon varying temperatures from 200 to 220 °C. The detailed XPS and EPR investigation reveals the creation of extensive oxygen vacancies evidenced by the appearance of the V4+ state, which arises from the reduction of V5+ in the optimized phosphor, implying the creation of oxygen vacancies in the lattice. The first-principles calculations, XRD, XPS, and Raman, reveal the rearrangement in the band structure upon oxygen vacancy creation and narrowing of the valence band maxima and conduction band minima as compared to that of the non-defected Ba3V4O13 crystal. The theoretical and extensive photoluminescence investigations confirm the triple-band emission originating from the radiative recombination of charge transfer spectra in the VO43− unit and oxygen vacancy. The red-emitting centers can be tuned by altering the oxygen vacancy by tuning the synthesis conditions to balance their emission proportion for white light generation. The optimized BVO-200-15 exhibits a high-quality (vivid) white light with CIE (0.333, 0.368), PLQY of 24.3%, and EQE of 19.7%. Moreover, cryo-photoluminescence emission studies establish the mechanism of the observed triple-band emission at room temperature and dominating two emission bands (v) at low temperatures, which is further supported by the lifetime data. TRES excitation and emission spectra also corroborate with the emission band structure analyzed by slicing the lifetime data. The down-conversion W-LED prototype fabricated demonstrates a CCT of 5998 K, CRI of 86.1, and LE of 128.4 lm W−1, better than that of the reported single phosphor-based W-LEDs, and the phosphor exhibits excellent stability, under ambient conditions, UV light, and at high temperature. These results provide a clue to synthesize a stable single-phase white light emitting phosphor by a rapid and energy-efficient synthesis approach based on microwave radiation, and insight into the origin of white light emission. These findings offer impetus to design new single phosphors, to instigate red emission via the creation of controlled defects, and to develop white-light-emitting phosphors and W-LED prototypes for next-generation lighting technologies.Author contributions
AKD: experimentation – investigation; formal analysis, methodology, validation, theoretical simulation-investigation, and writing – first draft; MKS: theoretical simulation-investigation; RK: experimentation – investigation; and writing – first draft; YSC: conceptualization, resources, supervision, validation, writing – review & editing.Data availability
The data is included in the manuscript and the ESI.†Conflicts of interest
We declare no conflict of interest.Acknowledgements
The authors are thankful to CSIR for financial assistance. AKD thanks CSIR-NET for SRF, and RK thanks UGC-NET for SRF.References
- J. Cho, J. H. Park, J. K. Kim and E. F. Schubert, Laser Photonics Rev., 2017, 11, 1600147 CrossRef.
- S. K. Behera, R. Kainda, S. Basu and Y. S. Chaudhary, Appl. Mater. Today, 2022, 27, 101407 CrossRef.
- M. Zhao, H. Liao and M. S. Molokeev, Light: Sci. Appl., 2019, 8, 38 CrossRef PubMed.
- G. Tosini, I. Ferguson and K. Tsubota, Mol. Vision, 2016, 22, 61–72 CAS.
- M. Amachraa, S. Li, P. Y. Huang, R. S. Liu, Z. Wang, R. J. Xie and S. P. Ong, Chem. Mater., 2022, 34, 4039–4049 CrossRef CAS.
- A. K. Dehury, S. K. Behera, S. K. Chirauri, S. Basu and Y. S. Chaudhary, Chem. – Asian J., 2022, 17, e202200948 CrossRef CAS PubMed.
- S. K. Behera, R. Kainda, A. K. Dehury and Y. S. Chaudhary, J. Lumin., 2024, 269, 120546 CrossRef.
- G. J. Hoerder, M. Seibald and D. Baumann, Nat. Commun., 2019, 10, 1824 CrossRef.
- Y. Takahashi, K. Iwasaki and T. Fujiwara, Phys. Status Solidi C, 2012, 9, 2336–2339 CrossRef CAS.
- X. Min, Z. Huang, M. Fang, Y. Liu, C. Tang and X. Wu, Nanosci. Nanotechnol., 2016, 16, 3684–3689 CAS.
- S. Li, Y. Xia, M. Amachraa, N. Tuan, H. Zhenbin, W. Shyue, P. Ong and R. J. Xie, Chem. Mater., 2019, 31, 6286–6294 CrossRef CAS.
- J. Y. Park, J. W. Chung and H. K. Yang, Optik, 2018, 155, 384–389 CrossRef CAS.
- C. C. Lin, Z. R. Xiao, G. Y. Guo, T. S. Chan and R. S. Liu, J. Am. Chem. Soc., 2010, 132, 3020–3028 CrossRef CAS PubMed.
- L. Bharat, S. K. Jeon, K. Krishna and J. S. Yu, Sci. Rep., 2017, 7, 42348 CrossRef CAS.
- H. Guo, J. Zhang, L. Ma, J. L. Chavez, L. Yin, H. Gao, Z. Tang and W. Chen, Adv. Funct. Mater., 2015, 25, 6833–6838 CrossRef CAS.
- N. T. K. Chi, N. T. Tuan, N. T. K. Lien and H. Nguyen, J. Electron. Mater., 2018, 10, 1–8 Search PubMed.
- J. X. Hu, T. H. Huang, Y. P. Zhang, B. Lu, H. Q. Ye, B. J. Chen, H. P. Xia and C. Y. Ji, Dalton Trans., 2019, 48, 2455–2466 RSC.
- H. Yin, Q. Kong, R. Zhang, D. Zheng, B. Yang and K. Han, Sci. China Mater., 2021, 64, 2667–2674 CrossRef CAS.
- H. Xu, X. Dong, Z. Zhang, L. Huang, H. Zeng, Z. Lin and G. Zou, J. Mater. Chem. C, 2022, 10, 13844–13850 RSC.
- R. Babu, I. López-Fernández, S. Prasanthkumar and L. Polavarapu, ACS Appl. Mater. Interfaces, 2023, 15, 35206–35215 CrossRef CAS.
- V. Drushliak, K. J. Kapcia and M. Szafrański, J. Mater. Chem. C, 2024, 12, 4360–4368 RSC.
- K. Alwar, M. Rajaram, L. Harikrishnan, A. Natarajan and A. Rajaram, Ceram. Int., 2024, 25, 21429–21438 CrossRef.
- Y. Lin, Y. Zhong, Y. Lin, L. Pang, Z. Zhang, Y. Zhao, X. Y. Huang and K. Z. Du, Front. Optoelectron., 2024, 17, 6 CrossRef PubMed.
- D. Zhao, Y. Liu, Y. Han, X. Chen, M. Jia, J. Zhang, L. Lian, D. Wu, X. Li and Z. Shi, J. Lumin., 2024, 270, 120548 CrossRef CAS.
- S. Ghosh, D. Sarkar, S. Bastia and Y. S. Chaudhary, Nanoscale, 2023, 15, 10939–10974 RSC.
- T. Nakajima, M. Isobe, T. Tsuchiya, Y. Ueda and T. Kumagai, J. Lumin., 2009, 129, 1598–1601 CrossRef CAS.
- T. Nakajima, M. Isobe, T. Tsuchiya, Y. Ueda and T. Manabe, J. Phys. Chem. C, 2010, 114, 5160–5167 CrossRef CAS.
- T. Nakajima, K. Shinoda and T. Tsuchiya, RSC Adv., 2014, 4, 19165–19171 RSC.
- N. V. Bharathi, T. Jeyakumarana, S. Ramaswamy and S. S. Jayabalakrishnan, Mater. Res. Express, 2019, 6, 106202 CrossRef CAS.
- K. C. Park and S. Mho, J. Lumin., 2007, 122, 95–98 CrossRef.
- J. M. Millet, H. S. Parker and R. S. Roth, J. Am. Ceram. Soc., 1986, 69, 103–105 Search PubMed.
- S. E. Kalathil, U. A. Neelakantan and R. Ratheesh, J. Am. Ceram. Soc., 2014, 97, 1530–1533 CrossRef CAS.
- A. Sharma, M. Varshney, K. H. Chae and S. O. Won, RSC Adv., 2018, 8, 26423 RSC.
- M. M. Teixeira, Y. G. Gobato, L. Gracia, L. F. da Silva, W. Avansi Jr, M. Assis, R. C. de Oliveira, G. A. Prando, J. Andrés and E. Longo, J. Lumin., 2020, 220, 116990 CrossRef CAS.
- R. Yu, N. Xue, S. Huo, J. Li and J. Wang, RSC Adv., 2015, 5, 63502–63512 RSC.
- M. M. Teixeira, A. F. Gouveia, A. G. de Sousa, L. Fernando da Silva, R. Cristina de Oliveira, M. A. San-Miguel, M. S. Li and E. Longo, J. Phys. Chem. C, 2020, 124, 14446–14458 CrossRef CAS.
- Y. Huang, Y. M. Yu, T. Tsuboi and H. J. Seo, Opt. Express, 2012, 20, 4360–4368 CrossRef CAS.
- N. Tomohiko, I. Masahiko, U. Yuko and T. Tetsuo, J. Mater. Chem. C, 2015, 3, 10748–10754 RSC.
- E. Pavitra, R. G. Rama, L. K. Bharat, J. Y. Park, C. H. Kwak, J. W. Chung, Y. K. Han and Y. S. Huh, J. Mater. Chem. C, 2018, 6, 12746–12757 RSC.
- J. Zhou, J. X. J. Huang, J. J. Xu, H. Chena and Y. Wang, J. Mater. Chem. C, 2015, 3, 3023 RSC.
- J. Sun, W. Wang and Q. Yue, Materials, 2016, 9, 231 CrossRef.
- G. L. Kabongo, T. N. Y. Khawula, T. Thokozani, E. G. Nyongombe, K. Ozoemena and S. Dhlamini, J. Nanosci. Curr. Res., 2018, 3, 1000125 Search PubMed.
- S. Sreevalsa, P. A. Parvathy, S. K. Sahoo and S. Das, J. Alloys Compd., 2021, 880, 160483 CrossRef CAS.
- S. Lambora and A. Bhardwaj, ACS Omega, 2023, 8, 27725–27731 CrossRef CAS PubMed.
- P. Szterner and M. Biernat, J. Therm. Anal. Calorim., 2022, 147, 13059–13071 CrossRef CAS.
- L. K. Bharat, G. Nagaraju and J. S. Yu, Sens. Actuators, B, 2018, 271, 164–173 CrossRef CAS.
- B. Mishra, S. Mishra, B. Satpati and Y. S. Chaudhary, ChemSusChem, 2019, 12, 3383–3389 CrossRef CAS.
- S. P. Shreyas, G. Mukut, I. M. Nagpure, O. M. Ntwaeaborwa, C. B. B. Barend and H. C. Swart, Phys. B, 2012, 407, 1485 CrossRef.
- V. Agarwal and H. Metiu, J. Phys. Chem. C, 2016, 120, 2320 CrossRef CAS.
- F. Parrino, F. R. Pomilla, G. Camera-Roda, V. Loddo and L. Palmisano, Met. Oxides, 2021, 13, 6–13 Search PubMed.
- W. G. Menezes, D. M. Reis, M. M. Oliveira, J. F. Soares and A. J. G. Zarbin, Chem. Phys. Lett., 2007, 445, 293–296 CrossRef CAS.
- C. Drouilly, J. M. Krafft, F. Averseng, S. Casale, D. Bazer-Bachi, C. Chizallet, V. Lecocq, H. Vezin, Y. Lauron-Pernot and G. Costentin, J. Phys. Chem. C, 2012, 116, 21297–21307 CrossRef CAS.
- K. Baek, S. Y. Lee, K. S. G. Doh and J. K. Hyun, J. Mater. Chem. C, 2018, 6, 9749–9755 RSC.
- A. K. Dehury, R. Kainda and Y. S. Chaudhary, Inorg. Chem., 2023, 62, 17163–17181 CrossRef CAS.
- Y. Chen, J. Chen, J. Liang, J. He, Z. Q. Liu and Y. Yin, Chem. Mater., 2020, 32, 9551–9559 CrossRef CAS.
- H. Guo, J. Zhang, L. Ma, J. L. Chavez, L. Yin, H. Gao, Z. Tang and W. Chen, Adv. Funct. Mater., 2015, 25, 6833–6838 CrossRef CAS.
Footnote |
| † Electronic supplementary information (ESI) available: The synthesis details, W-LED fabrication, characterization, unit cell parameters, Rietveld refinement data, photophysical data (CIE at different excitation and temperature), a comparison table of the current state of the art with our phosphor, and the figure depicting the synthesis route of the phosphors, EDAX, electron mapping, and XPS are provided in the ESI. See DOI: https://doi.org/10.1039/d4tc03716b |
| This journal is © The Royal Society of Chemistry 2024 |

