 Open Access Article
Creative Commons Attribution 3.0 Unported Licence
Life cycle assessment, quo vadis? Supporting or deterring greenwashing? A survey of practitioners†
Miguel
Brandão
 *a,
Pablo
Busch
b and
Alissa
Kendall
c
aDepartment of Sustainable Development, Environmental Science and Engineering, KTH Royal Institute of Technology, Stockholm, Sweden. E-mail: miguel.brandao@abe.kth.se
bEnergy and Efficiency Institute, University of California Davis, 1605 Tilia St #100, Davis, CA 95616, USA
cDepartment of Civil and Environmental Engineering, University of California Davis, 1 Shields Ave, Davis, CA 95616, USA
First published on 20th December 2023
Abstract
Life cycle assessment (LCA) has been recognised as an important environmental systems analysis tool due to its potential for providing systematic results about the environmental impacts of alternative production and consumption systems that can lead to decisions towards greater sustainability in both private and public-policy contexts. However, LCA has been under increased scrutiny due to the wide range of published results on similar systems, such as biofuels, which can be contrasting. This variability is, in part, due to the proliferation of guidelines that have emerged over the last 20 years, which may undermine the perceived robustness of LCA as a decision-support tool. Following some interesting discussions on this topic in different fora, we took the pulse of the LCA community via a survey. We received 124 responses from respondents who varied in their background and experience in LCA (most were academics and/or had more than 10 years' experience), as well as in their opinions on whether they saw the inconsistency of published results problematic, or not, for decision making. Results suggest that respondents are of the opinion that (i) there is no single right way of performing LCA; (ii) the ISO 14040-44 standards were failing in their guiding of LCA practice, and that (iii) further efforts in harmonizing LCA practice would be beneficial, despite mixed opinions shown by respondents, which indicates the divisive nature of this topic in the LCA community. For example, there was no clear agreement on whether the significant flexibility with which practitioners perform LCA undermines its validity as a robust tool for decision making, though practitioners concerned with greenwashing were unified in the need for improved guidelines and harmonisation. Further harmonisation would help to ensure consistency in the application of the tool by practitioners which, in turn, would ensure results would be less variable, arguably more meaningful, and less prone to greenwashing. It is likely that methodological issues will remain unresolved in the near future, as some practitioners value the flexibility with which the ISO standards can be applied, even if that leads to inconsistent results. We recommended tighter standardization.
Environmental significanceGiven the need to assess the environmental impacts of products and services in a scientifically-robust manner, it is important that existing protocols are harmonized and standardized, so that any variability in the results does not stem from subjective methodological choices made by the practitioner that can lead to unsupported environmental claims and greenwashing. We took the pulse of the Life Cycle Assessment community to see if this was regarded as a real issue that the community needs to grapple with in order for their work to support the right decisions towards sustainable production and consumption systems. We found that there is a wide range of key issues where consensus is yet to be reached. |
Introduction
Life cycle assessment (LCA) has been recognized as an important environmental systems analysis tool due to its potential for providing holistic and systematically-derived results about the environmental impacts of alternative production and consumption systems, which can support decisions towards greater sustainability in both private and public policy contexts. However, LCAs of the same product system can lead to a wide range of results. LCAs of biofuels epitomize this problem, with considerable ranges in estimates of similar or nearly identical biofuel pathways [e.g. ref. 1–4]. This variability is, to a great extent, due to the diverse way in which LCA is applied, enabled in part by the proliferation of various guidelines that have emerged over the last 20 years, but also differences in models and databases used. Disentangling the sources of variability is made all the more difficult by the existence of multiple standards and guidelines recommending different protocols, which have undermined confidence in LCA as a decision-support tool.5–10Clearly, the ISO 14040 series standards are the most cited among LCA practitioners.11,12 However, these standards provide broad guidance on LCA practice, which ultimately allows for significant flexibility in the practice of LCA. The ISO standards conceive of LCA in four steps; goal and scope definition, life cycle inventory (LCI) analysis, life cycle impact assessment (LCIA), and interpretation. Differences in LCA practice (e.g. the methodological choices made) very often stem from, and start with, the first step (goal and scope definition) which determines key decisions such as whether an attributional or consequential approach is taken and thereby how co-production is handled,13 which in turn determines the delimitation of the system boundary.14 LCIA characterization models are also selected during this step, and can lead to even more variability in results,15 since impact assessment models determine the category indicators used to represent impacts and the cause-effect chains used to determine those indicators.
While the ISO standards apply on a global level, parallel initiatives have taken place at a continental level. In order to further standardise/harmonise LCA practice, such as the Product Environmental Footprint (PEF) methodology,16 developed and promoted by the European Commission, and the Environmental Product Declaration (EPD),17 both providing guidelines and rules for calculating the environmental impact of products.
The PEF method was last updated in December 2022. Seen as more complete than the ISO standards, there is growing interest from many parties that LCA studies be performed according to PEF standards. EPDs are calculated based on the specific Product Category Rules (PCRs)18 that exist for each of the current 198 product categories.
However, several issues with the PEF method have been reported in the literature [e.g. ref. 10 and 19], which are subject to criticism. These include:
- Lack of consistency in rules across different product categories. Separate rules, known as PEF Category Rules (PEFCRs), exist for each product category (e.g. DDGS fed to pigs calculated with the PEFCR of beer and with the PEFCR of feed19), which limits the relevance of results for comparisons and creates conflicts with international rules.
- Lack of harmonization with international standards, which can lead to misleading claims and litigation.
- Burdensome and unnecessary requirements, such as having to include all 16 impact categories.
- Arbitrary setting of system boundaries, thereby excluding relevant flows in the reference system, e.g. carbon sequestration via photosynthesis; emissions from by-products that would have taken place regardless of their recovery and use; and renewable electricity credits where no additional renewable electricity is produced (essentially giving credits for activities that are not additional); and.
- Accounting rules that are counterproductive, i.e. favouring the alternatives with the worst climate and water impacts, in the case of biofuels2,3 and food,20 respectively.
With EPDs, several inconsistencies have also been reported, including treatment of biogenic carbon, end-of life stage, allocation and electricity modelling.21
One consequence of the variability in LCA results brought about by the variety of standards and guidelines available is the opportunity for choosing specific estimates within a broad range that a priori support a certain product alternative in detriment to another, and thereby facilitates greenwashing. Greenwashing is where misleading, biased or false information on environmental performance is used to promote companies and their products. It misinforms producers and/or consumers on which production and purchasing decisions are best aligned with their goals, and can undermine trust in environmental messaging.
The extent of unsupported environmental claims has led the European Commission to propose a “Green Claims Directive” to deter the communication of erroneous and counterproductive misinformation.22 The European Parliament and Council have reached a provisional agreement on new rules to ban misleading advertisements and provide consumers with better product information. Generic environmental claims will be banned, such as: “environmentally friendly”, “natural”, “biodegradable”, “climate neutral” or “eco”, without proof of recognised excellent environmental performance relevant to the claim. The agreement updates the existing EU list of banned commercial practices and adds to it several problematic marketing habits related to greenwashing and early obsolescence of goods. The aim of the new rules is to protect consumers from misleading practices and help them make better purchasing choices. The proposal requires companies to substantiate claims they make about environmental aspects or performance of their products and organizations using robust, science-based and verifiable methods, LCA among them. The European Union is making progress on banning misleading climate and environmental claims, including carbon neutrality claims based on offsetting. According to a recent press release by the European Parliament,23 “only sustainability labels based on approved certification schemes or established by public authorities will be allowed”. In order to become law, the provisional deal will now have to get the final approval from both the Parliament and the Council, which is expected to take place in November 2023. When the directive comes into force, member states will have 24 months to incorporate the new rules into their law.
The goal of this paper is to characterize the LCA community vis-à-vis their practice and their notions about the capability of LCA as a tool for supporting decisions aimed at more sustainable production and consumption systems. Our hypothesis was that clusters would naturally emerge within the LCA community, along the lines indicated in Table 1. The groups emerge as a result of those whose primary objective is consistency in the application and findings of LCAs, and those who are either comfortable with variability in results or who, for any number of reasons, may value flexibility in how LCA is applied over consistency. In particular, attributional approaches that favour the use of allocation may lead to inconsistent results as there are several attributes of co-products that may be used to calculate an allocation key, to which results are particularly sensitive. Conversely, consequential approaches favour substitution as a way of handling co-production. Here, too, results will be sensitive to the assumption of the exact product that is being displaced.
| Greenwashing: degree of concern over misleading results |
| Role of LCA: value placed in LCA as a tool for supporting decisions or for learning |
| Methodological choices: degree of concern over the inconsistency with which co-production is handled |
| Degree of constraints in standardisation: value placed in consistency vs. flexibility |
| Representativeness of results: value placed in accuracy vs. precision |
| Contrasting results: degree of concern over disparate results |
| Verifiability: value placed in reproducibility of results |
Materials and methods
Following some interesting discussions on this topic in different fora (e.g. SETAC symposia and ISO meetings), we took the pulse of the LCA community on this topic via a survey on Google forms. The survey was sent out to the PRé LCA mailing list on 20th November 2022 and closed on 4th January 2022. Subsequently, results were analysed statistically.The survey consisted of 27 questions/statements over five sections: (i) professional experience, (ii) state of LCA, (iii) respondents' LCA practice, (iv) whether specific methodological choices determine LCA results, and (v) further contact information. All statements present five choices on a scale from “strongly disagree” to “strongly agree”. ESI Appendix A† presents the full survey.
Further from the initial characterisation of respondents vis-à-vis their experience and background, we asked respondents their agreement to 22 statements regarding their perception of LCA robustness, the success or otherwise of ISO standardization, as well as their LCA practice and values implied therein.
In order to statistically analyze survey results, statements were converted to a numerical scale from −2 to 2 (strongly disagree = −2, neutral = 0, and strongly agree = 2). We computed all cross Pearson correlations between the 22 statements, using a 5% threshold to identify statistically-significant correlations. Spearman correlations were also tested, with virtually identical results.
We used the declared preference statements (S12–S13) to classify respondents into groups delineated by their affinity or commitment to attributional LCA approaches. People who agree or strongly agree with the attributional approach, while disagreeing or strongly disagreeing with the consequential approach were classified as “pure attributional practitioners”; and vice versa for “others”, which appears to represent everybody else that uses both practices. We searched for natural clusters in the data using the K-nearest neighbors (KNN) algorithm with a different number of clusters (k = 2, 3 or 5). This method is an unsupervised machine learning algorithm suitable to find natural clusters that arise from the data, without explicitly setting a learning goal.24 We compared the KNN clusters to the declared classification of each respondent to determine if respondent statements form a natural grouping between practitioners' self-declared LCA modeling approach adopted. A correspondence would indicate that both groups have different responses in the survey, related to declared different LCA practices and values, that emerge naturally.
Using the self-declared practitioners' groups, we constructed a logistic regression model to identify which statements were more influential for a respondent to be classified as pure attributional. The logistic model has a binary outcome, where 1 is pure attributional and 0 refers to all other respondents. A logistic regression is more suitable than linear regression when the dependent variable is binary, rather than continuous. The logistic regression coefficients are presented to indicate the change in probability of being classified as a pure attributional practitioner by moving up one position in the agreement scale (e.g. neutral to agree) for each statement. We fit several models to test the robustness of the results: a model with all statements and respondent characteristics, a backwards stepwise regression model to maximize the fit, based on the Akaike information criteria, and a model using our own expert judgment of key statements that should naturally discriminate a pure attributional practitioner relative to the rest of the sample. We present results from our own expert judgment model, as we believe it is the best balance of reducing the number of parameters and including all relevant statements. Other models are presented in the ESI.† We performed the same procedure to test which statements have an influence on concern about disparate results that may lead to greenwashing (S5), classifying as 1 every respondent who agrees or strongly agrees with this statement. We present results from the backward stepwise regression model, including all other models in the ESI.†
Survey results
Professional experience
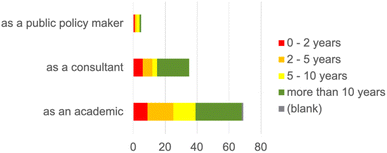
We received 124 responses from respondents who varied in their background (58% were academics and 28% consultants) and experience in LCA (46% had more than 10 years' experience; 18% had 5–10 years; 22% 2–5 years and 15% 0–2 years – see Fig. 1), as well as in their opinions on whether they saw the inconsistency of published results problematic or not for decision making.Level of agreement with key statements reflecting the state of LCA and of its practice
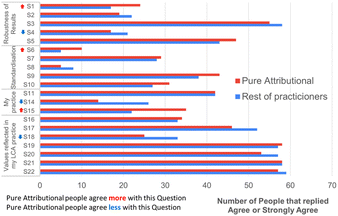
Respondents stated their level of agreement (i.e. strongly agree, agree, neutral, disagree, strongly disagree) with 22 statements on the state of LCA and respondents' modeling practice under four themes: (i) robustness of results, (ii) standardization, (iii) modeling approach adopted, and (iv) values reflected (Fig. 2 and ESI† for the complete set of questions/statements, ESI Fig. S1† shows every LCA practitioner response).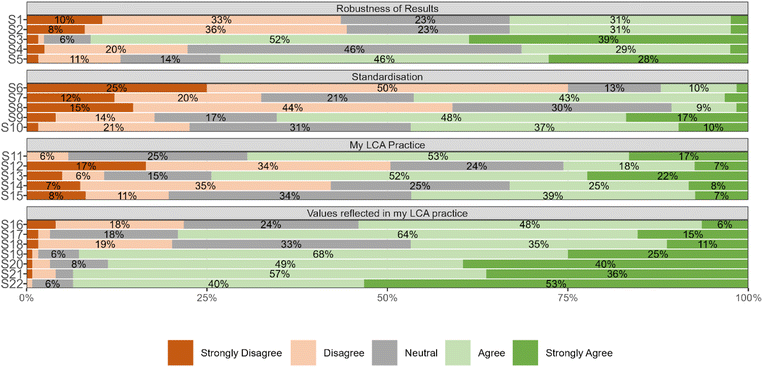 | ||
| Fig. 2 Agreement and disagreement with 22 key statements. Statements are presented in detail in ESI Table S1.† | ||
Methodological choices that determine LCA results
Seven methodological choices were identified as being determinant to LCA results. These are ranked as follows: (i) the way in which co-production is handled, (ii) choices regarding the use of marginal or average data, (iii) system model adopted, (iv) LCI database used, (v) the degree of completeness of the background system, (vi) the degree to which indirect effects are included, and (vii) LCIA characterization models adopted. The last two are ranked equally. Furthermore, the option of “all of the above in (more or less) equal weight” was given, which would rank second on the list above.Statistical analysis
Modeling approach
A key aspect of LCA practice is the modeling approach that the practitioner adopts: consequential or attributional. We isolated the two statements pertaining to the modeling approach adopted: either consequential or attributional (S12 and S13, respectively) and counted the frequency of responses in each category (see Table 2).| Attributional approach | ||||||
|---|---|---|---|---|---|---|
| SD | D | N | A | SA | ||
| a SD: strongly disagree; D: disagree; N: neutral, A: agree, SA: strongly sgree. | ||||||
| Consequential approach | SD | 0 | 0 | 0 | 3 | 17 |
| D | 0 | 0 | 0 | 37 | 4 | |
| N | 1 | 0 | 20 | 9 | 2 | |
| A | 0 | 7 | 1 | 14 | 0 | |
| SA | 5 | 0 | 0 | 0 | 4 | |
It is interesting to note that no respondent rejects either approach (top left quadrant in Table 2), that most practitioners adopt an attributional approach (top-right quadrant in Table 1), and that most consequential LCA practitioners adopt a mixed approach (bottom-right quadrant in Table 1).
Clustering the sample
The identified pure attributional group are the respondents in the top-right quadrant of Table 2, where 61 respondents represent 49% of the sample. Additionally, the KNN algorithm naturally found two clusters among the respondents, one of which clearly agrees with the attributional approach and disagrees with the consequential statement (ESI Fig. S2†).Now that it is possible to differentiate the attributional cluster from the rest of the sample, based on statements S12–S13, we can compare their responses to each statement (Fig. 3). We found that, relative to the rest of the sample, attributional respondents:
- Seemed less concerned with biased results.
- Their studies do not appear to be discrepant to others in the same application.
- Have a greater belief that there is one right way of applying LCA.
- Incur more in allocation.
- Engage more in allocation and.
- Value precision over minimizing uncertainty.
Correlation between statements
When statements are assessed against every other, some patterns can be discerned (Fig. 4 and S3† for Spearman correlation), in the sense of their positive correlation: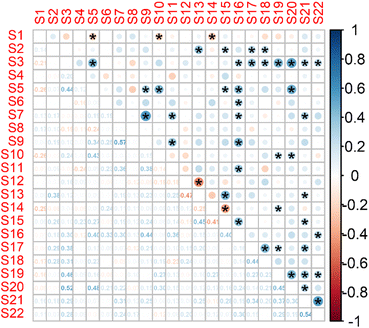 | ||
| Fig. 4 Correlation matrix between all 22 statements. Pearson correlation. Spearman correlation showed similar results (p < 0.05). Conversion scale: strongly disagree = −2; disagree = −1; neutral = 0; agree = 1; strongly agree = 2. Figure was created using the R library “corrplot”.25 | ||
- S7–S9 (0.57): belief that LCA practitioners can agree on a common LCA approach and the belief that greater standardization is necessary.
- S21–S22 (0.54): LCA both as a decision-making and learning tool.
- S3–S20 (0.52), S3–S19 (0.46): belief that LCA results are discrepant because of inconsistency in methodological choices (S3), and their valuing of reproducibility (S20) and (S19) representativeness of results.
- S5–S20 (0.48): discrepancy in results being an issue, and their valuing of reproducibility of results.
- S19–S20 (0.45): respondents value both reproducibility and representativeness in results.
- S9–S16 (0.44): greater standardization and consistency as a value.
- S17–S18 (0.44): respondents who value accurate results over precision, also value minimizing uncertainty over precision.
- S15–S16 (0.40): respondents that handle co-production via allocation value consistency over flexibility.
- S2–S13 (0.38): respondents who believe that differences in results are driven by real-world differences tend to reflect an attributional approach.
In addition, negative correlations were also noted:
- S12–S13 (−0.47): consequential practitioners and attributional practitioners.
- S14–S15 (−0.41): avoiding allocation and engaging in allocation.
- S1–S14 (−0.29), S1–S10 (−0.26), S1–S5 (−0.26): respondents who see biased results as threat (S1) tend to avoid allocation (S14), believe that guidelines have not helped cementing the robustness of LCA (S10) and think that discrepancy of results is an issue (S5).
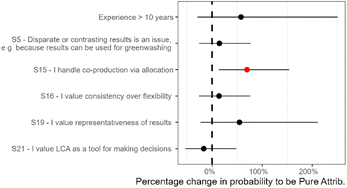
Fig. 5 presents the logistic regression results, using the attributional declaration as a dependent variable (ESI Fig. S4 and S5† shows the full and stepwise backwards models). The insights worthy of noting include:
- Experience tends to favor attributional practitioners, which may be explained by years of work or a cohort education effect.
- Agreement to S15 (handle co-production via allocation) and S19 (representativeness of results being important) increases the probability of adopting an attributional approach, with some statistical evidence.
- Statements closer to having no effect seem to be greenwashing concern (S5), consistency importance (S16) and LCA as a tool for decision making (S21).
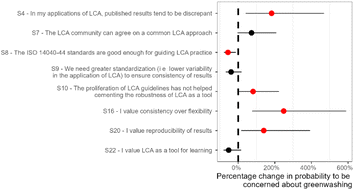
Fig. 6 presents the logistic regression for the greenwashing statement (S5) as the dependent variable (ESI Fig. S6† shows the full model). The insights worthy of noting include:
- Statements that increase the probability of being concerned about greenwashing are: (i) existence of discrepancy in LCA results in their own area of practice (S4), (ii) belief that the LCA community can agree on a common approach (S7), (iii) the proliferation of guidelines has not helped the robustness of LCA (S10), (iv) importance of consistency (S16) and (v) importance of reproducibility (S20).
- Statements that decrease the probability of concern about greenwashing are: (i) the perception that the ISO 14040-44 standards are sufficient for guiding LCA practice (S8), (ii) the need for greater standardization (S9) and (iii) the purpose of LCA as a tool for learning (S22).
Discussion
Overall, the mixed opinions shown by respondents indicate the divisive nature of these issues in the LCA community. The emergence of clear clusters within the data representing contrasting approaches in the LCA community was not entirely apparent when analyzing the data statistically, which indicates that the community is composed of different combinations of beliefs and practices, instead of the expected clear-cut, mutually-exclusive, manner of practice. However, two sets of clusters emerged from the survey results, each set represented by a different statistically-significant model generated, where one key variable in each model was regressed against the other responses: (i) propensity for practicing attributional LCA and (ii) propensity for concern over greenwashing.Results from the attributional-practice explanatory model suggest that attributional practitioners: (i) have more years of experience, (ii) value representativeness of results (S19) and (iii) handle co-production via allocation (S15). No other variables, statements or characteristics were found to statistically affect the probability of a respondent for being a self-declared attributional practitioner. This can be due to the small sample size, ambiguous statements in the survey or heterogeneity of opinions within the attributional practitioner cluster.
The greenwashing explanatory model presents results that are statistically more robust, indicating that concern over greenwashing is correlated with the existence of discrepant LCA results (S4), with agreement on the need for a common LCA approach (S7), with agreement that the proliferation of standards and guidelines has not helped cement the robustness of LCA as a tool (S10), and with valuing consistent (S16) and reproducible (S20) results. Conversely, practitioners not concerned about greenwashing tend to view the ISO standards as good enough for guiding LCA practice (S8), despite wanting more standardization (S9), and value LCA more as a tool for learning (S22) than as a tool for supporting decisions (S21).
The statistical analysis is subject to some limitations, such as the limited sample size relative to the number of statements. Some statements may have been ambiguous and subject to each respondent's interpretation, but the fact that we surveyed professional and highly educated LCA practitioners should mitigate this bias, even though experience and proficiency in LCA are not necessarily the same. In this way, the survey conducted should be regarded as a first estimation towards revealing the preferences and opinions of the different LCA schools of thought. Future research aiming at characterizing the LCA community could include a more comprehensive survey among LCA practitioners. Nevertheless, our results showed interesting patterns and clear differences between practitioners, highlighting the conflict between clusters, such as preferences in standardization levels, flexibility in practice when dealing with methodological choice and concerns about LCA misuse for greenwashing.
Conclusions
The impacts of heterogeneity in LCA methods and results is not just an issue in academic and research activities, but also in commercial interests and environmental governance. This is particularly evident in the issue of greenwashing. Indeed, the very raison d'être of LCA is to provide such robust, science-based methods for environmental claims that avoid burden-shifting, yet because of the variability in results permitted under the ISO standards, the tool may have a counterproductive effect.Further harmonisation would help to ensure consistency in the application of the tool by practitioners which, in turn, would ensure results would be less variable and arguably more meaningful. It is likely, however, that the associated methodological issues remain unresolved in the near future.
In order to resolve the issue of inconsistent methodological choices by practitioners, it will be necessary to deepen our understanding of the causes behind these choices. More comprehensive surveys would be welcomed, which would allow for a more detailed characterization of the different schools of thought in LCA practice – a necessary first step for the two camps to merge as a unified field of LCA practitioners.
In an age where green claims are increasingly scrutinized, the authors are of the opinion that ensuring greater consistency, via harmonization of practice that could come about with more constrained standardization, would be a step forward in the much-needed development of robust frameworks that can guide production and consumption systems towards real sustainability.
Author contributions
MB: conceptualization, survey development, data collection, data analysis, statistical analysis, writing – original draft, writing – review & editing; PB: statistical analysis, visualization, writing – review & editing, writing – review & editing; AK: writing – review & editing.Conflicts of interest
There are no conflicts to declare.Acknowledgements
We would like to thank Melissa Ávila for helping with the development of the survey and each of the 124 respondents who took the time to respond to it.Notes and references
- National Academies of Sciences, Engineering, Medicine, Current Methods for Life-Cycle Analyses of Low-Carbon Transportation Fuels in the United States, 2022 Search PubMed.
- M. Brandão, E. Azzi, R. M. L. Novaes and A. Cowie, The modelling approach determines the carbon footprint of biofuels: the role of LCA in informing decision makers in government and industry, Cleaner Environmental Systems, 2021, 2, 100027 CrossRef.
- M. Brandão, R. Heijungs and A. L. Cowie, On quantifying sources of uncertainty in the carbon footprint of biofuels: crop/feedstock, LCA modelling approach, land-use change, and GHG metrics, Biofuel Res. J., 2022, 9(2), 1608–1616 CrossRef.
- A. Kendall and J. Yuan, Comparing life cycle assessments of different biofuel options, Curr. Opin. Chem. Biol., 2013, 17, 439–443 CrossRef CAS PubMed.
- T. Schaubroeck, Sustainability assessment of product systems in dire straits due to ISO 14040-14044 standards: five key issues and solutions, J. Ind. Ecol., 2022, 26, 1600–1604 CrossRef.
- B. Weidema, Has ISO 14040/44 Failed Its Role as a Standard for Life Cycle Assessment?, J. Ind. Ecol., 2014, 18, 324–326 CrossRef.
- R. Heijungs, K. Allacker, E. Benetto, M. Brandão, J. Guinée, S. Schaubroeck, T. Schaubroeck and A. Zamagni, System expansion and substitution in LCA: a lost opportunity of ISO 14044 amendment 2, Frontiers in Sustainability, 2021, 2, 692055 CrossRef.
- M. Brandão, G. Heath and J. Cooper, What Can Meta-Analyses Tell Us about the Reliability of Life Cycle Assessment for Decision Support?, J. Ind. Ecol., 2012, 16, S3–S7 CrossRef.
- M. Brandão, R. Clift, A. Cowie and S. Greenhalgh, The Use of Life Cycle Assessment in the Support of Robust (Climate) Policy Making: Comment on “Using Attributional Life Cycle Assessment to Estimate Climate-Change Mitigation …”, J. Ind. Ecol., 2014, 18, 461–463 CrossRef.
- M. Brandão, T. Ekvall, S. Poulikidou, K. Johansson, J. Nilsson, P. Nojpanya, A. Wikström and T. Rydberg, RED, PEF, and EPD: conflicting rules for determining the carbon footprint of biofuels give unclear signals to fuel producers and customers, Frontiers in Climate, 2022, 4, 192 Search PubMed.
- ISO 14040, Environmental management—life cycle assessment—principles and framework, 2006 Search PubMed.
- ISO 14044, Environmental management—life cycle assessment—requirements and guidelines, 2006 Search PubMed.
- N. Pelletier, F. Ardente, M. Brandão, C. De Camillis and D. Pennington, Rationales for and limitations of preferred solutions for multi-functionality problems in LCA: is increased consistency possible?, Int. J. Life Cycle Assess., 2015, 20, 74–86 CrossRef.
- M. Brandão, Indirect Effects Negate Global Climate Change Mitigation Potential of Substituting Gasoline with Corn Ethanol as a Transportation Fuel in the USA, Frontiers in Climate, 2022, 4, 1–9 Search PubMed.
- M. Brandão, M. U. F. Kirschbaum, A. L. Cowie and S. V. Hjuler, Quantifying the climate change effects of bioenergy systems: comparison of 15 impact assessment methods, GCB Bioenergy, 2019, 11, 727–743 CrossRef.
- EC, Product Environmental Footprint (PEF) Guide, European Commission, Joint Research Centre (JRC), Italy, 2012 Search PubMed.
- EPD, General Programme Instructions for the International EPD® System, Version 4.0, EPD International, 2021 Search PubMed.
- EC, PEFCR Guidance Document - Guidance for the Development of Product Environmental Footprint Category Rules (PEFCRs), Version 6.3, European Commission, 2018 Search PubMed.
- B. P. Weidema and J. Eliassen, Study Panel for the Future of Science and Technology, European Parliamentary Research Service, PE747.453, 2023 Search PubMed.
- D. Vanham, Envisaged methodologies for sustainable food labelling policies might worsen water scarcity, Sci. Total Environ., 2023, 905, 167021 CrossRef CAS PubMed.
- G. Sandin, Latest PCR developments and common errors in EPDs, 5th September 2023, personal communication.
- European Commission, Proposal for a Directive on substantiation and communication of explicit environmental claims (Green Claims Directive), 22nd March 2022.
- European Parliament, EU to ban greenwashing and improve consumer information on product durability, 19th September 2023, press release.
- G. Guo, H. Wang, D. Bell, Y. Bi and K. Greer, KNN Model-Based Approach in Classification, Berlin, Heidelberg, 2003 Search PubMed.
- W. Taiyun and S. Viliam, Package ‘Corrplot’: Visualization of a Correlation Matrix (Version 0.92), 2021 Search PubMed.
Footnote |
| † Electronic supplementary information (ESI) available. See DOI: https://doi.org/10.1039/d3va00317e |
| This journal is © The Royal Society of Chemistry 2024 |

