 Open Access Article
Soil greenhouse gas fluxes in corn systems with varying agricultural practices and pesticide levels†
Eri
Saikawa
 *ab,
Alexander
Avramov
a,
Nicholas
Basinger
c,
Jerzi
Hood
c,
Nandita
Gaur
c,
Aaron
Thompson
 c,
Angela
Moore
d,
Douglas
Wolf
d and
Yaoxing
Wu
d
aDepartment of Environmental Sciences, Math and Science Center E512, Emory University, 400 Dowman Drive, Atlanta, USA. E-mail: eri.saikawa@emory.edu; Tel: +1404-727-0487
bGangarosa Department of Environmental Health, Emory University, Atlanta, USA
cDepartment of Crop and Soil Sciences, University of Georgia, Athens, USA
dProduct Safety, Syngenta Crop Protection LLC, Greensboro, USA
First published on 22nd August 2024
Abstract
Pesticides are biologically active compounds and their application may alter soil microbial communities and thus could possibly impact greenhouse gas (GHG) emissions. However, this aspect of agricultural production is rarely studied at the field scale. To address this knowledge gap, we conducted a 2 year field study growing maize (corn) under three pesticide application levels (none, medium, and high) in two agricultural practices: bare soil (conventional) and using cereal rye as a cover crop. In plots with no pesticide inputs, weeds were managed through hand removal weekly. We quantified GHG emissions, changes in soil labile carbon (C), nitrogen (N), and other typical growth parameters in the Iron Horse Farm, Georgia. Corn grain yields were within 93% of the estimated site yield potential, with yield significantly higher in 2021 than in 2022. Using a linear mixed model, including the data in both 2021 and 2022 for soil nutrients, soil temperature, soil moisture, agricultural practice, and pesticide levels as fixed effects and date and plot as random effects, soil surface carbon dioxide (CO2) fluxes were statistically significantly associated with soil temperature and soil moisture. Soil nitrous oxide (N2O) emissions were only associated with soil moisture. Soils in general served as a sink for methane (CH4) in all the agricultural practices and soil CH4 fluxes were also only associated with soil moisture. Three plots with a high soil C/N ratio with a visible presence of biochar resulted in several high CH4 flux events during the growing season. Soils from all plots were net sources of GHG and there were no significant differences in the amount of soil C sequestered between the plots. Our study shows that none of the variables we analyzed – yield, individual/net GHG emissions or the amount of C sequestered – in the two years of our experiment were impacted by the magnitude of pesticide application. However, this may change in a long-term experiment. Further research is also warranted to understand the underlying mechanism for high CH4 pulses, whether reactive oxygen species from the application of biochar might be the cause of large negative consequences on climate, depending on conditions.
Environmental significanceAgriculture is a major source of the three most important anthropogenic greenhouse gas (GHG) emissions, including carbon dioxide, nitrous oxide, and methane. Agricultural soils serve as both sources and sinks of these GHGs and pesticide application may impact microbial communities, thus resulting in altering GHG fluxes. In this two-year field study, we investigate how three pesticide levels in two agricultural practices affect each of the three GHG fluxes in a corn farm in GA, USA. The information is useful as we consider potential agricultural solutions for meeting the Paris Agreement to hold the global average temperature increase within 2 °C from the pre-industrial levels. |
1 Introduction
The importance of soil greenhouse gas (GHG) emissions on climate change has been long established1,2 but the impact of conventional agriculture, of applying synthetic pesticides (herbicides, insecticides, and fungicides), on soil GHG fluxes or carbon (C) sequestration is not well understood. Agriculture is a source of three major GHGs, including carbon dioxide (CO2), methane (CH4), and nitrous oxide (N2O), with emissions from the food system as a whole estimated to represent 34% of global anthropogenic GHG emissions.3 Agricultural soils serve as both sources and sinks of GHGs and the land-based sector accounts for 71% of these emissions in the food-system emissions.3 In the United States (US), 10% of its GHG emissions came from agriculture in 2021.4 It has been well documented that agricultural practices, such as tillage and nitrogen (N) fertilizer application, increase agricultural soil GHG fluxes,5,6 though little research has been conducted on the potential impact of synthetic pesticides on these fluxes in field studies.The balance of both soil C stocks and GHG fluxes is driven by microorganisms.7–9 The C cycle is governed through interactions between various system components, such as the amount of microbial biomass, microbial community structure, microbial byproducts, and soil properties (e.g., texture).7,8 Conservation agricultural practices, such as no-tillage and cover cropping, as well as reduced N fertilizer inputs, are known to increase total microbial biomass and shift the community structure toward a more fungal-dominated community.8,10–13 Previous studies have shown that the fungal-dominated soil communities lead to lower leaching losses of nitrate (NO3−) and ammonium (NH4+), as well as lower volatilization of ammonia (NH3) but increased N2O emissions and dissolved organic N.14
Modern agriculture has evolved partly due to the Green Revolution, which included an emphasis on applying synthetic fertilizers and pesticides.15 Environmental pollution and increased weed resistance,16 as well as adverse health impacts due to their application have been widely studied.17,18 The application of pesticides may also impact the diversity of soil microorganisms and microbial communities, and soil health.19–21
Previous laboratory studies have demonstrated that pesticides can alter nitrification and denitrification rates.22–25 Considering that nitrification and denitrification are major pathways for soil N2O production, different application rates of pesticides have the potential to impact soil GHG fluxes. For example, Jiang et al. (2015)26 found that the application of acetochlor and fenoxaprop-p-ethyl and tribenuron-methyl in wheat fields and bensulfuron-methyl in rice fields significantly reduced N2O emissions during the growing season, while other studies showed that other herbicides, including chloropicrin and methyl isothiocyanate, could increase N2O production.27,28
Synthetic fertilizers and pesticides can also impact soil microorganisms that could have implications for organic matter transformation and the C cycle. Some studies, however, also found that herbicide and pesticide application does not have significant impacts on the structure or functions of the soil microbial communities.29–31 Two of the most commonly used herbicides are glyphosate and 2,4-dichlorophenoxyacetic acid (2,4-D) but there is a lack of research on their effects on GHGs.32 How pesticide application may impact soil GHG fluxes as a whole is an important question, especially because herbicide use is expected to increase due to growing population demands33 and climate change.34
Corn (Zea mays L.) is an important staple grain globally as the third most consumed cereal35 and is one of the largest consumers of synthetic N fertilizer.36 The US is the largest producer of corn, responsible for approximately 31.5% of global production in 2021.37 Although Georgia is the 24th largest corn growing state in the US with 1.64 million metric tonnes produced in 2021,38 there is a dearth of knowledge on soil organic C sequestration potential and GHG emissions in the Southeast US. Franzluebbers (2005)39 conducted a review on this topic and stated that the impacts on GHG emissions and mitigation potential in the Southeastern US had not been analyzed.
We have conducted fieldwork at the University of Georgia experimental farms since 2016 to quantify the impacts of agricultural practices on soil GHG emissions and C sequestration potential.40,41 In these past studies, we focused on cover crops and the amount of fertilizer applied to corn. In this study, we aim to not only assess the difference in soil GHG emissions from corn growing in bare soil against those in soil with cereal rye (Secale cereale L.) as a cover crop, but also the amount of pesticides applied in each of the plots. We have chosen cereal rye as this is the most common cover crop used in Georgia and does not impact fertilizer application rates, since it is not an N-fixing plant.42,43 We are interested in understanding how agricultural practices and associated soil conditions (soil properties, temperature and moisture), soil C, and other soil nutrients (NO3− and NH4+) along with pesticide application impact the microorganisms in soil and whether they will lead to significant differences in GHG emissions. This study also fills the gap in our current knowledge, as many studies are conducted under laboratory conditions and field studies are rare.44,45
2 Methods
2.1 Field experiment
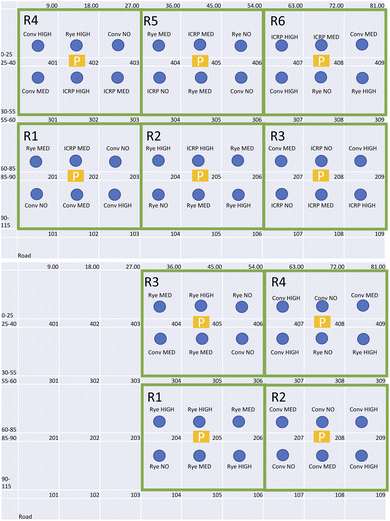
We conducted a pilot-scale field experiment at the University of Georgia J. Phil Campbell Research and Education Center (latitude 33.72458°; longitude −83.30262°; elevation 158 m). The soil type at the site is a Cecil gravelly sandy loam (fine, kaolinitic, thermic Typic Kanhapludults). The field experiment used a randomized complete block design with four replicates with a factorial arrangement of treatments: three agricultural practices as main plots (bare soil, cereal rye as a cover crop, and intercrop with soybeans) and three pesticide application levels (none, medium, and high) for each of these plots in 2021. Chambers in one of the rows (row 6), however, were misplaced after the second fertilizer application in 2021 and therefore the measurements related to those plots for 2021 are not analyzed in this paper. In 2022, we reduced the number of plots to include only two agricultural practices, as the intercrop failed in 2021. We initially had four replicates of nine plots (three bare soil plots, three cereal rye plots, and three intercrop plots, each representing a different amount of pesticide level), with a total number of 36 plots in 2021 and four replicates of six plots (three bare soil plots and three cereal rye plots, each representing a different amount of pesticide level), with a total number of 24 plots in 2022. In this paper, we analyze the results for conventional and cereal rye plots for both years. Because the intercrop failed in 2021, the intercrop plots that were on the directly fertilized plots in 2021 (plots 108, 202, 208, 302, 304, and 408 – explained in more detail below) are treated as conventional plots for soil nutrient and greenhouse gas analyses. The plots are summarized in Table 1 and the layout is shown in Fig. 1. Levels of input corresponded with no pesticide input (no), the minimum (med) or maximum (high) allowable applications of pesticides, as indicated on the product label (Table 2). Our aim for these levels of pesticide inputs was to maximize the rate difference among the control (no pesticide), medium and high plots.| Tillage | No till |
|---|---|
| Irrigation | Provided according to the University of Georgia Extension |
| Checkbook Method for Corn46 | |
| Planting dates | May 14, 2021 and April 13, 2022 |
| Nitrogen (N) application | 67.25 & 197.83 (kg N ha−1); 60.53 & 197.83 (kg N ha−1) |
| N application dates | April 2, 2021 & June 15, 2021; April 26, 2022 & June 8, 2022 |
| Input level | Type | Product name | Pesticide | Amount applied | Timing |
|---|---|---|---|---|---|
| No | None | None | None | Plots maintained weed-free through hand removal | N/A |
| Med | Insecticide | Force 6.5G | Tefluthrin | 1.41 kg ai ha−1 | Planting |
| Herbicide | Roundup PowerMax II | Glyphosate | 2.13 kg ae ha−1 | V4–V5 | |
| Herbicide | Dual II Magnum | S-metolachlor | 1.42 kg ai ha−1 | Planting | |
| Herbicide | Xtendimax | Dicamba | 0.28 kg ae ha−1 | V4–V5 | |
| Fungicide | Trivapro | Benzovidiflupyr + azoxystrobin + propiconazole | 0.031 + 0.11 + 0.125 kg ai ha−1 | VT | |
| Insecticide | Warrior II | Lambda-cyhalothrin | 0.035 kg ai ha−1 | VT | |
| High | Insecticide | Force 6.5G | Tefluthrin | 2.38 kg ai ha−1 | Planting |
| Herbicide | Roundup PowerMax II | Glyphosate | 2.52 kg ae ha−1 | V4–V5 | |
| Herbicide | Dual II Magnum | S-metolachlor | 1.785 kg ai ha−1 | Planting | |
| Herbicide | Xtendimax | Dicamba | 0.56 kg ae ha−1 | V4–V5 | |
| Fungicide | Trivapro | Benzovidiflupyr + azoxystrobin + propiconazole | 0.06 + 0.22 + 0.25 kg ai ha−1 | VT | |
| Insecticide | Warrior II | Lambda-cyhalothrin | 0.07 kg ai ha−1 | VT |
Prior to planting, glyphosate was applied across the experiment at 1.26 kg ae ha−1 to terminate the cover crop and to kill any winter weeds in preparation for corn planting. At the same time, plots containing cover crop were rolled using a roller crimper in the direction the corn would be planted. Corn seeds (DK-6208SS) treated with prothioconazole, metalaxyl, fluoxastrobin, clothianidin 1250, and Bacillus firmus I-1582 were planted on 90 cm row spacing at a population of 12![[thin space (1/6-em)]](https://www.rsc.org/images/entities/char_2009.gif) 140 seeds per hectare using a John Deere MaxEmergeII with insecticide boxes.
140 seeds per hectare using a John Deere MaxEmergeII with insecticide boxes.
Plots contained three rows, 7.6 m long with two data collection rows and one row serving as a buffer row between plots. At planting, tefluthrin was applied in-furrow at a designated rate depending on pesticide levels (no, med, high), using the insecticide box setup on the planter. Directly after planting, S-metolachlor was also applied at the rate for the level of pesticide input (no, med, high) for each plot using a CO2 pressurized backpack sprayer with a 6 nozzle handboom. This sprayer was used for all pesticide applications and was calibrated to deliver 187 L ha−1 using TeeJet 11002VS nozzles. A postemergence application of glyphosate and dicamba was made at the V4–V5 growth stage. At the VT growth stage, a fungicide premix of benzovindiflupyr, azoxystrobin, and propiconazole was tank-mixed with insecticide lambda-cyhalothrin. This application was made in the medium and high pesticide input plots and again two weeks later at the same rates in the high pesticide input plots. In plots with no pesticide inputs, weeds were managed through hand removal weekly.
In all systems studied, we applied a similar amount of synthetic fertilizer (UAN 32% in bulk from Nutrien) twice during the growing season (Table 1). Prior to planting, soil was collected and tested at the University of Georgia's Agricultural and Environmental Services Laboratories (https://aesl.ces.uga.edu/) and fertilizers were applied with a yield goal of 280 kg grain ha−1. Applications of granular phosphorus and potassium fertilizers (UAN 32%) were made with the use of a variable rate pull behind rotary spreader (Newton Crouch model 49 medium clearance row crop spreader). N fertilizer applications were made with a John Deere 4630. 32% urea ammonium nitrate (UAN) was applied with SJ3-04-VP nozzles attached to 60 cm hose drops, so that the fertilizer was applied to every other interrow. The first application in April was 67.25 kg N ha−1 in 2021 and 60.53 kg N ha−1 in 2022. The second application included 197.83 kg N ha−1 in June. In both years, every other row of corn was side-dressed but in 2021, only four rows with measurement collars were applied with fertilizer, while all rows with measurement collars received application in 2022. This difference in fertilizer application had impacts on soil C, soil N, and GHG fluxes that we discuss in this paper.
2.2 Measurements
Weather data including air temperature, relative humidity, precipitation, pressure, and wind speed/direction at 15 min intervals were collected at the Iron Horse Farm, approximately 100 m away from the measurement site. We obtained the data from the Georgia Weather Network.Weekly assessments of corn growth and development were made beginning at 3 weeks after planting in 2021 and 5 weeks after planting in 2022. Leaf Area Index (LAI) using a ceptometer (LP-80, Meter Group), average corn height, and Soil Plant Analysis Development (SPAD) chlorophyll measurements (MC-100, Apogee Instruments) were also taken weekly at the same time. To evaluate the yield and its parameters, prior to harvest, all ears in each plot were counted and 10 ears from each plot were hand harvested to assess ear length and grain yield per ear. Ear length was measured and grain was removed from each ear using a mechanical corn sheller. Once removed, the shelled grain was weighed. To determine yield per plot, two rows in each plot were harvested using a Wintersteiger plot combine. Yield was adjusted across treatments to 15% moisture content.
We quantified soil CO2, N2O, and CH4 fluxes by accumulating gases in static chambers and using a G2508 Picarro gas analyzer (Picarro Inc., United States). We conducted weekly to biweekly measurements in 2021 and 2022 during the growing season (April to September). In total, we calculated fluxes on 15 occasions in 2021 and 12 occasions in 2022. Flux measurements were conducted between 7 am and 5 pm and the block design allowed us to cover the diurnal variation in the flux for each practice with the three pesticide levels.
The chambers and measurement strategy were similar to what is described in Wang et al. (2022).40 For each round of measurement (as illustrated as green squares surrounding six plots in Fig. 1), we had six chambers connected to the Picarro analyzer, drawing air from the chamber for 1 minute at a time. We started each measurement sequence by measuring the background air surrounding the chamber for a minute after which we capped the chamber. In between measuring the air from chambers, we measured ambient air through a Balston filter (Model 9933-11-102) for a minute. We continued this five times, making it an hour-long process for quantifying fluxes for the six chambers. To measure 24 chambers, it took approximately six hours from start to finish. We calculated the fluxes of CO2, N2O, and CH4 by fitting a linear regression of gas concentrations accumulated over the one-hour measurement period. We used the three last data points to calculate the linearity and the flux rates. If the coefficient of determination was lower than 0.75, we excluded the data from our analysis.
On each measurement period, we also measured soil temperature and soil volumetric water content at 15 cm soil depths using a WET-2 sensor (Delta-T Devices, Cambridge, United Kingdom). The sensor has an accuracy of ±1.5 °C and ±0.03 m3 m−3. We also collected soil samples adjacent to the chambers within 1 h of gas measurement on each measurement day to measure water extractable organic carbon (WEOC), soil nitrate (NO3−–N), and soil ammonium (NH4+–N) in 0–10 cm depth. The top 10 cm of soil was collected 15–30 cm away from each chamber using a 2.54 cm sampling rod. Each time the sample was collected, the spot was noted, and subsequent samples were collected at least 5 cm from that point. Samples were then stored at 4 °C within 1 h of sampling and then extracted to determine WEOC, soil NO3−–N, and soil NH4+–N. Total organic C (TOC) and total organic N (TON) were also measured at the beginning and end of each growing season per plot per year.
2.3 Soil extraction
WEOC was extracted by placing 8 grams of lightly-sieved moist soil in a 50 mL centrifuge tube with 25 mL of 18.2 MΩ water. Samples were then shaken at 180 rpm for 30 min. The samples were then centrifuged at 10![[thin space (1/6-em)]](https://www.rsc.org/images/entities/char_2009.gif) 000 rpm (17
000 rpm (17![[thin space (1/6-em)]](https://www.rsc.org/images/entities/char_2009.gif) 136 RCF) for 15 minutes in a Sorvall RC6-Plus centrifuge, using a Thermo Scientific Fiberlite F13S-14x50cy rotor. 10 mL of the supernatant of each sample was collected after filtering through a Whatman Grade 42 quantitative filter paper (125 mm diameter) with a 2.5 μm pore size before further filtration through a 25 mm syringe filter with a 0.22 μm pore size.
136 RCF) for 15 minutes in a Sorvall RC6-Plus centrifuge, using a Thermo Scientific Fiberlite F13S-14x50cy rotor. 10 mL of the supernatant of each sample was collected after filtering through a Whatman Grade 42 quantitative filter paper (125 mm diameter) with a 2.5 μm pore size before further filtration through a 25 mm syringe filter with a 0.22 μm pore size.
WEOC concentrations were measured using a TOC-505 analyzer (Shimadzu Corporation, Kyoto, Japan). 4.5–5.5 mL of supernatant from each sample was analyzed, along with five standards and a blank. Two replicates were analyzed per sample for a total of 48 measurements.
Plant-available N was estimated by extracting NO3− and NH4+ in KCl. A similar procedure to the WEOC was carried out with 8 grams of soil added to 50 mL centrifuge tubes with 40 mL of 1.0 M KCl. The samples were shaken at 180 rpm for 30 minutes. The samples were then centrifuged at 10![[thin space (1/6-em)]](https://www.rsc.org/images/entities/char_2009.gif) 000 rpm. Then, 10 mL of supernatant was collected by filtration through a Whatman Grade 42 quantitative filter paper (125 mm diameter). NO3− and NH4+ concentrations were measured using an Alpkem RFA-300. 2–3 mL of supernatant from each sample was analyzed, and two replicates were collected per sample, totaling 48 measurements.
000 rpm. Then, 10 mL of supernatant was collected by filtration through a Whatman Grade 42 quantitative filter paper (125 mm diameter). NO3− and NH4+ concentrations were measured using an Alpkem RFA-300. 2–3 mL of supernatant from each sample was analyzed, and two replicates were collected per sample, totaling 48 measurements.
Soils from the beginning of each growing season were analyzed for TOC and TON. Briefly, up to 200 mg of ground soil was added to an aluminum capsule and combusted in a LECO CN 828 elemental analyzer.
2.4 Data analysis
We evaluated the effect of different agricultural practices and the application rate of pesticides on corn height, SPAD, and LAI measurements during the growing season by using a Kruskal–Wallis rank sum test, with the kruskal test package in R version 4.3.2.47,48 We also analyzed these effects on soil temperature and moisture, and soil nutrient levels for all conventional and cereal rye plots, as well as just for plots that were directly fertilized in 2021. When the differences were statistically significant at a 0.05 level, we conducted the pairwise comparisons using the Wilcoxon rank sum test with continuity correction in R.49 We also assessed the relationships of soil and environmental variables (soil temperature, soil moisture, WEOC, NO3−–N, NH4+–N), as well as agricultural practices and pesticide application rates with each of the GHG emissions using a linear-mixed model with the lmer package in R.50 Linear-mixed models allow us to account for both fixed and random effects.51 Because we take measurements from the same plots, our observations from the same plots will be undeniably correlated. The same can be said for the observations taken on the same day. We used a linear-mixed model expressed as| y = Xβ + Zα + ε, | (1) |
3 Results and discussion
3.1 Weather
Meteorological data, including minimum and maximum air temperature, as well as precipitation for both measurement periods in 2021 and 2022 are shown in Fig. 2. During the growing season between April 15 and September 30 in both years, average temperature was 22.36 °C in 2021 and 23.17 °C in 2022. The minimum air temperature was higher on average in 2022 (17.48 °C in 2022 compared to 16.73 °C in 2021) and so was the maximum air temperature (29.88 °C in 2022 compared to 28.90 °C in 2021). For the same period, the cumulative precipitation in 2021 and 2022 was 532.6 mm and 454.92 mm, respectively. Overall, 2022 was a hotter and dryer growing season, compared to 2021.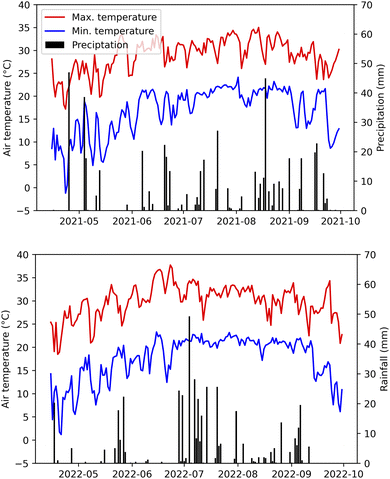 | ||
| Fig. 2 Meteorological data including minimum temperature (red), maximum temperature (blue), and precipitation for 2021 (top) and for 2022 (bottom). | ||
3.2 Corn growth parameters
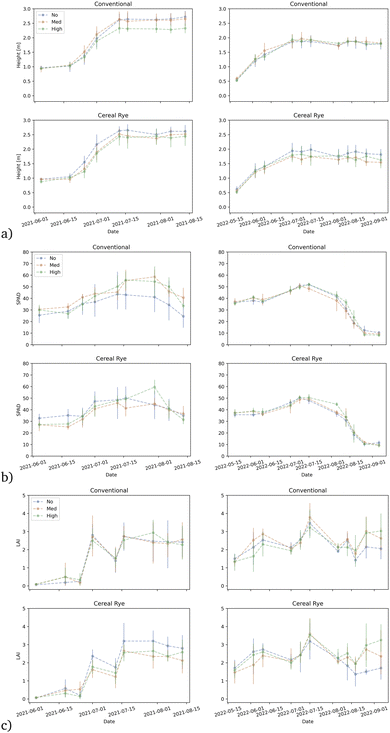
Corn height was affected by the pesticide levels. Corn height was reduced in the highest pesticide input level compared to no inputs (p-value = 0.04397) in 2021. The height differences were especially visible for conventional plots from mid-July through the end of August in 2021, approximately 7–15 weeks after planting (Fig. 3a). The difference in the height was however only apparent between the agricultural practices (p-value = 0.04569) in 2022, and not in pesticide levels. Interestingly, the average corn height at the end of the growing season in 2021 ranged between 2.33 m and 2.72 m but in 2022, it only reached between 1.55 m and 1.97 m. The corn height varied much more within the same agricultural practice and the pesticide input level in 2021; the difference in average corn height between the two years is apparent (ESI Fig. S1†). This substantial overall reduction of the corn height in 2022 is potentially due to the weather impact mentioned above but it may also be due to the difference in the growing season period between the two years.SPAD was neither affected by pesticide levels nor by agricultural practices in 2021 or 2022 (Fig. 3b). Unlike for corn height, plots without any pesticide input in conventional plots had the lowest SPAD values 7–15 weeks after planting, compared to those with medium or high levels of pesticide input. However, there was no statistically significant difference in SPAD among the plots. Variability in SPAD was much lower in 2022 compared to 2021 for both conventional and cereal rye plots.
LAI was unaffected by any combination of treatment factors in conventional or cereal rye plots in both years (Fig. 3c). The growing season started late in 2021 and so the LAI was much lower in early July compared to 2022 but otherwise, there were no significant differences between the two years.
3.3 Yield
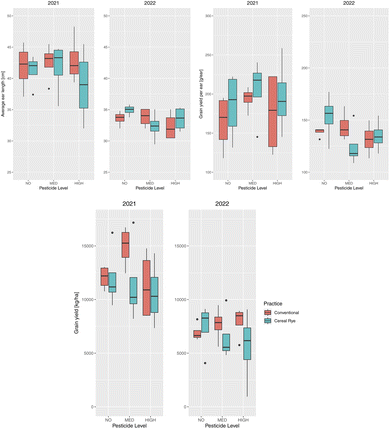
The average ear length across both years and treatments was 37.47 cm, grain yield per ear averaged 162.16 g per ear, and yield averaged 9525 kg ha−1. There was no statistically significant effect of the agricultural practice or the pesticide level on the average ear length, grain yield per ear, or the total grain yield (Fig. 4). The primary reason that no pesticide plots resulted in similar yield is because we managed weeds by hand to be weed free. In addition, we did not observe any significant levels of pest or disease pressure at this site that would have affected the non-treated plots either year. The variety used is the most commonly grown variety (DK 62-08) in the state and is well adapted to the growing conditions with a strong disease profile.We, however, found higher average ear length in 2021 compared to 2022 (Fig. 4). The difference was statistically significant (p-value = 3.4 × 10⁻⁸) and the ear length was 8.11 cm longer, on average, in 2021. Conventional plots had a larger difference in ear length between the two years with a 9.21 cm longer ear in 2021 (p-value = 3.6 × 10⁻⁵), compared to 7.01 cm for cereal rye (p-value = 0.00047). The same was true for the grain yield per ear (p-value = 4.531 × 10⁻⁵) and the total grain yield (p-value = 2.273 × 10⁻⁷), with 48.77 g per ear higher grain average and 5039 kg ha−1 higher grain yield for 2021. The difference in the yield was expected from the corn height and the average ear length in the two years and this might have been due to the difference in weather or the growing season between the two years.
3.4 Soil nutrients
Total C and N in all the plots in 2021 had a large variability, due to the existence of biochar in some plots. Total C content was over 15% in three plots in 2021 (plots 201, 202, and 203) and the highest value was 54.5% in plot 203 (Fig. 5). Total N was high with over 0.2% in 2021 in the two plots with the highest total C content (plots 202 and 203), although the value was lower than the average (0.167%) in the plot 201 (0.136%), where the total C content was the third highest of all plots (Fig. 5).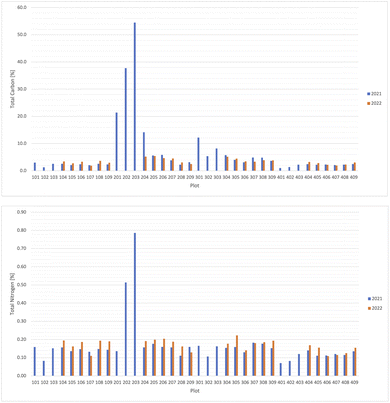 | ||
| Fig. 5 Total carbon content (left) and total nitrogen content (right) [%] among the plots in 2021 and 2022. | ||
Due to the large variation in the total C and N contents, the C/N ratio also had a wide range (Fig. 6). The average C/N ratio in 2021 was 32.5 but it was 157.4 in plot 201, where we found the third highest soil C content with low total N. In six other plots, the C/N ratio was over 40 in 2021. When we reduced the number of plots in 2022, we made sure that those high C/N ratio plots were excluded. In 2022, the average soil C/N ratio was much more homogeneous, with an average value of 20.3.
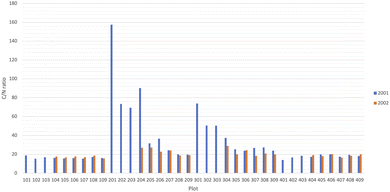 | ||
| Fig. 6 Same as Fig. 5 but for the carbon-to-nitrogen ratio. | ||
WEOC was statistically significantly different between no and high pesticide plots in directly fertilized plots in 2021 (p-value = 0.015). This difference in WEOC was especially visible in the cereal rye plots that were directly fertilized (p-value = 0.013). WEOC was also statistically significantly different between the practices in the non-directly fertilized plots in 2021 (p-value = 0.001842) (ESI Fig. S2†). In 2022, WEOC was only slightly statistically significantly different between the practices (Fig. 7, p-value = 0.083). The mean WEOC of the high-pesticide cereal rye plots (47.3 mg kg−1) was the lowest in 2021. On the other hand, the mean WEOC of the medium-pesticide cereal rye plots (65.6 mg kg−1) was the highest in 2022.
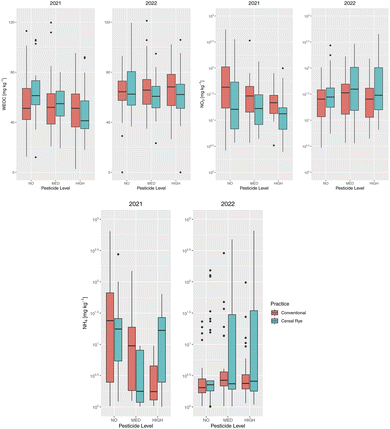 | ||
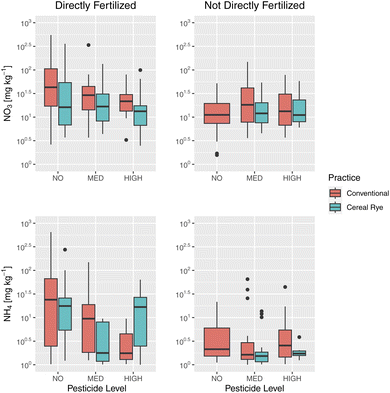
| Fig. 7 Same as Fig. 4 but for water-extractable organic carbon (top left), soil nitrate (top right), and soil ammonium (bottom) [mg kg−1]. | ||
The average WEOC in all plots in 2022 was higher by 8.26 mg kg−1 compared to that among the directly fertilized plots in 2021. This increase was 12.9% and was much higher than the 4 per mille (0.4%) goal set for storing C in the ground to meet the Paris Agreement. There was however no difference in the change in WEOC between years among different practices or pesticide levels (Fig. 7). The average WEOC increase in conventional (cereal rye) plots for no, medium, and high pesticide input levels was 4.46 (0.702), 13.0 (5.91), and 16.5 (14.0) mg kg−1, respectively.
The time series of soil WEOC values for directly fertilized plots shows that WEOC in the conventional no-pesticide plots increases right after fertilization in 2021. There is a spike on June 17, 2021 after the fertilization on June 15. WEOC values in the cereal rye no-pesticide plots on the other hand peak a little later on July 7, 2021. In 2022, WEOC values peak right after the second fertilization on June 15, 2022 for the cereal rye plots but the WEOC values in no-pesticide conventional plots peak much later in mid-July (Fig. 8a).
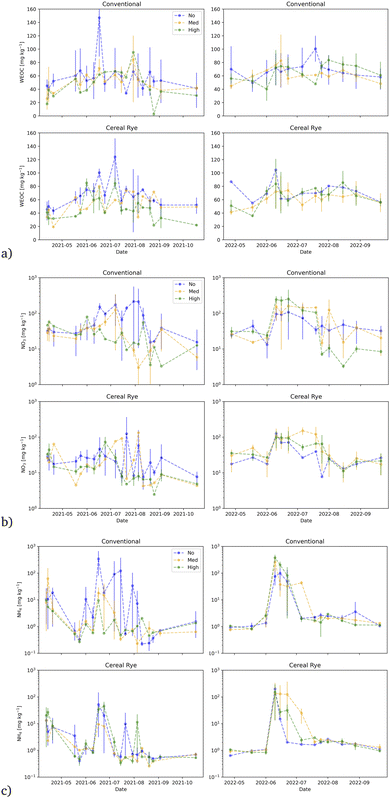 | ||
| Fig. 8 Same as Fig. 3 but for: (a) water-extractable organic carbon; (b) soil nitrate; and (c) soil ammonia. | ||
Soil NO3− among various pesticide input levels in all directly-fertilized plots in 2021 was statistically significantly different (Fig. 7, p-value = 0.003433), because of the difference in conventional plots (p-value = 0.01182). It was however only different between the practices in 2022 (p-value = 0.0176) and not among pesticide levels. Soil NH4+–N was furthermore not statistically significantly different based on agricultural practices, the pesticide levels, or the interaction of these two different variables.
The average soil NO3−–N in all directly-fertilized plots in 2021 was 46.8 mg kg−1, while it was 49.1 mg kg−1 in 2022. The average soil NH4+–N in 2021 and 2022 was 18.3 mg kg−1 and 18.4 mg kg−1, respectively. We found a slight increase in both soil NO3−–N and NH4+–N in 2022, mainly because of the increase after the second fertilization in 2022 (Fig. 8b and c).
We found high soil NO3−–N and NH4+–N levels on plots that were directly fertilized compared to those that were not in 2021 (Fig. 9). In the directly fertilized plots, we found a larger NO3−–N and NH4+–N in plots where no pesticide was applied, especially compared to plots with high pesticide application. For the plots that were not directly fertilized, there was no difference among the plots with varying pesticide application rates.
3.5 Soil temperature and moisture
Average soil temperature was lower in 2021 than in 2022 by more than 6 °C (Fig. 10), and as expected from the weather data, soil moisture was higher in 2021 (Fig. 10). There were statistically significant differences in soil moisture among the different combinations of pesticide input levels in 2021: between none and medium (p-value = 0.0571), between none and high (p-value = 8 × 10⁻⁶), and between medium and high (p-value = 0.017). These differences were visible in conventional plots but not in cereal rye plots. There were no differences in 2022 between practices or among pesticide levels.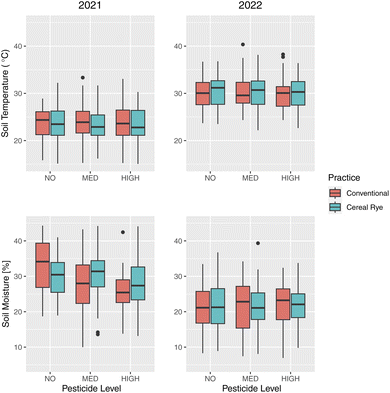 | ||
| Fig. 10 Same as Fig. 4 but for soil temperature (top) and soil moisture (bottom). | ||
The time series figures show that the differences among the agricultural practices and the pesticide levels were almost nonexistent for soil temperature in both years (Fig. 11). For soil moisture, there were quite large variations depending on the plot in 2021 but the trends were similar in both years, regardless of the agricultural practice or the pesticide levels (Fig. 11). Although irrigation was applied, we find soil moisture levels as low as 10% during the growing season, especially in 2022, when it was much drier.
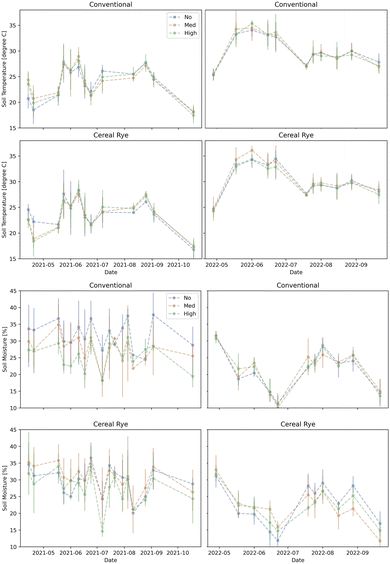 | ||
| Fig. 11 Same as Fig. 3 but for soil temperature (left) and soil moisture (right). | ||
3.6 Carbon dioxide
Soil CO2 fluxes in directly fertilized plots followed a similar pattern in both 2021 and 2022 for both conventional and cereal rye plots, although the variation was larger for the cereal rye plots in 2021 than in 2022 (Fig. 12a). The average soil CO2 fluxes of the directly fertilized plots in 2021 and 2022 were 4.78 and 4.94 μmol m−2 s−1, respectively. Soil CO2 fluxes in the directly fertilized plots differed in the two practices, but only in 2021 (p-value = 3.1 × 10⁻⁷) (Fig. 13). The directly-fertilized cereal rye plots had a higher average soil CO2 flux of 5.80 μmol m−2 s−1, compared to conventional plots (4.02 μmol m−2 s−1) in 2021. In 2022, the difference between conventional and cereal rye plots was smaller and the fluxes were 4.82 μmol m−2 s−1 for the former and 5.06 μmol m−2 s−1 for the latter.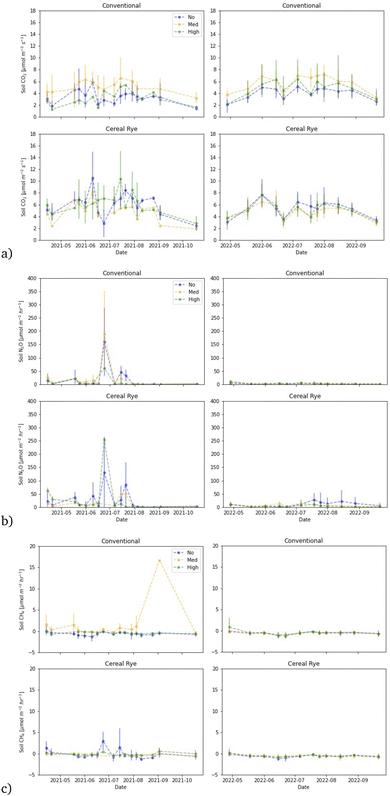 | ||
| Fig. 12 Same as Fig. 3 but for soil surface fluxes of: (a) carbon dioxide (CO2); (b) nitrous oxide (N2O); and (c) methane (CH4). | ||
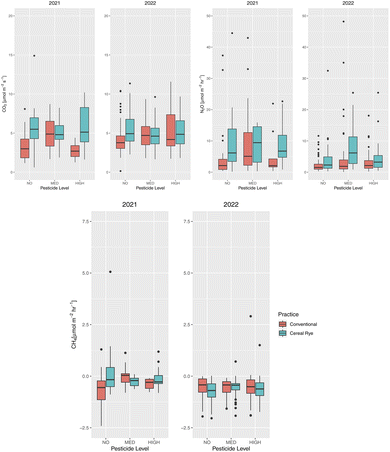 | ||
| Fig. 13 Same as Fig. 4 but for soil surface carbon dioxide (CO2) fluxes (top left), soil nitrous oxide (N2O) fluxes (top right), and soil methane (CH4) fluxes (bottom). | ||
Although the mean CO2 fluxes were similar in the two years of our study, these were slightly higher than what we had measured in the past in the nearby experimental farm, also growing corn (conventional with 1.98 μmol m−2 s−1 and 2.64 μmol m−2 s−1, and cereal rye with 2.78 μmol m−2 s−1 and 3.55 μmol m−2 s−1).40,41 However, as in these previous studies, we also found that conventional plots emit fewer soil CO2 fluxes than cereal rye plots in this study as well.
One thing to note is the higher soil CO2 fluxes from not directly-fertilized plots in 2021 (5.89 μmol m−2 s−1), compared to directly-fertilized plots (4.60 μmol m−2 s−1). The differences were equally visible in conventional (5.59 and 4.02 μmol m−2 s−1) and rye plots (6.66 and 5.80 μmol m−2 s−1) for non-directly-fertilized plots versus fertilized plots, respectively.
When analyzing both practices together, we did not find statistically significant differences in soil CO2 fluxes depending on pesticide input levels. However, for directly-fertilized conventional plots, there were significant differences between no and medium pesticide input levels (p-value = 5.3 × 10⁻⁵) and medium and high input levels (p-value = 0.00018) in 2021. The same was true in 2022: between no and medium (p-value = 0.079) and no and high (p-value = 0.079) input levels (Fig. 13). Interestingly, in conventional plots, we also found significantly different soil CO2 fluxes between no and medium (p-value = 0.059) and no and high (p-value = 0.059) pesticide levels that were not directly fertilized as well (ESI Fig. S3†).
In the linear mixed model using directly-fertilized plot data in both 2021 and 2022 data and including WEOC, NO3−, soil temperature, soil moisture, agricultural practice, and pesticide levels as fixed effects and date and plot as random effects, soil temperature and soil moisture were the only variables that were statistically significant. Although they both increased soil CO2 fluxes, soil temperature had a larger impact per unit increase, holding everything else constant.
3.7 Nitrous oxide
We observed many soil N2O flux events in 2021, especially in the cereal rye plots, compared to 2022 (Fig. 12b). In 2021, the highest peak observed from cereal rye plots reached 263.9 μmol m−2 h−1 on June 24, 9 days after fertilization. The highest peak flux observed in conventional plots in 2021 was 149.7 μmol m−2 h−1, also on the same day. In contrast, in 2022, the highest peaks observed in conventional and cereal rye plots were 18.1 and 70.1 μmol m−2 h−1, respectively. The former was observed on July 25, more than a month after the second fertilization event, whereas the latter was observed on April 28, soon after the first fertilization event.The average soil N2O fluxes in directly-fertilized plots in 2021 and 2022 were 23.88 and 5.037 μmol m−1 h−1, respectively. The flux levels were much lower in 2022 and so when we expanded the figures at low flux levels in 2022, we found a different trend in 2022, compared to 2021 (Fig. 14). In 2021, higher fluxes were observed in the earlier growing season with some occasional peaks in June and July, after the second fertilization event, with some peaks in April and May. For conventional plots in 2022, the largest fluxes took place in April after the first fertilization. For cereal rye plots, with no pesticide input, we observed larger N2O fluxes later in the growing season. The reason why we found low soil N2O fluxes after the second fertilization when we expect the highest is most likely due to low soil moisture levels in mid and late June, 2022 (Fig. 11).
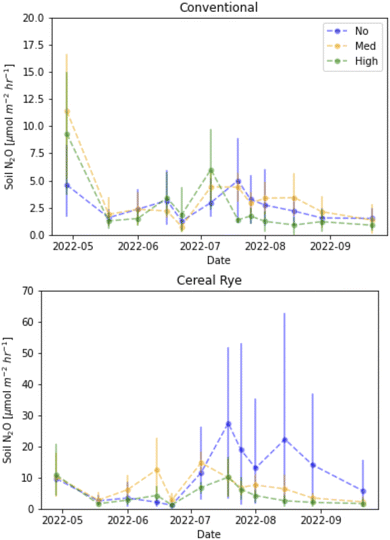 | ||
| Fig. 14 Soil surface N2O fluxes from conventional (left) and cereal rye (right) corn plots in 2022 with different y-axes. | ||
The mean N2O fluxes differed in the two years of our study, and the values we measured in 2022 were closer to what we measured in our past studies. For example, in 2016 and 2017, the N2O flux averages from the conventional and cereal rye plots were 0.60 and 0.56 μmol m−2 h−1.41 In 2018, they were 1.24 and 2.07 μmol m−2 h−1, respectively.40 What we measured especially in 2021 were much higher than what we had measured in the past. It is well known that N2O fluxes are characterized by transient hot moments.52 Our growing season in 2021 was pushed later because of a crop failure at the beginning and that pushed the second fertilizer date to 1 week later than in 2022. The soil moisture was also much wetter in late June, 2021, when the high peaks were observed (Fig. 11).
Average soil N2O fluxes from not directly-fertilized plots in 2021 (9.74 μmol m−2 h−1) were nearly 60% lower compared to directly-fertilized plots (23.88 μmol m−2 h−1) but they were still higher than the average in 2022. The differences were equally visible in conventional (9.96 and 17.19 μmol m−2 h−1) and rye plots (9.20 and 25.79 μmol m−2 h−1). Cereal rye plots did not always emit higher N2O fluxes compared to conventional ones.
There were statistically significant differences in soil N2O fluxes in directly-fertilized plots between the practices in 2021 (p-value = 0.00762) and 2022 (p-value = 1.9 × 10⁻⁵) (Fig. 13). There were also significant differences among pesticide inputs for soil N2O fluxes in these plots. In directly-fertilized conventional plots, we found differences between no and medium (p-value = 0.08) and between medium and high (p-value = 0.092) pesticide input levels in 2021. In 2022, there were differences among all pesticide input levels (p-values = 0.005, 0.093, and 0.089 for between no and medium, no and high, and medium and high pesticide levels, respectively) because of the significant differences in rye plots between no and medium (p-value = 0.0064) and between medium and high (p-value = 0.0121).
In the linear mixed model using the data from directly-fertilized plots in both 2021 and 2022 data and including WEOC, NO3−, NH4+, soil temperature, soil moisture, agricultural practice, and pesticide inputs as fixed effects and date and plot as random effects, the only variable that was statistically significant was soil moisture. Soil moisture had a positive effect on N2O fluxes. Indeed, on those dates when we found the highest soil N2O fluxes right after fertilization in 2021, soil moisture was over 40%, whereas the soil moisture was below 20% after fertilization in 2022.
3.8 Methane
In most of the directly-fertilized conventional plots and in cereal rye plots for both years, CH4 fluxes were minimal and in most cases, soils served as a sink, other than in a medium pesticide level conventional plot (Fig. 12c). In plot 202, which was initially an intercrop medium-level pesticide plot (which is considered as a conventional plot, as the intercrop failed) there was a large CH4 flux of 16.65 μmol m−2 h−1 on September 3, 2021. There were also other high soil CH4 flux events in non-directly fertilized plots and this will be discussed later together.The average CH4 fluxes in directly-fertilized plots in 2021 (excluding plot 202) and 2022 were −0.0166 (−0.236) and −0.585 μmol m−2 h−1 for conventional and cereal rye, respectively. We found statistically significantly different fluxes between the practices in 2022 (p-value = 0.033). There were also significant differences among pesticide levels in all directly-fertilized conventional plots in 2021 between no and medium pesticide levels (p-value = 0.0061). The difference was most visible between no and medium pesticide levels in directly-fertilized conventional plots (p-value = 1.4 × 10⁻⁶) but there were also differences between medium and high pesticide levels as well (p-value = 0.00027) (Fig. 13). When we exclude plot 202, the differences among no and medium pesticide levels in directly-fertilized plots were still visible (p-value = 0.035), and so were the differences between no and medium pesticide levels (p-value = 0.00017) and between medium and high pesticide levels (p-value = 0.00209) in directly-fertilized conventional plots (ESI Fig. S4†).
The mean CH4 fluxes differed in the two years of our study, and the values we measured in 2022 were closer to what we had in our past studies. For example, in 2018, the CH4 flux averages from the conventional and cereal rye plots were −0.65 and −0.83 μmol m−2 h−1.40 What we measured especially in 2021 was a much smaller sink than what we had measured in the past. The soil moisture being much higher in 2021 might have played some role in the CH4 fluxes as well.
Average soil CH4 flux from not directly-fertilized plots in 2021 excluding plot 201 (−0.40 μmol m−2 h−1) was a larger sink compared to the mean from the directly-fertilized plots excluding plot 202 (−0.236 μmol m−2 h−1) but they were still lower than that in 2022 (−0.585 μmol m−2 h−1). The differences were equally visible in conventional (−0.236 and −0.364 μmol m−2 h−1) and rye plots (−0.0209 and −0.539 μmol m−2 h−1) for directly-fertilized and non-directly fertilized, respectively and excluding plots 201 and 202. The soil CH4 flux in the no-pesticide cereal rye plot had some high peaks over 5 μmol m−2 h−1 in plot 104 on June 24 and July 15, which increased the average.
In the linear mixed model using both 2021 and 2022 data and including WEOC, soil temperature, soil moisture, agricultural practice, and pesticide inputs as fixed effects and date and plot as random effects, the only variable that was statistically significant was soil moisture. Soil moisture had a positive effect on CH4 fluxes, just like it did for N2O fluxes. As expected, plot 202 had a large positive offset of 0.378, when all the others ranged between −0.185 and 0.178.
In plot 201, a non-directly fertilized cereal rye plot with a medium pesticide level, we found some very high CH4 peaks on a few occasions in 2021 (Fig. 15). The soil CH4 fluxes reached higher than 4 μmol m−2 h−1 on six days and the maximum flux we measured was 117.6 μmol m−2 h−1 on September 3, the same day when the neighboring plot 202 had a large spike with 16.65 μmol m−2 h−1. Another high-level peak of 88.2 μmol m−2 h−1 in plot 201 was measured on June 24, 9 days after the second fertilization, when the fertilized cereal rye plot 104 also had a peak of 5.06 μmol m−2 h−1. It is clear that the soil moisture was generally higher than 40% in this plot, although that itself does not explain the high peaks (Fig. 15). It is possible that acetate concentration was high in this plot, which may have resulted in these high CH4 releases53 but we are unable to confirm this due to the lack of measurement.
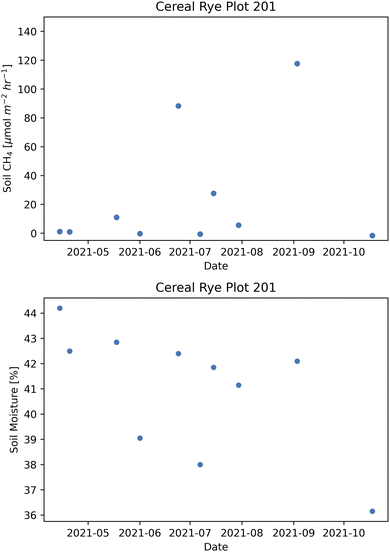 | ||
| Fig. 15 Soil surface methane (CH4) fluxes (top) and soil moisture levels (bottom) from plot 201 in 2021. | ||
Traditionally, biogenic CH4 emissions have been associated with methanogenesis under anaerobic conditions, but some studies have found that plants,54,55 fungi,56 algae57 and cyanobacteria58 also produce CH4 under aerobic conditions.59 Keppler et al. (2008)60 demonstrated the effect of temperature and UV radiation on CH4 emissions from pectin and polygalacturonic acid in vitro and Vigano et al. (2008)61 also found the similar effect from leaves. McLeod et al. (2008)55 found evidence that reactive oxygen species (ROS) from environmental stresses play an important role in CH4 formation by plants. Ernst et al. (2022)62 further found evidence for a CH4 formation by a cascade of radical reactions by Bacillus subtillis and Escherichia coli, triggered by ROS and ferrous iron (Fe2+). Methylated sulfur and N compounds are oxidatively demethylated by hydroxyl radicals and oxo-iron(IV) complexes ([FeIV![[double bond, length as m-dash]](https://www.rsc.org/images/entities/char_e001.gif) O]2+) to yield methyl radicals.62
O]2+) to yield methyl radicals.62
We hypothesize that high CH4 emissions in our study were potentially due to this radical reaction process because of the existence of biochar-derived ROS in the soil, under high temperature. Although testing this hypothesis is out of the scope of this paper, the finding of Zhou et al. (2023),63 where they found that 4% biochar additions increased CH4 emissions by 19.3%, is noteworthy. More studies are needed to investigate the impact of biochar on not just C in the soil but also on CH4 emissions and if these are from soil or from plants.
3.9 Soil GHG fluxes
It has been known that conservation practices that sequester soil C can enhance CH4 consumption64 but we found large heterogeneities in soil properties in the first year and observed very high soil CH4 flux events in three plots that had biochar, as described above. The mean soil CO2, N2O, and CH4 flux from plot 201 was 8.27 μmol m−2 s−1, 4.43 μmol m−2 h−1, and 24.97 μmol m−2 h−1. The mean of all the non-directly fertilized plots in 2021, excluding plot 201 for soil CO2, N2O, and CH4 fluxes, was 5.73 μmol m−2 s−1, 10.1 μmol m−2 h−1, and −0.404 μmol m−2 h−1. Although soil N2O emissions were more than 50% lower than the average, as is often discussed as a benefit of applying biochar,65–67 understanding why this plot emitted sixty times higher CH4 fluxes than other plots (not to also forget that the average was negative) will be important. More studies are needed to investigate the impact of biochar on not just C in the soil and N2O emissions but on GHG emissions as a whole from this process. This is especially important because the application of biochar may result in an unexpected consequence of substantially increased CH4 emissions, especially in high-temperature areas, such as tropical regions.Considering that the agricultural fields are usually fertilized by side-dressing as done in this study and because there are such heterogeneities, it also seems important to measure the rows that are both directly-fertilized and non-directly fertilized in the future. The soil average C-equivalent emissions using all directly-fertilized plot data were 317.9 and 71.0 mg m−2 h−1 in 2021 and 2022, respectively. If we averaged the directly-fertilized and non-directly fertilized plots values in 2021, those become 226.1 mg m−2 h−1, nearly 30% lower than the estimated amount. Considering that we had high N2O and CH4 emission events multiple times in 2021, it is clear that we also need to take measurements more frequently, as has been suggested by others in the past.68,69 Preferably automated measurements in both directly-fertilized and non-directly fertilized plots would be informative in better understanding the processes behind the hot moment events in the corn field.
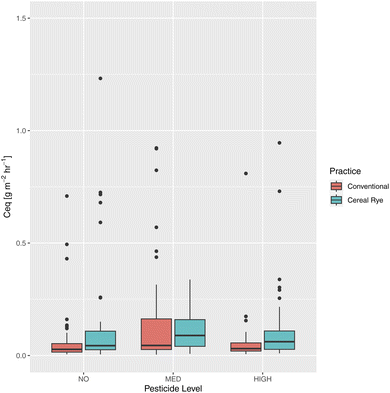
The average C equivalent soil GHG flux from directly-fertilized plots was 0.158 g m−2 h−1. We found significant differences between the practices (p-value = 6.811 × 10⁻⁵), with higher mean from cereal rye plots with 0.167 g m−2 h−1, compared to conventional plots with 0.151 g m−2 h−1 (Fig. 16). We also found significant differences between no and medium pesticide plots (p-value = 0.0023) and between medium and high pesticide plots (p-value = 0.0399). However, in the linear mixed model to predict total GHG fluxes using all data from directly-fertilized plots and including WEOC, NO3−–N, NH4+–N, soil temperature, soil moisture, agricultural practice, and pesticide inputs as fixed effects and date and plot as random effects, none of the variables was statistically significantly different. This is not surprising as many factors have led to different flux events at different points in this experiment.
In sum, from our limited experiment, we do not find strong evidence that pesticide application has a short-term impact on soil GHG fluxes. It is, however, important to note that some studies find that soil C changes rapidly in the short term but stabilizes in the long term (over 20 years) after the cessation of disturbance.39 Similar findings are available which suggest that soil GHG fluxes are only significantly changed a decade or more after the agricultural practice change is introduced.70,71 More frequent measurements and from more areas in the plots at a field scale would be necessary to better understand how pesticide application impacts GHG fluxes and the C sequestration potential in the long term.
4 Conclusions
We conducted a pilot-scale field study to quantify soil GHG fluxes in corn systems with two different agricultural practices and three different pesticide levels (none, medium, and high) in 2021 and 2022 in Georgia, USA. Yield and GHG fluxes were both higher in 2021 compared to 2022 and we also found differences in GHG fluxes on plots that were directly fertilized versus those that were not.In the linear mixed model using directly-fertilized plots in both 2021 and 2022 and including WEOC, NO3−–N, NH4+–N, soil temperature, soil moisture, agricultural practice, and pesticide inputs as fixed effects and date and plot as random effects, soil moisture was the only variable that was statistically significant for soil CO2 fluxes, N2O fluxes, and CH4 fluxes. Soil temperature was statistically significant only for soil CO2 fluxes. None of the variables was statistically significant to predict total GHG fluxes.
Intercrop with cowpeas did not work and there were many heterogeneities, such as the existence of biochar in some plots, which made the field campaign more challenging than we had anticipated. While these are clear limitations of our study, we also found high N2O and CH4 fluxes during our measurements from plots that had a high C/N ratio with the existence of biochar. Although more work needs to be conducted to provide more insights, our results show that biochar addition may have unintended consequences of increasing GHG fluxes substantially and needs careful validation.
Data availability
Datasets from this study are available on our website at https://www.saikawalab.com/published-datasets.Author contributions
ES, NB, AM, DW, and YW contributed to conceptualization and funding acquisition. ES and AA performed the greenhouse gas measurements, collected soil samples, and measured soil temperature and soil moisture. NB was responsible for the farm operations (planting, fertilizer and pesticide application, and harvesting) and collecting corn growth and development parameters. JH conduced soil extraction. ES wrote the original draft with input from AA and NB, and all authors reviewed the text.Conflicts of interest
The funding was provided by Syngenta Crop Protection LLC.Acknowledgements
The authors thank the University of Georgia (UGA) experimental farm managers for their help in irrigating and setting up the fence and other maintenance activities that were essential for this work. The authors also thank the University of Georgia students in hand weeding the plots. We are grateful for the meteorological data provided by the UGA Weather Network. We also thank the Emory undergraduate student Kelsey Park for his help in this research project. This project was funded by the Syngenta Crop Protection, LLC, Greensboro, North Carolina, USA.Notes and references
- E. Lokupitiya and K. Paustian, J. Environ. Qual., 2006, 35, 1413–1427 CrossRef CAS PubMed.
- Climate Change 2022 - Mitigation of Climate Change, ed. Intergovernmental Panel On Climate Change (Ipcc), Cambridge University Press, 1st edn, 2023, pp. 747–860 Search PubMed.
- M. Crippa, E. Solazzo, D. Guizzardi, F. Monforti-Ferrario, F. N. Tubiello and A. Leip, Nat. Food, 2021, 2, 198–209 CrossRef CAS PubMed.
- EPA, Inventory of U.S. Greenhouse Gas Emissions and Sinks 1990-2021, U.S. Environmental Protection Agency, Technical Report EPA 430-R-23-002, 2023 Search PubMed.
- M. Lognoul, N. Theodorakopoulos, M.-P. Hiel, D. Regaert, F. Broux, B. Heinesch, B. Bodson, M. Vandenbol and M. Aubinet, Soil Tillage Res., 2017, 167, 80–89 CrossRef.
- C. Snyder, T. Bruulsema, T. Jensen and P. Fixen, Agric., Ecosyst. Environ., 2009, 133, 247–266 CrossRef CAS.
- P. G. Falkowski, T. Fenchel and E. F. Delong, Science, 2008, 320, 1034–1039 CrossRef CAS PubMed.
- J. Six, S. D. Frey, R. K. Thiet and K. M. Batten, Soil Sci. Soc. Am. J., 2006, 70, 555–569 CrossRef CAS.
- W. R. Wieder, G. B. Bonan and S. D. Allison, Nat. Clim. Change, 2013, 3, 909–912 CrossRef CAS.
- R. Bardgett and E. Mcalister, Biol. Fertil. Soils, 1999, 29, 282–290 CrossRef.
- R. D. Bardgett, R. D. Lovell, P. J. Hobbs and S. C. Jarvis, Soil Biol. Biochem., 1999, 31, 1021–1030 CrossRef CAS.
- R. D. Bardgett, P. J. Hobbs and Ã. Frostegård, Biol. Fertil. Soils, 1996, 22, 261–264 CrossRef.
- S. D. Frey, M. Knorr, J. L. Parrent and R. T. Simpson, For. Ecol. Manage., 2004, 196, 159–171 CrossRef.
- F. T. de Vries and R. D. Bardgett, For. Ecol. Manage., 2012, 10, 425–432 Search PubMed.
- G. S. Khush, Genome, 1999, 42, 646–655 CrossRef CAS.
- M. A. Peterson, A. Collavo, R. Ovejero, V. Shivrain and M. J. Walsh, Pest Manage. Sci., 2018, 74, 2246–2259 CrossRef CAS.
- N. Dhankhar and J. Kumar, Mater. Today: Proc., 2023 DOI:10.1016/j.matpr.2023.03.766.
- S. Saroop and S. Tamchos, in Pesticides in the Environment, ed. A. Sharma, V. Kumar and B. Zheng, Elsevier, 2024, pp. 155–178 Search PubMed.
- C. S. Jacobsen and M. H. Hjelmsø, Curr. Opin. Biotechnol., 2014, 27, 15–20 CrossRef CAS.
- M. Onwona-Kwakye, K. Plants-Paris, K. Keita, J. Lee, P. J. V. d. Brink, J. N. Hogarh and C. Darkoh, Microorganisms, 2020, 8, 318 CrossRef CAS.
- P. Baweja, S. Kumar and G. Kumar, in Soil Health, ed. B. Giri and A. Varma, Springer International Publishing, Cham, 2020, pp. 265–285 Search PubMed.
- R. akter, M. B. Mukhles, M. M. Rahman, M. R. Rana, N. Huda, J. Ferdous, F. Rahman, M. H. Rafi and S. K. Biswas, Chemosphere, 2022, 304, 135379 CrossRef CAS.
- M. Pell, B. Stenberg and L. Torstensson, Ambio, 1998, 27, 24–28 Search PubMed.
- C. A. Kinney, K. W. Mandernack and A. R. Mosier, Soil Biol. Biochem., 2005, 37, 837–850 CrossRef CAS.
- J. Ćernohlávková, J. Jarkovský and J. Hofman, Ecotoxicol. Environ. Saf., 2009, 72, 80–85 CrossRef.
- J. Jiang, L. Chen, Q. Sun, M. Sang and Y. Huang, Atmos. Environ., 2015, 107, 62–69 CrossRef CAS.
- K. Spokas, D. Wang and R. Venterea, Soil Biol. Biochem., 2005, 37, 475–485 CrossRef CAS.
- K. Spokas and D. Wang, Atmos. Environ., 2003, 37, 3501–3507 CrossRef CAS.
- D. Seghers, S. D. Siciliano, E. M. Top and W. Verstraete, Soil Biol. Biochem., 2005, 37, 187–193 CrossRef CAS.
- M. Saeki and K. Toyota, Biol. Fertil. Soils, 2004, 40, 110–118 CrossRef CAS.
- A. W. Ratcliff, M. D. Busse and C. J. Shestak, Appl. Soil Ecol., 2006, 34, 114–124 CrossRef.
- C. M. Cornish, O. F. Johnson, S. Bansal, J. A. Meier, T. D. Harris and J. N. Sweetman, Sci. Total Environ., 2024, 933, 172881 CrossRef CAS PubMed.
- D. Tilman, C. Balzer, J. Hill and B. L. Befort, Proc. Natl. Acad. Sci. U. S. A., 2011, 108, 20260–20264 CrossRef CAS PubMed.
- P. Koli, N. R. Bhardwaj and S. K. Mahawer, in Climate Change and Agricultural Ecosystems, ed. K. K. Choudhary, A. Kumar and A. K. Singh, Woodhead Publishing, 2019, pp. 65–94 Search PubMed.
- O. Erenstein, M. Jaleta, K. Sonder, K. Mottaleb and B. Prasanna, Food Secur., 2022, 14, 1295–1319 CrossRef.
- C. I. Ludemann, A. Gruere, P. Heffer and A. Dobermann, Sci. Data, 2022, 9, 501 CrossRef PubMed.
- USDA ERS - Food Access Research Atlas, https://www.ers.usda.gov/data-products/food-access-research-atlas/.
- USDA NASS, 2023, https://www.nass.usda.gov/.
- A. Franzluebbers, Soil Tillage Res., 2005, 83, 120–147 CrossRef.
- Y. Wang, E. Saikawa, A. Avramov and N. S. Hill, Front. Clim., 2022, 3, 742320 CrossRef.
- S. J. W. Peters, E. Saikawa, D. Markewitz, L. Sutter, A. Avramov, Z. P. Sanders, B. Yosen, K. Wakabayashi, G. Martin, J. S. Andrews and N. S. Hill, J. Environ. Qual., 2020, 49, 268–280 CrossRef CAS.
- Cover Crops - Farm Management | Sustainable Agriculture at UGA, https://sustainagga.caes.uga.edu/management/cover-crops.html.
- Organic Cover Crop Seed Production in Georgia, https://extension.uga.edu/publications/detail.html?number=B1436title=organic-cover-crop-seed-production-in-georgia.
- A. Bruckner, A. Schmerbauch, L. Ruess, F. Heigl and J. Zaller, Ecotoxicol. Environ. Saf., 2019, 174, 506–513 CrossRef CAS.
- S. Jezierska-Tys, J. Joniec, J. Bednarz and E. Kwiatkowska, Agriculture, 2021, 11, 787 CrossRef CAS.
- Irrigation Reference Guide for Corn, Cotton, Peanuts, and Soybeans, https://extension.uga.edu/publications/detail.html?number=C1189title=irrigation-reference-guide-for-corn-cotton-peanuts-and-soybeans.
- M. Hollander and D. A. Wolfe, Nonparameteric Statistical Methods, John Wiley & Sons, New York, NY, 1973 Search PubMed.
- R Core Team, R: A Language and Environment for Statistical Computing, R Foundation for Statistical Computing, Vienna, Austria, 2023 Search PubMed.
- H. Wickham, R. François, L. Henry, K. Müller and D. Vaughan, Dplyr: A Grammar of Data Manipulation, 2023 Search PubMed.
- D. M. Bates, lme4: Mixed-Effects Modeling with R, 2005 Search PubMed.
- J. Jiang and T. Nguyen, in Linear and Generalized Linear Mixed Models and Their Applications, ed. J. Jiang and T. Nguyen, Springer, New York, NY, 2021, pp. 1–61 Search PubMed.
- W. Liu, X.-T. Lü, Y. Yang, L. Hou, C. Shao, W. Yuan, Q. Pan and L. Li, J. Geophys. Res.: Biogeosci., 2022, 127, e2022JG006877 CrossRef CAS.
- L. Xiao, F. Liu, H. Xu, D. Feng, J. Liu and G. Han, Environ. Chem. Lett., 2019, 17, 1347–1352 CrossRef CAS.
- F. Keppler, J. T. G. Hamilton, M. Braß and T. Röckmann, Nature, 2006, 439, 187–191 CrossRef CAS PubMed.
- A. R. McLeod, S. C. Fry, G. J. Loake, D. J. Messenger, D. S. Reay, K. A. Smith and B.-W. Yun, New Phytol., 2008, 180, 124–132 CrossRef CAS.
- K. Lenhart, M. Bunge, S. Ratering, T. R. Neu, I. Schüttmann, M. Greule, C. Kammann, S. Schnell, C. Müller, H. Zorn and F. Keppler, Nat. Commun., 2012, 3, 1046 CrossRef PubMed.
- T. Klintzsch, G. Langer, G. Nehrke, A. Wieland, K. Lenhart and F. Keppler, Biogeosciences, 2019, 16, 4129–4144 CrossRef CAS.
- M. Bižić, T. Klintzsch, D. Ionescu, M. Y. Hindiyeh, M. Günthel, A. M. Muro-Pastor, W. Eckert, T. Urich, F. Keppler and H.-P. Grossart, Sci. Adv., 2020, 6, eaax5343 CrossRef.
- L. Ernst, U. Barayeu, J. Hädeler, T. P. Dick, J. M. Klatt, F. Keppler and J. G. Rebelein, Nat. Commun., 2023, 14, 4364 CrossRef CAS PubMed.
- F. Keppler, J. T. G. Hamilton, W. C. McRoberts, I. Vigano, M. Braß and T. Röckmann, New Phytol., 2008, 178, 808–814 CrossRef CAS.
- I. Vigano, H. van Weelden, R. Holzinger, F. Keppler, A. McLeod and T. Röckmann, Atmos. Environ., 2009, 5, 937–947 Search PubMed.
- L. Ernst, B. Steinfeld, U. Barayeu, T. Klintzsch, M. Kurth, D. Grimm, T. P. Dick, J. G. Rebelein, I. B. Bischofs and F. Keppler, Nature, 2022, 603, 482–487 CrossRef CAS.
- Y. Zhou, D. Li, Z. Li, S. Guo, Z. Chen, L. Wu and Y. Zhao, Int. J. Environ. Res. Public Health, 2023, 20, 927 CrossRef CAS.
- J. M.-F. Johnson, A. J. Franzluebbers, S. L. Weyers and D. C. Reicosky, Environ. Pollut., 2007, 150, 107–124 CrossRef CAS.
- T. J. Clough and L. M. Condron, J. Environ. Qual., 2010, 39, 1218–1223 CrossRef CAS.
- R. K. Shrestha, P.-A. Jacinthe, R. Lal, K. Lorenz, M. P. Singh, S. M. Demyan, W. Ren and L. E. Lindsey, J. Environ. Qual., 2022 DOI:10.1002/jeq2.20475.
- S. Jeffery, F. G. A. Verheijen, C. Kammann and D. Abalos, Soil Biol. Biochem., 2016, 101, 251–258 CrossRef CAS.
- P. R. Grace, T. J. van der Weerden, D. W. Rowlings, C. Scheer, C. Brunk, R. Kiese, K. Butterbach-Bahl, R. M. Rees, G. P. Robertson and U. M. Skiba, J. Environ. Qual., 2020, 49, 1126–1140 CrossRef CAS.
- A. F. Charteris, D. R. Chadwick, R. E. Thorman, A. Vallejo, C. A. de Klein, P. Rochette and L. M. Cárdenas, J. Environ. Qual., 2020, 49, 1092–1109 CrossRef CAS.
- C. van Kessel, R. Venterea, J. Six, M. A. Adviento-Borbe, B. Linquist and K. J. van Groenigen, Global Change Biol., 2013, 19, 33–44 CrossRef PubMed.
- J. Six, S. M. Ogle, F. Jay breidt, R. T. Conant, A. R. Mosier and K. Paustian, Global Change Biol., 2004, 10, 155–160 CrossRef.
Footnote |
| † Electronic supplementary information (ESI) available. See DOI: https://doi.org/10.1039/d4va00105b |
| This journal is © The Royal Society of Chemistry 2024 |

