 Open Access Article
Creative Commons Attribution 3.0 Unported Licence
Scandia-doped zirconia for the electrochemical detection of hazardous dihydroxybenzene (DHB) isomers in water†
Angelo
Ferlazzo
 *ab,
Antonino
Gulino
ab and
Giovanni
Neri
 *c
*c
aDepartment of Chemical Sciences, INSTM Research Unit, University of Catania, Viale Andrea Doria 6, 95125, Catania, Italy
bINSTM UdR of Catania, Viale Andrea Doria 6, 95125 Catania, Italy
cDepartment of Engineering, University of Messina, Cda Di Dio, 98166, Messina, Italy
First published on 31st July 2024
Abstract
Modified yttria- and scandia-doped zirconium oxides were exploited for the development of an effective electrochemical sensor for the simultaneous detection of dihydroxy benzene (DHB) isomers, i.e. hydroquinone (HQ), catechol (CC) and resorcinol (RS). A morphological, microstructural and electrochemical characterization, by scanning electron microscopy (SEM), infrared spectroscopy (FT-IR), X-ray diffraction (XRD), electrical impedance spectroscopy (EIS), cyclic voltammetry (CV), and square wave voltammetry (SWV), of pure zirconium oxide, zirconium oxide doped with 8% yttria and zirconium oxide doped with 10% scandium (ZrO2, ZrO28Y, and ZrO210Sc, respectively), were carried out. Modified electrochemical sensors were fabricated by using a screen-printed carbon electrode (SPCE). Electrochemical analysis conducted in phosphate buffer solution (0.01 M PBS; pH = 7.4) showed the great ability of the ZrO210Sc/SPCE sensor to detect simultaneously DHB isomers with high sensitivity. SWV analysis performed with this sensor showed the lowest limits of detection (LODs) among all sensors tested, with values of 0.92, 0.69, and 5.61 nM, for hydroquinone (HQ), catechol (CC), and resorcinol (RS), respectively. In addition, the sensor shows good repeatability and simultaneous detection capability for all DHB isomers. This sensor also showed excellent results for the detection of HQ, CC, and RS in tap and mineral water samples, with good recoveries (90–116%).
Environmental significancePhenols and their derivatives cause serious health problems for all living organisms. In fact, they are highly toxic if ingested or inhaled, cause severe skin burns and eye damage, and can cause genetic alterations and organ damage. Unfortunately, they are the waste products in the waters of many industries, such as those producing paints, pharmaceuticals, oil and gas, etc. The legal limits are 0.5 mg L−1 (Legislative Decree 152/06). In this study, we developed an easy-to-use, fast electrochemical sensor based on scandia-doped ZrO2 to monitor these hazardous pollutants in water with a detection limit of less than 0.5 μg L−1. Zirconium oxide boasts low environmental impact, has an important role in advancing technologies aligned with eco-friendly principles and plays a crucial role in promoting greener processes. |
Introduction
There are many chemicals derived from manufacturing chemical processes, pharmaceutical, pesticide, and petrochemical industries and others that pollute our environment.1,2 In particular, the US Environmental Protection Agency (EPA) and the European Union (EU) have pointed out the high environmental toxicity of some phenols used by these industries, such as the three dihydroxybenzene (DHB) isomers: hydroquinone (HQ), catechol (CC) and resorcinol (RC).3–5 DHBs are mainly found as water pollutants and thus are a hazard to humans because can generate serious diseases such as cancer, kidney damage and death.6 The harm to human health is combined with the high toxicity of these compounds to animals and plants as well in addition to being compounds that have long degradation times.7 Given the hazardous nature of DHBs, it is essential to monitor these isomers by highly sensitive, fast, and easy-to-use analytical techniques.The detection and determination of biomolecules in the biological field,8 and of pollutants in soil, water and air, are particularly important because they generate serious health and environmental problems. Analytical and electroanalytical methods have long sought increasingly reliable, fast, accurate, and inexpensive results. In fact, the determination of organic pollutants in real samples is very complex because of the matrices and low concentrations of compounds to detect.9 The most widely used analytical techniques for environmental determination are chromatographic techniques coupled with detection systems.10,11 The use of these techniques, however, has many disadvantages for example pretreatment of the sample to be analyzed, very long times, and difficult and expensive methods. Other analytical techniques often investigated for this purpose are optical techniques, such as fluorometry,11 that allow detection of very low concentrations but often lack selectivity and this is a major problem in the study of real matrices of natural samples where significant interferents are present. Other analytical techniques used are gas chromatography with mass spectrometry detection12 and spectrophotometry,13 all of which have the same limitations as listed above.
Hence, the need for new methods that can be used directly at polluted sites is demanding.14–16 Many studies for monitoring pollutants report the use of metal oxides for both the development of gas sensors17 and electrochemical sensors.18 The development of fast, accurate, and inexpensive electrochemical sensors is therefore an excellent alternative to these analytical techniques. However, carbon or gold electrodes have a poor electrochemical response in addition to not being able to detect the three isomers simultaneously.19 Numerous sensors modified with carbon nanomaterials for the detection of hydroquinone (HQ), catechol (CC) and resorcinol (RC) are reported in the literature. For example, graphite,17 graphene oxide (GO),20 and carbon nanotubes (CNTs),21 were reported, but also a variety of metal oxides were used for modifying bare electrodes such as zinc oxide (ZnO),22 titanium dioxide (TiO2),23,24 and tungsten oxide (WO3).25
ZrO2 has been little studied as a sensitive material for electrode development due to a high forbidden band above 5 eV, which classifies it as an insulator.26 Even though pure ZrO2 has promising electrochemical properties, it has a low conductivity. Because of this characteristic, it is often doped with rare earth elements such as Yb, Eu, Y, Sc, etc. that improve the conductivity improving also electrochemical performances.27 The conductivity increases with the doping level; however, too high doping levels can decrease the conductivity of ZrO2.28 The optimal doping loading depends on the doping rare earth elements.29–32 High conductivity zirconia has been used as a sensing layer in various chemical sensors, for example monitoring ammonia with capacitive sensors,33 for developing oxygen and NOx electrochemical sensors or combined with graphene oxide for electrochemical detection of pollutants in water.34,35 In a previous paper, the excellent performance of zirconia doped with yttria for monitoring hydrogen in air,36 and for the electrochemical determination of tyrosine,37 was investigated. In this paper, we extended the investigation to the use of rare earth-doped zirconia for the development of electrochemical sensors for pollutants in water. Furthermore, the study provides a valuable proposal for the development of simple and low-cost sensors, as they use a sensing material that does not need to be synthesised by complicated laboratory processes.
Experimental
Chemicals
Hydroquinone (HQ), catechol (CC), and resorcinol (RS) were supplied by Sigma-Aldrich all with a purity greater than ≥99%. ZrO2 has a particle size < 100 nm and a surface area ≥ 25 m2 g−1, ZrO28Y (8 mol% yttrium) shows a crystallite size of 5–10 nm and surface area ≥ 100 m2 g−1, ZrO210Sc (10 mol% scandium) has a surface area of 8–12 (m2 g−1) with a particle size of 0.5 to 0.7 μm. All compounds were purchased from Sigma-Aldrich. The sample codes are as follows: ZrO20Y, for pure zirconium oxide, ZrO28Y, for yttrium-doped zirconium oxide (8 mol% yttrium), and ZrO210Sc, for scandium-doped zirconium oxide (10 mol% scandium).Characterization methods
The microstructure and morphology of all samples were analyzed through different techniques. Scanning electron microscopy (SEM) using Zeiss 1540XB FE SEM equipment (Zeiss, Germany) operating at 10 kV was used. The elemental composition of the samples was studied by energy dispersive X-ray spectroscopy (EDX). IR spectroscopy analyses were performed with a PerkinElmer Spectrum 100 spectrometer equipped with a universal ATR sampling accessory using a range from 4000 to 400 cm−1 with a resolution of 4.0 cm−1 at room temperature. X-ray diffraction (XRD) spectra were recorded using a Bruker D8 Advance A 25 X-ray diffractometer operating at 40 kV and in the range 10–80°(2-theta), with an increasing rate of 0.01° s−1. The working electrodes used were purchased from DropSens, Spain, selecting the screen-printed carbon electrode (SPCE) type.Fabrication of the modified electrodes
Sensors tested with ZrO20Y, ZrO28Y and ZrO210Sc were prepared by the drop casting technique. Specifically, 1 mg of substance was dispersed in 1 mL of distilled water for 10 min. Then 10 μL of suspension was deposited on a commercial screen-printed carbon electrode (SPCE). The sensors (ZrO20Y/SPCE, ZrO28Y/SPCE and ZrO210Sc/SPCE) were allowed to dry at room temperature for 24 hours.Electrochemical measurements
Electrochemical characterization was performed by electrical impedance spectroscopy (EIS) using a galvanostatic potentiostat from Metrohm Autolab. Cyclic voltammetry and square wave voltammetry were used for electrochemical analysis using a DropSens μStat 400 Potentiostat equipped with DropView 8400 software for data acquisition. The sensors were characterized by cyclic voltammetry (CV) and square wave voltammetry (SWV) using a buffer solution with a concentration of 0.01 M at pH 7.4 (PBS).CV tests were performed at a scan rate of 50 mV s−1 in the potential range of −0.4 to 1.4 V, varying the concentration of the analyte under test. SWV tests were conducted at a frequency of 3 Hz in the potential range between −0.3 and 1 V, using a potential step (Estep) of 0.005 V, and a potential amplitude (Eamp) of 0.05 V. The calibration curves were obtained by plotting the faradaic current vs. analyte's concentration. Sensitivity was calculated using the slope of the calibration curve obtained from the SWV analysis (y = mx + b) divided by the area of the electrode used (0.125 cm2).
Real sample analysis
Real samples were analyzed using mineral water and tap water in which 300 μM of each isomer was added and SWV measurements were made to quantify the concentration in real samples.Results and discussion
Morphological and microstructural characteristics
The samples were first investigated by SEM-EDX analysis to verify their morphology and composition (see Fig. 1a–e). All samples show spherical nanoparticles with diameters between 15 and 32 nm. EDX elemental analysis of pure ZrO20Y sample shows only the presence of Zr and O elements. In the doped samples, Y or Sc are also noticed as major components and C as a contaminant. Calculations from the EDX analyses showed a Y content of 8.85% for the sample ZrO28Y and 10.76% of Sc in the sample ZrO210Sc, which agree, within the experimental error, with the theoretical content.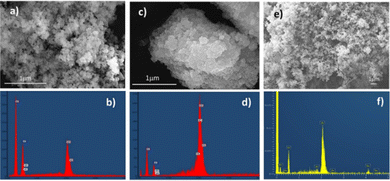 | ||
| Fig. 1 SEM image and EDX of (a) and (b) ZrO20Y sample; (c) and (d) ZrO28Y sample; (e) and (f) ZrO210Sc sample. | ||
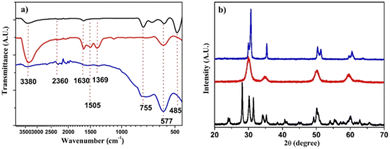
Fig. 2a shows the FT-IR analyses of the three samples. The scan was performed in the range of 4000–400 cm−1. The pure ZrO2 sample shows a broad absorption band in the range 3400–3000 cm−1 generated by O–H stretching, and a narrower peak at 1632 cm−1 due to O–H–O scissor bending of the water molecules adsorbing on the surface of the material. Significantly, the peak present at 2360 cm−1 is attributed to the stretching vibration of the zirconium–hydroxyl bond (Zr–OH).38 It is also possible to highlight that the pure ZrO2 is in its monoclinic phase thanks to the peaks present at 755, 577, and 485 cm−1.39 The sample doped with 8 mol% yttria shows two absorption peaks, at 1506 cm−1 and 1373 cm−1, not present in the pure sample. These signals were attributed to the presence of CO2 on the surface coming from the atmosphere, thus suggesting the presence of active sites for this gas, not present in the pure ZrO2. In the ZrO210Sc sample, on the other hand, the peaks related to the OH of water at 3380 and 1630 cm−1 present a lower intensity, indicative of a lower ability to adsorb water on its surface. We can still see the absorption attributed to the presence of CO2 on the surface, although with much less intensity with respect to the sample doped with yttria, suggesting that the active sites for CO2 are in minor concentration and/or with a lower capacity of adsorption. Fig. 2b shows the XRD analysis of all samples; ZrO20Y displays diffraction peaks at 2θ angles of 28.2°, 31.5°, 38.5°, 50.1°, and 59.8° corresponding to the [−111], [111], [120], [022] and [131] planes of ZrO2 in the monoclinic state.40 The ZrO28Y sample shows peaks at 30°, 35°, 50°, 60° and 74° corresponding to the [101], [002], [112], [103] and [004] planes of the cubic phase, as expected for this yttria-doped zirconia.41 The ZrO210Sc sample displays a XRD spectrum in which are well visible the diffraction peaks of both the cubic phase and the rhombohedral one.39
Electrochemical characteristics
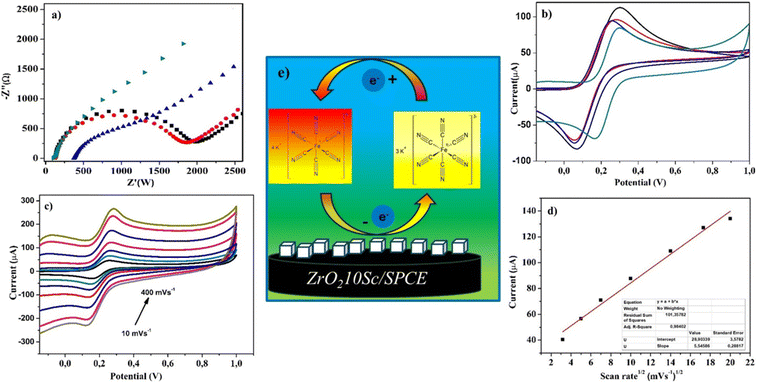
Electrochemical characteristics of the fabricated electrodes have been investigated by EIS and CV in ferrocyanide. First, CV analysis of all samples was performed to acquire information on their behavior in a 0.01 M buffer solution (PBS) at pH 7.4, in the potential range from −0.4 to 1.2 V (Fig. S1†). No evident faradaic peak was observed with all sensors. Notably, ZrO210Sc/SPCE shows a wider CV cycle, which can be indicative of a high surface area.EIS analyses were performed in the presence of a solution of 10 mM [Fe(CN)6]3−/4− and 0.1 M KCl with a frequency range from 0.1 Hz to 105 Hz (amplitude 5 mV) with an applied potential of 0.25 V. Nyquist diagrams for studying the electrochemical properties of SPCE, ZrO20Y/SPCE, ZrO28Y/SPCE and ZrO210Sc/SPCE sensors are shown in Fig. 3. It is well known that the semicircle observed at higher frequencies is attributed to the resistance in charge transfer while the linear part at low frequencies is associated with the diffusion process on the sensor.42 The ZrO210Sc/SPCE sensor shows a depressed semicircle compared to the other sensors, indicating a better electron transfer capability.
The electrochemical behavior of the SPCE, ZrO20Y/SPCE, ZrO28Y/SPCE and ZrO210Sc/SPCE sensors was also studied by CV in K3[Fe(CN)6] 10 mM solution at a scan rate of 50 mV s−1 (Fig. 3b).43 In all tested sensors, the CV curve showed a pair of well-defined redox peaks due to the normal one-electron reversible redox behavior of the [Fe(CN)6]3−/4− system, with the ZrO210Sc/SPCE sensor showing a lower peak current than all the other sensors tested. The electrochemical active area of the bare electrode (SPCE) and the modified electrode (ZrO210Sc/SPCE) was calculated using the Randles–Ševčik equation ([A] = voltammetric current, n = number of electrons transferred in the electrochemical reaction (n = 1), F = Faraday constant (F = 96![[thin space (1/6-em)]](https://www.rsc.org/images/entities/char_2009.gif) 485.3365 C mol−1), A = electrode area [cm2], and C = concentration of the redox probe), in the presence of ferro/ferricyanide as a redox probe.44
485.3365 C mol−1), A = electrode area [cm2], and C = concentration of the redox probe), in the presence of ferro/ferricyanide as a redox probe.44
A decrease of the active area, from 219.8 to 164.9 cm2, was found for the ZrO210Sc/SPCE sensor.45 On the other hand, a peak potential difference of only 122 mV was registered for the ZrO210Sc/SPCE sensor compared with the observed peak potential differences of 300, 218, and 195 mV for the SPCE, ZrO20Y/SPCE, and ZrO28Y/SPCE sensors, respectively. This finding is a further confirmation of the enhanced ability of the modified ZrO210Sc/SPCE sensor to promote electron transfer by promoting the redox reaction. The behavior of the modified ZrO210Sc/SPCE sensor, varying the scan rate from 25 to 400 mV s−1, was investigated by CV with a 10 mM K3[Fe(CN)6] solution. The results reported in Fig. 3c show an increase in the oxidation peak as the scan rate increases. The study of the relationship between peak current and scan rate showed a linear trend with the square root of scan rate (Fig. 3d), suggesting that the electrochemical process is diffusion controlled.
Electroanalytical properties vs. HQ, CC, and RS determination
One of the most important concerns in the determination of the DHB isomers by electrochemical techniques is their simultaneous determination. Therefore, as a preliminary step, some tests were carried out using LSV and SWV as voltammetric techniques in the simultaneous presence of all isomers of DHB. LSV and SWV analyses were conducted with the bare SPCE and the newly developed ZrO20Y/SPCE, ZrO28Y/SPCE and ZrO210Sc/SPCE sensors, in a solution containing 100 μM of each of the three DHB isomers in 0.01 M PBS (pH 7.4).Fig. S2† shows LSV of the SPCE and ZrO20Y/SPCE sensors in a solution containing 100 μM of HQ, CC, and RS. On both sensors (Fig. S2a and b†), two signals at about 0.19 and 0.59 V are visible; the former is due to the oxidation of HQ and CC and the latter due to the oxidation of RS. This result shows that the SPCE and ZrO2/SPCE are unable to separate the signal related to HQ and CC. With the ZrO28Y/SPCE sensor (Fig. S2c†), oxidation peaks at 0.06, 0.148, and 0.574 V, due to HQ, CC, and RS oxidation, respectively, were observed. The peak at 0.06 V appears as a weak shoulder of the main peak at 0.148 V. Instead, the ZrO210Sc/SPCE sensor exhibits an excellent ability to separate the HQ and CC isomers (Fig. S2d†), showing two well separated oxidation peaks, respectively at 0.03 and 0.148 V. In addition, also the oxidation peak of RS at 0.578 is well separated, demonstrating that this sensor can be used for the simultaneous determination of the DHB isomers.
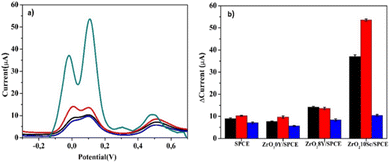
Fig. 4a reports the SWV analyses carried out under the same conditions of the previous LSV tests. SWV measurements reproduced the LSV results, so confirming the ZrO210Sc/SPCE sensor as the best-performing one in the separation of the three DHB isomers. It is also noteworthy that this is also accompanied by a very higher Ipa compared to all other sensors tested (Fig. 4b). For these reasons, subsequent analyses will focus on the study of sensing HQ, CC and RS using the ZrO210Sc/SPCE sensor.
To study the effect of varying the scan rate and concentration of the DHB isomers on the ZrO210Sc/SPCE sensor, CV analysis was carried out and presented in detail in Fig. S3 and S4.† Fig. S3† shows cyclic voltammograms of HQ, CC, and RS (100 μM) in PBS at pH 7.4 using ZrO210Sc/SPCE as a function of scan rate (2–400 mV s−1). The Ipa of HQ, CC, and RS increased with increasing scan rate. The peak oxidation current of HQ, CC, and RS increased linearly with the scan rate, implying that the redox process is affected by the surface adsorption of DHB isomers.
From the studies carried out at different concentration of the DHB isomers, a remarkable increase of anodic peak current as the concentration of DHB isomers increased was noted (Fig. S4†). The results show two linear trends, one at lower concentration (0 to 100 μM) and another, ranging from 150 to 1500 μM, for all HQ, CC, and RS isomers. The sensitivity of the sensor for the DHB analytes at low concentration between 0 and 100 μM was calculated to be 4.619, 4.852 and 0.651 μA μmol−1 cm−2 for HQ, CC and RS, respectively. For higher concentrations between 150 and 1000 μM, the sensitivity is 0.736, 0.776 and 0.140 μA μmol−1 cm−2, respectively. The presence of two linear trends can be explained as follows: at low concentrations the analyte reacts more rapidly as there are many active sites present on the sensor surface that promote the oxidation reaction. On increasing the analyte concentration, these sites become saturated and thus a decrease in the sensitivity is observed.
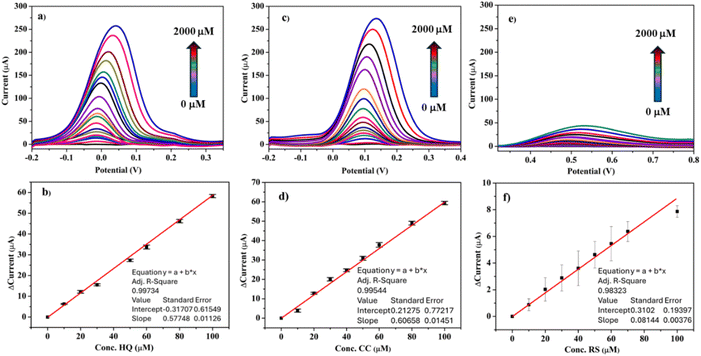
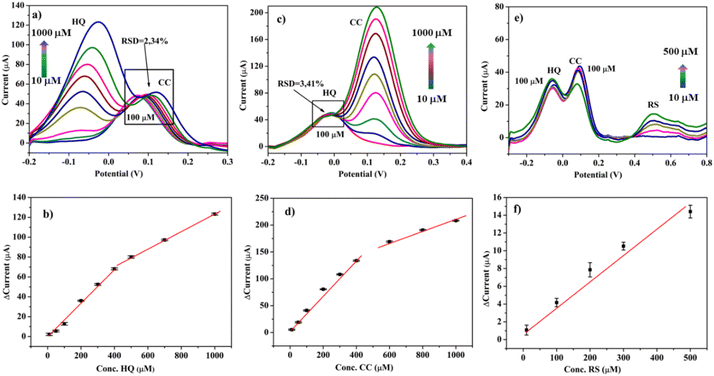
As reported above, SWV was found to be the best technique for the electroanalytical determination of the DHB isomers. From these tests (see Fig. 5), the ZrO210Sc/SPCE sensor behaviour vs. the DHB isomer concentration was confirmed. Two linear calibration ranges, one at low concentrations (0–100 μM) and another one at high concentrations (150–1000 μM), were calculated, in agreement with the results of CV analyses.
Tests were also carried out for the simultaneous detection of the DHB isomers with the ZrO210Sc/SPCE sensor. Fig. 6 shows the detection of isomers HQ and CC at different concentrations while keeping the concentration of the other constant. The linear correlation in the range of low concentration is also shown in Fig. 7, allowing us to calculate the limit of detection (LOD) for HQ, CC, and RS. The obtained results show a LOD value of 0.92, 0.69, and 5.61 nM respectively.
The LOD obtained shows that the ZrO210Sc/SPCE sensor can detect quantities of phenols below the legal limits (Legislative Decree 152/06), which defines the concentration of phenols tolerated in water up to 0.5 mg L−1.
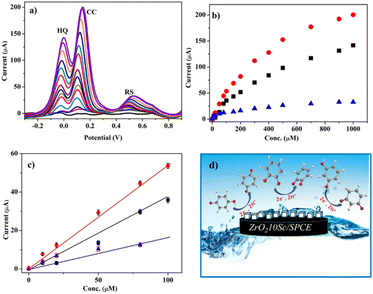
Fig. 7a shows the ability of the ZrO210Sc/SPCE sensor to detect the change in the concentration of HQ from 0 to 1000 μM while keeping the concentration of the CC isomer constant at 100 μM, and vice versa (see Fig. 7b). From these results, it appears that the response to HQ and CC is not influenced by the simultaneous presence of the two phenol isomers. Fig. 7c shows the sensor's ability to simultaneously detect the change in concentration of all three DHB isomers at low concentrations.
From the morphological and electrochemical study of doped zirconia, a mechanism of phenol detection can be elaborated (Fig. 7d). In fact, the presence of active sites, also highlighted by FTIR analysis, and the mechanism of phenol oxidation due to surface absorption on the electrode (CV and EIS analysis) suggest that phenols can interact with OH groups on the surface of scandium-doped zirconia by creating hydrogen bonds with the O groups present on the surface.17,32 This interaction produces an exchange of two hydrogens and two protons which then generates a deprotonation of the OH groups and subsequent oxidation of the hydroxyl groups of the phenols.46–48
Table 1 compares the results obtained with those found in the literature. The data show that the ZrO210Sc/SPCE sensor exhibits similar or superior performances to other sensors already published, highlighting that the proposed one has good prospects for use in the determination of DHB isomers.
| Sensor | Method | Linear range (μM) | LOD (μM) | Real sample | Ref. | ||
|---|---|---|---|---|---|---|---|
| HQ | CC | RS | |||||
| P–RGO/GCE | DPV | 5–120 | 0.08 | 0.18 | 0.62 | Tap water | 49 |
| Gr/SPE | PLS | 1–50 | 2.6 | 4.1 | 2.3 | Tap water | 50 |
| RGO–MWNTs–GCE | DPV | 5–540 | 2.6 | 1.8 | 1.6 | River water | 51 |
| MWCNTs@RGONR/GCE | DPV | 15–1300 | 3.89 | 1.73 | 5.77 | Tap and river water | 52 |
| PCFCuNP | AMP | 1.6–1300 | 1.1 | 0.53 | 3.3 | Sea and tap water | 53 |
| pEDOT/DGNs/GCE | CV | 5–300 | 0.95 | 1.6 | 1.6 | Cosmetic products | 54 |
| ZrO210Sc/SPCE | SWV | 0–100 | 0.92 | 0.69 | 5.61 | Tap and mineral water | This work |
Repeatability, reproducibility, and long-term stability
The repeatability and long-term stability of the ZrO210Sc/SPCE sensor were studied in solutions containing 100 μM DHB isomers. The repeatability of the sensor, assessed by calculating the relative standard deviations of 7 measurements, was 1.47, 2.30, and 0.57% for HQ, CC, and RS, respectively. Long-term stability studies were carried out by repeating the analyses under the same working conditions on the same sensor for 60 days. The response of the sensor for the three isomers after this period was evaluated to be about 86% for HQ, 88% for CC and 94% for RS, of the initial response. These results demonstrated that the ZrO210Sc/SPCE sensor shows good repeatability and stability.Real sample analysis
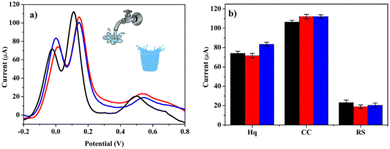
The applicability of our sensor was tested in the analysis of real samples by measuring DHB isomers in mineral and tap water after diluting them using PBS at pH = 7.4 (1![[thin space (1/6-em)]](https://www.rsc.org/images/entities/char_2009.gif) :
:![[thin space (1/6-em)]](https://www.rsc.org/images/entities/char_2009.gif) 6). The standard addition method (300 μM) was used to detect DHB isomers and to quantify them (Fig. 8). The tap water analysis showed recoveries between about 95 and 113%. On the other hand, for mineral water, recoveries ranged from 90 to 116%.
6). The standard addition method (300 μM) was used to detect DHB isomers and to quantify them (Fig. 8). The tap water analysis showed recoveries between about 95 and 113%. On the other hand, for mineral water, recoveries ranged from 90 to 116%.
Conclusion
In summary, in this work, the interesting electrochemical properties of the scandium (10%)-doped zirconia sample for the simultaneous determination of DHB isomers, hydroquinone, catechol and resorcinol have been presented. To investigate the morphological and microstructural characteristics of this material, SEM-EDX, FTIR and XRD analyses were carried out. Electrochemical studies (CV, EIS, LSV, and SWV) were conducted comparing the performance of two different zirconium oxide samples doped with yttria (8%) and scandium (10%). The results demonstrated the improved ability of the developed ZrO210Sc/SPCE sensor to simultaneously detect DHB isomers. SWV analysis enabled good sensitivity towards DHBs and a low LOD value for all three isomers. The ZrO210Sc/SPCE sensor also showed excellent repeatability and long-term stability, as well as good performances when tested for monitoring DHBs in real tap and mineral water samples. Lastly, interestingly, the developed sensor represents the first electrochemical sensor using the scandium-doped zirconia sensing material, which represents a great advantage in terms of easy availability and material reproducibility in terms of its physical and chemical properties.Data availability
The data supporting this article have been included as part of the ESI.†Author contributions
The manuscript was written through contributions of all authors. All authors have given approval to the final version of the manuscript.Conflicts of interest
There are no conflicts to declare.Acknowledgements
This work has been partially funded by European Union (NextGeneration EU), through the MUR-PNRR project SAMOTHRACE (ECS00000022).Notes and references
- Z. Wang, G. W. Walker, D. C. Muir and K. Nagatani-Yoshida, Environ. Sci. Technol., 2020, 54(5), 2575–2584 CrossRef CAS PubMed.
- K. A. M. Said, A. F. Ismail, Z. A. Karim, M. S. Abdullah and A. Hafeez, Process Saf. Environ. Prot., 2021, 151, 257–289 CrossRef.
- Emergency Planning and Community Right-to-Know Act (EPCRA) Section 313 Chemical List for Reporting Year 2014, available from, https://www.epa.gov/toxics-release-inventory-triprogram/tri-chemical-list-ry-2014-including-toxic-chemical-categories, (EPA 2008 Toxic Release Inventory National Analysis), accessed, December, 2015, available from, https://www.epa.gov/ Search PubMed.
- European Commission, The New EU Chemicals Legislation-REACH, European Commission, Brussels, Belgium, 2006 Search PubMed.
- T. Xie, Q. Liu, Y. Shi and Q. Liu, J. Chromatogr. A, 2006, 1109(2), 317–321 CrossRef CAS.
- D. Xu, T. M. Penning, I. A. Blair and R. G. Harvey, J. Org. Chem., 2009, 74(2), 597–604 CrossRef CAS.
- J. B. Raoof, R. Ojani and H. Beitollahi, Int. J. Electrochem. Sci., 2007, 2(7), 534–548 CrossRef CAS.
- S. Mas, A. de Juan, R. Tauler, A. C. Olivieri and G. M. Escandar, Talanta, 2010, 80(3), 1052–1067 CrossRef CAS.
- M. Gros, M. Petrović and D. Barceló, Talanta, 2006, 70(4), 678–690 CrossRef CAS.
- A. S. Castillo, A. S. Carretero, J. C. Fernández, W. J. Jin and A. F. Gutiérrez, Anal. Chim. Acta, 2004, 516(1–2), 213–220 CrossRef.
- S. K. Patil, S. A. Patil, M. M. Vadiyar, D. V. Awale, A. S. Sartape, L. S. Walekar, G. B. Kolekar, U. V. Ghorpade, J. H. Kim and S. S. Kolekar, J. Mol. Liq., 2017, 244, 39–45 CrossRef CAS.
- E. Lazzari, A. d. S. Polidoro, B. Onorevoli, T. Schena, A. N. Silva, E. R. A. Scapin and E. B. Jacques Caramão, Renewable Energy, 2019, 135, 554–565 CrossRef CAS.
- J. L. Aleixandre-Tudo, A. Buica, H. Nieuwoudt, J. L. Aleixandre and W. du Toit, J. Agric. Food Chem., 2017, 65(20), 4009–4026 CrossRef CAS.
- N. Sabbaghi and M. Noroozifar, Anal. Chim. Acta, 2019, 1056, 16–25 CrossRef CAS PubMed.
- H. Yang, S. Li, H. Yu, F. Zheng, L. Lin, J. Chen and Y. Lin, Nanoscale, 2019, 11(18), 8950–8958 RSC.
- C. Batchelor-McAuley, E. J. F. Dickinson, N. V. Rees, K. E. Toghill and R. G. Compton, Anal. Chem., 2012, 84, 669–684 CrossRef CAS PubMed.
- S. R. Jamnani, H. M. Moghaddam, S. G. Leonardi, G. Neri and A. Ferlazzo, Ceram. Int., 2024, 50(1), 403–411 CrossRef CAS.
- J. He, X. Xu, M. Li, S. Zhou and W. Zhou, Anal. Chim. Acta, 2023, 1251, 341007 CrossRef CAS.
- M. H. Mashhadizadeh, S. M. Kalantarian and A. Azhdeh, Electroanalysis, 2021, 33(1), 160–169 CrossRef CAS.
- G. Ma, H. Xu, M. Wu, L. Wang, J. Wu and F. Xu, Microchim. Acta, 2019, 186, 1–9 CrossRef CAS.
- K. Moulaee, M. H. Raza, N. Pinna, N. Donato and G. Neri, Phys. Chem. Chem. Phys., 2021, 23(25), 14064–14074 RSC.
- S. Meng, Y. Hong, Z. Dai, W. Huang and X. Dong, ACS Appl. Mater. Interfaces, 2017, 9(14), 12453–12460 CrossRef CAS.
- M. M. Ardakani, Z. Taleat, H. Beitollahi, M. Salavati-Niasari, B. B. F. Mirjalili and N. Taghavinia, J. Electroanal. Chem., 2008, 624(1–2), 73–78 CrossRef.
- Y. Chen, B. Liu, Z. Chen and X. Zuo, Anal. Chem., 2021, 93(30), 10635–10643 CrossRef CAS PubMed.
- M. S. Tsai, C. J. Lu and P. G. Su, Mater. Chem. Phys., 2018, 215, 293–298 CrossRef CAS.
- N. W. Lee, K. R. Yoon, J. Y. Lee, Y. Park, S. J. Pyo, G. Y. Kim and W. H. Ryu, ACS Appl. Energy Mater., 2019, 2(5), 3513–3522 CrossRef CAS.
- B. Zheng, J. Fan, B. Chen, X. Qin, J. Wang, F. Wang and X. Liu, Chem. Rev., 2022, 122(6), 5519–5603 CrossRef CAS.
- S. P. Miller, B. I. Dunlap and A. S. Fleischer, Solid State Ionics, 2013, 253, 130–136 CrossRef CAS.
- Y. Arachi, H. Sakai, O. Yamamoto, Y. Takeda and N. Imanishai, Solid State Ionics, 1999, 121, 133–139 CrossRef CAS.
- Q. N. Xue, L. G. Wang, X. W. Huang, J. X. Zhang and H. Zhang, Mater. Des., 2018, 160, 131–137 CrossRef CAS.
- K. Kendall and M. Kendall, High-Temperature Solid Oxide Fuel Cells for the 21st Century: Fundamentals, Design and Applications, Elsevier, 2015 Search PubMed.
- S. Hussain and L. Yangping, Energy Transitions, 2020, 4, 113–126 CrossRef.
- B. Andò, S. Baglio, S. Castorina, S. Graziani, S. V. G. Tondepu, S. Petralia and A. Ferlazzo, IEEE Trans. Instrum. Meas., 2022, 71, 1–11 Search PubMed.
- S. Halley, K. P. Ramaiyan, L. K. Tsui and F. Garzon, Sens. Actuators, B, 2022, 132363 CrossRef CAS.
- Y. Lv, T. Yang, X. Hou, Z. Fang, K. Rajan, Y. Di and T. Liang, J. Alloys Compd., 2022, 904, 163798 CrossRef CAS.
- A. Ferlazzo, C. Espro, D. Iannazzo, K. Moulaee and G. Neri, Int. J. Hydrogen Energy, 2022, 47(16), 9819–9828 CrossRef CAS.
- A. Ferlazzo, C. Espro, D. Iannazzo, A. Bonavita and G. Neri, Mater. Today Commun., 2023, 35, 106036 CrossRef CAS.
- I. Llamas-Jansa, N. Aliouane, S. Deledda, J. E. Fonneløp, C. Frommen, K. Lieutenant and B. C. Hauback, J. Alloys Compd., 2011, 509, S684–S687 CrossRef CAS.
- D. W. Liu, C. H. Perry and R. P. Ingel, J. Appl. Phys., 1988, 64, 1413 CrossRef CAS.
- C. Fernandez-Sanchez, C. J. McNeil and K. Rawson, TrAC, Trends Anal. Chem., 2005, 24(1), 37–48 CrossRef CAS.
- A. J. Bard, L. R. Faulkner and H. S. White, Electrochemical Methods: Fundamentals and Applications, John Wiley & Sons, 2022 Search PubMed.
- S. Sarat, N. Sammes and A. Smirnova, J. Power Sources, 2006, 160(2), 892–896 CrossRef CAS.
- R. Zribi, A. Ferlazzo, E. Fazio, M. Condorelli, L. D'Urso, F. Neri and G. Neri, IEEE Trans. Instrum. Meas., 2023, 72, 1–8 Search PubMed.
- V. Bressi, I. Chiarotto, A. Ferlazzo, C. Celesti, C. Michenzi, T. Len, D. Iannazzo, G. Neri and C. Espro, ChemElectroChem, 2023, 10(13), e202300004 CrossRef CAS.
- A. Ferlazzo, C. Espro, D. Iannazzo and G. Neri, IEEE Trans. Instrum. Meas., 2023, 72, 9508308 CAS.
- P. Veerakumar, A. Sangili, S. M. Chen, V. Vinothkumar and T. H. Kim, ACS Appl. Nano Mater., 2023, 6(21), 19981–19996 CrossRef CAS.
- K. Abid, A. Ferlazzo and G. Neri, FlatChem, 2024, 46, 100673 CrossRef CAS.
- C. Ge, H. Li, M. Li, C. Li, X. Wu and B. Yang, Carbon, 2015, 95, 1–9 CrossRef CAS.
- H. Zhang, X. Bo and L. Guo, Sens. Actuators, B, 2015, 220, 919–926 CrossRef CAS.
- M. Aragó, C. Ariño, À. Dago, J. M. Díaz-Cruz and M. Esteban, Talanta, 2016, 160, 138–143 CrossRef.
- F. Hu, S. Chen, C. Wang, R. Yuan, D. Yuan and C. Wang, Anal. Chim. Acta, 2012, 724, 40–46 CrossRef CAS.
- S. Yang, M. Yang, Q. Liu, X. Wang, H. Fa, Y. Wang and C. Hou, J. Electrochem. Soc., 2019, 166, B547–B553 CrossRef CAS.
- S. Babu, P. Prabhu and S. S. Narayanan, Mater. Today: Proc., 2021, 36, 867–872 Search PubMed.
- D. Cheng and X. Kan, J. Electroanal. Chem., 2019, 857, 113741 CrossRef.
Footnote |
| † Electronic supplementary information (ESI) available: Fig. S1, electrochemical behavior using CV in 0.01 M PBS at a scan rate of 50 mV s−1; Fig. S2, linear sweep voltammetry (LSV) behavior of 100 μM HQ, RS and CC in 0.01 M PBS at a scan rate of 50 mV s−1. Fig. S3, cyclic voltammograms of ZrO210Sc/SPCE in a solution containing 100 μM HQ, CC and RS in PBS at pH = 7.4 at scan rates from 2 to 400 mV s−1. Fig. S4, CV of (a) HQ, (c) CC and (e) RS standard solutions with increasing concentrations from 0 to 2000 μM of analytes recorded in 0.01 M PBS of pH = 7.4 using ZrO210Sc/SPCE. See DOI: https://doi.org/10.1039/d4va00126e |
| This journal is © The Royal Society of Chemistry 2024 |

