DOI:
10.1039/D3YA00366C
(Paper)
Energy Adv., 2024,
3, 451-458
Simulations for charge transfer and photocurrent calculations using hematite for green hydrogen production†
Received
1st August 2023
, Accepted 26th December 2023
First published on 27th December 2023
Abstract
Hydrogen is an important material for today's economy and a possible clean fuel. “Blue” and “green” hydrogen production rely on catalysts to either convert carbon monoxide into carbon dioxide via the water–gas shift reaction (WGSR) or generate hydrogen with no carbon involved by water splitting. Hematite is a possible catalyst for both reactions, but some limits prevent it from being used commercially. By using a wave propagation simulator, we examined the charge transfer mechanism of hematite during catalysis and found that the *O intermediate has the slowest transfer rate. We were also able to utilize the charge transfer simulation to calculate the probability of a charge to reach the surface, which is essential for generating photocurrent. Using these probabilities and a previously built kinetic Monte Carlo simulation, we were able to simulate J–V curves with a good match to experiments.
Introduction
Hydrogen production is an essential process in today's economy.1,2 Current production relies mainly on steam reforming, which involves natural gas and results in production of carbon monoxide.1,3,4 In order to reduce carbon emissions, there is an effort to generate “blue” hydrogen, which is hydrogen that was generated using steam reforming, but with minimal carbon products. In order to capture carbon products, carbon monoxide must first undergo a water–gas shift reaction (WGSR) to turn it into carbon dioxide. Then, carbon dioxide is captured and stored, so its emission is minimal.5
Another method of hydrogen production is using photoelectrochemical cells (PECs) for producing “green” hydrogen.4 In “green” methods, there is zero carbon involved, so there are zero direct carbon emissions. One such method is water splitting, which breaks water into its components, hydrogen and oxygen. Since water is carbon-free, water-splitting is considered to produce “green” hydrogen.
Both WGSR and water splitting require a catalyst. Hematite is one of the most widely-studied materials as a catalyst for both processes.6–20 However, it has some drawbacks, including short hole diffusion lengths, high recombination, bad surface chemistry,21 and poor thermodynamics.9 Several works studied photocurrent obtained through hematite,22,23 both by experiments and by theoretical studies, using various simulations.
To better understand photocurrent generation via the OER, the mechanism is commonly broken down into five intermediate reactions, written here under basic conditions:
| | | *OH2 + OH− + h+ → H2O + *OH | (2) |
| | | *OH + OH− + h+ → H2O + *O | (3) |
| | | *OOH + OH− + h+ → O2 + H2O + * | (5) |
where * denotes an adsorbed species. First, a water molecule adsorbs on the surface to form an adsorbed water intermediate, or *OH
2. Then, using a hole and OH
− ion, hydrogen leaves the intermediate and forms an *OH structure. The process repeats to form the *O intermediate. In
reaction (4), the OH
− ion receives a hole and adsorbs on the surface to form *OOH, and finally the hydrogen in *OOH leaves and the remaining *OO intermediate desorbs as oxygen gas.
Reaction (5) combines the latter two reactions.
Photocurrent calculations often use general methods to calculate the hole flux to the surface, such as the Gärtner method.24 These general methods do not take the special features of each intermediate into account, or do so while assuming other common properties, such as shared hole diffusion lengths. In this work, the hole flux is calculated while taking each intermediate's properties separately. The absorption spectrum is species-dependent, as well as the probability of a hole to reach the surface.
A previous work from our group25 focused on activation energies as a method to simulate electrocatalysis, without taking photocurrent into account. The current work builds on the previous work with the addition of photocurrent calculations, which require the wave propagation simulator.
The absorption spectra of the five intermediates were obtained using state-of-the-art Bethe–Salpeter equations (BSE) calculations from our previous work.10 The probability to reach the surface is calculated by propagating a hole through the potential energy of each intermediate. Hole propagation is done by solving the Schrödinger equation by the split-operator method.
Computational methods
I. Potential calculations
We used VASP 5.4.426–28 to relax the four intermediates involved in reactions with a hole transfer, reactions (2)–(5), using spin-polarized density functional theory (DFT) calculations. The four slabs are depicted in Fig. 1. The LOCPOT file, which stores the local potential, was obtained by setting LVTOT = .TRUE. in VASP's settings, thus obtaining the full potential, with exchange–correlation contributions. We used the Perdew–Burke–Ernzerhof exchange–correlation potential29 with a U–J correction of 4.3 eV for iron, 5.5 eV for nickel, and 3.5 eV for titanium, according to the scheme of Dudarev et al.30 The U–J value was previously obtained by ab initio methods.31 The value for oxygen, hydrogen, and aluminum was set to zero. Core electrons were represented by the projector augmented waves (PAW) method.32,33
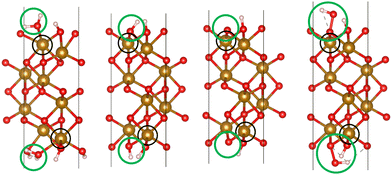 |
| | Fig. 1 The four slabs with reactions involving a hole transfer. From left to right: *OH2, *OH, *O, *OOH. The black circles indicate the iron atom attached to the intermediate. The green circles indicate the adsorbates. | |
Hematite slab dimensions are a = b = 5.10 Å, c = 25.62 Å, with a vacuum layer of 13 Å. The angles of the slab are α = β = 90°, γ = 120°. We used the (0001) surface of hematite, which is a natural growth surface for hematite.34 The slabs are symmetric to avoid dipole moments, so the top and bottom iron atoms and adsorbates are identical in each slab of Fig. 1.
Since the slab's thickness from the center to the surface is approximately 8 Å, an artificial extension of the potential is used, as explained in part III of the Methods section.
The Kohn–Sham equations were solved self-consistently using a plane-wave basis and periodic boundary conditions in all dimensions. K-space integration was carried out by the tetrahedron method with Blöchl correction.35K-point grids were set as gamma-centered 3 × 3 × 1 grids. Plane-wave energy cutoff was set to 700 eV. Geometric relaxation was carried out by the conjugate-gradient method with a force threshold of 0.03 eV Å−1 for convergence. The k-point grid, energy cutoff, and force threshold were converged to less than 1 meV per atom as in previous works.7,36
Dopant atoms were chosen by their ionized charge (+2 for Ni, +3 for Al, +4 for Ti). The models were converged as for pure hematite, but with the dopant atom replacing the active site iron atom (as marked in the black circles of Fig. 1).
II. Wave propagation
The goal of computational wave propagation is taking an initial wavefunction in a known potential and applying the time-dependent Schrödinger equation to propagate the wave.| |  | (6) |
The solution to eqn (6), when the potential energy is time-independent, is obtained by operator exponentiation:| |  | (7) |
where ψ(t) is the wavefunction at time t and ψ(0) is the wavefunction at t = 0. Since ψ at t = 0 can be written as a sum of the Hamiltonian's eigenfunctions, so can the wavefunction at time t:| |  | (8) |
| |  | (9) |
| |  | (10) |
where ψn are the Hamiltonian's eigenfunctions and cn are the coefficients obtained by the integral 〈ψn|ψ(0)〉, and En are the eigenvalues of the Hamiltonian, or the energies of the eigenfunctions. The transition from eqn (9) and (10) occurs due to the property of applying a function of an operator on an eigenfunction of the operator:Most computer algorithms represent wavefunctions in either position- or momentum-space. However, the Hamiltonian is comprised of two operators, each is diagonal in a different space:| | Ĥ = ![[K with combining circumflex]](https://www.rsc.org/images/entities/i_char_004b_0302.gif) + + ![[V with combining circumflex]](https://www.rsc.org/images/entities/i_char_0056_0302.gif) | (12) |
The kinetic energy operator is diagonal in momentum space while the potential energy operator is diagonal in position space, so the Hamiltonian is diagonal in neither base. One possible solution is to create the Hamiltonian matrix and diagonalize it in order to obtain the wavefunction in the Hamiltonian eigenstate space, but the matrix grows as the size of the grid squared, and error minimization requires a large grid. Furthermore, diagonalization is a resource-heavy operation which slows down as the matrix grows.
One way to circumvent this problem is to apply the exponent of the two operators comprising the Hamiltonian in sequence. However, since they do not commutate, the result is not the same as applying the Hamiltonian:
| |  | (13) |
The application of two exponential operators is given by the Baker–Campbell–Hausdorff formula:
| | e![[X with combining circumflex]](https://www.rsc.org/images/entities/i_char_0058_0302.gif) eŶ = eẐ eŶ = eẐ | (14) |
| |  | (15) |
Applying the left side of
eqn (13) will result in introducing the commutators of position and momentum operators beyond the Hamiltonian, or errors in the order of magnitude of the timestep squared.
To reduce the error, consider an expansion of the Baker–Campbell–Hausdorff formula into three variables:
| | eŴe![[X with combining circumflex]](https://www.rsc.org/images/entities/i_char_0058_0302.gif) eŶ = eẐ eŶ = eẐ | (16) |
| |  | (17) |
By choosing
Ŵ =
Ŷ,
eqn (17) reduces into:
| |  | (18) |
| |  | (19) |
Using the properties of commutators, it can be shown that:
| | [Ŵ, ![[X with combining circumflex]](https://www.rsc.org/images/entities/i_char_0058_0302.gif) ] = −[ ] = −[![[X with combining circumflex]](https://www.rsc.org/images/entities/i_char_0058_0302.gif) , Ŵ] , Ŵ] | (20) |
So finally, the result is:
| | Ẑ = 2Ŵ + ![[X with combining circumflex]](https://www.rsc.org/images/entities/i_char_0058_0302.gif) + … + … | (22) |
where the rest is the third-order commutators. Since commutators are linear, and considering all operators contain a multiplication by a scalar Δ
t will result in:
| | Ẑ = 2ŴΔt + ![[X with combining circumflex]](https://www.rsc.org/images/entities/i_char_0058_0302.gif) Δt + Δt + ![[scr O, script letter O]](https://www.rsc.org/images/entities/char_e52e.gif) (Δt3) (Δt3) | (23) |
Since
eqn (7) can have any starting point, we can use small timesteps Δ
t and rewrite it as:
| |  | (24) |
And according to
eqn (23), a clever choice of functionals can result in errors that are only in the order of magnitude of Δ
t cubed. As such, we can choose:
| |  | (25) |
So the total operator in the exponent becomes:
| | Ẑ = ![[V with combining circumflex]](https://www.rsc.org/images/entities/i_char_0056_0302.gif) Δt + Δt + ![[K with combining circumflex]](https://www.rsc.org/images/entities/i_char_004b_0302.gif) Δt + Δt + ![[scr O, script letter O]](https://www.rsc.org/images/entities/char_e52e.gif) (Δt3) = ĤΔt + (Δt3) = ĤΔt + ![[scr O, script letter O]](https://www.rsc.org/images/entities/char_e52e.gif) (Δt3) (Δt3) | (26) |
In
eqn (26), the Hamiltonian is applied with a small timestep Δ
t and a small error proportional to Δ
t cubed. Taking smaller timesteps can reduce the error and enable more accurate computations.
With these results, it is possible to take a position space wavefunction ψ(x, t) and advance it to ψ(x, t + Δt) using the following formula:
| |  | (27) |
In
eqn (27), we first use half of the potential energy operator on the wavefunction. Since the wavefunction and the operator are in the same space, each point in the grid of the wavefunction is just multiplied by the value of the operator at that point. Then, this result is Fourier transformed into momentum space, where the kinetic energy operator is applied. Once again, this operator is diagonal in momentum space, so the computation is simple multiplication. Finally, the result of the kinetic operator application is inverse Fourier transformed back to position space, and the second half of the potential energy operator is applied.
III. Wave propagation in hematite
The potential energy in LOCPOT files was averaged over the x–y plane to generate a potential that changes in z-direction. To avoid the artifacts of fast Fourier transform (FFT) due to periodicity, the vacuum level was extended by adding the final value multiple times and the bulk was extended by repeating the potential of the bulk multiple times. Then, an initial Gaussian wavefunction was assumed:| |  | (28) |
where z0 is the initial position of the wavefunction, usually taken as a position of a certain atom. For example, if a surface was extended to L = 644.3 Å, then z0 was taken as 308.1 Å. A is the normalization coefficient, and k0 is the initial momentum. σ is the width of the wavefunction, taken as 1 Å.
The initial momentum was calculated by solving the following integral for k0:
| |  | (29) |
where
L is the length of the potential, and
z is assumed to run from 0 to
L. The calculated value for
k0 is about 2 × 10
10 m
−1 for all intermediates.
The value of the kinetic energy at t = 0 was obtained from the total energy minus the potential energy. The total energy can be taken as the valence band energy for holes or conduction band energy for electrons, and in this work it was taken as the valence band energy. The potential energy was calculated using the following integral:
| |  | (30) |
To calculate the cumulative probability beyond the surface, the following integral was calculated:
| |  | (31) |
where
zedge is the
z-location of the surface, which is the iron atom furthest away from the center of the slab, determined by the slab's structure. The cumulative probability beyond the surface can be considered the total probability of the hole to be at the surface. This probability is used in calculating the photogenerated hole flux to the surface, and thus aids in the calculation of the photocurrent.
IV. Photocurrent calculation
Photocurrent was calculated using previously built on our implemented kinetic Monte Carlo simulations9 extended to include rates of approaching the surface after optical absorption. The rates of catalytic activity were taken as the rates of holes reaching the surface, or hole flux, assuming the reaction rate is determined by the rate of holes reaching the surface. The hole flux was calculated by obtaining the rate of photogeneration using Beer–Lambert, and then applying the probability of a hole to reach the surface.
Calculation of the probability of a hole to reach the surface was done using a wave propagation simulator. The simulation started with different initial positions, and for each initial position the highest probability beyond the surface was taken.
From Beer–Lambert, we know that:
| |  | (32) |
And the solution for that equation is:
where
I is the number of absorbed photons,
I0 is the photon flux,
α is the absorption coefficient, and
z is the position in the bulk (
z = 0 is the surface). Since the intended illumination is sunlight,
eqn (33) can be rewritten as:
| |  | (34) |
S(
λ) is the wavelength-dependent solar spectrum, and now the absorption coefficient is wavelength-dependent as well. However,
eqn (34) only counts the number of holes, but does not consider their probability to reach the surface. For that, it's necessary to calculate the following quantity:
| |  | (35) |
where
ϕ(
z) is the probability to reach the surface when starting from depth
z and
d is the thickness of the slab. Combining
eqn (34) and (35) gives:
37| |  | (36) |
Since
α(
λ) is already calculated for all slabs,
10S(
λ) is known and
ϕ(
z) is calculated in this paper, it is possible to calculate the hole flux to the surface for all hole-dependent reactions.
Current calculations are performed using the procedure explain in our previously published work.25 However, in this work, the reaction rates for each cell in the Monte Carlo grid are calculated using eqn (36). After the hole flux is calculated, a recombination rate is applied to account for charge recombination. Thus, the total hole flux to the surface is:
| |  | (37) |
| |  | (38) |
where
p is the hole density at the surface,
ns is the electron density at the surface,
I is the previously calculated photon flux,
krec is the recombination rate, taken as 10
−12 m
3 s
−1,
38,39τacc is the surface accumulation time, taken as 1 s,
40n0 is the electron density under zero bias, taken as 3 × 10
24 m
−3,
41Vfb is the flat band potential, taken as 0.4 V,
41 and
d is the depth of the accumulation layer, taken as 1 nm.
38,39 Since the recombination rate can be higher than the photon flux, the max function is used to ensure the hole flux is at least zero and not negative, which is the meaning of the “,0” part of the equation.
Results
We will start by presenting the results of potential energy calculations, then present the results of wave propagation with and without doping, and finally show the results of the probability for charge to go beyond the surface and the resulting photocurrent J–V curve.
I. Potential energy results
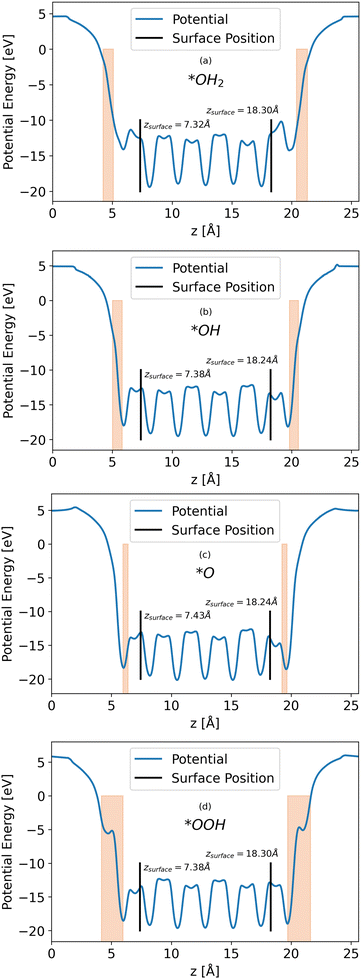
Calculations of the LOCPOT file produce a three-dimensional potential, which was averaged over the x–y plane in order to isolate charge propagation toward the surface in z-direction. Fig. 2 shows the results of the four averaged potentials.
 |
| | Fig. 2
x–y averaged potential of the (a) *OH2, (b) *OH, (c) *O, (d) *OOH intermediates (from top to bottom, respectively). The black lines in each graph represents the location of the bottom and top surfaces of the slab. Intermediate positions are shown in the orange shade. | |
All slabs have a similar potential energy at the bulk structure, as expected. The differences are mainly in the surface region of the potential energy, as can be seen in Fig. 2 in the shapes of the energy curves to the right of the black lines.
The surface markers indicate the position of the iron atoms, whereas the orange shade represents the position of the adsorbate atoms. The different potential shapes in the adsorbate region stem from the difference in adsorbates.
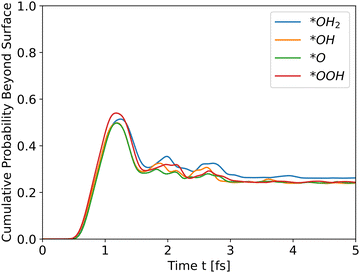
The potential energy curve to the right of the black line in each part of Fig. 2 is the potential energy of the surface, which differs between intermediate. The structure of the surface region affects the peak shape of the cumulative probability graph for charge transport, such as Fig. 3, but not the peak position and height, as will be shown in the next section.
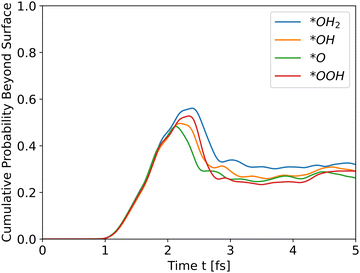 |
| | Fig. 3 Cumulative probability beyond the surface for all slabs as a function of time (see eqn (31)). The propagation is for holes. | |
II. Wave propagation
All slabs were inserted into the simulator with an initial wavefunction centered at an iron location (a peak in the potential energy in bulk region). Distance of the wavefunction from the surface was similar for all slabs, and taken as ∼43 Å. Fig. 3 shows the cumulative probability beyond the surface after running the simulator for 5 fs.
All intermediates have similar initial results as they travel through the bulk, but the peak shows the difference. All wavefunctions started at similar positions and identical wavefunction shape, but have different initial momentum due to different conduction band energies and propagate through different potential energies. In order to assess the effect of the initial momentum separately from the potential energy, the same wavefunction was propagated through the *O slab's potential with different initial total energies. Since the potential energy is identical in all runs, the added energy changed only the kinetic energy and initial momentum.
The results in Fig. 4 show that the effect of initial energy is significant for the probability of getting to the surface and also for the speed of arriving to the surface. However, when varying only the potential energy while keeping the kinetic energy identical for all slabs, the results, shown in Fig. S1 in the ESI,† are similar to Fig. 3. From these two results, we can understand that the kinetic energy affects the time of arrival to the surface and the peak's height, and the potential energy affects the shape of the cumulative probability graph.
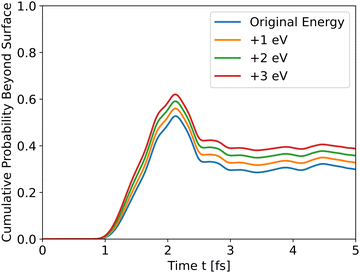 |
| | Fig. 4 Wave propagation of holes through the *O slab using different initial total energies. | |
Analyzing the initial energies for dopants shows a similar trend – higher initial energies lead to higher peaks.
As Table 1 shows, *OH2 has the highest initial energy, followed by *OOH, *OH, and *O, respectively. For undoped hematite, the order of energies is similar to the order of peaks. Doping results show a similar behavior. For example, Ni doped hematite, as shown in Fig. 5, and Al and Ti doping, as shown in Fig. S2 and S3, respectively, in the ESI.†
Table 1 Total energies of the simulation for holes, by slab and by dopant. The total energy is the valence band energy of the slab
| Dopant |
*OH2 slab (eV) |
*OH slab (eV) |
*O slab (eV) |
*OOH slab (eV) |
| Undoped |
0.6702 |
−0.3905 |
−0.6051 |
−0.1430 |
| Al |
1.1703 |
−0.3337 |
−0.8388 |
0.0549 |
| Ni |
−0.1085 |
−0.4531 |
−0.4730 |
0.3150 |
| Ti |
2.0507 |
1.0595 |
−0.7439 |
0.9158 |
 |
| | Fig. 5 Cumulative probability beyond the surface, Ni doped hematite. Hole propagation. | |
The results for Ni doping show that the total energy is the most significant determinant of peak heights, since the potential energies are similar, even with doping, and the intermediates differ only at the edge. The cumulative probability graphs of doped potentials are shown in Fig. S1–S3 in the ESI.† A well-converged structure will differ only at the edges, and since the simulation initializes the wavefunctions at the bulk, i.e., z0 is in a bulk location, the differences in potential energy are negligible compared to the differences in total energy, which translate into differences in kinetic energy. The differences in potential energy, however, contribute to the shape of the cumulative probability graphs.
III. Photocurrent calculations
Inserting the results of the photocurrent calculations, as detailed in eqn (32)–(36), produces the hole generation rate. However, it is necessary to take recombination into account, which is done in eqn (37)–(39). Calculation of the probability to reach the surface was conducted as explained in the Methods sections. The results are depicted in Fig. 6.
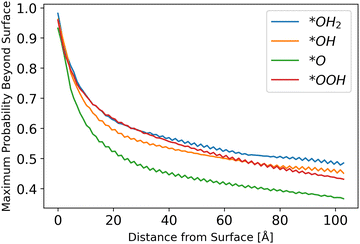 |
| | Fig. 6 Probability to reach the surface by starting distance, from eqn (31) with different starting z0 values. | |
The results show a decreasing trend, as intuitively expected, with *O lagging behind other intermediates. Although the difference in the probability of a hole to reach the surface for *O as compared to other intermediates is small, it may be another reason for *O to be the dominant species, as even photo-generated holes are the least likely to transport to the surface for this intermediate, as shown in Fig. 6.
The fluctuations in results stem from the discretization of the grid and the chosen initial points. Since the potential is sinusoidal-like, moving closer to the surface can result in a lower probability to reach the surface. With a finer simulation grid, the graph will have a smoother sinusoidal look.
Running the full simulation, with both dark current and photocurrent calculated simultaneously, generates the results shown in Fig. 7. We assumed that once a hole reaches the surface, it leaves the catalyst by participating in the chemical reaction as shown in eqn (2)–(5).
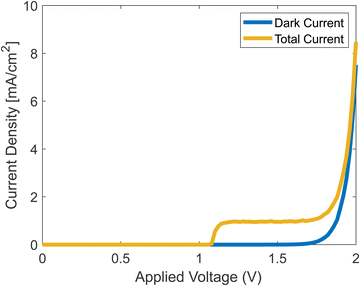 |
| | Fig. 7 Simulated J–V curves with and without photocurrent. | |
The onset potential in the simulation is about 1.2 V, which is in agreement with experiments.42 The current density rises at the onset, reaches a plateau, and then rises when the dark current increases. The plateau stems from the decrease of ns from eqn (37), which at some voltage, becomes negligible.
Conclusions
Wave packet propagation is a simple, yet powerful tool for gaining insights into charge transfer. By combining it with heterogenous catalysis modeling, it is possible to better understand processes which cannot be modelled using DFT, which calculates ground states. Since absorption is an excited state phenomenon, it is necessary to use different computational methods, such as the resource-heavy Bethe–Salpeter equations (BSE).
Similar to other works, this work also found the *O → *OOH reaction to be the slowest reaction, this time due to low initial kinetic energy that stems from the low energy of the conduction band for the *O intermediate and the potential energy which creates barriers that are harder for the wavefunction to cross. Previous works43,44 found a mid-gap state in the *O intermediate's density of states (DOS). This mid-gap state lowers the total energy, which, as this work has shown, results in a lower kinetic energy. A lower initial kinetic energy translates into lower probabilities of reaching the surface, so this work complements other works by showing that *O has the slowest reaction rate due to its low kinetic energy, and thus behaves as the OER's bottleneck.
Conflicts of interest
There are no conflicts to declare.
Acknowledgements
This research was supported by the Nancy and Stephen Grand Technion Energy Program (GTEP), by the Israel Science Foundation (grant no. 880/20), by a grant from the Israel Ministry of Science and Technology (MOST), and by the Israel National Institute for Energy Storage (INIES). This research received funding from KLA-Tencor. This article is based upon work from COST Action 18234, supported by COST (European Cooperation in Science and Technology). N. S. acknowledges a Jacobs scholarship for excellence by Technion graduate school.
References
- U.S. Department of Energy, Hydrogen Production, 2014.
-
J. Ren, S. Gao, H. Liang, S. Tan and L. Dong, ed. A. Scipioni, A. Manzardo and J. B. T.-H. E. Ren, The Role of Hydrogen Energy: Strengths, Weaknesses, Opportunities, and Threats, Hydrogen EconomySupply Chain, Life Cycle Analysis and Energy Transition for Sustainability, Academic Press, 2017, pp. 1–33.
-
Nat. Energy
2016
1
16127, https://www.nature.com/articles/nenergy2016127 Search PubMed.
-
C. M. Kalamaras and A. M. Efstathiou, in Conference Papers in Energy, 2013.
-
Y. Dou, L. Sun, J. Ren and L. Dong, ed. A. Scipioni, A. Manzardo and J. B. T.-H. E. Ren, Opportunities and Future Challenges in Hydrogen Economy for Sustainable Development, Hydrogen EconomySupply Chain, Life Cycle Analysis and Energy Transition for Sustainability, Academic Press, 2017, pp. 277–305.
- O. Neufeld and M. C. Toroker, Phys. Chem. Chem. Phys., 2015, 17, 24129 RSC.
- M. C. Toroker, J. Phys. Chem. C, 2014, 118, 23162 CrossRef CAS.
- N. Yatom and M. C. Toroker, Molecules, 2015, 20, 19900 CrossRef CAS PubMed.
- N. Snir and M. C. Toroker, ChemPhysChem, 2022, e202200025 CrossRef CAS PubMed.
- N. Snir and M. C. Toroker, J. Chem. Theory Comput., 2020, 16, 4857 CrossRef CAS PubMed.
- P. Liao and E. A. Carter, Phys. Chem. Chem. Phys., 2011, 13, 15189 RSC.
- P. Liao and E. A. Carter, J. Appl. Phys., 2012, 112, 1775 Search PubMed.
- P. Liao, M. C. Toroker and E. A. Carter, Nano Lett., 2011, 11, 1775 CrossRef CAS PubMed.
- P. Liao, J. A. Keith and E. A. Carter, J. Am. Chem. Soc., 2012, 134, 13296 CrossRef CAS PubMed.
- B. Klahr and T. Hamann, J. Phys. Chem. C, 2014, 118, 10393 CrossRef CAS.
- O. Zandi and T. W. Hamann, Phys. Chem. Chem. Phys., 2015, 17, 22485 RSC.
- O. Zandi and T. W. Hamann, Nat. Chem., 2016, 8, 778 CrossRef CAS PubMed.
- J. M. T. de Souza and M. do Carmo Rangel, React. Kinet. Catal. Lett., 2004, 83, 93 CrossRef.
- M. I. Ariëns, V. Chlan, P. Novák, L. G. A. van de Water, A. I. Dugulan, E. Brück and E. J. M. Hensen, Appl. Catal., B, 2021, 297, 120465 CrossRef.
- S. A. Fuente, C. Zubieta, R. M. Ferullo and P. G. Belelli, Top. Catal., 2019, 62, 908 CrossRef CAS.
- H. Dotan, O. Kfir, E. Sharlin, O. Blank, M. Gross, I. Dumchin, G. Ankonina and A. Rothschild, Nat. Mater., 2013, 12, 158 CrossRef CAS PubMed.
- A. Kay, D. A. Grave, K. Deo Malviya, D. S. Ellis, H. Dotan and A. Rothschild, J. Phys. Chem. C, 2017, 121, 28287 CrossRef CAS.
- K. George, T. Khachatrjan, M. van Berkel, V. Sinha and A. Bieberle-Hütter, ACS Catal., 2020, 10, 14649 CrossRef CAS.
- W. W. Gärtner, Phys. Rev., 1959, 116, 84 CrossRef.
- N. Snir and M. C. Toroker, Adv. Theory Simul., 2023, 2300182 CrossRef CAS.
- G. Kresse and J. Hafner, Phys. Rev. B: Condens. Matter Mater. Phys., 1994, 49, 14251 CrossRef CAS PubMed.
- G. Kresse and J. Furthmüller, Phys. Rev. B: Condens. Matter Mater. Phys., 1996, 54, 11169 CrossRef CAS PubMed.
- G. Kresse and J. Furthmüller, Comput. Mater. Sci., 1996, 6, 15 CrossRef CAS.
- J. P. Perdew, K. Burke and M. Ernzerhof, Phys. Rev. Lett., 1996, 77, 3865 CrossRef CAS PubMed.
- S. L. Dudarev, G. A. Botton, S. Y. Savrasov, C. J. Humphreys and A. P. Sutton, Phys. Rev. B: Condens. Matter Mater. Phys., 1998, 57, 1505 CrossRef CAS.
- N. J. Mosey, P. Liao and E. A. Carter, J. Chem. Phys., 2008, 129, 14103 CrossRef PubMed.
- P. E. Blöchl, Phys. Rev. B: Condens. Matter Mater. Phys., 1994, 50, 17953 CrossRef PubMed.
- G. Kresse, Phys. Rev. B: Condens. Matter Mater. Phys., 1999, 59, 1758 CrossRef CAS.
- R. J. Lad and V. E. Henrich, Surf. Sci., 1988, 193, 81 CrossRef CAS.
- P. E. Blöchl, O. Jepsen and O. K. Andersen, Phys. Rev. B: Condens. Matter Mater. Phys., 1994, 49, 16223 CrossRef PubMed.
- N. Yatom, Y. Elbaz, S. Navon and M. C. Toroker, Phys. Chem. Chem. Phys., 2017, 19, 17278 RSC.
- G. Segev, H. Dotan, D. S. Ellis, Y. Piekner, D. Klotz, J. W. Beeman, J. K. Cooper, D. A. Grave, I. D. Sharp and A. Rothschild, Joule, 2018, 2, 210 CrossRef CAS.
- L. Bertoluzzi, L. Badia-Bou, F. Fabregat-Santiago, S. Gimenez and J. Bisquert, J. Phys. Chem. Lett., 2013, 4, 1334 CrossRef CAS PubMed.
- L. M. Peter, J. Solid State Electrochem., 2013, 17, 315 CrossRef CAS.
- F. Le Formal, S. R. Pendlebury, M. Cornuz, S. D. Tilley, M. Grätzel and J. R. Durrant, J. Am. Chem. Soc., 2014, 136, 2564 CrossRef CAS PubMed.
- A. Shavorskiy, X. Ye, O. Karslıoğlu, A. D. Poletayev, M. Hartl, I. Zegkinoglou, L. Trotochaud, S. Nemšák, C. M. Schneider, E. J. Crumlin, S. Axnanda, Z. Liu, P. N. Ross, W. Chueh and H. Bluhm, J. Phys. Chem. Lett., 2017, 8, 5579 CrossRef CAS PubMed.
- B. Klahr, S. Gimenez, F. Fabregat-Santiago, T. Hamann and J. Bisquert, J. Am. Chem. Soc., 2012, 134, 4294 CrossRef CAS PubMed.
- N. Yatom, O. Neufeld and M. C. Toroker, J. Phys. Chem. C, 2015, 119, 24789 CrossRef CAS.
- N. Yatom and M. C. Toroker, Catal. Lett., 2016, 146, 2009 CrossRef CAS.
|
| This journal is © The Royal Society of Chemistry 2024 |
Click here to see how this site uses Cookies. View our privacy policy here.  Open Access Article
 *ab
*ab


![[K with combining circumflex]](https://www.rsc.org/images/entities/i_char_004b_0302.gif) +
+ ![[V with combining circumflex]](https://www.rsc.org/images/entities/i_char_0056_0302.gif)

![[X with combining circumflex]](https://www.rsc.org/images/entities/i_char_0058_0302.gif) eŶ = eẐ
eŶ = eẐ
![[X with combining circumflex]](https://www.rsc.org/images/entities/i_char_0058_0302.gif) eŶ = eẐ
eŶ = eẐ


![[X with combining circumflex]](https://www.rsc.org/images/entities/i_char_0058_0302.gif) ] = −[
] = −[![[X with combining circumflex]](https://www.rsc.org/images/entities/i_char_0058_0302.gif) , Ŵ]
, Ŵ]![[X with combining circumflex]](https://www.rsc.org/images/entities/i_char_0058_0302.gif) + …
+ …![[X with combining circumflex]](https://www.rsc.org/images/entities/i_char_0058_0302.gif) Δt +
Δt + ![[scr O, script letter O]](https://www.rsc.org/images/entities/char_e52e.gif) (Δt3)
(Δt3)

![[V with combining circumflex]](https://www.rsc.org/images/entities/i_char_0056_0302.gif) Δt +
Δt + ![[K with combining circumflex]](https://www.rsc.org/images/entities/i_char_004b_0302.gif) Δt +
Δt + ![[scr O, script letter O]](https://www.rsc.org/images/entities/char_e52e.gif) (Δt3) = ĤΔt +
(Δt3) = ĤΔt + ![[scr O, script letter O]](https://www.rsc.org/images/entities/char_e52e.gif) (Δt3)
(Δt3)


