 Open Access Article
Creative Commons Attribution 3.0 Unported Licence
Protecting Zn anodes by atomic layer deposition of ZrO2 to extend the lifetime of aqueous Zn-ion batteries†
Shichen
Sun
 ,
Yeting
Wen
,
Aidan
Billings
,
Roya
Rajabi
,
Boyu
Wang
,
Kangkang
Zhang
and
Kevin
Huang
,
Yeting
Wen
,
Aidan
Billings
,
Roya
Rajabi
,
Boyu
Wang
,
Kangkang
Zhang
and
Kevin
Huang
 *
*
Department of Mechanical Engineering, University of South Carolina, Columbia, SC 29201, USA. E-mail: huang46@cec.sc.edu
First published on 7th December 2023
Abstract
Aqueous rechargeable Zn-ion batteries (ARZIBs) are a newly emerged class of electrochemical cells suited for large-scale stationary energy storage applications due to their unique advantages in safety, cost, and supply chain. To advance ARZIB technology toward commercialization, the corrosion problem of Zn anodes in aqueous electrolytes must be adequately addressed. Here we report our efforts to tackle this issue by using atomic layer deposition (ALD) to coat the Zn anode surface with a protective nanoscale ZrO2 thin film, collectively denoted as ALD-ZrO2@Zn in this study. We show the pertinent properties of ALD-ZrO2@Zn in aqueous Zn-salt electrolyte solutions and electrochemical cells of three-electrode, symmetrical and full battery configurations. From these experiments, we have identified that 5–10 nm ALD-ZrO2@Zn anodes exhibit the best performance with low corrosion rate and excellent cycle stability over a broad current density range. The post-experiment microstructural examinations reveal that the ALD-ZrO2 coating effectively regulates the surface passive layer to grow into a thin, dense, and continuous form.
1. Introduction
Searching for new battery chemistries with profound technical and economic advantages to address the energy density, cost, and sustainability issues of the benchmark Li-ion batteries (LIBs) has been an active research area for the battery community in recent years. Aqueous Zn-ion batteries (AZIB) are a new class of electrochemical cells that have emerged in recent years to compete with LIBs for large-scale stationary energy storage applications due to their unique advantages in safety, materials sustainability, and cost.1–3 The use of near-neutral (pH = 4–5) Zn-salts as electrolyte enables the reversibility of the Zn/Zn2+ redox reaction at the Zn anode, which is a formidable obstacle for alkaline electrolyte systems (e.g., Zn–air and Fe–air batteries) to achieve sufficient rechargeability.4–6 The high ionic conductivity of aqueous Zn-electrolytes is another distinct advantage over organic electrolyte counterparts used in LIBs, which allows ARZIBs to cycle at faster rates with lower overpotentials. One major challenge facing ARZIB development, however, is the severe reactions between the Zn anode and aqueous Zn-salt electrolytes, invoking the hydrogen evolution reaction (HER) and forming a passive layer of Zn-containing layered double hydroxide (Zn-LDH).7–12To address the Zn-anode corrosion issue, extensive efforts have been noted in process development to mitigate the Zn–H2O interactions. These processes generally follow two strategies: engineering electrolyte compositions and protecting the Zn anode. The first strategy is aimed to reduce the solvation effect between Zn2+ and H2O by additives (mostly organics) that have a stronger electron withdrawing ability to attract H2O molecules by hydrogen bonding.13–15 The expected result from these organic additives is the reduced water activity in electrolytes, by which the reactions between Zn and H2O are alleviated, giving Zn2+ a greater freedom to be involved in the desired Zn/Zn2+ redox reaction. However, the drawback of this electrolyte engineering method is the negative impact on cathodic kinetics, e.g., reduced proton storage in the cathode and thus overall battery capacity. The second strategy is more straightforward, protecting Zn from being in direct contact with H2O by a surface layer. However, this strategy demands the protective coating to be conductive to Zn2+ transport, which significantly limits the materials of choice. One tactic to address this limitation is to use ultrathin films as a protective layer with low resistance. For example, a 4 μm-thick ZrO2 layer of nanoparticles has been reported to improve the durability of the Zn anode.16 With better nano-coating techniques such as atomic layer deposition (ALD), a range of nanoscaled thin films of TiO2, Al2O3 and Fe2O3 have also been reported with suppressed corrosion and improved durability of the Zn anode.17–19
Despite these early promising results, it is still unclear how these Zn2+-nonconductive ALD coatings play a role in maintaining the functionality of the Zn anode in ZIBs. Herein, we use ALD-derived ZrO2 on a Zn anode as a model system to investigate the protective nature and durability enhancement mechanisms enabled by ALD-ZrO2. We particularly study the effects of ALD-ZrO2 film thickness on the electrochemical performance of half- and full-cells and conduct thorough post-test microstructural and chemical analyses to arrive at reasonable explanations for the observed electrochemical behaviors.
2. Experimental procedures
2.1 ALD-ZrO2 coating and characterization
ALD-ZrO2 thin film was deposited on the surface of well-polished Zn-foil (Sigma Aldrich, ∼1 mm thick, finished polishing with 1 μm Al2O3 suspension) using our in-house ALD reactor (Ultratech/Cambridge Savannah S200 ALD System). Tetrakis(dimethylamido)zirconium(IV) (Sigma Aldrich, reagent grade), DI water and pure N2 (>99.999%) are the Zr-precursor, oxidizer, and purge gas, respectively. The precursor column and reaction chamber temperatures are set to 60 and 180 °C, respectively. For a typical ALD-ZrO2 cycle, the chamber pressure is first vacuumed down to 50 mTorr, and then the precursor is introduced into the chamber by a 0.5 s pulse and kept for 20 s to allow it to adsorb on the Zn foil. Afterward, N2 is introduced into the chamber to purge out the residual precursors at a flow rate of 20 sccm for 30 s. The chamber is then pumped down to 50 mTorr again, followed by a 0.015 s pulse of DI water for 20 s to oxidize the pre-adsorbed precursor. This process is then repeated for a desirable number of cycles to build up the thickness. The pre-determined deposition rate of ZrO2 by an online QCM (quartz crystal microbalance) is ∼0.10 nm per cycle, which is used to determine the number of cycles to achieve a specific thickness. In this study, we deposited ALD-ZrO2 on Zn foils in a thickness of 2, 5, 10 and 20 nm. We also deposited 100 nm ZrO2 on a Si-wafer to verify the thickness by SEM.2.2 Soaking ALD-ZrO2@Zn in 2 M ZnSO4
To evaluate the interactions between the Zn anode and ZnSO4 (Sigma-Aldrich, Bioultra) solution, the prepared ALD-ZrO2@Zn and pure Zn foils (13 mm in diameter, 2 mm in thickness) were soaked in a 10 mL 2 M ZnSO4, while the pH of the ZnSO4 solution was periodically monitored using a pH meter (VWR, SB70P). After 200 hours of soaking, the surface of the reacted Zn foil was examined by SEM-EDS and XRD.2.3 Electrochemical testing of the ALD-ZrO2@Zn anode
Three types of electrochemical cells were constructed to study the electrochemical properties of the fabricated ALD-ZrO2@Zn anode.2.4 Characterization
The phase composition of the reacted Zn surface was examined with an X-ray diffractometer (Rigaku MiniFlex II) equipped with Cu Kα radiation (λ = 1.5418 Å) over a 2θ = 10–80° range with a step size of 0.02° and a scanning rate of 2 min−1. The microstructures of the reacted Zn surface and cross sections were characterized using a field emission scanning electron microscope (FESEM, Zeiss Ultraplus) equipped with energy-disperse X-ray spectroscopy (EDX). To get a clear view of the cross-section, the Zn foils were first treated in liquid nitrogen, followed by breaking with a sharp edge. The surface chemical compositions and oxidation states of the ALD-ZrO2@Zn layer was analyzed by X-ray photoelectron spectroscopy (XPS, Kratos AXIS Ultra DLD) with Al Kα X-ray radiation (hλ = 1.5 keV). To probe the thickness of ALD-ZrO2, depth profiling was also adopted using an Ar+ ion gun at a 4 keV acceleration voltage interleaved with XPS analysis.In addition, the wettability between 2 M ZnSO4 electrolyte solution and ALD-ZrO2@Zn and uncoated Zn foils was examined by measuring the contact angle between a ZnSO4 solution drop and the ALD-ZrO2@Zn surface.
3. Results and discussion
3.1 The state of as-deposited ALD-ZrO2@Zn
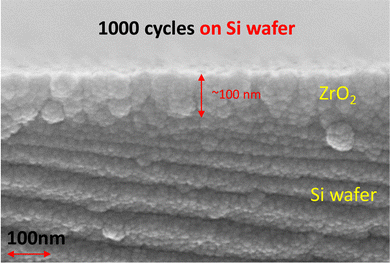
To check the thickness and microstructure of ALD-ZrO2, we used a Si-wafer as a substrate for the deposition. The microstructure/thickness of a ∼100 nm (1000 ALD cycles) thick ALD-ZrO2@Si are shown in Fig. 1; the thickness is very close to the QCM prediction. With the limited resolution of SEM, the ZrO2 layer appears to be polycrystalline with possible gaps between grains. These physical gaps are used as direct evidence to support the mechanisms proposed in a later section.Fig. S1 (ESI†) of the physical picture of a ZnSO4 solution drop on Zn foils indicates a reduction of contact angle from 93° for pure Zn to 87° for 2 nm ALD-ZrO2@Zn. The decreased contact angle implies a better wettability of Zn foil with ZnSO4 electrolyte enabled by ALD-ZrO2 coating.
The chemical state of the as-deposited ALD-ZrO2 layer was further characterized by XPS on 10 nm ALD-ZrO2@Zn. Fig. 2(a) indicates that the Zr 3d spectrum is composed of only two peaks, 183.5 and 181.5 eV, corresponding to the characteristic peaks of 3d peaks of Zr4+. The XPS depth profiling of Fig. 2(b) reveals the intensity evolution of Zn, Zr, and O vs. etching time and confirms the thickness of ∼8 nm after 80 min etching when the Zr signal fades away; this XPS estimate roughly agrees with our QCM projection.
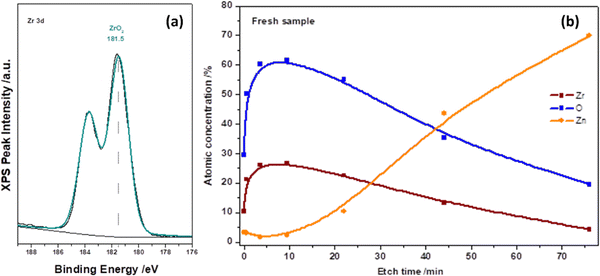 | ||
| Fig. 2 XPS spectra of (a) Zr 3d and (b) depth profiling of Zr and O in an as-deposited 10 nm ALD-ZrO2@Zn. | ||
3.2 The state of ALD-ZrO2@Zn after soaking in 2 M ZnSO4 electrolyte
It has been widely reported that the Zn-corrosion process leads to a pH rise of the ZnSO4 solution because of the hydrogen evolution reaction (HER)22–24 and possible oxygen reduction reaction (ORR) from dissolved oxygen.25–27 To verify the effectiveness of ALD-ZrO2 in mitigating the Zn-electrolyte reactions, we also performed the soaking experiment. The time-dependent pH change of ZnSO4 solution soaking ALD-ZrO2@Zn is shown in Fig. 3(a). For the coated samples, there is little change in pH within the first 24 hours compared to the bare Zn, implying the mitigated HER and ORR by ALD-ZrO2. However, a gradual increase in the pH is observed after 24 hours for all ALD-ZrO2@Zn samples, which eventually becomes undiscernible with the bare Zn after ∼120 hours at a saturation pH ∼ 5.4; the latter is the buffer pH for the LDH formation. The initial suppression of pH change can be understood because of the inhibited Zn-LDH formation by ALD-ZrO2 protective layer. However, further increment in pH after 24 hours implies that ALD-ZrO2 did not stop the growth of Zn-LDH, which is also confirmed by XRD patterns of Fig. S2 (ESI†) indicating the typical Zn-LDH composition (Zn4SO4(OH)6·4H2O or Zn4SO4(OH)6·H2O), regardless of ALD-ZrO2 coating. Fig. 3(b) further shows that all ALD-ZrO2@Zn samples after 200-hours soaking are covered with a substance (likely Zn-LDH). The difference among these SEM images appears to be in the morphology. For example, irregular LDHs can be observed in Fig. 3(b)-(1) for 2 nm ALD-ZrO2@Zn, which is attributed to insufficient protection by ZrO2, while much more uniform LDH layers with some spherical agglomerates can be observed at thicker ALD-ZrO2 coatings, see Fig. 3(b-2), (b-3) and (b-4); the spherical agglomerates may be viewed as nucleation cores for later LDH growth. Such nucleation is found to be more pronounced for thicker ALD-ZrO2@Zn, which may be due to the difficulty for Zn2+ to pass through the thicker ALD-ZrO2 to grow LDHs after the initial stage. Instead, more LDHs on the ALD-ZrO2@Zn sample could be formed via the reaction between Zn2+ in the electrolyte and OH− produced from dissolved oxygen with electrons from the Zn anode, and then deposited onto pre-formed Zn-LDHs over the outer ALD-ZrO2 protective layer. A detailed description can be found in a later section. Note that the surface morphology of bare Zn after soaking in ZnSO4 solution resembles Fig. 6(a-1) with extensive flake-like LDH coverage.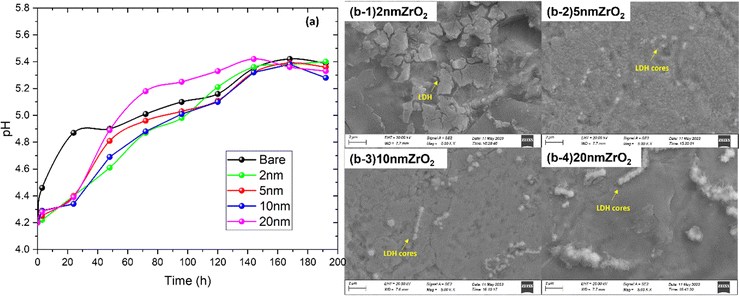 | ||
| Fig. 3 (a) pH change in 2 M ZnSO4 soaked with bare Zn and 2–20 nm ALD-ZrO2@Zn and (b-1)–(b-4) SEM images of ALD-ZrO2@Zn surface after soaking in 2 M ZnSO4 for 200 h. | ||
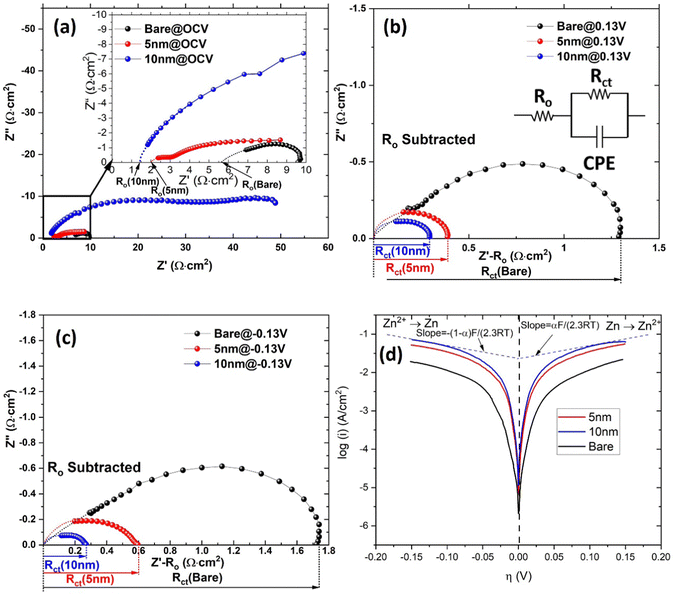
3.3 Zn/Zn2+ electrokinetics of ALD-ZrO2@Zn
The EIS spectra related to Zn WE are shown in Fig. 4 under different overpotentials. The ohmic resistance (Ro) and charge transfer resistance (Rct) were extracted using an equivalent circuit developed in our previous study.20 A clear reduction in Ro from 5.7 Ω cm2 of bare Zn to 4.1–1.4 Ω cm2 of ALD-ZrO2@Zn are observed in Fig. 4(a) and Fig. S4(a) (ESI†), depending on the thickness of ALD-ZrO2. The 10 nm thick ALD-ZrO2@Zn yields the lowest Ro of 1.4 Ω cm2, suggesting that it is not necessary for the ALD-ZrO2 coating to behave like a barrier layer to Zn2+. Instead, a delicate balance between resistances from ALD-ZrO2 and the formed LDH might be a reason for the observed trend between Ro and thickness. A comparison between Fig. 4(a) and (b) indicates that the applied DC bias (overpotential) appreciably reduces Rct, indicative of charge-transfer process being a rate limiting step for Zn/Zn2+ electrode kinetics. Moreover, Fig. 4(b), (c) and Fig. S4(b), (c) (ESI†) show that Rct decreases with ALD-ZrO2 thickness up to 10 nm. This trend is consistent with the exchange current density (i0) extracted from the PD curves of Fig. 4(d) and Fig. S4(d) (ESI†). The lower Rct or higher i0 indicates a faster Zn2+/Zn redox kinetics, which likely resulted from the high dielectric constant of ZrO2 as suggested by ref. 16 or simply suppressed LDH formation. Among all thicknesses, 5 and 10 nm ALD-ZrO2@Zn exhibit the lowest Ro and Rct, making them reasonable candidates for further testing in symmetrical and full cells (Table 1).| ALD-ZrO2 | R o (Ω cm2) | R ct@0.13 V (Ω cm2) | R ct@−0.13 V (Ω cm2) | i o (mA cm−2) |
|---|---|---|---|---|
| Bare | 5.7 | 1.7 | 1.3 | 7.42 |
| 2 nm | 4.1 | 0.8 | 0.9 | 14.7 |
| 5 nm | 2.0 | 0.6 | 0.4 | 30.4 |
| 10 nm | 1.4 | 0.3 | 0.3 | 50.5 |
| 20 nm | 3.2 | 0.2 | 0.1 | 23.5 |
3.4 ALD-ZrO2@Zn anode in symmetrical cells
The results of symmetrical cell testing also confirm the 3-electrode beaker cell results. Fig. 5 shows different voltage responses to current excursion. The bare Zn exhibited the most sensitive voltage response to the current, indicating its resistive nature due to the formed LDH layer, and 10 nm ZrO2 exhibited a similar voltage response but at lower overpotentials, implying a less resistive surface layer. Only 5 nm ZrO2 coated Zn exhibited abnormal behavior, i.e., the voltage response does not follow the current, showing significant oscillations initially. We speculate that this initial instability could be due to the dynamic surface changes. Once the surface reached equilibrium, a low-resistance layer was formed, leading to the lowest overpotential (∼10 mV at 1 mA cm−2) among the three samples. We do not have solid evidence to prove that the low overpotential was due to cell shorting at this point. Overall, the 5 and 10 nm ALD-ZrO2@Zn can stably operate under 1 mA cm−2 for 600 hours with only ∼10–20 mV overpotential. In comparison, the baseline bare Zn lasts a much shorter time with a much higher overpotential (∼ 40 mV) at 1 mA cm−2. The performance of 2 and 20 nm ALD-ZrO2@Zn falls expectedly in between the baseline and 5, 10 nm ALD-ZrO2@Zn samples, see Fig. S5 (ESI†).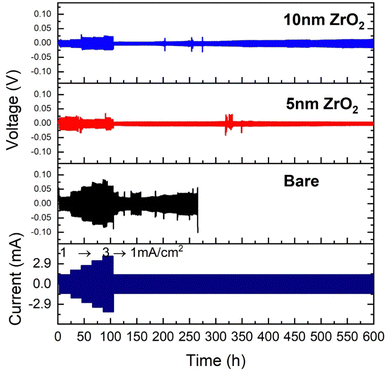 | ||
| Fig. 5 Cycling stability of symmetrical coin cells at ±1 to ±3 mA cm−2 with 2 M ZnSO4/glass fiber as electrolyte and bare Zn, and 5 nm and 10 nm ALD-ZrO2@Zn as electrodes. | ||
Fig. 6 of the microstructures/morphologies of the tested ALD-ZrO2@Zn and bare Zn provides the needed evidence to understand the symmetrical cell testing results. Thick (∼ 6 μm) flake-like Zn-LDHs are clearly observed on the surface of bare Zn in both top and cross-sectional views in Fig. 6(a), while the EDX line scan clearly indicates that the surface layer is rich in Zn, S and O, confirming the composition of Zn-LDH. The latter is also confirmed by Fig. S5 (ESI†) of XRD patterns of the surface. Such a thick, irregular layer and non-conductive LDH layer is clearly the reason for the observed high area specific resistances (ASR) shown in Fig. 4 and high and oscillating overpotentials observed in Fig. 5.
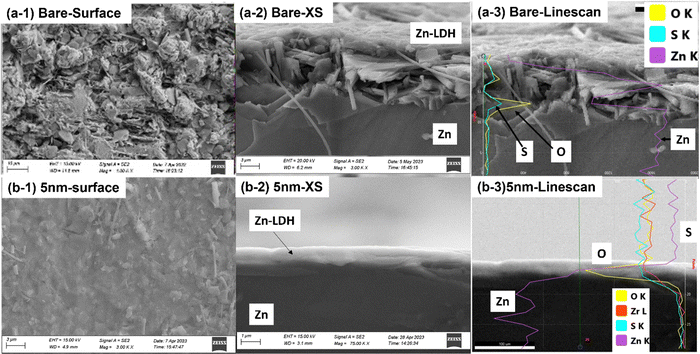 | ||
| Fig. 6 SEM analysis of Zn electrode after symmetrical cell tests. (a) Bare Zn; and (b) 5 nm ALD-ZrO2@Zn. | ||
In contrast, Fig. 6(b) shows a smooth, thin (∼1 μm) and uniform surface layer on 5 nm ALD-ZrO2@Zn as an example. The EDX line scan confirms its Zn-LDH composition. The latter is also confirmed by Fig. S6 (ESI†) of XPS spectra. Such a thin and dense surface layer supports the low ASR shown in Fig. 4 and the observed low and stable overpotential in Fig. 5.
For comparison, SEM/EDX results for 2, 10 and 20 nm ALD-ZrO2@Zn are provided in Fig. S7 (ESI†). It appears that too thin an ALD-ZrO2 coating leaves behind a cracking surface with a relatively thick LDH surface layer, whereas too thick an ALD-ZrO2 coating results in a thinner LDH layer. But the high resistance of ALD-ZrO2 layer contributes to a higher overpotential.
3.5 ALD-ZrO2@Zn anode in full cells
The electrochemical performance of the full batteries with ALD-ZrO2@Zn as the anode, ZnVO as the cathode and 2 M ZnSO4/glass fiber as the electrolyte is shown in Fig. 7. The discharge capacities of cells with varying thickness ALD-ZrO2@Zn anodes at 0.3, 0.6, 1.0, 2.0, 4.0, and 5.0 A g−1 are plotted in Fig. 7(a) for comparison. It clearly shows that 5 and 10 nm ALD-ZrO2@Zn anodes exhibit the best capacity reversibility vs. current density. Compared to a full cell with bare Zn as the anode and the same cathode and electrolyte as that reported in our early study,21 the rate performance is comparable, suggesting the ALD-ZrO2@Zn with the right thickness does not affect the performance.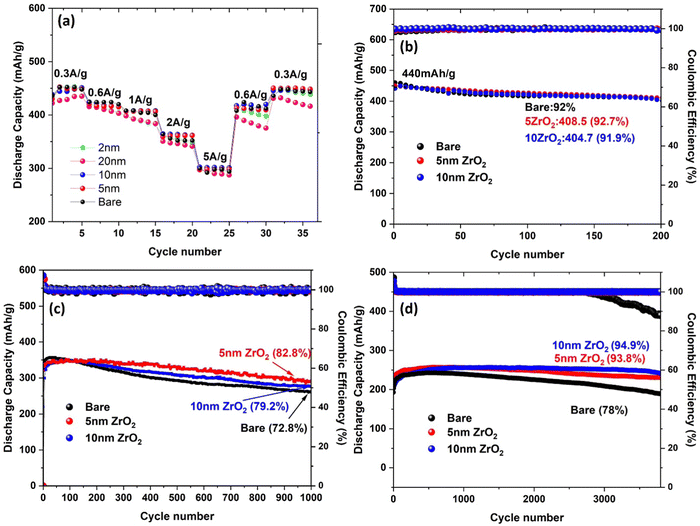 | ||
| Fig. 7 Stability of ZnVO|2 M ZnSO4|ALD-ZrO2@Zn full batteries at (a) different rates of 0.3–5 A g−1, (b) low 0.3 A g−1, (c) medium 2 A g−1 and (d) high 10 A g−1. | ||
At a low current rate of 0.3 A g−1, Fig. 7(b) shows no significant difference in cycle stability between the baseline, 5 and 10 nm ALD-ZrO2@Zn anodes, retaining over 90% of original 440 mA h g−1 after 200 cycles. The insignificant difference is probably due to the low partial contribution from the Zn anode at lower current densities and the stable performance of the ZnVO cathode. As the current rate increases to 2 A g−1, Fig. 7(c) starts to show the difference in stability with different anodes. Clearly, 5 nm ALD-ZrO2@Zn outperforms the others, retaining 82.8% of the original 350 mA h g−1 after 1000 cycles. As the current rate continues to increase to 10 A g−1, Fig. 7(d) shows that 10 nm ALD-ZrO2@Zn is the best anode for 3500 cycles. For other thicknesses of ALD-ZrO2@Zn anodes, Fig. S8 (ESI†) summarizes the performance, which further complements the above conclusion.
To help understand the observed performance disparities, Fig. S10 (ESI†) of SEM images taken from all samples after testing at 2 A g−1 shows discernable differences: (1) abundant Zn-LDHs flakes on the surface of bare Zn and 2 nm ALD-ZrO2@Zn; (2) a uniform layer of Zn-LDHs on 5 nm ALD-ZrO2@Zn, suggesting that ALD-ZrO2 does play a role in suppressing Zn-LDHs growth, consistent with the observations in soaking and symmetrical cell experiments shown above; (3) similar surface morphology for 10 nm ALD-ZrO2@Zn; and (4) a certain degree of nucleated particles spotted on the surface of 20 nm ALD-ZrO2@Zn. In this case, while Zn-LDH is suppressed, the thick ALD-ZrO2 contributes to a higher ASR. The major composition of these surface products is basically Zn-LDHs as evidenced by XRD shown in Fig. S9 (ESI†), revealing the nature of the inevitable formation of Zn-LDHs with or without ALD-ZrO2.
3.6 Discussion of the stability enhancement mechanisms by ALD-ZrO2
To facilitate the understanding of non-Zn2+-blocking behavior by the ALD-ZrO2, we constructed a separate galvanic cell with 10 nm ALD-ZrO2@Zn as WE, 2 M-ZnSO4 as electrolyte, Ag/AgCl as RE and Pt as CE. We applied a constant current of 10 mA cm−2 to strip Zn through ALD-ZrO2@Zn, while monitoring cell voltage vs. time. Fig. S11 (ESI†) (a) shows a slow and steady increase of voltage from 0.4 V to ∼1.0 V in the first 2 hours, followed by a much higher increase. After testing, both ALD-ZrO2@Zn WE and Pt CE were examined visually. It is evident from Fig. S11(b) (ESI†) that the Zn underneath the ALD-ZrO2 layer has been mostly consumed, while the substance on the Pt CE is confirmed by XRD to be primarily Zn with minor ZnS and S. This finding suggests that Zn in ALD-ZrO2@Zn has been electrochemically transported to Pt through the ALD-ZrO2 layer. The ZnS and sulfur are likely the products of the decomposition of ZnSO4 during the last high-voltage period. Therefore, it is reasonable to conclude that the ALD-ZrO2 layer is permeable to Zn2+. A possible pathway for Zn2+ transport could be the physical pores present in the ALD-ZrO2 nanolayer as shown in Fig. 1.Based on the above experimental results, we propose the following mechanisms to explain the formation of Zn-LDH on the surface of ALD-ZrO2. The mechanisms encompass three stages. In stage-1, Zn2+ directly migrates to the surface of Zn underneath ALD-ZrO2 through the pores and reacts with Zn2+, forming Zn-LDH via the following reaction:
| 4Zn2+ + SO42− + 6OH− + nH2O = Zn4SO4(OH)6·nH2O |
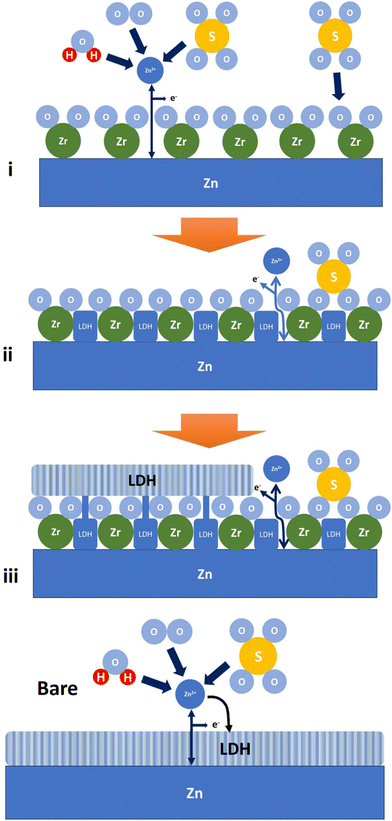 | ||
| Fig. 8 A schematic illustrating the formation of Zn-LDH on ALD-ZrO2@Zn and bare Zn. Label (i)–(iii) refers to stage 1–3 as discussed, respectively. | ||
4. Conclusions
In this study, we have demonstrated that 5–10 nm thick ALD-ZrO2 can effectively regulate the growth of passive layer – LDHs – on the surface of Zn anode, forming a dense, thin, and continuous morphology and thus resulting in low ASRs and overpotentials, and excellent cycle stability over a broad range of C-rates. We found that too thin an ALD-ZrO2 coating would be insufficient to regulate LDH growth, while too thick an ALD-ZrO2 coating would lead to higher ASRs and overpotentials. A simple mechanism based on microstructural observations has been proposed to explain the LDH formation on the surface of ALD-ZrO2 through a three-stage process.Conflicts of interest
There are no conflicts to declare.Acknowledgements
The research was sponsored by the ARO and was accomplished under grant number: W911NF-21-1-0308. The views and conclusions contained in this document are those of the authors and should not be interpreted as representing the official policies, either expressed or implied, of ARO or the U.S. Government. The U.S. Government is authorized to reproduce and distribute reprints for Government purposes notwithstanding any copyright notation herein. The authors would like to acknowledge Phasma Labs Inc. for the XPS measurements and analysis.References
- Z. Yi, G. Chen, F. Hou, L. Wang and J. Liang, Adv. Energy Mater., 2021, 11, 2003065 CrossRef CAS.
- J. Mei, T. Liao, J. Liang, Y. Qiao, S. X. Dou and Z. Sun, Adv. Energy Mater., 2020, 10, 1901997 CrossRef CAS.
- C. Xu, H. Du, B. Li, F. Kang and Y. Zeng, Electrochem. Solid-State Lett., 2009, 12, A61 CrossRef CAS.
- A. Konarov, N. Voronina, J. H. Jo, Z. Bakenov, Y.-K. Sun and S.-T. Myung, ACS Energy Lett., 2018, 3, 2620–2640 CrossRef CAS.
- W. Lu, C. Xie, H. Zhang and X. Li, ChemSusChem, 2018, 11, 3996–4006 CrossRef CAS PubMed.
- R. Wang, D. Kirk and G. Zhang, J. Electrochem. Soc., 2006, 153, C357 CrossRef CAS.
- H. Jin, S. Dai, K. Xie, Y. Luo, K. Liu, Z. Zhu, L. Huang, L. Huang and J. Zhou, Small, 2022, 18, 2106441 CrossRef CAS PubMed.
- C. Xia, J. Guo, Y. Lei, H. Liang, C. Zhao and H. N. Alshareef, Adv. Mater., 2018, 30, 1705580 CrossRef PubMed.
- P. Oberholzer, E. Tervoort, A. Bouzid, A. Pasquarello and D. Kundu, ACS Appl. Mater. Interfaces, 2018, 11, 674–682 CrossRef PubMed.
- H. Pan, Y. Shao, P. Yan, Y. Cheng, K. S. Han, Z. Nie, C. Wang, J. Yang, X. Li and P. Bhattacharya, Nat. Energy, 2016, 1, 1–7 Search PubMed.
- B. Lee, H. R. Seo, H. R. Lee, C. S. Yoon, J. H. Kim, K. Y. Chung, B. W. Cho and S. H. Oh, ChemSusChem, 2016, 9, 2948–2956 CrossRef CAS PubMed.
- D. Kundu, B. D. Adams, V. Duffort, S. H. Vajargah and L. F. Nazar, Nat. Energy, 2016, 1, 1–8 Search PubMed.
- J. Cao, D. Zhang, R. Chanajaree, Y. Yue, Z. Zeng, X. Zhang and J. Qin, Adv. Powder Mater., 2022, 1, 100007 CrossRef.
- H. Jia, Z. Wang, B. Tawiah, Y. Wang, C.-Y. Chan, B. Fei and F. Pan, Nano Energy, 2020, 70, 104523 CrossRef CAS.
- W. Du, E. H. Ang, Y. Yang, Y. Zhang, M. Ye and C. C. Li, Energy Environ. Sci., 2020, 13, 3330–3360 RSC.
- P. Liang, J. Yi, X. Liu, K. Wu, Z. Wang, J. Cui, Y. Liu, Y. Wang, Y. Xia and J. Zhang, Adv. Funct. Mater., 2020, 30, 1908528 CrossRef CAS.
- Z. Zeng, Y. Zeng, L. Sun, H. Mi, L. Deng, P. Zhang, X. Ren and Y. Li, Nanoscale, 2021, 13, 12223–12232 RSC.
- H. He, H. Tong, X. Song, X. Song and J. Liu, J. Mater. Chem. A, 2020, 8, 7836–7846 RSC.
- K. Zhao, C. Wang, Y. Yu, M. Yan, Q. Wei, P. He, Y. Dong, Z. Zhang, X. Wang and L. Mai, Adv. Mater. Interfaces, 2018, 5, 1800848 CrossRef.
- R. Rajabi, S. Sun, A. Billings, V. F. Mattick, J. Khan and K. Huang, J. Electrochem. Soc., 2022, 169, 110536 CrossRef CAS.
- K. Zhu, T. Wu, W. van den Bergh, M. Stefik and K. Huang, ACS Nano, 2021, 15, 10678–10688 CrossRef CAS PubMed.
- W. Zhang, Y. Dai, R. Chen, Z. Xu, J. Li, W. Zong, H. Li, Z. Li, Z. Zhang and J. Zhu, Angew. Chem., Int. Ed., 2023, 62, e202212695 CrossRef CAS PubMed.
- L. E. Blanc, D. Kundu and L. F. Nazar, Joule, 2020, 4, 771–799 CrossRef CAS.
- Q. Li, A. Chen, D. Wang, Z. Pei and C. Zhi, Joule, 2022, 6, 273–279 CrossRef.
- R. Sun, D. Han, C. Cui, Z. Han, X. Guo, B. Zhang, Y. Guo, Y. Liu, Z. Weng and Q.-H. Yang, Angew. Chem., 2023, e202303557 CAS.
- S.-B. Wang, Q. Ran, R.-Q. Yao, H. Shi, Z. Wen, M. Zhao, X.-Y. Lang and Q. Jiang, Nat. Commun., 2020, 11, 1634 CrossRef CAS PubMed.
- L. Su, L. Liu, B. Liu, J. Meng and X. Yan, Iscience, 2020, 23, 100995 CrossRef CAS PubMed.
Footnote |
| † Electronic supplementary information (ESI) available. See DOI: https://doi.org/10.1039/d3ya00400g |
| This journal is © The Royal Society of Chemistry 2024 |

