 Open Access Article
Bimetallic and plasmonic Ag and Cu integrated TiO2 thin films for enhanced solar hydrogen production in direct sunlight†
Sunesh S.
Mani
a,
Sivaraj
Rajendran
a,
Pushkaran S.
Arun
 a,
Aparna
Vijaykumar
a,
Thomas
Mathew
*a and
Chinnakonda S.
Gopinath
a,
Aparna
Vijaykumar
a,
Thomas
Mathew
*a and
Chinnakonda S.
Gopinath
 *bc
*bc
aDepartment of Chemistry, St. John's College, Anchal, Kerala 691308, India. E-mail: thomasmathew@stjohns.ac.in
bCatalysis and Inorganic Chemistry Division, CSIR – National Chemical Laboratory, Dr HomiBhabha Road, Pune 411 008, India. E-mail: cs.gopinath@ncl.res.in
cAcademy of Scientific and Innovative Research (AcSIR), Ghaziabad 201002, India
First published on 8th March 2024
Abstract
Plasmonic metal nanoparticle-integrated mesoporous TiO2 nanocomposites (Ag/TiO2, Cu/TiO2 and Ag–Cu/TiO2), prepared by a simple chemical reduction method, have been demonstrated to show superior activity in thin-film form for solar H2 generation in sunlight. Integration of Ag + Cu on TiO2 significantly enhances the solar H2 production due to the combined SPR effect of both metal species and the possible synergistic interaction among Cu + Ag in Ag–Cu/TiO2. TiAgCu-1 (0.75 wt% Ag and 0.25 wt% Cu on TiO2) showed the highest H2 yield of 6.67 mmol h−1 g−1 and it is 43 times higher than that of bare TiO2. The thin-film form of TiAgCu-1 shows 5 times higher solar H2 production than its powder counterpart. 1 wt% of Ag or Cu on TiO2 shows a H2 yield of 4.6 or 2 mmol h−1 g−1, respectively, which underscores the importance of combined or synergistic effects. The increase in solar H2 generation in Ag–Cu/TiO2 is attributed to factors such as the SPR effect of Cu and Ag, and strong interaction between Ag and Cu. The high photocatalytic efficiency of the TiAgCu-1 thin film is attributed to the large dispersion of metallic species with relatively high Ag/Cu surface atomic ratio, enhanced light absorption, a heterogeneous distribution of Ag and Cu species, and high double layer capacitance. The inter particle mesoporous network increases the interfacial charge transfer and reduces the mass transfer limitations. The plausible photocatalytic reaction mechanism could involve the combination of direct electron transfer from metal (Cu/Ag) to TiO2 as well as the significant field effect due to the Ag–Cu alloy, which is expected to increase the electron excitation locally.
Introduction
The development of electronically integrated photocatalytic materials that could efficiently catalyze water splitting by utilizing solar energy to produce clean H2 is of great importance, especially in view of the world wide focus on the use of renewable energy and the increasing concern regarding environmental issues.1–5 Ever since the potential of TiO2 in photocatalytic applications was realized by Fujishima and Honda in 1972, there has been a perpetual interest in the design and fabrication of visible light-driven photocatalytic materials for practical applications.5–7 Integration with metal nanoparticles, which also exhibit surface plasmon resonance (SPR), is one of the effective strategies for enhancing the visible light harvesting capability and photocatalytic performance of TiO2 by suppressing the electron–hole recombination.8 Recently, we have reported the synthesis of Ag/TiO2 and M-Au/TiO2 (M = Ag, Pd and Pt) nanocomposites with accessible mesopores and demonstrated the high potential of this material for solar H2 evolution.2 The SPR effect shown by Ag nanoparticles enhances the absorption of visible light.9–11 However, it is more desirable that the activity of Ag/TiO2 can be improved in a way by adding a synergistically interacting and catalytically active metal, such as Cu into it; indeed this is expected to make it a bimetal/alloy nanoparticle system,12 which would improve the charge separation and also provide more active sites for efficient H2 production.5,13 Among the 3d transition metal series, Cu is one of the preferred choices due to its SPR nature, co-catalytic ability, and fast electron transfer rate.14 The combined effect of Cu and Ag in enhancing the photocatalytic activity with Ag–Cu/TiO2 photocatalysts by taking advantage of the co-catalytic as well as SPR effect of both Ag and Cu has not been reported in the literature.13 Incorporation of Cu in Ag/TiO2 brings changes in the physico-chemical characteristics, such as the availability of two metals on the TiO2 surface, and possible redox interactions in close-proximity can minimize the electron–hole recombination rate.15,16In the present manuscript, we report the synthesis of metal–TiO2 mesoporous nanocomposites (Ag/TiO2, Cu/TiO2 and Ag–Cu/TiO2) by integrating metal nanoparticles on mesoporous TiO2 through a simple chemical reduction method. The photocatalytic H2 production activity of these materials in thin-film form was evaluated in detail and demonstrated the superior catalytic performance of bimetallic Ag–Cu/TiO2 over single metal (Ag or Cu)/TiO2 nanocomposites. Although the photocatalytic H2 evolution activity of the bimetallic Ag–Cu/TiO2 photocatalytic material is reported in the literature,13,15,17 to the best of our knowledge, Ag–Cu/TiO2 nanocomposites fabricated in thin-film form with the highest solar hydrogen evolution in direct sunlight and a detailed structure–activity relation are reported for the first time in the present manuscript.
Experimental
Synthesis of mesoporous TiO2, Cu/TiO2 and Ag–Cu/TiO2 nanocomposites
The chemicals used for the synthesis of mesoporous TiO2, Cu/TiO2, Ag/TiO2 and Ag–Cu/TiO2 nanocomposites include titanium tetra-isopropoxide (TTIP) (Sigma Aldrich), silver nitrate (Sigma Aldrich), copper nitrate tri hydrate (Loba-Chimie), polyethylene oxide (PEO) (average molecular weight: 100![[thin space (1/6-em)]](https://www.rsc.org/images/entities/char_2009.gif) 000, Sigma Aldrich), hydrazine hydrate (Loba-Chemie), formamide (Loba-Chemie), nitric acid (Loba-Chemie), ammonia (28–30%) (Loba-Chemie), iso-propyl alcohol (Loba-Chemie), and n-hexane (Loba-Chemie). All the chemicals were used as supplied, without any further purification.
000, Sigma Aldrich), hydrazine hydrate (Loba-Chemie), formamide (Loba-Chemie), nitric acid (Loba-Chemie), ammonia (28–30%) (Loba-Chemie), iso-propyl alcohol (Loba-Chemie), and n-hexane (Loba-Chemie). All the chemicals were used as supplied, without any further purification.
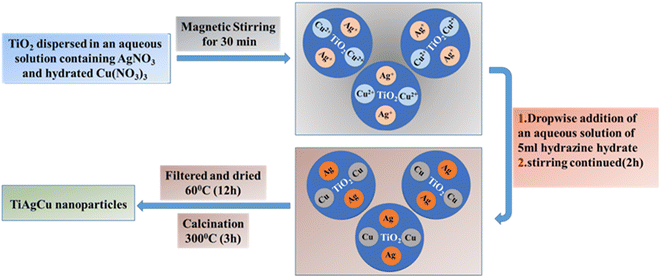
The synthesis of mesoporous TiO2 nanoparticles was accomplished via a sol–gel technique as previously reported by our group.2 Briefly, the synthesis of TiO2 nanoparticles was carried out in aqueous medium using a mixture of TTIP as a Ti source, acetic acid as a peptizing agent, and PEO as a surfactant. Formamide and NH3 were used for adjusting the pH to get titania gel followed by a sequence of solvent exchange processes using isopropanol and n-hexane. The solvent-free gel was then allowed to dry at 60 °C for 48 h and finally calcined at 500 °C at a heating rate of 2 °C min−1. Cu integrated TiO2 nanocomposites with different Cu content (0.5, 1 and 5 wt%) were prepared by using hydrazine hydrate as a reducing agent. Briefly, the required amount of Cu(NO3)2·3H2O was dissolved in 95 mL water and the calculated amount of mesoporous TiO2 nanoparticles was introduced into this solution. Chemical reduction of Cu2+ ions on TiO2 was carried out by adding about 5 mL hydrazine hydrate–water mixture (containing 0.9 g hydrazine hydrate) drop-wise under vigorous stirring. During the addition, a change in the colour of the suspension from white to reddish brown was observed, which indicates the reduction of Cu2+ to Cu0. The entire mixture was then kept for 2 h under stirring, followed by drying at 60 °C for 12 h and calcination at 300 °C for 3 h. The Cu/TiO2 nanocomposites thus prepared in the present study are designated as TiCu-0.5 (0.5 wt% Cu on TiO2), TiCu-1 (1 wt% Cu on TiO2), and TiCu-5 (5 wt% Cu on TiO2), hereafter. Ag–Cu/TiO2 nanocomposites with different wt% of Ag and Cu were prepared by a similar procedure using the respective metal ion sources Cu(NO3)2·3H2O and AgNO3 in the required proportions and the samples are designated as TiAgCu-1 (0.75 wt% Ag and 0.25 wt% Cu on TiO2), TiAgCu-2 (0. 5 wt% Ag and 0.5 wt% Cu on TiO2), and TiAgCu-3 (0.25 wt% Ag and 0.75 wt% Cu on TiO2). For comparison, 1 wt% Ag/TiO2 (TiAg-1) was also prepared, as described above, with the required amount of AgNO3.
Material characterization
X-ray powder diffraction (XRD) analysis was carried out on a Bruker D8 Avance diffractometer using Cu Kα radiation (λ = 1.540598 Å) and a Ni-filter. The data were collected with a step size of 0.02° at a scan rate of 0.5° min−1. Transmission electron microscopy (TEM) images were recorded using a Jeol/JEM 2100 electron microscope operating at 200 kV and the images were analysed using Image J software. HRTEM EDS mapping was conducted on a JEOL JEM F-200 HTEM instrument operating at 200 kV equipped with EDS; since the catalysts contain Cu, a gold-coated grid was employed to measure the Cu and Ag content. UV-visible spectral measurement was performed using an Agilent spectrophotometer (Cary 5000) under absorption mode for the powder sample with spectral-grade BaSO4 as the reference material. X-ray photoelectron spectra (XPS) were acquired from a Thermo Scientific ESCALAB Xi+ kα spectrometer using a monochromatic Al Kα anode (1486.6 eV) as the X-ray source. Static charge correction was made with reference to the C 1s peak (284.6 eV).Photoelectrochemical measurements
Transient photocurrent measurements were performed with an electrochemical workstation (CHI 6041E). The catalyst sample coated as a thin film on a fluorine-doped tin oxide (FTO) glass plate to 1.0 cm2 area was used as the electrode for measurements. The electrochemical experiments were carried out in a 0.5 M Na2SO4 (pH = 7.5) electrolyte solution at a potential of 1.23 V (vs. NHE). A LED lamp (50 W) was used as the light source. A three-electrode system was used for electrochemical measurement, which included Pt wire, Ag/AgCl, and the electrode material prepared on an FTO plate as the counter electrode, the reference electrode, and working electrode, respectively. The electrochemical impedance was measured using a similar experimental setup.Photocatalytic activity measurements
The photocatalytic hydrogen production activity of mesoporous TiO2, Cu/TiO2 and the Ag–Cu/TiO2 nanocomposites in both powder and thin film forms were evaluated under direct sunlight between 10 am and 4 pm during April/May months in our laboratory premises at Anchal, Kerala, India using aqueous methanol 25% (v/v) solution.2 An optimized amount of 1 mg of the photocatalyst was dispersed in 1 mL ethanol and the suspension obtained after sonication of it was then drop cast on a glass substrate of dimensions 1.25 × 3.75 cm2 to make a thin film of the photocatalyst. The dried film was then carefully kept inside in a 70 mL capacity quartz round bottom flask (RBF) containing aqueous methanol solution and closed with an air tight septum. The RBF was de-aerated by purging N2 gas for 30 min before the activity measurement. The activity of the catalyst was also tested with 1 mg of powder sample under similar conditions. The powder material was made in suspension form by sonication for 15 min to obtain a uniform dispersion of the catalyst before the photocatalytic measurements. The activity of the powder or thin film catalyst was investigated under stirring conditions in direct sunlight. The hydrogen evolution from different catalysts was analyzed periodically with a PerkinElmer Clarus 590 gas chromatograph (GC) equipped with a thermal conductivity detector at 200 °C. The apparent quantum yield (AQY) of solar hydrogen for all the catalysts was calculated according to the formula given in eqn (1).18,19 | (1) |
Results and discussion
Synthesis aspects and textural properties of the photocatalysts
The various steps involved in metal integration with mesoporous TiO2 are provided in Scheme 1 by illustrating the preparation of mesoporous Ag–Cu/TiO2. All nanocomposites (Ag/TiO2, Cu/TiO2 and Ag–Cu/TiO2) in the present study were prepared by a chemical reduction method using hydrazine as the reducing agent. Cu(NO3)2·3H2O and AgNO3 in required proportions were used as the Cu and Ag source, respectively. During the reduction process, Cu2+ and Ag+ were reduced to Cu0 and Ag0, respectively. Mesoporous TiO2 with high surface area (98 m2 g−1) was employed for post-modification, as reported earlier.2a The interconnected mesoporous TiO2 network with significant pore volume (0.2 mL g−1) provides a large number of unsaturated as well as oxygen vacancy sites with high electron density are primarily the sites for Cu2+ and Ag+ ions to adsorb followed by reductive integration with titania in the presence of hydrazine. Thereby a high dispersion and integration of Cu and Ag on TiO2 could be achieved in the reduction process. A large number of electron rich sites with a reducing agent are capable of controlling the metal particle size and thereby highly dispersed metal/TiO2 is produced.20 Another advantageous aspect of hydrazine being used as a reducing agent is that high purity samples are obtained by this technique, since water and N2 are produced as by-products during the heating process.20 The physicochemical analysis of mesoporous TiO2 and various metal incorporated TiO2 nanocomposites was carried out and some relevant characteristics are compared in Table 1.| Photocatalyst | Crystallite size/nma | H2 yield (mmol h−1 g−1)b (AQY)b |
|---|---|---|
| a Obtained from the Scherrer equation using the anatase (101) feature. b Hydrogen evolution rate and apparent quantum yield (AQY) are measured for the photocatalyst in thin-film form. | ||
| TiO2 | 8.2 | 0.16 (0.06 × 10⁻²) |
| TiAg-1(1 wt% Ag/TiO2) | 7.8 | 4.59 (1.85× 10⁻²) |
| TiCu-0.5(0.5 wt% Cu/TiO2) | 13.1 | 2.08 (0.83 × 10⁻²) |
| TiCu-1(1 wt% Cu/TiO2) | 14.2 | 1.90 (0.76 × 10⁻²) |
| TiCu-5(5 wt% Cu/TiO2) | 13.8 | 1.10 (0.44 × 10⁻²) |
| TiAgCu-1 (0.75 wt% Ag + 0.25 wt% Cu/TiO2) | 13.0 | 6.67 (2.69 × 10⁻²) |
| TiAgCu-2(0.5 wt% Ag + 0.5 wt% Cu/TiO2) | 14.0 | 5.05 (2.03× 10⁻²) |
| TiAgCu-3 (0.25 wt% Ag + 0.75 wt% Cu/TiO2) | 12.2 | 5.95 (2.40 × 10⁻²) |
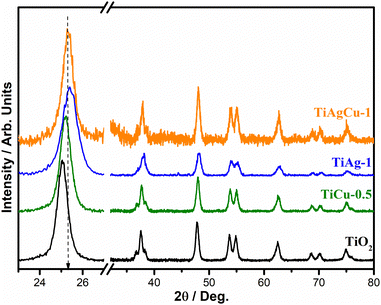
The XRD patterns of TiO2 and the metal integrated TiO2 nanocomposites are shown in Fig. 1. The crystallite size of the different composites was determined by the Debye–Scherrer equation24 using the (101) feature of TiO2 in the XRD pattern and found to be in the range of 8–14 nm (Table 1). Although well-defined crystalline peaks are observed in all cases, the broadened feature of the XRD patterns indicates that the materials are nanocrystalline in nature. The TiO2, TiCu-0.5, TiAg-1 and TiAgCu-1 composites exhibit diffraction features that are characteristic of the anatase phase of TiO2 (JCPDS no. 21-1272).13,21,22
No diffraction peaks characteristic of metallic phases of Ag and Cu, and/or copper oxide phases are observed in any of the photocatalysts.23 Generally, a high dispersion of small metal particles integrated with the TiO2 framework is the possible reason that metal diffraction features were not observed.5,15 Interestingly, a significant shift in (101) diffraction feature was observed with TiAg-1 (0.180) along with broadening; however, with Cu/TiO2 and/or TiAgCu-1 only a peak shift was observed, but without broadening. First of all, this indicates a difference in interaction between TiO2 with Ag, and Cu or Cu + Ag. The metal nanoparticles in the Ag–Cu loaded TiO2 composite may alter the surface structure of TiO2 and also may occupy the defect sites in TiO2, which leads to a slight shift in the XRD peak as previously reported.5,25 While the broadening with Ag/TiO2 indicates a decrease in crystallite size, it is the opposite with Cu and Cu + Ag. The shift observed in XRD is predominantly with the (101) facet of anatase TiO2, which is abundantly available on the titania surface; no other crystallographic facet shows observable shift, after metal Ag–Cu integration. It may also be noted that Ag loading alone does not affect the crystallite size significantly; the observed crystallite size for TiO2 and TiAg-1 is in the range of 8 ± 0.5 nm (Table 1). Nonetheless, the crystallite size of all the Cu/TiO2 and Ag–Cu/TiO2 nanocomposites was found to be 13.2 ± 2 nm, indicating the influence of Cu or Cu + Ag on the TiO2 crystallite size. It is likely that smaller Cu-size (Cu0–0.128 nm; Cu2+–0.087 nm) enhances its integration better with TiO2 than the relatively bigger size silver (Ag0–0.144 nm; Ag+–0.129 nm); in particular, the precursor ions (Cu2+ and Ag+) employed in the synthesis also suggest that a large difference in diameter and di-positive charge on copper supports its integration with electron-rich vacancy sites of titania better than silver. Nonetheless, why the crystallite size increases with Cu-containing catalysts is a question. The integration of silver and/or copper with TiO2 generally occurs through oxygen vacancy sites, which leads to a better integration of metal NPs over the TiO2 surface; this also leads to electronic integration of the metal with TiO2, which is evident from the XRD results.25
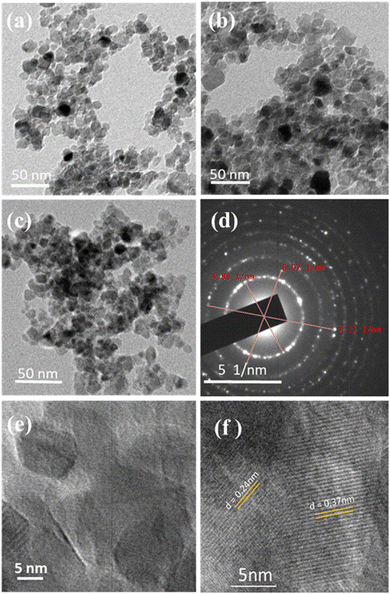
FESEM and TEM images of TiO2 and metal integrated TiO2 nanocomposites are shown in Fig. S1 (ESI†) and Fig. 2, respectively. The uniform contrast observed in the TEM images indicates that the metal nanoparticles seem to be highly dispersed.26 A porous network of particle assembly observed in Fig. 2a–c indicates the possibility of facile diffusion of the reactants and products to the reaction sites; this is also likely to help avoid mass-transfer limitations. TEM and HRTEM images demonstrate that the majority of the particles are in the size range of 13 ± 3 nm, and apparently the crystallite and particle sizes are the same, especially for Cu and/or Cu + Ag integrated TiO2. The SAED pattern of TiAgCu-1 shown in Fig. 2d is composed of well-defined circular rings with bright spots, which is characteristic of the TiO2 anatase phase. The HRTEM images of TiAgCu-1 in Fig. 2e and f illustrate that the photocatalyst is highly nanocrystalline in nature with a homogeneous distribution of metal nanoparticles on the surface of TiO2 and a number of metal–semiconductor Schottky junctions are observed. The HRTEM image of TiAgCu-1 shown in Fig. 2f reveals the (101) facet of TiO2 (0.35 nm); another interlayer d-spacing of 0.24 nm could correspond to Ag–Cu bimetal. It is to be noted that no isolated Ag and/or Cu particles were observed in the HRTEM of TiAgCu-1, which supports the formation of Ag–Cu alloy and the Schottky junctions27 observed between Cu–Ag alloy nanoparticles and the TiO2(101) facet.5 Furthermore, the Ag(111) interlayer d-spacing is reported to be between 0.23 and 0.236 nm;19 however, the significantly higher d-spacing (0.24 nm) observed is attributed to Ag–Cu alloy.28
To evaluate the dispersion of Cu and Ag on TiO2, chemical mapping was carried out with HRTEM-EDS, and the distribution of all four elements, namely Ti, O, Ag and Cu, is shown in Fig. S2 (ESI†). A uniform distribution of very small Ag and Cu particles in Fig. S2 and Table S6 in the ESI† highlights a fine distribution all over the titania surface. Such fine distribution also ensures plenty of Schottky junctions29 with titania particles and is likely to enhance the charge separation.
Absorption spectral studies of the photocatalyst nanocomposites
UV-visible absorption spectra of TiO2 and all metal incorporated TiO2 nanocomposites are shown in Fig. 3. Bare TiO2 exhibits a strong absorption below 400 nm (UV region) due to the band gap excitation of the anatase phase of TiO2. However, metal integrated TiO2 nanocomposites exhibited a prominent light absorption in the visible region due to the strong SPR effect exhibited by both Cu and Ag.11 Besides the SPR effect of the Ag (420 nm) and Cu (∼600 nm) nanoparticles, the strong interaction between TiO2 and metal nanoparticles may further enhance the optical absorption in the visible region.30 The colour change observed for the photocatalyst from white for TiO2 to green or grey tint for Cu/TiO2 or Ag/TiO2, respectively, and greyish green for Ag–Cu/TiO2 (see inset in Fig. 3) indicates that the visible light absorption is due to metal integration with TiO2. The efficiency of light absorption is extended to the visible region, after metal nanoparticles are integrated with the TiO2 matrix. Metal nanoparticles and TiO2 may have different Fermi levels, as independent entities; however, after their integration, especially after electronic integration, the Fermi level of the composite would shift closer to that of TiO2. This is expected to increase the charge separation at the Schottky junctions.5,16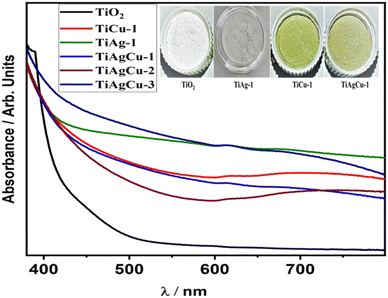 | ||
| Fig. 3 UV Visible absorption spectra of mesoporous TiO2 and representative samples of metal integrated TiO2 nanocomposites. | ||
Electrochemical studies of the photocatalyst nanocomposites
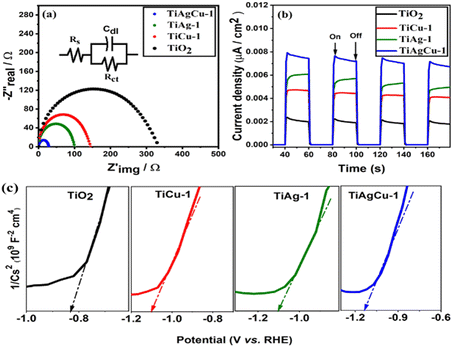
Electrochemical impedance spectroscopy (EIS) plots were recorded to investigate the kinetics and electron transport behaviour of various electrodes prepared using TiO2, TiAg-1, TiCu-1, and TiAgCu-1. The Nyquist plot for the representative samples is shown in Fig. 4a and it was analysed by fitting with an equivalent circuit model R(CR), as shown in the inset in Fig. 4a. The impedance parameters (RS, Cdl, and Rct corresponds to solution resistance, double layer capacitance, and charge transfer resistance respectively) obtained from the equivalent circuit after fitting are given in Table S1 (ESI†).31,32 It is evident from the fitting parameters (Table S1, ESI†) that the Rct values of TiO2, TiCu-1, TiAg-1, and TiAgCu-1 are 329.0, 142.70, 99.21 and 27.69 Ω, respectively. The above decreasing trend in the Rct values suggests that the electron transfer rate increases in the order TiO2 < TiCu-1 < TiAg-1 < TiAgCu-1.33 Thus, TiAgCu-1 having the lowest Rct value shows the maximum charge separation and electron transfer rate. The Cdl values of different photocatalysts decrease in the order: TiAgCu-1 > TiAg-1 > TiCu-1 > TiO2. The highest Cdl value of TiAgCu-1 implies that the material has high active surface area and this is due to its surface heterogeneity and superior electron transport characteristics. The high active surface area provides a large number of active sites for efficient water splitting reaction.34 Among the different photocatalysts, the radius of the arc in the Nyquist plots is in the order TiO2 > TiCu-1 > TiAg-1 > TiAgCu-1. A smaller impedance arc radius in the Nyquist plot indicates an efficient separation and migration of photogenerated charge carriers, and hence the lowest charge transfer resistance and high charge carrier mobility.28TiAgCu-1 exhibits the smallest impedance arc radius and the highest Cdl value, suggesting that it has the least resistance for the dispersion of charge carriers and the highest interfacial electron transfer rate among the composites studied.32,33 High electron transfer rate, efficient charge separation and increased active surface area with a large number of electro active components are factors that help to achieve improved photocatalytic performance.
Fig. 4b displays the photocurrent responses of representative samples performed in light on/off cycles in order to determine the charge density and charge separation efficiency of the photocatalysts. High and instant photocurrent response indicates an efficient dispersion of charge carriers and the separation of electrons and holes, which are essential qualities to produce photocurrent.28,35 The photocurrent density observed for various photocatalysts in the present study follows the order: TiAgCu-1 > TiAg-1 > TiCu-1 > TiO2 and it is clear evidence of the SPR effect exhibited by Cu/Ag nanoparticles. Integration of metallic particles with TiO2 increases the photocurrent density, implying that the metal species in the (Ag,Cu)/TiO2 nanocomposite increases the charge carrier separation and migration efficiency. Although 1 wt% of metal is present in TiAg-1 and TiCu-1, the atom percent is higher with the latter due to lower atomic weight of Cu (63.546) than Ag (107.868); nonetheless, TiAg-1 exhibits significantly higher photocurrent density than TiCu-1 indicating a better integration of Ag due to its smaller TiO2 crystallite size. The very low Rct value and highest photocurrent response of TiAgCu-1 demonstrates that the synergetic interaction between Ag and Cu in the composite catalyst has a remarkable ability to improve the separation and transfer of photo-generated charge carriers at the composite interface. Although the individual metal content in TiAgCu-1 (0.75 wt% Ag and 0.25 wt% Cu) is lower than that of either TiAg-1 or TiCu-1, the current density observed is higher and it directly indicates the possibility of the plasmon induced resonance energy transfer (PIRET) effect. PIRET arises through a non-radiative energy transfer process from the dipole of plasmonic metal NPs to the dipole of the excited semiconductor in a restricted area around it; indeed it is preferred, if plasmonic metal NPs and TiO2 are integrated, which enhances the energy transfer. It is very likely that direct electron transfer as well as some PIRET effect occurs in the present system. The positive slopes of the Mott–Schottky (MS) plots displayed in Fig. 4c illustrate the typical n-type semiconductor characteristics of the materials.9 The conduction band positions of TiO2, TiCu-1, TiAg-1, and TiAgCu-1 calculated from the MS plots are −0.88, −1.10, −1.12, −1.13 eV, respectively. Shifting of the conduction band position of the metal integrated TiO2 nanocomposites towards a more negative value compared to the conduction band position of pure TiO2 indicates that the metal-integrated TiO2 in the present study is highly efficient for the water reduction process.
XPS studies of the photocatalyst nanocomposites
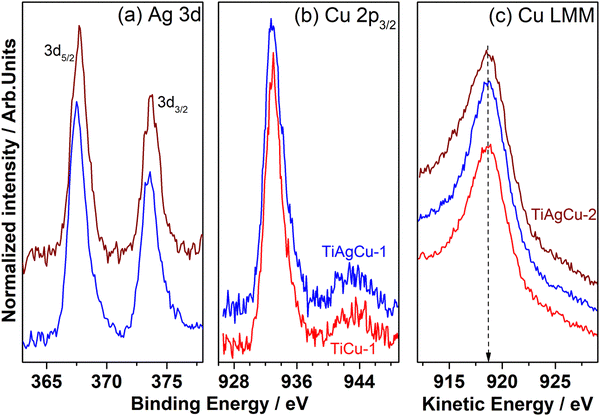
The photoelectron spectra of Ag 3d, and Cu 2p core levels and Auger electron spectra of Cu L3M45M45 are shown in Fig. 5a–c, respectively. The XPS results derived from various peak components for Cu/TiO2 and Ag–Cu/TiO2 nanocomposites are summarized in Table S2 in the ESI.† The Ti 2p core level features of all photocatalyst nanocomposites (results not shown) exhibit identical features with spin–orbit components at BE of 458.8 ± 0.2 and 464.6 ± 0.2 eV corresponding to Ti 2p3/2 and 2p1/2 peaks, respectively. The spin orbit separation (5.7 eV) and the BE values are characteristic for the Ti4+ state.36 The Ag 3d core level spectra of the Ag–Cu/TiO2 nanocomposites are displayed in Fig. 5a, which shows Ag 3d5/2 and 3d3/2 core level peaks at 367.3 ± 0.1 and 373.3 ± 0.1 eV, respectively with a spin–orbit separation of 6 eV; metallic Ag 3d5/2 appears at 368 eV, and the present set of lower BEs indicates that Ag could be in a significantly different electronic state due to integration with TiO2 and possible electron transfer to Ag from the latter.37 Lower BE shift of the Ag 3d peaks suggests that a strong electronic interaction between TiO2 and Ag nanoparticles exists through the formation of a Schottky junction.1 The Cu 2p3/2 photoelectron spectra of the Cu/TiO2 and Ag–Cu/TiO2 photocatalysts are presented in Fig. 5b showing Cu 2p3/2 core level features at BE values of around 932.7 ± 0.1 eV. Very minor satellite features are observed between 940 and 947 eV indicating some inevitable surface oxidation, due to exposure to atmospheric components. However, the Cu 2p3/2 feature observed at 932.7 eV could be due to either metallic Cu or Cu+ species, and it cannot be distinguished by core level XPS.A further confirmation of the oxidation states of Cu species in the Cu/TiO2 and Ag–Cu/TiO2 nanocomposites was obtained by analysis of the Cu LMM Auger analysis. As shown in Fig. 5c it exhibits a single component at kinetic energy (KE) value 918.7 ± 0.2 eV, which is characteristic of metallic Cu.5,38,39 The high intensity peak at 918.7 eV underscores the predominant presence of metallic Cu. It is also noted that Cu+ and Cu2+ appear at a KE of 916.8 and 918.0 eV, respectively.38,39 The modified Auger parameter (α) (Table S2 in ESI†) is a valid indicator for understanding the Cu binding state and to confirm the presence of metallic Cu in all nanocomposites evaluated.39 The modified Auger parameters calculated are 1851.4 ± 0.2 eV, indicating the larger contribution of Cu0 on all the Cu containing samples.38 Metallic Cu observed with all Cu-containing catalysts fully supports the earlier observations of Schottky junctions and visible light absorption. Different factors such as the input amount of Cu, ratio of Cu to Ag, and Ag–Cu alloy formation could contribute to the percentage of metallic Cu in the catalyst.
Photocatalytic activity evaluation of Ag/TiO2, Cu/TiO2 and Ag–Cu/TiO2 nanocomposites
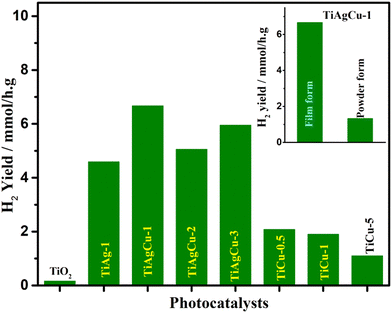
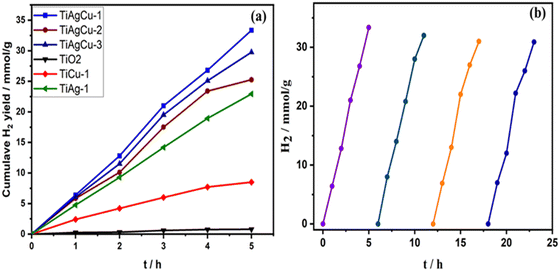
The photocatalytic hydrogen evolution activity of both powder and thin film forms of all nanocomposite materials were evaluated using an optimized amount of 1 mg catalyst (see Tables S3 and S4 for details, ESI†) and the rates of hydrogen evolution obtained for the thin-film forms are compared in Table 1 and Fig. 6. As evident in Fig. 6, a very low yield of H2 production (0.16 mmol h−1 g−1) was observed for the TiO2 thin-film; however, it increased after integration of Cu, Ag or Cu + Ag with TiO2. Among all Cu/TiO2 photocatalysts, TiCu-0.5 showed the highest hydrogen production rate and its activity was about 13 times higher than that of bare TiO2 under comparable experimental conditions. However, TiCu-1 exhibits a rate very close to that of TiCu-0.5, and within 10% error limit. Interestingly, the H2 production activity on Ag/TiO2 was higher than that of the Cu/TiO2 photocatalysts. For example, the hydrogen production rate of TiAg-1 was 4.59 mmol h−1 g−1, which is 2.3 times higher than that of the TiCu-0.5. The Ag–Cu/TiO2 nanocomposites showed higher activity, irrespective of the three different compositions attempted in this study, than single metal–TiO2 composites, suggesting that the combination of both Cu and Ag is more effective for solar H2 production. The H2 production rates on TiAgCu-1, TiAgCu-2 and TiAgCu-3 in the thin film were 6.67, 5.05 and 5.95 mmol h−1 g−1, respectively. Within 10% error limit, the TiAgCu-1 and TiAgCu-3 composites exhibit comparable activity, and a marginally decreased activity with TiAgCu-2. This suggests that the combination of two SPR metals, with possible bimetal/alloy formation, could be helpful to achieve the maximum solar hydrogen generation activity. Among various photocatalysts, TiAgCu-1 (0.75 wt% Ag and 0.25 wt% Cu) resulted in the highest H2 production rate of 6.67 mmol h−1 g−1, which is 42 times higher than that of TiO2. We also compared the photocatalytic water splitting performance of the selected photocatalysts in both powder and thin-film form under similar experimental conditions, while maintaining the same amount of catalyst (1 mg). As shown in the inset in Fig. 6, the activity of TiAgCu-1 in thin-film form (6.67 mmol h−1 g−1) was observed to be 5 times higher than that of the corresponding powder form with the same amount of particulate form of the catalyst measured in suspension. Possible reasons for the enhanced activity of the thin-film include the following: (1) the light absorption in the thin-film (10–12 μm thickness) takes place more efficiently due to larger absorption coefficient and effective utilization of the scattered light through a series of internal scattering and eventual absorption, whereas the majority of the light scatters in particulate suspension form. (2) Light penetration in the thin film is to the full depth of 10 microns, and hence the number of charge carriers generated is also enhanced, (3) The thin film form and the maximum number of catalyst particles being in contact with each other enhance the better utilization of charge carriers for the redox reactions and hence the H2 generation is also observed to be higher. (4) Photocatalyst in the thin-film form can access the maximum amount of reactants due to its larger exposed surface area and facilitate the reaction kinetics by accelerating the diffusion of photogenerated charges toward the reaction sites.5 Although the catalyst deposition over the glass plate was not uniform and inhomogeneous, H2 evolution from the entire area of the film surface under direct sunlight irradiation was evident in our study. A short video is provided in the ESI† (see Video V1, in the ESI†), which displays continuous hydrogen generation from the entire region of the thin-film surface visible to the naked eye, while it is not possible to see any H2 bubble formation in suspension. The AQY value was calculated for various photocatalysts in thin-film form revealing that the AQY is negligibly small for TiO2; TiAgCu-1 showed the highest AQY (2.7 × 10⁻²%) under direct sunlight (see Table 1). It is worth mentioning that the AQY values of all samples in thin film form were high compared to their powder counterparts due to effective light harvesting.Time on stream (ToS) dependence of solar H2 production of TiO2, TiCu-1, TiAg-1 and Ag–Cu/TiO2 in thin film form under direct sunlight was carried out to explore the sustainability aspects of the catalysts. The cumulative H2 yield obtained as a function of irradiation time is displayed in Fig. 7a. Compared to TiO2, all Ag–Cu/TiO2 composites show an almost steady and nearly equal (within 10% error) increase in H2 generation as the irradiation time progresses. For example, TiAgCu-2 and TiAgCu-3 displayed a cumulative hydrogen yield of 25.25 mmol h−1 g−1 and 29.75 mmol h−1 g−1, respectively in 5 h in the ToS study and this is much higher than pure TiO2 (0.8 mmol g−1), TiCu-1 (9.5 mmol h−1 g−1) and TiAg-1 (22.9 mmol h−1 g−1). Among the Ag–Cu/TiO2 nanocomposites, TiAgCu-1 and TiAgCu-3 displayed a steady increase in H2 yield with the highest and comparable cumulative hydrogen production of 33.35 and 29.75 mmol h−1 g−1 in 5 h, respectively, underscoring the sustainability of the catalysts.
The photostability of the best performing TiAgCu-1 photocatalyst in thin film form was studied by performing the experiments in four repeated cycles, with 5 h per cycle, to ensure the reusability of the catalyst, and the results are displayed in Fig. 7b. The rate of solar hydrogen production was almost the same for all cycles, within 10% error, indicating that the catalyst remains stable under photocatalytic experimental conditions. It is noteworthy that even without employing any binder the catalyst particles were intact on the glass plate during the entire period of the experiments in this study. However, studies with a suitable binder are suggested to evaluate the long-term stability.
The number of reports on H2 production by water splitting in direct sunlight based on the Ag–Cu/TiO2 photocatalytic system is very limited in the literature.15,16 Nonetheless, the H2 production activity of TiAgCu-1 and other Ag–Cu/TiO2 in thin-film form in the present study is significantly higher than that of various Ag/TiO2, Cu/TiO2 and Ag–Cu/TiO2 catalysts reported in the literature under comparable experimental conditions. Kotesh Kumar et al. reported that 0.5 wt% Ag–2 wt% Cu/TiO2 synthesized by the wet impregnation method showed a hydrogen production rate of 5.683 mmol g−1 h−1 under direct sunlight with aqueous methanol.15 Although this activity is nearly comparable to the activity reported in the current manuscript, a 15% decrease in activity was observed while cycling the catalysts; in addition, ref. 15 also employed a larger amount of metal content in their catalyst. The Ag–Cu bimetal-modified TiO2 displayed a hydrogen evolution rate of 1.16 mmol h−1 g−1 with aqueous methanol, under one sun conditions (100 mW cm−2).16 The photocatalytic H2 evolution reaction rate observed on Ag–Cu/TiO2 in the current work is much higher than that of Ag/TiO2 in thin-film form reported earlier from our laboratory,2 and various Ag/TiO2 and Cu/TiO2 photocatalysts reported in the literature.18,32,39–41 The hydrogen evolution activity of various Ag/TiO2, Cu/TiO2, and Ag–Cu/TiO2 photocatalysts using methanol as a sacrificial reagent reported in the literature was compared in the Table 2, fully supporting the superior activity associated with the present set of TiAgCu catalysts.
| No. | Photocatalyst | Reaction conditions | Sacrificial reagent | Activity (μmol h−1 g−1) | Ref. |
|---|---|---|---|---|---|
| 1 | Ag–Cu with co-loaded TiO2 H:(Ag–Cu/TiO2) | AM1.5G one sun condition – 100 mW cm−2 | Methanol | 1160 | 16 |
| 2 | Ag and/or Cu on TiO2 (anatase/rutile) | Direct solar light | Methanol | 5683 | 15 |
| 3 | 1 wt% Ag/TiO2(TiAg-1) | Direct sunlight | Methanol | 4590 | 2a |
| 4 | Ag@TiO2 | 300 W xenon lamp | Methanol | 531.9 | 1 |
| 5 | Cu-TiO2-P25 | Hg-vapour lamp – 315–1100 nm–125 W | Methanol | 8.74 μmol H2/min g | 3 |
| 6 | TiAgCu-1 | Direct sunlight | Methanol | 6670 | Present work |
The higher rate of hydrogen evolution activity of the Cu/TiO2 nanocomposites compared to bare TiO2 is attributed to the enhanced absorption of visible light due to the SPR effect, and efficient electron transfer from the Cu-SPR state to TiO2, which limits the combination possibility of the charge carriers.6 The relatively high photocatalytic activity of Ag/TiO2 compared to Cu/TiO2 is attributed to the relatively strong SPR effect by Ag than Cu species, apart from the smaller atom percent of Ag-content.33 Compared to Cu/TiO2 and Ag/TiO2, an unambiguous increase in the solar hydrogen activity was observed with the Ag–Cu/TiO2 nanocomposites, irrespective of the Ag–Cu composition in the present study. It is also to be noted that the individual metal content is lower than 1 wt% in the Ag–Cu case. The possible reasons that contribute to the higher activity of Ag–Cu/TiO2 are the following: (1) the combined SPR effect of Ag and Cu facilitates an enhanced absorption of solar light in a wide range of visible light wavelengths. The strong synergistic interaction among Ag and Cu, due to alloy/bimetal formation, and with TiO2 produces a large number of metal–TiO2 Schottky junctions as evidenced from the HRTEM images, which facilitates efficient separation of electrons and holes leading to better utilization of charge carriers.36 (2) Integration of Cu + Ag with TiO2 leads to the shifting of the Fermi level closer to the CB of TiO2 and thereby the photo excited electrons in the SPR state are easily transferred to the CB of TiO2.13,42 (3) The possible formation of the Ag–Cu alloy on the surface of TiO2 in the Ag–Cu/TiO2 nanocomposite film facilitates the maximum absorption of solar light and its effective utilization. (4) An enhanced photocurrent generation as well as solar hydrogen production underscores that the PIRET effect also could be partially contributing to the overall activity. Employing a 455 nm band-pass filter decreased the H2 generation rate to about 10% value compared to that of AM1.5G (one sun condition) for TiAg-1. Similarly, the 620 nm filter decreased the H2 generation rate enormously for all Cu-containing photocatalysts. These reference experiments confirm the light absorption through the SPR effect by Ag and Cu, and the solar hydrogen generation activity is predominantly through them.
Among all Ag–Cu/TiO2 nanocomposites, the highest solar H2 evolution exhibited by TiAgCu-1 (0.75 wt% Ag and 0.25 wt% Cu) is ascribed to high dispersion of Ag–Cu with relatively high Ag/Cu surface atomic ratio and a heterogeneous distribution of Ag and Cu species, along with other factors discussed earlier. The variation of hydrogen production activity is correlated with the surface atomic ratio calculated from XPS as shown in Fig. 8. TiAgCu-1 showed the highest Ag/Ti (0.04) along with Ag/Cu = 1, indicating nearly equal amount of Ag and Cu present on the surface (Fig. S3, ESI†). Whereas for other samples a relatively Cu rich surface was obtained. The relatively higher surface atomic concentration of metallic species and a heterogeneous distribution of Ag and Cu species on TiAgCu-1 help to form the maximum number of Schottky junctions at the metal–TiO2 interface in TiAgCu-1. Equal Cu/Ti and Ag/Ti on TiAgCu-1 and a perfect 1![[thin space (1/6-em)]](https://www.rsc.org/images/entities/char_2009.gif) :
:![[thin space (1/6-em)]](https://www.rsc.org/images/entities/char_2009.gif) 1 Cu
1 Cu![[thin space (1/6-em)]](https://www.rsc.org/images/entities/char_2009.gif) :
:![[thin space (1/6-em)]](https://www.rsc.org/images/entities/char_2009.gif) Ag combination observed is attributed to the maximum light harvesting and photocatalytic activity, in spite of different input Cu
Ag combination observed is attributed to the maximum light harvesting and photocatalytic activity, in spite of different input Cu![[thin space (1/6-em)]](https://www.rsc.org/images/entities/char_2009.gif) :
:![[thin space (1/6-em)]](https://www.rsc.org/images/entities/char_2009.gif) Ag ratio. This also supports an Ag–Cu bimetal or alloy formation in the present work.
Ag ratio. This also supports an Ag–Cu bimetal or alloy formation in the present work.
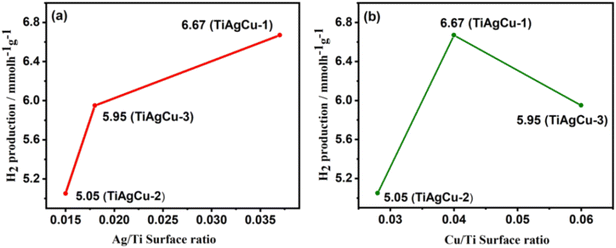 | ||
| Fig. 8 (a) Variation of rate of hydrogen production with Ag/Ti surface ratio. (b) Variation of rate of hydrogen evolution with Cu/Ti surface ratio. | ||
Mechanism of photocatalytic H2 production
Based on the experimental and characterization studies on the present catalyst system and various literature studies,43–48 a plausible mechanism of photocatalytic hydrogen evolution on Ag–Cu/TiO2 nanocomposites is suggested and is depicted in Fig. 9. When TiO2 is exposed to solar irradiation, electrons are excited from its VB to the CB leaving the holes in the VB. The photocatalytic activity of the metal integrated TiO2 nanocomposites carried out under visible light (>420 nm) revealed that the H2 production rate decreased in all cases compared to direct sunlight (Table S5 in the ESI†). For example, the H2 production rate on TiAgCu-1 decreased to 72% (4.80 mmol h−1 g−1) with respect to direct sunlight (6.67 mmol h−1 g−1). 4–5% of UV available in sunlight also contributes significantly to the activity.4 Nonetheless, this observation confirms the origin of predominant activity from visible light absorption, which is due to the AgCu alloy. The concurrent SPR effect of the Ag and Cu nanoparticles and enhanced charge density and charge separation efficiency as evidenced from the photocurrent measurements enhances the visible light absorption capacity and transfers more electrons into the CB of TiO2. As indicated earlier, the PIRET effect also enhances light absorption in the TiO2 lattice and increases the electron excitation into the CB of TiO2. Additionally, the high local electronic field increases the energy of trapped electrons and enables them to readily interact with the electron acceptors.32 The lowest Rct value of TiAgCu-1 evidenced from EIS analysis supports this observation.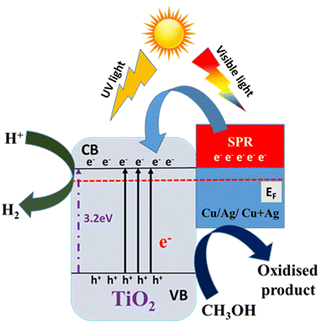 | ||
| Fig. 9 A schematic illustration of the possible mechanism for SPR-induced electron transfer and co-catalytic activity during photocatalytic reaction of the Ag–Cu/TiO2 nanocomposite. | ||
Thus the charge carriers are efficiently separated and the electrons concentrated at the metallic surface and CB of TiO2 are beneficial for enhancing the solar H2 generation activity. At the same time, the sacrificial agent methanol acts as a hole scavenger, which undergoes oxidation by utilizing holes from the VB of TiO2 to form CO2. The interaction between different metals in a bimetallic system can lead to synergistic effects, where the properties of the combined system are different from the sum of its individual components. Indeed, the Ag 4d37 and Cu 3d39 bands appear at the same energy in photoelectron spectral studies, supporting the synergetic interaction too. This synergistic effect can enhance the SPR response, making the CuAg system more efficient in interacting with light. Thus, the presence of Ag + Cu nanoparticles at an optimum ratio on the catalyst surface of TiAgCu-1 makes it the best performing nanocomposite with maximum H2 production rate.
Conclusions
In summary, we report the synthesis of visible light absorbing mesoporous metal integrated TiO2 nanocomposites (Ag/TiO2, Cu/TiO2 and Ag–Cu/TiO2) through a simple chemical reduction method, and a detailed structure–activity correlation with photocatalytic H2 evolution activity has been carried out. HRTEM analysis revealed the presence of Schottky junctions at the metal–TiO2 interface and facilitates the separation of photogenerated charge carriers. The electrochemical impedance studies revealed that the charge transfer resistance and the charge recombination rate decrease on metal integration with TiO2 through the formation of an effective metal–TiO2 heterojunction. The highest transient photocurrent response of TiAgCu-1 observed further supports that the combination of Ag and Cu in the composite catalyst has a remarkable ability to improve the separation and transfer of photo-generated charge carriers at the composite interface.Photocatalytic H2 evolution studies on metal integrated TiO2 nanocomposites revealed that the photocatalyst fabricated in the form of a thin-film showed higher hydrogen production activity than their powder form. The high activity observed with the Ag–Cu/TiO2 nanocomposites is attributed to factors such as the combined SPR effect of the Ag nanoparticles and co-catalytic activity of Cu, the strong interaction between Ag and Cu and the possible formation of a Ag–Cu alloy, and the shifting of the Fermi level closer to the conduction band of TiO2. The plausible photocatalytic reaction mechanism is the PIRET and regular light-induced electron excitation of TiO2 and further promoted by the metal nanoparticles (Cu/Ag/Cu + Ag), which are subsequently utilized for the reduction of H+ ions to H2.
Author contributions
This manuscript was written through contributions from all authors. All authors have given approval to the final version of the manuscript.Conflicts of interest
There are no conflicts to declare.Acknowledgements
S. R. thanks UGC for the research fellowship. S. M. S. gratefully acknowledges DST, New Delhi, for the facility support under the DST-FIST programme in St. John's College, Anchal, Kerala, India.References
- M. Shang, H. Hou, F. Gao, L. Wang and W. Yang, RSC Adv., 2017, 7, 30051–30059 RSC.
- (a) S. S. Mani, S. Rajendran, N. Nalajala, T. Mathew and C. S. Gopinath, Energy Technol., 2022, 10, 1–12 CrossRef; (b) A. A. Melvin, K. Illath, T. Das, T. Raja, S. Bhattacharyyaand and C. S. Gopinath, Nanoscale, 2017, 7, 13477–13488 RSC.
- L. Clarizia, G. Vitiello, G. Luciani, I. Di Somma, R. Andreozzi and R. Marotta, Appl. Catal., A, 2016, 518, 142–149 CrossRef CAS.
- H. Bajpai, K. K. Patra, R. Ranjan, N. Nalajala, K. P. Reddy and C. S. Gopinath, ACS Appl. Mater. Interfaces, 2020, 12, 30420–30430 CrossRef CAS PubMed.
- B. Tudu, N. Nalajala, P. Saikia and C. S. Gopinath, Sol. RRL, 2020, 4, 1900557 CrossRef CAS.
- P. Gomathisankar, T. Noda, H. Katsumata, T. Suzuki and S. Kaneco, Front. Chem. Sci. Eng., 2014, 8, 197–202 CrossRef CAS.
- W. Fan, Q. Zhang and Y. Wang, Phys. Chem. Chem. Phys., 2013, 15, 2632–2649 RSC.
- (a) P. A. Gross, S. N. Pronkin, T. Cottineau, N. Keller, V. Keller and E. R. Savinova, Catal. Today, 2012, 189, 93–100 CrossRef CAS; (b) P. A. Bharad, K. Sivaranjani and C. S. Gopinath, Nanoscale, 2015, 7, 11206–11215 RSC.
- H. Meng, X. Li, X. Zhang, Y. Liu, Y. Xu, Y. Han and J. Xu, Dalton Trans., 2015, 44, 19948–19955 RSC.
- M. Z. Ge, C. Y. Cao, S. H. Li, Y. X. Tang, L. N. Wang, N. Qi, J. Y. Huang, K. Q. Zhang, S. S. Al-Deyab and Y. K. Lai, Nanoscale, 2016, 8, 5226–5234 RSC.
- F. Wu, X. Hu, J. Fan, E. Liu, T. Sun, T. Sun, L. Kang, W. Hou, C. Zhu and H. Liu, Plasmonics, 2013, 8, 501–508 CrossRef CAS.
- C. Ligon, K. Latimer, Z. D. Hood, S. Pitigala, K. D. Gilroy and K. Senevirathne, RSC Adv., 2018, 8, 32865–32876 RSC.
- N. L. Reddy, S. Kumar, V. Krishnan, M. Sathish and M. V. Shankar, J. Catal., 2017, 350, 226–239 CrossRef CAS.
- I. Mondal, S. Gonuguntla and U. Pal, J. Phys. Chem. C, 2019, 123, 26073–26081 CrossRef CAS.
- M. K. Kumar, K. Bhavani, G. Naresh, B. Srinivas and A. Venugopal, Appl. Catal., B, 2016, 199, 282–291 CrossRef.
- T. Wang, Y. Yang, S. Lim, C. Chiang, J. Lim, Y. Lin, C. Peng, M. Lin and Y. Lin, Catal. Today, 2022, 388, 79–86 Search PubMed.
- M. Xi, X. Guo, X. Feng, L. Qin, S. Z. Kang and X. Li, Catal. Lett., 2020, 150, 1368–1372 CrossRef CAS.
- (a) N. Nalajala, K. K. Patra, P. A. Bharad and C. S. Gopinath, RSC Adv., 2019, 9, 6094–6100 RSC; (b) C. S. Gopinath and N. Nalajala, J. Mater. Chem. A, 2021, 9, 1353–1371 RSC.
- K. K. Patra and C. S. Gopinath, ChemCatChem, 2016, 8, 3294–3311 CrossRef CAS.
- J. P. Chen and L. L. Lim, Chemosphere, 2002, 49, 363–370 CrossRef CAS PubMed.
- K. Sivaranjani, S. Agarkar, S. B. Ogale and C. S. Gopinath, J. Phys. Chem. C, 2012, 116, 2581–2587 CrossRef CAS.
- M. Gao, P. K. N. Connor and G. W. Ho, Energy Environ. Sci., 2016, 9, 3151–3160 RSC.
- M. M. Hasan and N. K. Allam, RSC Adv., 2018, 8, 37219–37228 RSC.
- P. Devaraji, N. K. Sathu and C. S. Gopinath, ACS Catal., 2014, 4, 2844–2853 CrossRef CAS.
- J. Zhou, G. Tian, Y. Chen, J. Q. Wang, X. Cao, Y. Shi, K. Pan and H. Fu, Dalton Trans., 2013, 42, 11242–11251 RSC.
- I. Chamorro-Mena, N. Linares and J. García-Martínez, Dalton Trans., 2023, 52, 13190–13198 RSC.
- X. Li, L. Chen, J. Wang, J. Zhang, C. Zhao, H. Lin, Y. Wu and Y. He, J. Colloid Interface Sci., 2022, 618, 362–374 CrossRef CAS.
- P. Babu and B. Naik, Inorg. Chem., 2020, 59, 10824–10834 CrossRef CAS PubMed.
- M. R. Khan, T. W. Chuan, A. Yousuf, M. N. K. Chowdhurya and C. K. Cheng, Catal. Sci. Technol., 2015, 5, 2522–2531 RSC.
- S. Asadzadeh-khaneghah, A. Habibi-yangjeh, D. Seifzadeh and H. Chand, Colloids Surf., A, 2021, 617, 126424 CrossRef CAS.
- M. Yu, H. Sun, X. Huang and Y. Yan, Nanoscale Res. Lett., 2020, 135, 1–8 Search PubMed.
- E. Liu, L. Kang, Y. Yang, T. Sun, X. Hu, C. Zhu, H. Liu, Q. Wang, X. Li and J. Fan, Nanotechnology, 2014, 25, 165401 CrossRef PubMed.
- (a) B. Tudu, N. Nalajala, K. Reddy, P. Saikia and C. S. Gopinath, ACS Appl. Mater. Interfaces, 2019, 11, 32869–32878 CrossRef CAS PubMed; (b) B. Tudu, N. Nalajala, K. Reddy, P. Saikia and C. S. Gopinath, ACS Sustainable Chem. Eng., 2021, 9, 13915–13925 CrossRef CAS.
- A. A. Krishnan, M. A. Aneesh Kumar, R. B. Nair, R. Sivaraj, A. Lamiya, P. K. Jishnu, S. Kurian, T. Mathew and P. S. Arun, New J. Chem., 2022, 46, 22256–22267 RSC.
- S. Kumar, N. Lakshmana, A. Kumar, M. Venkatakrishnan and V. Krishnan, Int. J. Hydrogen Energy, 2017, 43, 1–15 Search PubMed.
- P. Zhang, T. Song, T. Wang and H. Zeng, RSC Adv., 2017, 7, 17873–17881 RSC.
- M. K. Ghosalya, K. P. Reddy, R. Jain, K. Roy and C. S. Gopinath, J. Chem. Sci., 2018, 130, 1–11 CrossRef CAS.
- T. Mathew, N. R. Shiju, K. Sreekumar, B. S. Rao and C. S. Gopinath, J. Catal., 2002, 417, 405–417 CrossRef.
- K. Roy and C. S. Gopinath, Anal. Chem., 2014, 86, 3683–3687 CrossRef CAS.
- Y. Yu, Y. Chen and Z. Cheng, Int. J. Hydrogen Energy, 2015, 40, 15994–16000 CrossRef CAS.
- M. Jung, J. Scott, Y. H. Ng, Y. Jiang and R. Amal, Int. J. Hydrogen Energy, 2014, 39, 12499–12506 CrossRef CAS.
- H. Sun, S. Zeng, Q. He, P. She, K. Xu and Z. Liu, Dalton Trans., 2017, 46, 3887–3894 RSC.
- K. K. Patra, P. A. Bharad, V. Jain and C. S. Gopinath, J. Mater. Chem. A, 2019, 7, 3179–3189 RSC.
- J. B. Priebe, J. Radnik, C. Kreyenschulte, A. J. J. Lennox and H. Junge, ChemCatChem, 2017, 9, 1025–1031 CrossRef CAS.
- N. Nalajala, K. N. Salgaonkar, I. Chauhan, S. Mekala and C. S. Gopinath, ACS Appl. Energy Mater., 2021, 4, 13347–13360 CrossRef CAS.
- M. A. Nadeem, M. Al-Oufi, A. K. Wahab, D. Anjum and H. Idriss, ChemistrySelect, 2017, 2, 2754–2762 CrossRef CAS.
- (a) X. Ren, J. Wang, S. Yuan, C. Zhao, L. Yue, Z. Zeng and Y. He, Front. Chem. Sci. Eng., 2023, 17, 1949–1961 CrossRef CAS; (b) C. Zhao, L. Yue, S. Yuan, X. Ren, Z. Zeng, X. Hu, L. Zhao, Y. Wu and Y. He, J. Ind. Eng. Chem., 2024, 132, 135–111111 CrossRef CAS.
- S. Rajendran, S. S. Mani, T. R. Nivedhitha, A. A. Krishnan, P. S. Arun, T. Mathew and C. S. Gopinath, ACS Appl. Energy Mater., 2024, 7, 104–116 CrossRef CAS.
Footnote |
| † Electronic supplementary information (ESI) available: FESEM, HRTEM-EDS, Ag/Cu atomic ratio, impedance parameters, XPS binding energy values, and H2 rate comparison. See DOI: https://doi.org/10.1039/d4ya00056k |
| This journal is © The Royal Society of Chemistry 2024 |

