DOI:
10.1039/D4YA00178H
(Paper)
Energy Adv., 2024,
3, 1401-1413
Prussian blue analogues with Na2NixCoyMnzFe(CN)6-multimetallic structures as positive and hydrogen vanadate as negative electrodes in aqueous Na-ion batteries for solar energy storage applications†
Received
18th March 2024
, Accepted 2nd May 2024
First published on 3rd May 2024
Abstract
Low-cost and environmentally benign aqueous Na-ion batteries are the suitable choice for large-scale solar energy storage applications. Na-ion batteries with Prussian blue analogues (PBAs) as positive and hydrogen vanadate (H2V3O8/HVO) as negative electrodes in hydrogel electrolytes exhibit excellent durability, good power capability and moderate energy density. In this work, three variants of PBAs, namely Na2Ni0.33Co0.33Mn0.33Fe(CN)6 (PBA-1), Na2Ni0.5Co0.2Mn0.3Fe(CN)6 (PBA-2) and Na2Ni0.2Co0.5Mn0.3Fe(CN)6 (PBA-3), were synthesized by tuning the compositions of nitrogen-coordinated transition metals such as Ni, Co and Mn. The trend of capacity in PBAs is the function of the Ni content as Ni2+ is electrochemically inert. PBA-1, PBA-2 and PBA-3 exhibited specific capacities of 100, 75 and 120 mA h g−1, respectively, at 100 mA g−1. Electrochemical impedance spectroscopy analysis illustrated solid-state electronic conductivity, and PBA-1 exhibited the highest electronic conductivity of 23 × 10−4 S cm−1 compared to PBA-2 (15 × 10−4 S cm−1) and PBA-3 (7.4 × 10⁻⁴ S cm−1). Although Ni does not contribute to the capacity, it improves the cycling life of the active material. PBA-3 demonstrated 86% capacity retention after 500 cycles at 300 mA g−1, whereas PBA-1 and PBA-2 respectively showed 91% and 92% retention. The lower Ni content in PBA-3 is accountable for the comparatively poor cycling performance. However, based on the optimum performances of PBAs, a 1.2 V rated PBA-1//HVO full cell was assembled, which delivered a specific capacity of 65 mA h g−1 (at 100 mA g−1), an energy density of 78 W h kg−1 (at 121 W kg−1), a power density of 520 W kg−1 (at 31 W h kg−1) and a good cycling life (81% capacity retention after 500 cycles at 300 mA g−1). A 5 V/4 mA h prototype device was also developed for the practical demonstration of solar energy storage applications. Based on the energy storage performances, cost, safety and environmental issues, this Na-ion battery could be scaled up for large-scale production.
Introduction
Clean energy harvesting and storage are salient features for sustainable development, wherein fossil fuel–based economy is gradually phased out. Owing to the fluctuating weather conditions, harvesting of renewable energy, i.e., solar, wind, etc., is sporadic in nature, and therefore, large-scale energy storage devices are required. Secondary batteries are technologically mature enough to reversibly store and deliver energy on a large scale.1 Presently, lead-acid and Li-ion batteries are commercially successful products for large-scale energy storage, including load leveling and solar energy storage.2 In general, the prerequisites of large-scale solar energy storage batteries are (i) low cost, (ii) environment friendliness, (iii) operational safety, (iv) long service life, and (v) moderate energy/power densities. Based on these criteria, lead-acid batteries satisfy only cost and safety issues, whereas short operational life, poor energy/power densities and lead-poisoning impede their full-fledged applications.3 However, good energy/power densities, long cycle life and environment friendliness are the positive features of Li-ion batteries for large-scale energy storage; however, cost and safety concerns need to be addressed.4 From the perspective of energy storage performances, Li-ion batteries are more advanced than lead-acid batteries. Hence, research interest should be directed towards Li-ion analogous chemistry, with safety and cost components optimally settled. In this light of foregoing, aqueous Na-ion batteries are the most suitable candidates for large-scale solar energy storage applications. Similar to Li-ion chemistry, the intercalation/deintercalation of Na ions in/from the positive and negative electrodes is the key operating principle of aqueous Na-ion batteries, whereas low-cost sodium and safe aqueous electrolytes are employed.5
Various classes of positive active materials are envisaged for aqueous Na-ion chemistries, while Prussian blue analogs (PBAs) are important materials because they have multiple redox centers and open framework structures.6 PBAs belong to the family of coordination polymers with the generic structure of AxMy[M′(CN)6]·nH2O, whereas A is an alkali metal (Li, Na, and K), and M and M′ are transition metals coordinated with a CN ligand through respective nitrogen- and carbon-ends.7 Most of the PBAs are synthesized for Na-ion battery applications by fixing Na as the alkali metal, Fe as the carbon-coordinated transition metal and Mn/Fe/Co/Ni, etc., as the nitrogen-coordinated transition metal.8 Among the various nitrogen-coordinated transition metals, Ni is electrochemically inert in the potential range of positive electrode operations, while all other transition metals are redox active.9 However, bi-transition metallic compositions such as Na2MnFe(CN)6, Na2NiFe(CN)6, and Na2CoFe(CN)6 are widely reported in Na-ion-based energy storage systems.7 Hou et al. investigated Na2MnFe(CN)6 as the positive active material in aqueous Na-ion batteries, which delivers a specific capacity of 140 mA h g−1 at 0.5C current load in the potential range of 0.2–1.2 V vs. standard hydrogen electrode (SHE).10 Naskar et al. studied the electrochemical performances of Na2CoFe(CN)6 as the positive electrode in aqueous Na-ion batteries, while it delivers specific capacities of 122, 100, 90, 84 and 80 mA h g−1 respectively at 1, 2, 3, 4 and 5C rates within 0–1.2 V vs. Ag/AgCl.11 The same group also reported a Na2NiFe(CN)6/polypyrrole composite as the positive active material in aqueous Na-ion hybrid batteries, but it exhibited a specific capacity of 73.6 mA h g−1 at 2C current load within 0.05–1.2 V vs. Ag/AgCl.12 Even though Ni does not contribute any storage capacity in PBAs, it improves the cycling stability by preserving the structural integrity of PBAs.9 Therefore, modern research focuses on Ni-doping in PBAs at the sites of nitrogen-coordinated transition metals for achieving good cycle life. Therefore, several tri-transition metallic PBA compositions are obtained, which include Na2Mn0.5Ni0.5Fe(CN)6,13 Na2Co0.5Ni0.5Fe(CN)6,14 Na2Ni0.17Co0.83Fe(CN)6,15 and Na1.85Ni0.40Co0.31Fe0.29[Fe(CN)6]0.97·2.5H2O.16 Quan et al. studied Na2Ni0.17Co0.83Fe(CN)6 composition as a positive electrode in a non-aqueous Na-ion system, and it delivers a specific capacity of 146 mA h g−1 at 20 mA g−1 with 93% capacity retention at 100 mA g−1 over 100 cycles.15 Naskar et al. studied a Na2Co0.5Ni0.5Fe(CN)6 positive electrode in aqueous Na-ion batteries, which demonstrated a specific capacity of 49 mA g−1 at 100 mA g−1 and 90% capacity retention after 500 cycles at 200 mA g−1 within 0–1.2 V vs. Ag/AgCl.14 A comparative positive electrode performance study was conducted by Naskar et al. in Na2MnFe(CN)6 and Na2Mn0.5Ni0.5Fe(CN)6, where the respective specific capacities were obtained as 36 and 47 mA h g−1 at 100 mA g−1 current density within 0–1.2 V vs. Ag/AgCl in a 1 M Na2SO4 electrolyte. Importantly, Na2Mn0.5Ni0.5Fe(CN)6 exhibits far better capacity retention (80%) than that of Na2MnFe(CN)6 (56%) over 250 cycles at 500 mA g−1 current rate.13 Zhang et al. reported a multi-centre nitrogen-coordinated PBA, namely, Na1.85Ni0.40Co0.31Fe0.29[Fe(CN)6]0.97·2.5H2O, which delivered a discharge capacity of 120 mA h g−1 (at 20 mA g−1) and excellent cycle life (0.0044% decay per cycle at 2 A g−1) in a non-aqueous electrolyte system.16 Nonetheless, tetra-transition metallic PBAs as positive active materials in Na-ion chemistry are truly limited in the literature, which envisaged further improvements in charge storage capability and durability. In this study, we synthesized multiple tetra-transition metallic PBA compositions for aqueous Na-ion batteries and investigated their electrochemical performance.
However, the appropriate negative active materials are crucial in order to accomplish the desirable energy storage performances from aqueous Na-ion batteries. Different types of negative active materials such as carbonaceous matters, including hard carbons, soft carbons, and amorphous carbons17,18 and metal oxides,13 metal phosphates,14 metal carbides, and metal chalcogenides19–21 are extensively reported for Na-ion batteries in the literature. In the metallic oxide segment, vanadium-based polyoxometalates (POMs) are promising candidates for the negative electrode of aqueous Na-ion batteries due to the following reasons: (i) high storage capacity because of multielectronic redox activity and (ii) high power capability due to facile Na-ion diffusion through the open layered structure.22–24 Deng et al. reported a Na2V6O16·nH2O phase of Na-vanadate as the negative electrode in aqueous Na-ion batteries, which delivered a specific capacity of 42 mA h g−1 at 40 mA g−1 current density within 0 to −0.65 V vs. saturated calomel electrode (SCE) window.23 Naskar et al. studied NaV3O8 as a negative electrode in aqueous Na-ion batteries, and it exhibited specific capacities of 83, 65, 27, 28 and 23 mA h g−1 at 1, 2, 3, 4 and 5C rates respectively within 0.2 to −0.8 V vs. Ag/AgCl window.11 Not vividly, Na-vanadate is reported as the negative electrode in Na-ion systems;11 but hydrogen vanadate has never been reported in the literature as the negative electrode for Na-ion chemistry. We have found very minimal reports on hydrogen vanadate as the negative electrode in Li-ion systems. For example, Li et al. studied H2V3O8 (HVO) as a potential negative electrode in aqueous Li-ion batteries, while it demonstrates a specific capacity of 234 mA h g−1 at 100 mA g−1 current density.25 Nevertheless, here we selected H2V3O8 as the negative electrode in aqueous Na-ion batteries; which is the first ever report on the use of HVO as the negative electrode of Na-ion chemistry.
In this work, we synthesized three different tetra-transition metallic PBAs, namely, Na2Ni0.33Co0.33Mn0.33Fe(CN)6 (PBA-1), Na2Ni0.5Co0.2Mn0.3Fe(CN)6 (PBA-2) and Na2Ni0.2Co0.5Mn0.3Fe(CN)6 (PBA-3) as positive electrode materials and hydrogen vanadate (H2V3O8/HVO) as a negative electrode material for hydrogel-based Na-ion batteries. The synthesized positive and negative active materials were thoroughly characterized by various physicochemical and electrochemical methods. Based on the comparative electrochemical performances of PBA-1, PBA-2 and PBA-3, PBA-1 was selected as the positive active material in Na-ion full cells. Therefore, a 1.8 V PBA-1//HVO full cell was assembled in a 1 M Na2SO4–carboxymethylcellulose (CMC)–silica (SiO2)-based hydrogel electrolyte. The full cell demonstrated a specific capacity of 65 mA h g−1 (at 100 mA g−1), an energy density of 118 W h kg−1 (at 181 W kg−1), a power density of 780 W kg−1 (at 46 W h kg−1) and a good cycle life (81% capacity retention after 500 cycles at 300 mA g−1). This study is culminated with the development of a 5 V/4 mA h prototype device for the practical demonstration of solar energy storage applications.
Experimental
Synthesis of active materials
Three variants of PBAs, namely, Na2Ni0.33Co0.33Mn0.33Fe(CN)6 (PBA-1), Na2Ni0.5Co0.2Mn0.3Fe(CN)6 (PBA-2) and Na2Ni0.2Co0.5Mn0.3Fe(CN)6 (PBA-3) were synthesized using a citrate-assisted control crystallization technique via an in situ co-precipitation process.26 The stoichiometric amounts of Ni, Co and Mn salts (NiCl2·6H2O, CoCl2·6H2O and MnCl2·4H2O) and 5 mmol tri-sodium citrate were taken in a beaker containing 50 ml distilled water, named A. In an another beaker (named B), 5 mmol of Na4Fe(CN)6 was dissolved in 50 ml distilled water. Then, two solutions were mixed simultaneously in another beaker containing 100 ml distilled water and stirred for 12 h. The PBA-precipitates were obtained as suspensions, and the suspensions were centrifuged three times with water and ethanol. The resulting PBA-products were obtained after drying at 70 °C for 8 h in a hot air oven. Meantime, H2V3O8 (HVO) was hydrothermally synthesized,27 where 0.040 g of polyethylene glycol (PEG-600) and 0.237 g of V2O5 were mixed in 40 ml distilled water. Then 10 ml of 30% H2O2 was added to the resulting mixture and vigorously stirred for 30 min. Thereafter, the whole solution mixture was transferred into a 50 ml Teflon-lined autoclave and heated at 180 °C for 60 h in a hot air oven. The obtained product was filtered and washed thoroughly with distilled water. The washed product was dried in a hot air oven at 70 °C for 24 h and obtained.
Physicochemical characterizations of materials
The synthesized active materials were physicochemically characterized by powder X-ray diffraction (PXRD), Fourier transformed infrared (FT-IR) spectroscopy, thermogravimetric analysis (TGA) and scanning electron microscopy (SEM) with energy-dispersive X-ray (EDX) analysis. PXRD patterns were acquired using a Malvern Panalytical Empyrean diffractometer (Ni-filtered Cu-Kα radiation, λ = 1.5418 Å). PXRD data for the Rietveld refinements were acquired at room temperature with a step size of 0.02° and a step duration of 50 s. The PXRD patterns were refined using the program GSAS-EXPGUI.28 Lattice parameters, scale factors, background (Fourier polynomial background function), and pseudo-Voigt (U, V, W and X) were refined. The crystal structures were sketched using the software VESTA.29 The theoretical PXRD patterns were simulated using the program POWDER-CELL.30 The FT-IR spectroscopic studies were carried out using a Bruker Optics ALPHAE spectrometer with a Zn–Se ATR (attenuated total reflection) accessory. The TGA experiments were conducted using a TG 8120 Thermo Plus EvoII by Rigaku Corporation (Tokyo, Japan). The SEM imaging was performed using a Carl Zeiss Supra 55 field emission scanning electron microscope equipped with an EDX (Oxford INCA) facility. The Na-ion diffusion pathways in the PBAs and HVO were revealed using the softBV (bond valence) software.31,32
Electrochemical characterizations and cell assembly
All the positive and negative electroactive materials were electrochemically characterized by cyclic voltammetry (CV), galvanostatic charge discharge (GCD) and electrochemical impedance spectroscopy (EIS). All the measurements were conducted in a three-electrode cell configuration in a 1 M Na2SO4 electrolyte, where active material–coated current collectors, platinum foil and Ag/AgCl were used as the working, counter and reference electrodes respectively. A low-cost stainless steel (SS304) sheet was employed as the potential current collector, whereas a single-walled carbon nanotube (SWCNT) coating was applied as the corrosion protective layer.11 The active material slurries were prepared by mixing 80% active materials, 10% conductive carbon and 10% polyvinylidene fluoride (PVDF) binder in a N,N-dimethylformamide (DMF) solvent. The slurry was coated onto the current collectors (geometric area: 1 cm2 & mass loading: 1 mg cm−2) by the doctor blade method, and the same were dried in a hot air oven at 60 °C for 1 h. The dried working electrodes were pressed with 15 ton pressures to achieve uniform active material thickness. A 1.8 V full cell was assembled with a (+)PBA-1//HVO(−) configuration in the prismatic cell structure, whereas a hydrogel electrolyte was employed. The optimum hydrogel was prepared by mixing 2 wt% carboxymethylcellulose (CMC) and 2 wt% fumed silica (SiO2) as gelling agents in a 1 M Na2SO4 (aq.) solution.13 It is worthy to mention that the neutral electrolyte was preferred in order to minimize the current collector corrosion and active material disintegration. Despite superior electrochemical performances, highly concentrated ‘water-in-salt’ electrolyte systems were excluded in this work because of the cost constraint. However, the two-electrode full cell was configured with one positive and one negative electrodes (geometric area: 5 × 5 cm2), while the respective mass loading values were 1 and 1.12 mg cm−2. A low-cost polyvinyl chloride (PVC)-based fencing net was placed as the separator, which offered mechanical support to the thixotropic hydrogel in between two electrodes. A 5 V/4 mA h rated prototype device was developed by series connection of three 1.8 V cells to demonstrate the solar storage performance. A custom-made solar charging module with 3 V/270 mW light-emitting-diode (LED) load was used in field trials for monitoring the device performances. All the laboratory-based electrochemical measurements were carried out using a multichannel AUTOLAB potentiostat/galvanostat workstation (Model: M204). Until otherwise stated, all the chemicals/materials were purchased from Merck, India, and used without any further purification steps; and all the experiments were performed at ambient temperature (25 °C).
Results and discussion
Physicochemical characterizations of positive and negative active materials
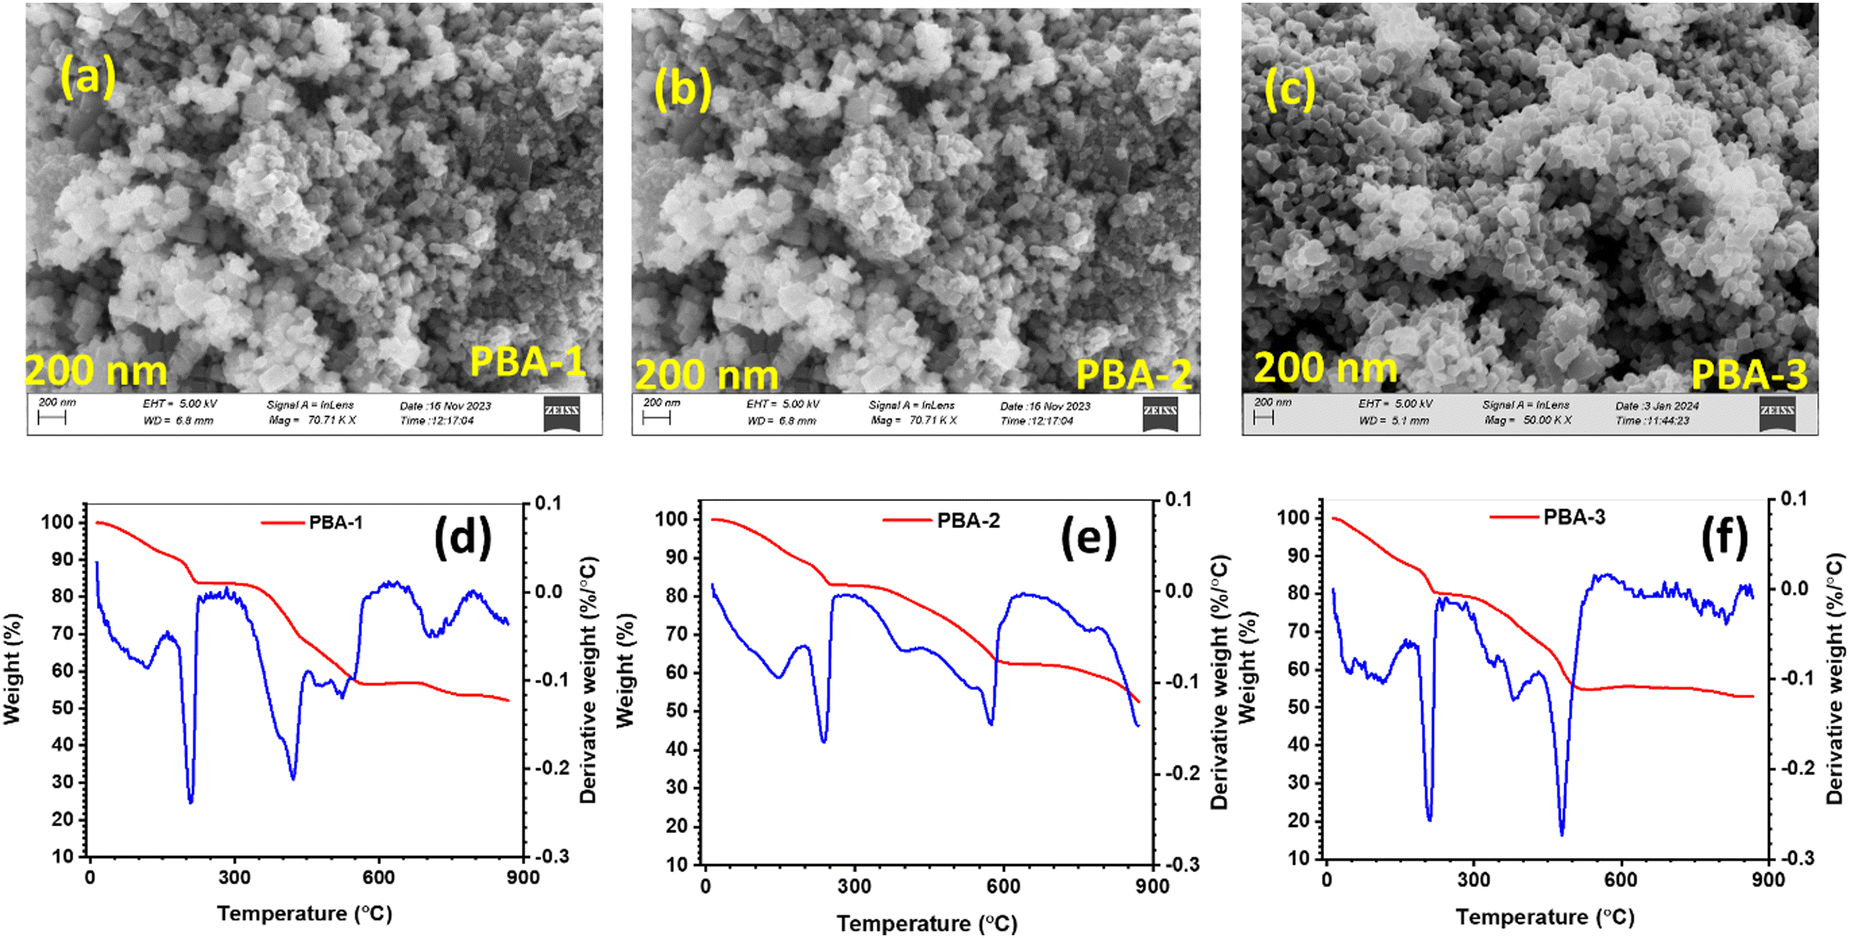
The positive active materials, namely, PBA-1, PBA-2 and PBA-3 were structurally characterized by PXRD analysis through Rietveld refinement, which revealed that all the above-mentioned PBAs were crystallized in monoclinic phase with the space group P21/n. Fig. 1(a)–(c) depict the Rietveld refinement results with unit cell parameters and obtained reliability factors for PBA-1, PBA-2 and PBA-3, respectively. A representative crystal structure of the PBAs is presented in Fig. 1(d). It is noted that all the three structures are quite similar, where distorted Ni/Co/Mn(NC)6 octahedra and Fe(CN)6 octahedra are situated alternatively along the crystallographic a-direction leading to the construction of a three-dimensional open-framework structure with one-dimensional passages for Na ion migration. Na ions are residing in a zigzag manner in the one-dimensional channels facilitating the movement of the Na-ions. Fig. S2 in the ESI† depicts the FT-IR spectra of all the synthesized PBAs, whereas a sharp peak is observed at 2070 cm−1 assigned to the stretching vibration of CN coordinated in between Fe2+ and Ni2+/Co2+/Mn2+. The observed peaks at 3614 and 3546 cm−1 appear due to the stretching vibration of O–H, and a peak at 1600 cm−1 is ascribed to the bending vibration of O–H. Such stretching and bending vibrations of O–H indicate the presence of surface-adsorbed and crystalline H2O molecules.33 The SEM images of respective PBA-1, PBA-2 and PBA-3 are shown in Fig. 2(a)–(c), which represent homogeneous cubic-shaped morphologies with ∼0.14, 0.12 and 0.13 μm particle sizes respectively. The non-aggregated block-shaped particles are developed in the crystallization process due to the presence of chelating agent; as it impedes the nucleation kinetics and prevents uncontrolled crystal growth.26 The elemental analysis of the PBAs was performed by EDX (Fig. S3(a)–(c), ESI†), and the obtained metallic ratios provide a good synchronization between the compositions of PBA-1, PBA-2 and PBA-3 and the molar ratios of the precursors as per the synthetic routes (Table 1). The quantification of crystalline H2O in PBAs was carried out by TGA (Fig. 2(d)–(f)), whereas surface-adsorbed and crystalline H2O molecules escaped at ∼110 and ∼220 °C, respectively.34 From the weight loss data in TGA, it is intended that nearly two crystalline H2O molecules are present in the molecular formula of synthesized PBAs (Table 1).
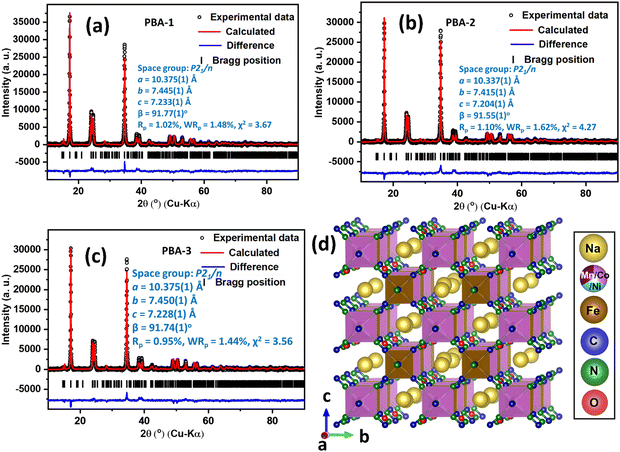 |
| | Fig. 1 Rietveld refinements of (a) PBA-1, (b) PBA-2, and (c) PBA-3 based on the monoclinic structure, unit cell parameters, and obtained reliability factors; (d) representative crystal structure of PBA (viewed along the crystallographic a direction). | |
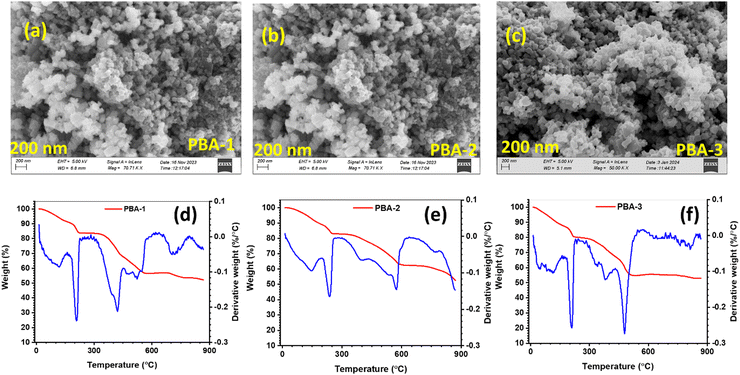 |
| | Fig. 2 SEM image of (a) PBA-1, (b) PBA-2, and (c) PBA-3; thermogravimetric profiles with derivative plots for (d) PBA-1, (e) PBA-2, and (f) PBA-3. | |
Table 1 Composition of PBAs with different nitrogen-coordinated transition metals
|
|
Atomic % |
No of crystalline water |
| Na |
Ni |
Co |
Mn |
Fe |
| PBA-1 |
1.0 ± 0.14 |
0.2 ± 0.16 |
0.2 ± 0.17 |
0.2 ± 0.21 |
0.5 ± 0.09 |
1.69 |
| PBA-2 |
1.1 ± 0.14 |
0.4 ± 0.12 |
0.2 ± 0.17 |
0.2 ± 0.21 |
0.6 ± 0.09 |
1.76 |
| PBA-3 |
4.6 ± 0.09 |
0.4 ± 0.06 |
0.9 ± 0.03 |
0.5 ± 0.04 |
1.6 ± 0.03 |
2.33 |
The negative active material, namely, HVO, was also structurally characterized by PXRD analysis through Rietveld refinement.35Fig. 3(a) depicts the Rietveld refinement of HVO with unit cell parameters and obtained reliability factors, and Fig. 3(b) shows the resulting crystal structure.35 The layers of edge-shared VO6 octahedra in the b–c plane are stacked along the crystallographic a-direction. The layers are interconnected by means of hydrogen bonding. These interlayer spacings are expected to promote Na-ion migration in the b–c plane under applied potential in an aqueous Na2SO4 solution as the electrolyte. The FT-IR spectrum of HVO is shown in Fig. S4 (ESI†), where the peaks around 1005 and 970 cm−1 correspond to the stretching vibrations of V![[double bond, length as m-dash]](https://www.rsc.org/images/entities/char_e001.gif) O bonds. The peaks at 3004 and 1600 cm−1 are assigned to the respective stretching and bending vibrations of O–H, arising from surface-adsorbed and crystalline H2O molecules.36 The SEM image and EDX profile of HVO are presented in Fig. 3(c) and Fig. S3(d) (ESI†), respectively, where rod-shaped particles are found with ∼3.2 μm length and ∼0.28 μm width. The rod-shaped particles accelerate the electrolyte diffusion into the bulk of the active materials, which improved the active material utilization and rate capability. The TGA experiment was also conducted for HVO (Fig. 3(d)), and it was found that crystalline waters escaped at 278 °C. The resulting weight loss indicates the number of crystalline water molecules (i.e., 1.75) in the molecular structure of H2V3O8.
O bonds. The peaks at 3004 and 1600 cm−1 are assigned to the respective stretching and bending vibrations of O–H, arising from surface-adsorbed and crystalline H2O molecules.36 The SEM image and EDX profile of HVO are presented in Fig. 3(c) and Fig. S3(d) (ESI†), respectively, where rod-shaped particles are found with ∼3.2 μm length and ∼0.28 μm width. The rod-shaped particles accelerate the electrolyte diffusion into the bulk of the active materials, which improved the active material utilization and rate capability. The TGA experiment was also conducted for HVO (Fig. 3(d)), and it was found that crystalline waters escaped at 278 °C. The resulting weight loss indicates the number of crystalline water molecules (i.e., 1.75) in the molecular structure of H2V3O8.
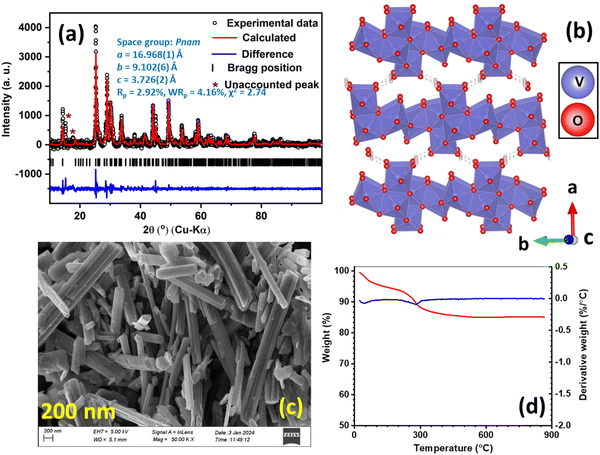 |
| | Fig. 3 (a) Rietveld refinements of HVO based on the orthorhombic structure together with the unit cell parameters and obtained reliability factors, (b) crystal structure of HVO (viewed along the crystallographic c direction), (c) SEM image of HVO, and (d) thermogravimetric profile with the derivative plot for HVO. | |
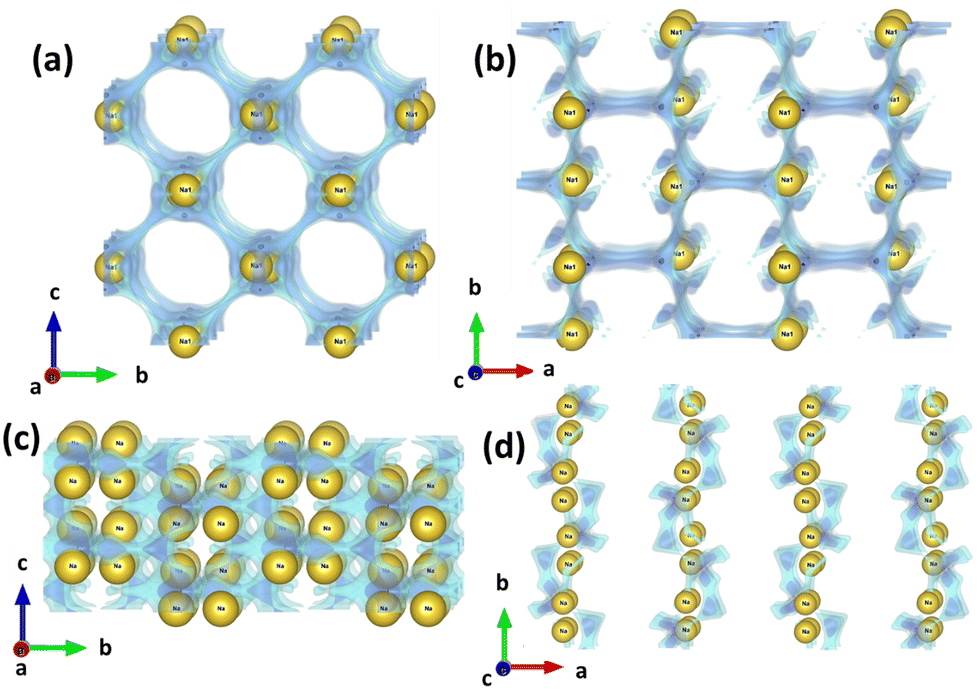
The bond valence energy landscape (BVEL) calculations on Na-ion diffusion pathways were carried out in all PBAs and HVO structures using the softBV software.31,32 The Na-ion diffusion paths along the b–c and a–b planes in PBA-1 and HVO are demonstrated in Fig. 4(a)–(d), whereas the diffusion pathways in b–c/a–b planes for PBA-2 and PBA-3 are depicted in Fig. S5(a)–(d) (ESI†) respectively. Furthermore, the activation energy barriers under 3D, 2D and 1D routes are shown in Table 2. The Na-ion diffusions in all directions are probable in PBAs because of having open-framework structures. It is important to note that the activation energies and the diffusion pathways are quite comparable for all PBAs in 3D, 2D and 1D pathways, because of the resemblance in crystal structures. Besides, the activation energy barriers at 3D, 2D and 1D pathways were estimated for HVO, and are reported in Table 2. Due to the two-dimensional layer structure of HVO, the Na-ion diffusion is limited in 2D and 1D pathways, while in the 3D pathway the activation energy is unattainable (i.e., 999 eV). It is noteworthy that the BVEL calculations of Na-ion diffusion in the HVO structure were carried out by incorporating Na-ions into the crystal structure. It is expected to be close to reality, because of the use of an aqueous Na2SO4 electrolyte in battery operations. However, the diffusion coefficient (D) values were also estimated from the EIS analysis, and the results showed 3.09 × 10⁻¹⁴, 1.68 × 10⁻¹⁴, 1.29 × 10⁻¹⁴ and 2.50 × 10⁻¹¹ cm2 s−1 for PBA-1, PBA-2, PBA-3 and HVO, respectively. The higher D-value is expected in HVO due to the 2D layered structure; while PBAs depict a lower D-value because of the framework structure with one-dimensional Na-ion diffusion channels. However, the diffusion-related study confirms that no appreciable changes are observed in the diffusion properties of PBAs, when the compositions of nitrogen-coordinated transition metals are changed.
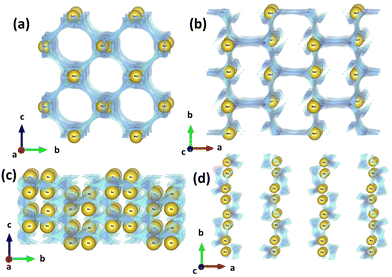 |
| | Fig. 4 Na-ion diffusion pathways found using BVEL calculations for (a) PBA-1 in the b–c plane, (b) PBA-1 in the a–b plane, (c) HVO in the b–c plane, and (d) HVO in the a–b plane. | |
Table 2 Activation energies for Na-ion diffusion in PBA-1, PBA-2, PBA-3 and HVO
|
|
PBA-1 (in eV) |
PBA-2 (in eV) |
PBA-3 (in eV) |
HVO (in eV) |
| 3D Pathway |
0.220 |
0.221 |
0.219 |
999 |
| 2D Pathway |
0.168 |
0.165 |
0.168 |
1.253 |
| 1D Pathway |
0.168 |
0.165 |
0.168 |
0.704 |
Electrochemical characterizations of positive active materials
The electrochemical charge storage mechanisms of the synthesized PBAs were characterized by performing CV analysis at variable scan rates (5–25 mV s−1) within the 0–1.2 V window. The predominating diffusion-controlled faradaic and surface-controlled non-faradaic/pseudo-faradaic charge storage phenomena in electroactive materials could be predicted from the following power law equation:37where i and ν are the current response and scan rate in CV, and a and b are constant values. As per the Randles–Sevcik equation, b ∼ 0.5 designates the faradaic mechanism, whereas b ∼ 1 implies the non-faradaic/pseudo-faradaic mechanisms. However, the variable scan rate CV profiles of PBAs are shown in Fig. S6(a)–(c) (ESI†), whereas prominent anodic/cathodic redox pairs are noted at 0.60/0.40, 0.67/0.56 and 0.61/0.42 V in PBA-1, PBA-2, and PBA-3, respectively. The redox activities arise in PBAs from the Co2+/3+, Mn2+/3+ and Fe2+/3+ redox pairs, while Ni2+ is electrochemically inert and does not contribute to the charge storage capacity of the materials.9 The electrochemical responses of PBA-1, PBA-2 and PBA-3 are depicted in eqn (2)–(4), respectively:| | | Na2Ni2+0.33Co2+0.33Mn2+0.33Fe2+(CN)6 ↔ Na0.33Ni2+0.33Co3+0.33Mn3+0.33Fe3+(CN)6 + 1.66Na+ + 1.66e− | (2) |
| | | Na2Ni2+0.5Co2+0.3Mn2+0.2Fe2+(CN)6 ↔ Na0.5Ni2+0.33Co3+0.3Mn3+0.2Fe3+(CN)6 + 1.5Na+ + 1.5e− | (3) |
| | | Na2Ni2+0.2Co2+0.5Mn2+0.3Fe2+(CN)6 ↔ Na0.2Ni2+0.2Co3+0.5Mn3+0.3Fe3+(CN)6 + 1.8Na+ + 1.8e− | (4) |
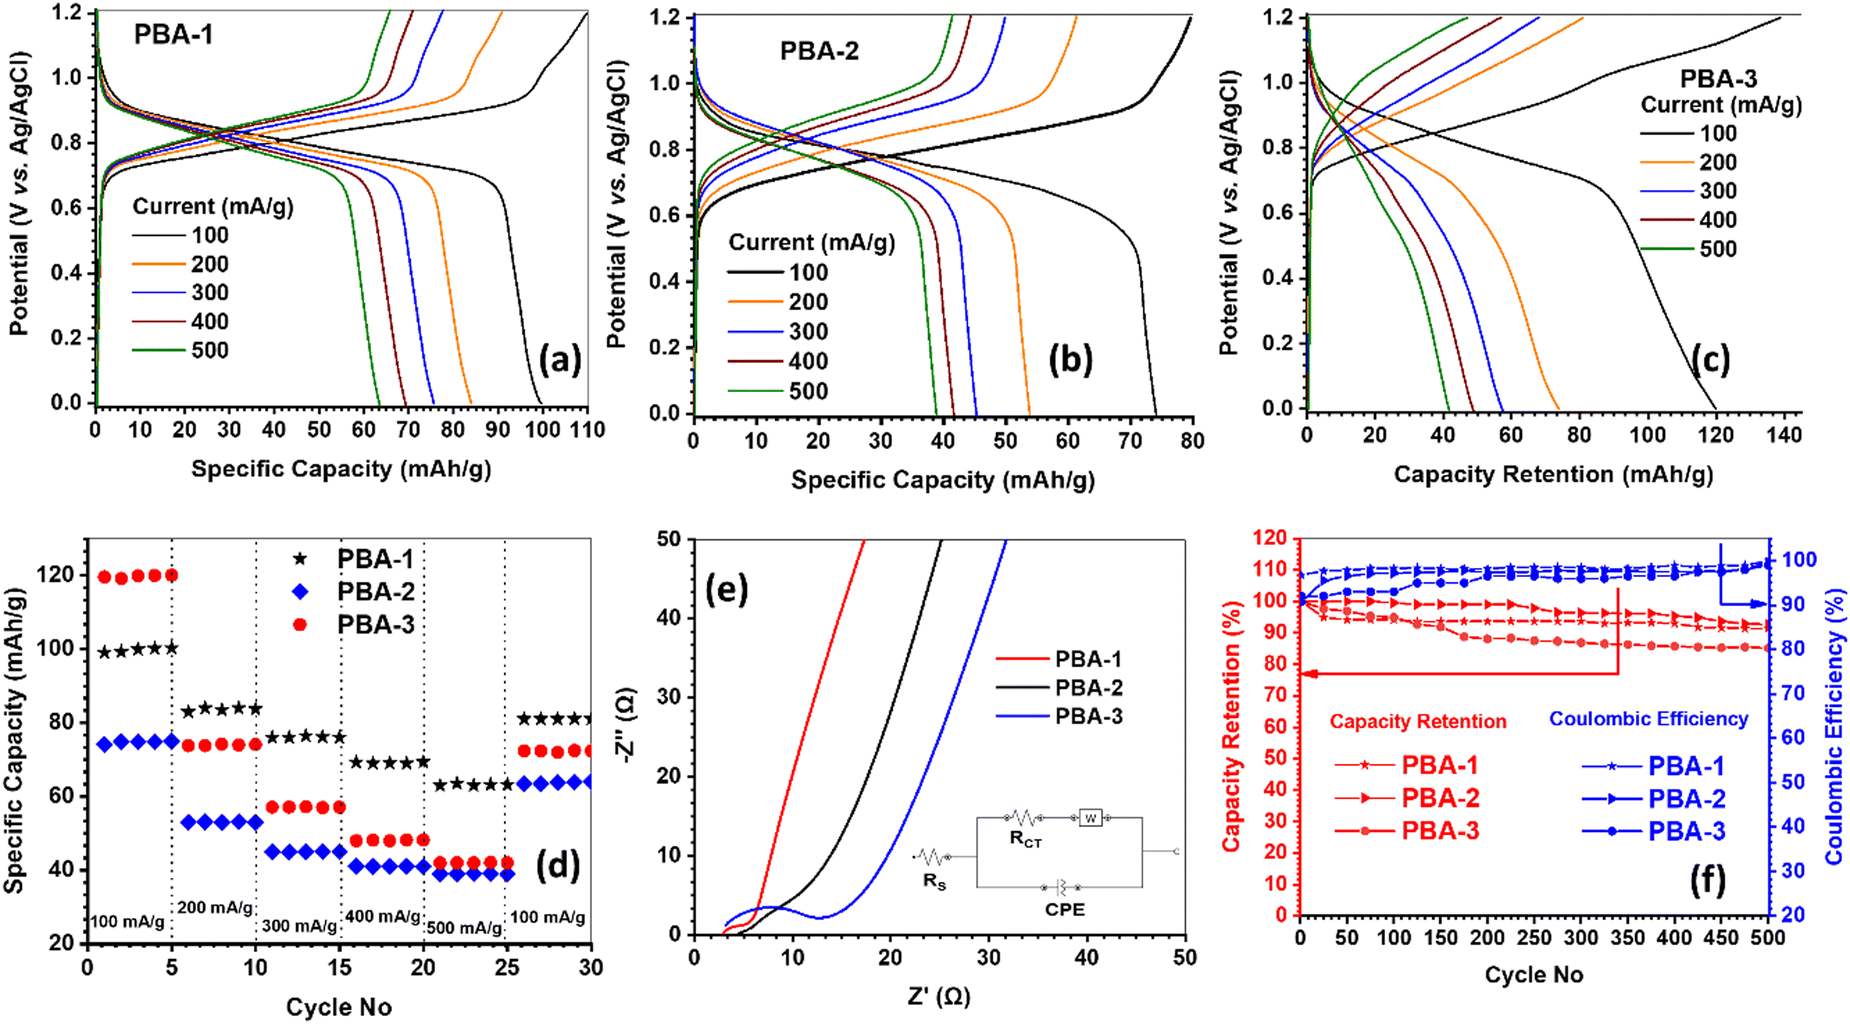
The separated peak pairs for Co2+/3+, Mn2+/3+ and Fe2+/3+ couples are not distinctive in the experimental CV profiles, rather the broad overlapped redox pairs are obtained.38 The calculations of ‘b’ values are shown in Fig. S6(d)–(f) (ESI†), while PBA-1, PBA-2 and PBA-3 exhibit ‘b’ values of 0.61/0.67, 0.71/0.74 and 0.60/0.64 at the respective anodic/cathodic peak positions. In brief, the ‘b’ values are obtained in the range of 0.60 to 0.75 that strongly correlates with the predominant diffusion-controlled faradaic charge storage mechanism. However, the both anodic and cathodic peak positions are not appreciably shifted towards the higher over potentials upon increasing the scan rate from 5 to 25 mV s−1, which signifies that the minimal mass transfer resistances are associated with the faradaic charge storage processes in PBAs. Fig. 5(a)–(c) show the GCD profiles of PBA-1, PBA-2 and PBA-3, respectively, at different current densities from 100 to 500 mA g−1 within 0–1.2 V range. The prominent voltage plateaus are observed in both charge and discharge profiles for all PBAs, which further confirms the diffusion-controlled phase transformations in the faradaic charge storage mechanism.37 The estimated specific capacities and coulombic efficiencies (CE) for PBA-1 are 100 (CE = 90%), 84 (CE = 93%), 76 (CE = 97%), 69 (CE = 98%) and 63 (CE = 99%) mA h g−1 at 100, 200, 300, 400, and 500 mA g−1 current densities respectively, while PBA-2 depicts 74 (CE = 93%), 54 (CE = 89%), 43 (CE = 93%), 41 (CE = 94%) and 39 (CE = 96%) mA h g−1 and PBA-3 demonstrates 120 (CE = 85%), 73 (CE = 84%), 57 (CE = 85%), 48 (CE = 87%) and 42 (CE = 89%) mA h g−1 under similar experimental conditions. The capacity trend exactly matches with the content of Ni-doping, as Ni remains electrochemically inactive during the charge/discharge processes of PBAs. The rate capability data are presented in Fig. 5(d), whereas 32, 47 and 65% capacity losses are observed for PBA-1, PBA-2 and PBA-3, respectively, when the current density increases from 100 to 500 mA g−1. The rate capability data are also interpreted by the capacity retention values after 25 cycles by returning the current at 100 mA g−1, whereas PBA-1 (81%) and PBA-2 (84%) exhibit better retention than PBA-3 (60%). The minimal capacity losses upon higher current densities are accountable for higher electronic conductivity of the materials, while good structural stability promotes good capacity retention after multiple cycling at multiple current loads. The EIS studies were carried out on PBAs, and the resulting Nyquist plots are shown in Fig. 5(e). The solution resistance (Rs) and charge transfer resistance (Rct) were obtained from the equivalent circuit fitting, and the same are presented in Table 3. The solid-state electronic conductivities (ρ) of the PBAs were estimated from the Rct values using eqn (5):39
| |  | (5) |
where l (75 × 10
−4 cm) is the thickness of the active material layer and
A (1 cm
2) is the geometrical surface area of the electrode. The calculated conductivities are 23 × 10
−4, 15 × 10
−4 and 7.4 × 10
−4 S cm
−1 for PBA-1, PBA-2 and PBA-3, respectively. The compositions of Ni, Co and Mn are greatly varied among three different PBAs, which definitely differentiate their electronic band structures, while the obtained electronic conductivity harmonizes with the band structure of the material.
13,16 However, the trend in electronic conductivity well synchronizes with the capacity loss data of PBAs under 100 to 500 mA g
−1 current loads. The Ni
2+-content in the PBA structure reduces the charge storage capacity, but simultaneously improves the structural integrity because of the absence of the Jahn–Teller distortion between Ni
2+ and NC bonds.
40 Therefore, PBA-1 and PBA-2 demonstrate a better capacity retention than that of PBA-3 after 25 cycles by returning the current at 100 mA g
−1. Long-term cycling stability was also tested for PBAs under 500 charge/discharge cycles at 300 mA g
−1 current density within 0–1.2 V potential window (
Fig. 5(f)), while PBA-1 and PBA-2 demonstrate 91 and 92% capacity retentions respectively. However, PBA-3 depicts 86% retention due to the lower level of Ni content. Nevertheless, the increase in CE values in few initial cycles is mainly due to the formation of passivation layers on the electrode surfaces, which minimize the further parasitic reactions in cells. The EIS analysis was also conducted after cycling experiment to elucidate the increment in resistive components (
Rs and
Rct) in PBA electrodes. Fig. S7(a)–(c) (ESI
†) present the Nyquist plots before and after cycling, and the relevant
Rs and
Rct data are summarized in
Table 3. It is worthy to mention that there are no appreciable changes in
Rs and
Rct for PBA-1 and PBA-2 electrodes; but PBA-3 depicts 29% increments in
Rct and upshifted
Rs upon cycling experiments. The
Rct enhancement indicates the degradation of the PBA-3 electrode, and the same is reflected in the capacity retention data after 500 cycles. However, from the high-throughput electrochemical characterizations of PBAs, it is clear that PBA-3 exhibits the best storage capacity and worst rate capability cum durability among the three PBAs. PBA-2 shows minimum capacity, but exhibits moderate rate capability and good durability. The PBA-1 provides moderate capacity, but demonstrates the best rate capability and good cycle life. Based on the above-mentioned comparative data analysis, PBA-1 was selected for the positive electrode in a full-cell assembly.
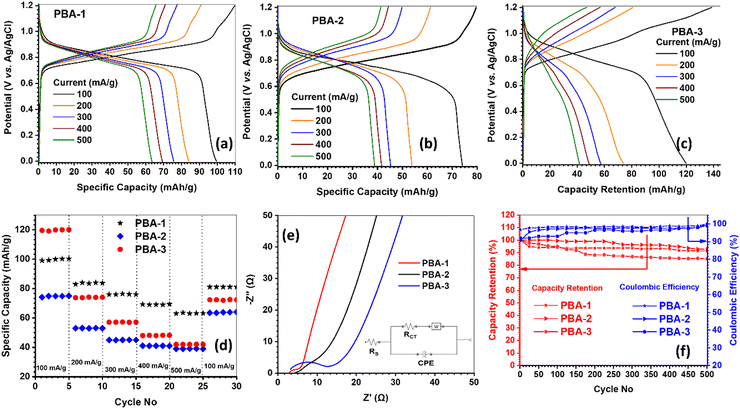 |
| | Fig. 5 Electrochemical characterizations of positive active materials: GCD profile of (a) PBA-1, (b) PBA-2, and (c) PBA-3; (d) comparative rate capability data for 30 cycles; (e) comparative Nyquist plots at discharged state (inset: equivalent circuit; W = Warburg impedance and CPE = constant phase element); and (f) comparative cycling life data at 300 mA g−1 current density. | |
Table 3 EIS analysis of PBAs before and after the cycling test
|
|
PBA-1 |
PBA-2 |
PBA-3 |
| Before cycling |
After cycling |
Before cycling |
After cycling |
Before cycling |
After cycling |
|
R
s (Ω) |
2.5 |
2.9 |
4.3 |
4.7 |
3.0 |
3.0 |
|
R
ct (Ω) |
3.2 |
3.3 |
5.2 |
5.4 |
10 |
12.9 |
Electrochemical characterizations of the negative active material
The variable scan rate CV measurements were carried out within 0.4 to −1.0 V potential window at 5–25 mV s−1, while the voltammograms are shown in Fig. S8(a), ESI†). There are two distinct cathodic/anodic redox peak pairs found at around −0.26/0.86 and −0.41/−0.12 V, which correspond to V5+/4+ and V4+/3+ redox couples respectively.41,42 The ‘b’ values were also calculated at the cathodic and anodic peak positions, whereas the same were reported as 0.36/0.42 (at −0.26/0.86 V) and 0.40/0.52 (at −0.41/−0.12 V) (Fig. S8(b), ESI†). The ‘b’ values near 0.5 and even lower signifies the diffusion-controlled faradaic charge storage mechanism, which is associated with the charge/discharge of HVO.43 Here, no mass transfer limitations are observed in higher scan rates, which is manifested by the non-shifting of peak positions towards large overpotentials at higher rates. The GCD profiles of HVO at variable current loads (100–500 mA g−1) within 0.2 to −0.7 V range are shown in Fig. 6(a). The HVO exhibits respective specific capacities of 82 (CE = 91%), 67 (CE = 91%), 61 (CE = 99%), 54 (CE = 98%) and 46 (CE = 99%) mA h g−1 at 100, 200, 300, 400 and 500 mA g−1 current density. Fig. 6(b) depicts the rate capability data, while 43% capacity loss is noted under shifting the current density from 100 to 500 mA g−1. Nonetheless, 92% of initial capacity is retained after 25 rate capability cycling, when the current reverts to 100 mA g−1. The Nyquist plot of HVO is presented in Fig. 6(c), and the related Rs and Rct values are reported as 1.9 and 4.4 Ω, respectively. The electronic conductivity was estimated from the Rct value to be 17 × 10−4 S cm−1. The cycle life data are presented in Fig. 6(d), where 80% capacity retention is observed under 500 charge/discharge cycles operated at 300 mA g−1 current load. The Nyquist plots recorded before and after cycling are shown in the inset of Fig. 6(d), while unaltered Rs and 28% increments of Rct are noted after cycling. The detailed electrochemical characterizations of HVO provide good insights into the potential negative active material for aqueous Na-ion batteries.
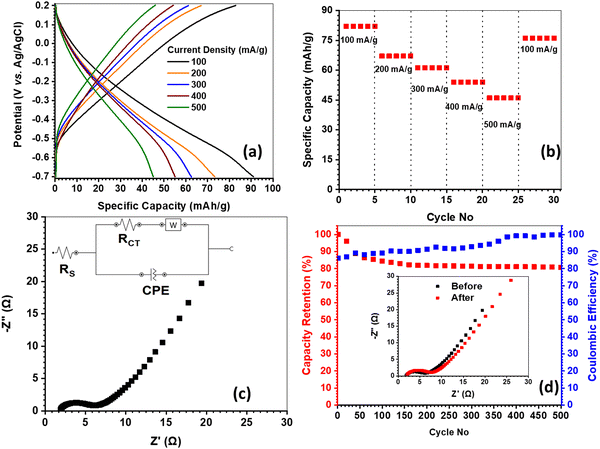 |
| | Fig. 6 Electrochemical characterizations of HVO: (a) GCD profiles at different current densities; (b) rate capability data for 30 cycles; (c) Nyquist plot at discharge state (inset: equivalent circuit); and (d) cycling life data at 300 mA g−1 current density (inset: Nyquist plots before and after cycling). | |
Performance testing of Na2Ni0.33Co0.33Mn0.33Fe(CN)6//H2V3O8 full cells
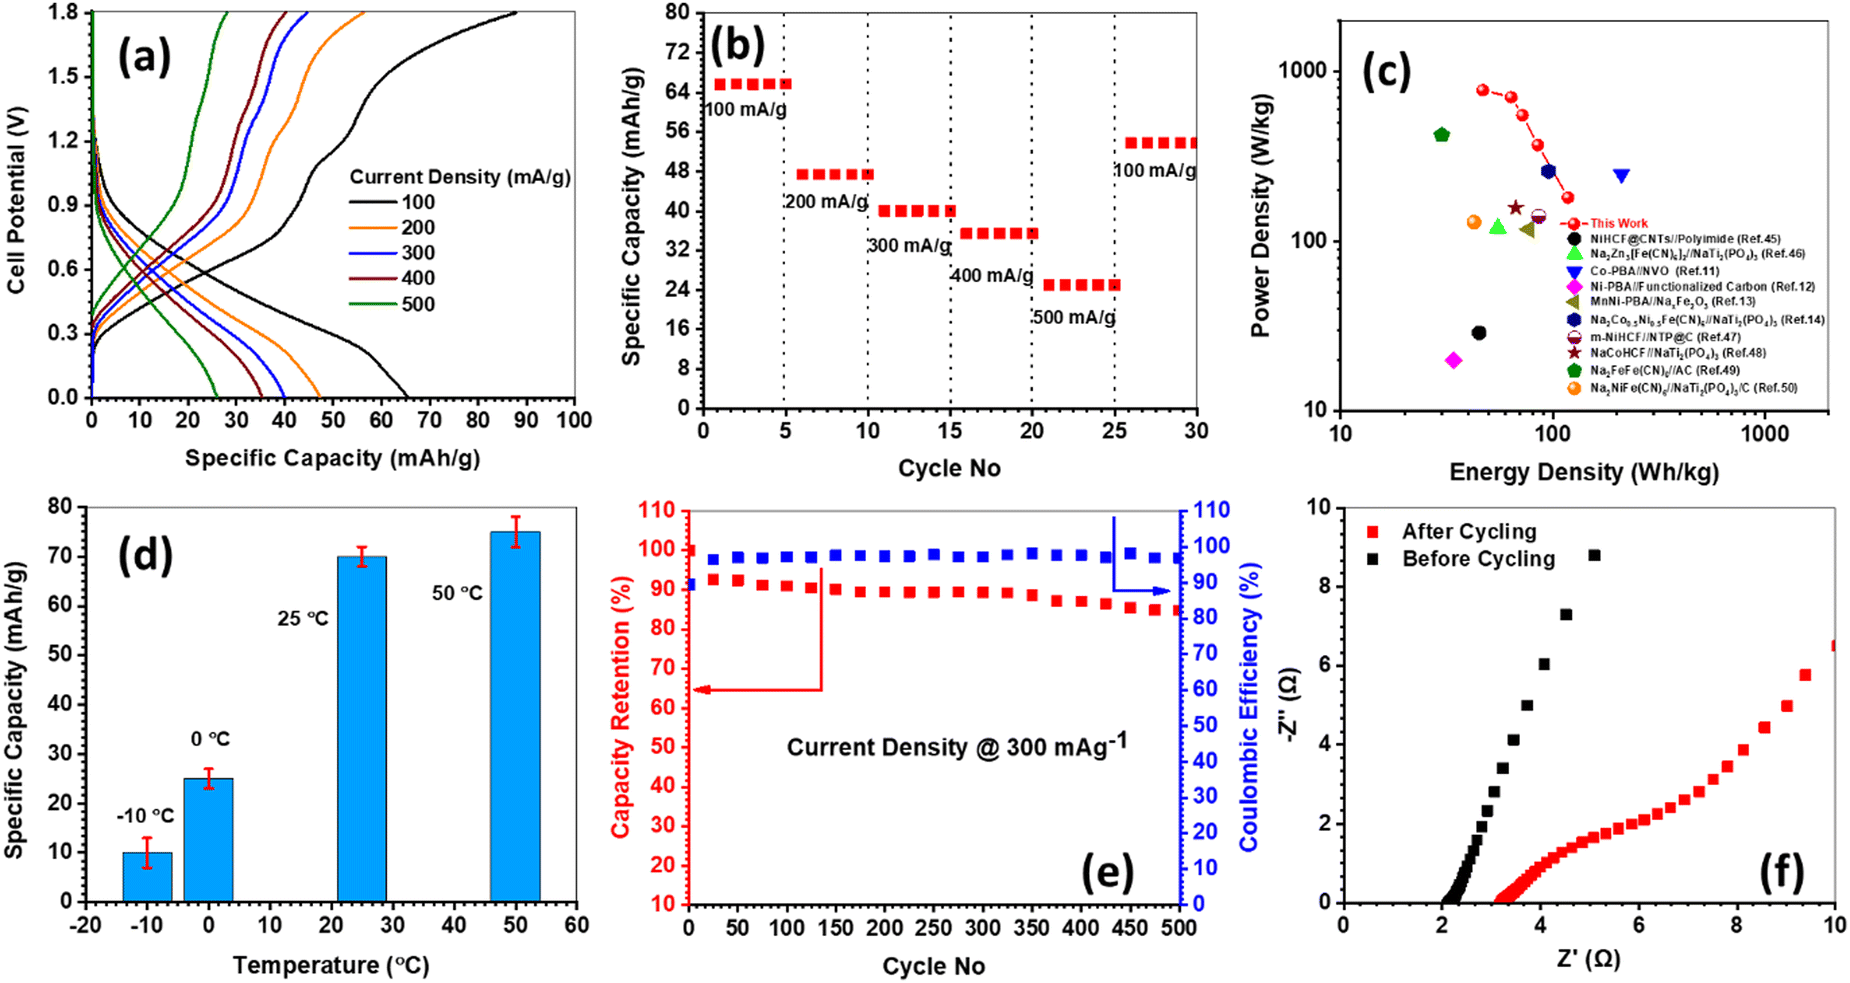
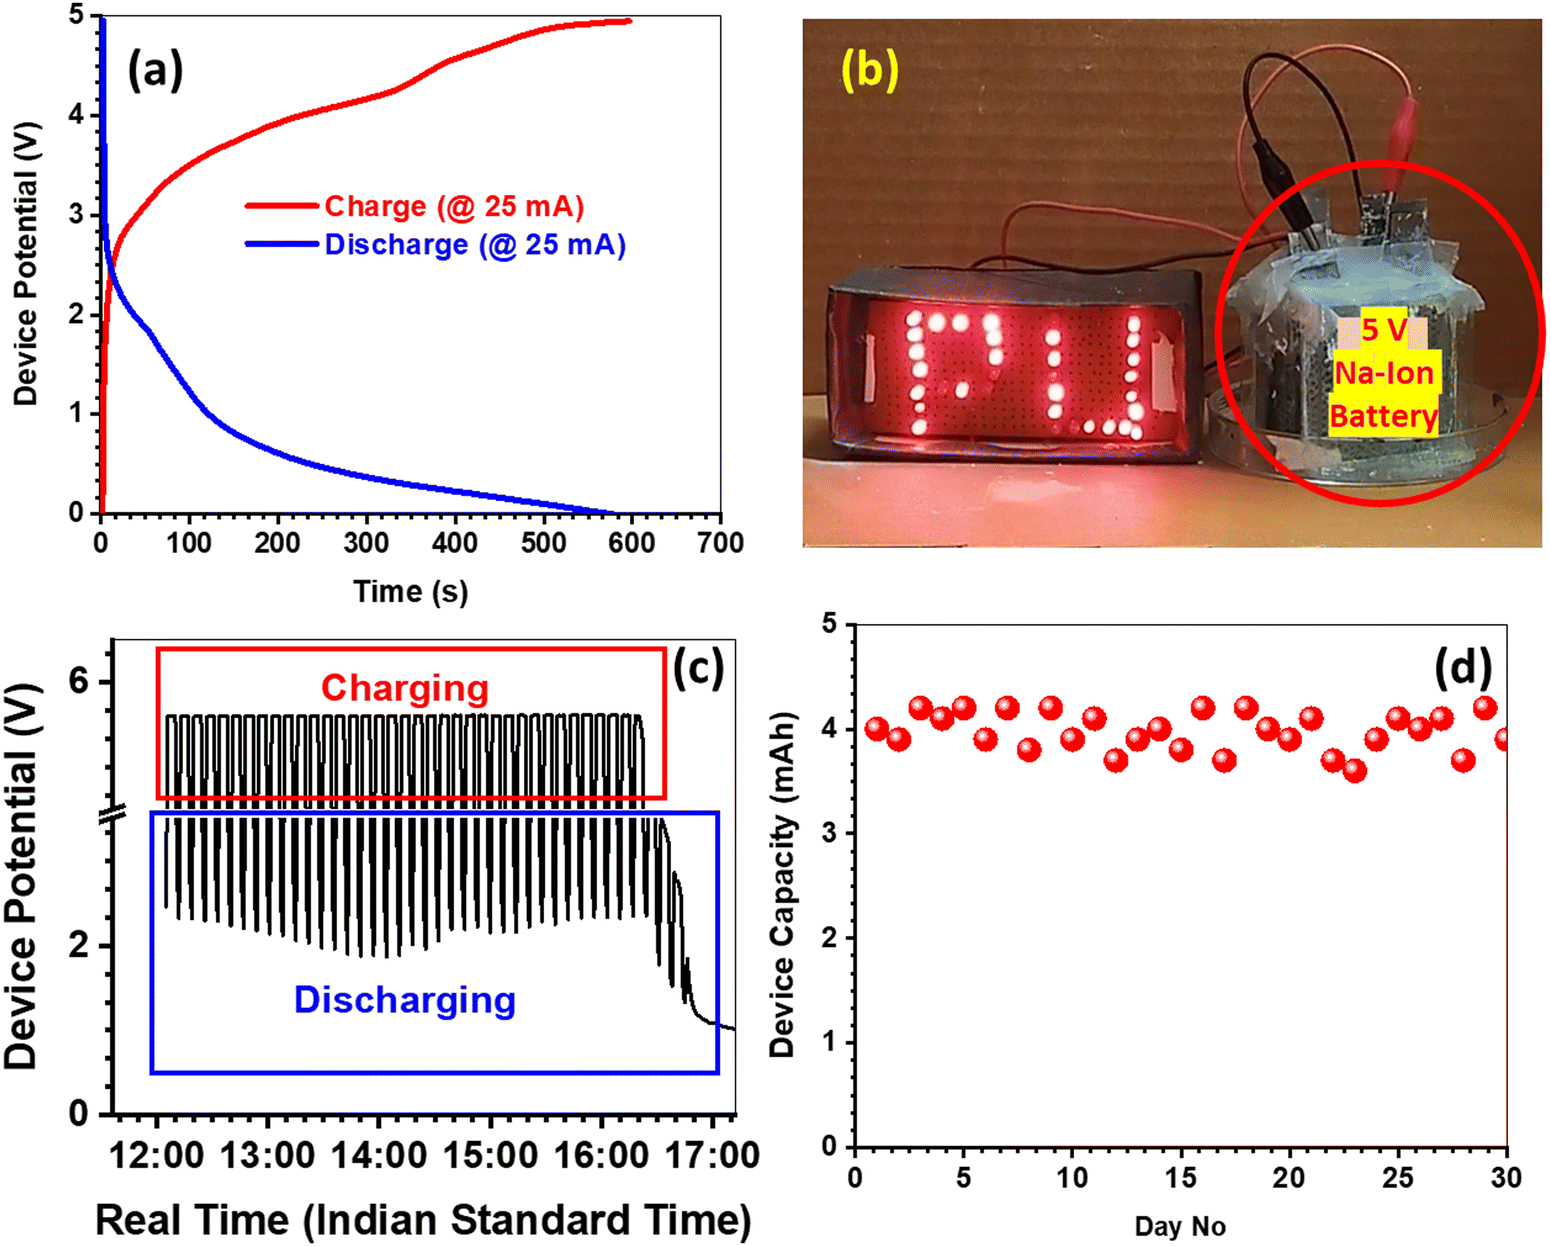
The full cell was assembled with positive limited configuration in the CMC–SiO2–Na2SO4 hydrogel electrolyte. The gel electrolytes enhance the operating voltage window of aqueous batteries by entrapping the free water molecules into the extensive H-bonded gelling networks.44 Therefore, the present full cell could be operated within 0–1.8 V window without excessive gassing. Fig. 7(a) demonstrates the GCD profiles of full cells, while 65 (CE = 75%), 47 (CE = 85%), 40 (CE = 89%), 35 (CE = 89%), and 26 (CE = 92%) mA h g−1 specific capacities are manifested at 100, 200, 300, 400 and 500 mA g−1 current densities respectively. The rate capability data are presented in Fig. 7(b), whereas the full cell depicts 60% capacity decay from 100 to 500 mA g−1, and 82% capacity retention after 25 cycles upon reverting the current density at 100 mA g−1. The Ragone plot is shown in Fig. 7(c), where the energy/power densities of PBA-1//HVO are presented along with the literature data for various PBA based cells.11–14,45–50 The PBA-1//HVO full cell demonstrates an energy density of 118 W h kg−1 (at 181 W kg−1) and a power density of 780 W kg−1 (at 46 W h kg−1). The effect of temperature on the full cell capacity is demonstrated in Fig. 7(d). The specific capacity is marginally increased from ambient condition to 50 °C, and it is due to the improved ionic conductivity in the gel electrolyte. However, drastically low ionic conductivities are obvious at sub-zero temperatures, while resultantly the capacity values are decreased appreciably. However, based on this temperature-dependent study, one can predict the operating temperature range to be −10 °C to 50 °C. Fig. 7(d) demonstrates the cycle life data of the full cell, which shows 81% capacity retention with 91% CE after 500 cycles at 300 mA g−1 current density. The inset of Fig. 7(d) shows the Nyquist plots before and after cycling, and an increment in internal resistance is observed upon cycling. To demonstrate the solar energy storage performances, a 5 V/4 mA h rated prototype device was developed by series connection of three 1.8 V cells, where each 1.8 cell was fabricated using two positive and two negative electrodes in parallel connections. The GCD profile of the 5 V prototype is presented in Fig. 8(a), which justifies the capacity rating of the prototype. The EIS analysis was carried out in the 5 V integrated device along with individual cells, and the respective Nyquist plots are depicted in Fig. S9 (ESI†). However, the ESI† study signifies that the internal resistance of 5 V prototype is the summation of the resistances from three constituent cells. This result clearly demonstrates that there are no additional resistances associated in the prototype device during the cell integration process. Moreover, the patterns of three Nyquist plots from the three constituent cells are similar, and it signifies that the individual cell is equally performing. Otherwise, the cycle life of the integrated device will be drastically reduced due to the uneven performance distributions among the constituent cells. However, the 5 V/4 mA h rated prototype device is able to illuminate a custom-made 3 V/270 mW LED load, and the photograph is presented in Fig. 8(b). Fig. 8(c) demonstrates the representative profile of one-day charge/discharge data for a 5 V/4 mA h device under 5 min solar-charge and 2 min LED-discharge schedule. The custom-built solar-charging cum LED-discharging module is schematically demonstrated in Fig. S10 (ESI†). However, we also carried out a field trial for 30 days, while the capacity of the device was estimated by 25 mA charge/discharge current load after completion of each day solar-charge/LED-discharge experiment. Fig. 8(d) depicts the variation in the device capacity during 30 days’ field trial, where 4 mA h average capacity is maintained with legitimate fluctuations.
 |
| | Fig. 7 Electrochemical performance testing data for a 1.8 V PBA-1//HVO full cell: (a) GCD profiles at different current densities; (b) rate capability data for 30 cycles; (c) Ragone plot; (d) effect of temperature on cell capacity; the capacity is estimated at 100 mA g−1 current density. (e) Cycliing life data at 300 mA g−1 current density. (f) Nyquist plots before and after cycling. | |
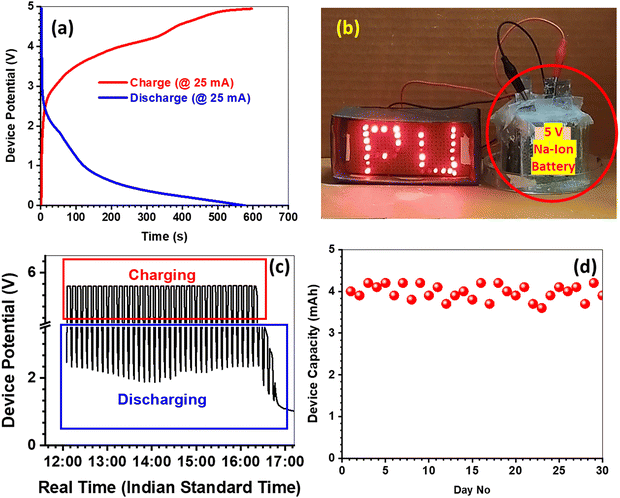 |
| | Fig. 8 Performance testing data for a 5 V/4 mA h prototype device: (a) GCD profile at 25 mA current load; (b) illumination of a 3 V/270 mW LED by a 5 V device; (c) voltage profile of the 5 V device under 5 min solar-charging and 2 min LED-discharging for a single day from around 12:00 noon to 05:00 pm; and (d) device capacity measured at 25 mA load after each day solar-charge/LED-discharge experiment during the 30-day field trial. | |
Conclusions
In this work, we demonstrated the synthesis and characterizations of three tetra-transition metallic PBAs with multiple redox centres for the positive electrode of aqueous Na-ion batteries. All three PBAs crystallize in the monoclinic phase and demonstrate almost identical crystal structures. The elemental composition determination along with the quantification of crystalline water was carried out by EDX spectroscopy and TGA, which provide the chemical structures of the PBAs. All the PBAs were electrochemically characterized by CV and EIS studies, and their performance was investigated through GCD profiles, rate capability and cycle life. The CV analysis indicates predominating faradaic charge storage mechanisms in PBAs and the relevant charge transfer resistances were estimated by EIS. The Na-ion diffusion barriers are almost similar in all three PBAs, due to the resemblance of the crystal structure; but the electrochemical performances markedly deviate from each other because of the electronic conductivity of the materials. The EIS study demonstrated solid-state electronic conductivities of PBA-1, PBA-2 and PBA-3 as 23 × 10−4, 15 × 10−4 and 7.4 × 10⁻⁴ S cm−1, respectively. PBA-3 showed the highest capacity (120 mA h g−1) compared to those of PBA-1 (100 mA h g−1) and PBA-2 (75 mA h g−1) at 100 mA g−1 current load, while it demonstrated poor rate capability (65% capacity loss from 100 to 500 mA g−1) and durability (86% capacity retention after 500 cycles at 300 mA g−1). Besides, PBA-1 and PBA-2 depicted better performances on rate capability (32 and 47%, respectively) and durability (91 and 92%, respectively). However, this performance matrix identified PBA-1 as the optimally suitable candidate for the positive electrode of aqueous Na-ion full cells. In this work, we have synthesized HVO as the negative active material, and the same was thoroughly characterized by physicochemical and electrochemical means. Thereafter, we have assembled a 1.8 V PBA-1//HVO full cell in a hydrogel electrolyte, and this cell exhibited a specific capacity of 65 mA h g−1 (at 100 mA g−1), an energy density of 118 W h kg−1 (at 181 W kg−1), a power density of 780 W kg−1 (at 46 W h kg−1) and a good cycle life (81% capacity retention after 500 cycles at 300 mA g−1). Finally, we have validated the integration of a 5 V/4 mA h prototype device for the practical demonstration of solar energy storage applications. It is noteworthy that the combination of tetra-transition metallic PBA as the positive electrode and HVO as the negative electrode in Na-ion-based energy storage devices is unique, and this unique combination is truly prospective towards industrial transformation.
Conflicts of interest
There are no conflicts to declare.
Acknowledgements
Financial support from Science and Engineering Research Board (SERB), India (file no: SRG/2019/000296) and University Grants Commission (UGC), India (no. F.30-509/(BSR)) are gratefully acknowledged. PN thanks to Council of Scientific and Industrial Research (CSIR), India for SRF (file no: 08/155(0064)/2019-EMR-I). SL gratefully thanks the SERB, India for the financial support through the Start-up Research grant (SRG/2023/000521).
References
- V. Palomares, P. Serras, I. Villaluenga, K. B. Hueso, J. Carretero-González and T. Rojo, Na-ion batteries, recent advances and present challenges to become low cost energy storage systems, Energy Environ. Sci., 2012, 5, 5884–5901 RSC.
-
A. Lachuriya and R. D. Kulkarni, Stationary electrical energy storage technology for global energy sustainability: A review. In 2017 International Conference on Nascent Technologies in Engineering (ICNTE), IEEE, 2017, pp. 1–6.
- A. A. Kebede, T. Coosemans, M. Messagie, T. Jemal, H. A. Behabtu, J. Van Mierlo and M. Berecibar, Techno-economic analysis of lithium-ion and lead-acid batteries in stationary energy storage application, J. Energy Storage, 2021, 40, 102748 CrossRef.
- L. P. Wang, L. Yu, X. Wang, M. Srinivasan and Z. J. Xu, Recent developments in electrode materials for sodium-ion batteries, J. Mater. Chem. A, 2015, 3, 9353–9378 RSC.
- N. Yabuuchi, K. Kubota, M. Dahbi and S. Komaba, Research development on sodium-ion batteries, Chem. Rev., 2014, 114, 11636–11682 CrossRef CAS PubMed.
- J. Peng, W. Zhang, Q. Liu, J. Wang, S. Chou, H. Liu and S. Dou, Prussian blue analogues for sodium-ion batteries: past, present, and future, Adv. Mater., 2022, 34, 2108384 CrossRef CAS PubMed.
- J. Qian, C. Wu, Y. Cao, Z. Ma, Y. Huang, X. Ai and H. Yang, Sodium-Ion Batteries: Prussian Blue Cathode Materials for Sodium-Ion Batteries and Other Ion Batteries, Adv. Energy Mater., 2018, 8, 1870079 CrossRef.
- K. Hurlbutt, S. Wheeler, I. Capone and M. Pasta, Prussian blue analogs as battery materials, Joule, 2018, 2, 1950–1960 CrossRef CAS.
- S. Yu, Y. Li, Y. Lu, B. Xu, Q. Wang, M. Yan and Y. Jiang, A promising cathode material of sodium iron–nickel hexacyanoferrate for sodium ion batteries, J. Power Sources, 2015, 275, 45–49 CrossRef CAS.
- Z. Hou, X. Zhang, X. Li, Y. Zhu, J. Liang and Y. Qian, Surfactant widens the electrochemical window of an aqueous electrolyte for better rechargeable aqueous sodium/zinc battery, J. Mater. Chem. A, 2017, 5, 730–738 RSC.
- P. Naskar, S. Debnath, B. Biswas, S. Laha and A. Banerjee, High-Performance and Scalable Aqueous Na-Ion Batteries Comprising a Co-Prussian Blue Analogue Framework Positive Electrode and Sodium Vanadate Nanorod Negative Electrode for Solar Energy Storage, ACS Appl. Energy Mater., 2023, 6, 4604–4617 CrossRef CAS.
- P. Naskar, S. Debnath, A. Maiti, B. Biswas and A. Banerjee, Low-Cost and Scalable Ni-Prussian Blue Analogue//Functionalized Carbon Based Na-Ion Systems for all Climate Operations, ChemPhysChem, 2023, 24, e202200588 CrossRef CAS PubMed.
- P. Naskar, S. Mondal, B. Biswas, S. Laha and A. Banerjee, Low cost & quasi solid state Na 2 Mn0.5Ni0.5Fe(CN)6//NaxFe2O3 hybrid Na-ion batteries for solar energy storage, Sustainable Energy & Fuels, 2023, 7, 4189–4201 RSC.
- P. Naskar, S. Mondal, B. Biswas, S. Laha and A. Banerjee, An Enduring Na-Ion Solar Battery Configured with Na2Co0.5Ni0.5Fe(CN)6 Positive and NaTi2(PO4)3 Negative Electrodes in Na2SO4-SiO2 Hydrogel Electrolyte, J. Electrochem. Soc., 2023, 170, 090535 CrossRef.
- J. Quan, E. Xu, H. Zhu, Y. Chang, Y. Zhu, P. Li, Z. Sun, D. Yu and Y. Jiang, A Ni-doping-induced phase transition and electron evolution in cobalt hexacyanoferrate as a stable cathode for sodium-ion batteries, Phys. Chem. Chem. Phys., 2021, 23, 2491–2499 RSC.
- L. L. Zhang, C. Wei, X. Y. Fu, Z. Y. Chen, B. Yan, P. P. Sun, K. J. Chang and X. L. Yang, Ternary Ni-based Prussian blue analogue with superior sodium storage performance induced by synergistic effect of Co and Fe, Carbon Energy, 2021, 3, 827–839 CrossRef CAS.
- Y. Zhao, L. P. Wang, M. T. Sougrati, Z. Feng, Y. Leconte, A. Fisher, M. Srinivasan and Z. Xu, A review on design strategies for carbon based metal oxides and sulfides nanocomposites for high performance Li and Na ion battery anodes, Adv. Energy Mater., 2017, 7, 1601424 CrossRef.
- D. Chen, W. Zhang, K. Luo, Y. Song, Y. Zhong, Y. Liu, G. Wang, B. Zhong, Z. Wu and X. Guo, Hard carbon for sodium storage: mechanism and optimization strategies toward commercialization, Energy Environ. Sci., 2021, 14, 244–2262 Search PubMed.
- P. Naskar, D. Kundu, A. Maiti, P. Chakraborty, B. Biswas and A. Banerjee, Frontiers in hybrid ion capacitors: a review on advanced materials and emerging devices, ChemElectroChem, 2021, 8, 1393–1429 CrossRef CAS.
- D. Bin, F. Wang, A. G. Tamirat, L. Suo, Y. Wang, C. Wang and Y. Xia, Progress in aqueous rechargeable sodium-ion batteries, Adv. Energy Mater., 2018, 8, 1703008 CrossRef.
- N. Yabuuchi, K. Kubota, M. Dahbi and S. Komaba, Research development on sodium-ion batteries, Chem. Rev., 2014, 114, 11636–11682 CrossRef CAS PubMed.
- F. Wan, L. Zhang, X. Dai, X. Wang, Z. Niu and J. Chen, Aqueous rechargeable zinc/sodium vanadate batteries with enhanced performance from simultaneous insertion of dual carriers, Nat. Commun., 2018, 9, 1656 CrossRef PubMed.
- C. Deng, S. Zhang, Z. Dong and Y. Shang, 1D nanostructured sodium vanadium oxide as a novel anode material for aqueous sodium ion batteries, Nano Energy, 2014, 4, 49–55 CrossRef CAS.
- X. Zhang, Z. Zhang, S. Xu, C. Xu and X. Rui, Advanced Vanadium Oxides for Sodium-Ion Batteries, J. Mater. Chem., 2023, 33, 2306055 CAS.
- H. Li, T. Zhai, P. He, Y. Wang, E. Hosono and H. Zhou, Single-crystal H2V3O8 nanowires: a competitive anode with large capacity for aqueous lithium-ion batteries, J. Mater. Chem., 2011, 21, 1780–1787 RSC.
- X. Wu, C. Wu, C. Wei, L. Hu, J. Qian, Y. Cao, X. Ai, J. Wang and H. Yang, Highly crystallized Na2CoFe(CN)6 with suppressed lattice defects as superior cathode material for sodium-ion batteries, ACS Appl. Mater. Interfaces, 2016, 8, 5393–5399 CrossRef CAS PubMed.
- P. He, Y. Quan, X. Xu, M. Yan, W. Yang, Q. An, L. He and L. Mai, High-performance aqueous zinc–ion battery based on layered H2V3O8 nanowire cathode, Small, 2017, 13, 1702551 CrossRef PubMed.
- J. A. Kaduk, C. E. Crowder, K. Zhong, T. G. Fawcett and M. R. Suchomel, Crystal structure of atomoxetine hydrochloride (Strattera), C17H22NOCl, Powder Diffr., 2014, 29, 269–273 CrossRef CAS.
- K. Momma and F. Izumi, VESTA 3 for three-dimensional visualization of crystal, volumetric and morphology data, J. Appl. Crystallogr., 2011, 44, 1272–1276 CrossRef CAS.
- W. Kraus and G. Nolze, POWDER CELL–a program for the representation and manipulation of crystal structures and calculation of the resulting X-ray powder patterns, J. Appl. Crystallogr., 1996, 29, 301–303 CrossRef CAS.
- L. L. Wong, K. C. Phuah, R. Dai, H. Chen, W. S. Chew and S. Adams, Bond valence pathway analyzer—an automatic rapid screening tool for fast ion conductors within softBV, Chem. Mater., 2021, 33, 625–641 CrossRef CAS.
- H. Chen, L. L. Wong and S. Adams, SoftBV–a software tool for screening the materials genome of inorganic fast ion conductors, Acta Crystallogr., Sect. B: Struct. Sci., Cryst. Eng. Mater., 2019, 75, 18–33 CrossRef CAS PubMed.
- L. Shen, Y. Jiang, Y. Liu, J. Ma, T. Sun and N. Zhu, High-stability monoclinic nickel hexacyanoferrate cathode materials for ultrafast aqueous sodium ion battery, J. Chem. Eng., 2020, 388, 124228 CrossRef CAS.
- S. Wheeler, I. Capone, S. Day, C. Tang and M. Pasta, Low-potential Prussian blue analogues for sodium-ion batteries: manganese hexacyanochromate, Chem. Mater., 2019, 31, 2619–2626 CrossRef CAS.
- J. Schoiber, D. Söllinger, V. Baran, T. Diemant, G. J. Redhammer, R. J. Behm and S. Pokrant, Resolving the structure of V3O7·H2O and Mo-substituted V3O7·H2O, Acta Cryst., 2022, B78, 637–642 Search PubMed.
- I. Mjejri, N. Etteyeb and F. Sediri, H2V3O8 nanobelts as a novel stable electrode material with good reversible redox performance, J. Alloys Compd., 2014, 611, 372–380 CrossRef CAS.
- V. Augustyn, J. Come, M. A. Lowe, J. W. Kim, P. L. Taberna, S. H. Tolbert, H. D. Abruña, P. Simon and B. Dunn, High-rate electrochemical energy storage through Li+ intercalation pseudocapacitance, Nat. Mater., 2013, 12, 518–522 CrossRef CAS PubMed.
- M. Pasta, R. Y. Wang, R. Ruffo, R. Qiao, H. W. Lee, B. Shyam, M. Guo, Y. Wang, L. A. Wray, W. Yang and M. F. Toney, Manganese–cobalt hexacyanoferrate cathodes for sodium-ion batteries, J. Mater. Chem. A, 2016, 4, 4211–4223 RSC.
- Y. Sun, S. Wang, Y. Dai and X. Lei, Electrochemical characterization of nano V, Ti doped MnO2 in primary lithium manganese dioxide batteries with high rate, Funct. Mater. Lett., 2016, 9, 1650005 CrossRef CAS.
- F. Gebert, D. L. Cortie, J. C. Bouwer, W. Wang, Z. Yan, S. X. Dou and S. L. Chou, Epitaxial Nickel Ferrocyanide Stabilizes Jahn–Teller Distortions of Manganese Ferrocyanide for Sodium-Ion Batteries, Angew. Chem., 2021, 133, 18667–18674 CrossRef.
- V. S. Nair, Y. L. Cheah and S. Madhavi, Symmetric aqueous rechargeable lithium battery using Na1. 16V3O8 nanobelts electrodes for safe high Volume energy storage applications, J. Electrochem. Soc., 2013, 161, A256 CrossRef.
- S. Hartung, N. Bucher, V. S. Nair, C. Y. Ling, Y. Wang, H. E. Hoster and M. Srinivasan, Sodium Vanadium Oxide: A New Material for High-Performance Symmetric Sodium-Ion Batteries, ChemPhysChem, 2014, 15, 2121–2128 CrossRef CAS PubMed.
- R. Kumar and M. Bag, Quantifying capacitive and diffusion-controlled charge storage from 3D bulk to 2D layered halide perovskite-based porous electrodes for efficient supercapacitor applications, J. Phys. Chem. C, 2021, 125, 16946–16954 CrossRef CAS.
- Y. Sui and X. Ji, Anticatalytic strategies to suppress water electrolysis in aqueous batteries, Chem. Rev., 2021, 121, 6654–6695 CrossRef CAS PubMed.
- Y. Yuan, D. Bin, X. Dong, Y. Wang, C. Wang and Y. Xia, Intercalation pseudocapacitive nanoscale nickel hexacyanoferrate@ carbon nanotubes as a high-rate cathode material for aqueous sodium-ion battery, ACS Sustainable Chem. Eng., 2020, 8, 3655–3663 CrossRef CAS.
- M. Shao, B. Wang, M. Liu, C. Wu, F. S. Ke, X. Ai, H. Yang and J. Qian, A high-voltage and cycle stable aqueous rechargeable Na-ion battery based on Na2Zn3[Fe(CN)6]2–NaTi2(PO4)3 intercalation chemistry, ACS Appl.
Energy Mater., 2019, 2, 5809–5815 CrossRef CAS.
- L. Shen, Y. Jiang, Y. Liu, J. Ma, T. Sun and N. Zhu, High-stability monoclinic nickel hexacyanoferrate cathode materials for ultrafast aqueous sodium ion battery, J. Chem. Eng., 2020, 388, 124228 CrossRef CAS.
- X. Wu, M. Sun, S. Guo, J. Qian, Y. Liu, Y. Cao, X. Ai and H. Yang, Vacancy-free Prussian blue nanocrystals with high capacity and superior cyclability for aqueous sodium-ion batteries, ChemNanoMat, 2015, 1, 188–193 CrossRef CAS.
- L. Zhou, Z. Yang, C. Li, B. Chen, Y. Wang, L. Fu, Y. Zhu, X. Liu and Y. Wu, Prussian blue as positive electrode material for aqueous sodium-ion capacitor with excellent performance, RSC Adv., 2016, 6, 109340 RSC.
- X. Wu, Y. Cao, X. Ai, J. Qian and H. Yang, A low-cost and environmentally benign aqueous rechargeable sodium-ion battery based on NaTi2(PO4)3–Na2NiFe(CN)6 intercalation chemistry, Electrochem. Commun., 2013, 31, 145–148 CrossRef CAS.
|
| This journal is © The Royal Society of Chemistry 2024 |
Click here to see how this site uses Cookies. View our privacy policy here. 
 Open Access Article
 This Open Access Article is licensed under a Creative Commons Attribution-Non Commercial 3.0 Unported Licence
 a,
Sourav
Laha
a,
Sourav
Laha