 Open Access Article
Boosting ethylene yield via a synergistic 2D/0D nanostructured VCu layered double hydroxide/TiO2 catalyst in electrochemical CO2 reduction†
Sneha S.
Lavate
and
Rohit
Srivastava
 *
*
Catalysis & Hydrogen Research Lab, Department of Petroleum Engineering, School of Energy Technology, Pandit Deendayal Energy University, Gandhinagar, 382007, Gujarat, India. E-mail: rohit.s@spt.pdpu.ac.in
First published on 18th September 2024
Abstract
The electrochemical conversion of CO2 into C1 and C2 hydrocarbons, such as methane and ethylene, is a promising pathway toward achieving net zero carbon emissions; however, owing to the high activation barrier of CO2, this reaction remains a big challenge. In this work, an effective strategy has been developed through the synthesis of a low-cost vanadium- and copper-based layered double hydroxide (LDH) decorated with TiO2 nanoparticles (VCu LDH/TiO2) as a highly efficient electrocatalyst for the electrochemical reduction of CO2 to ethylene. Structural and morphological studies of the developed electrocatalyst were carried out using various analytical techniques such as X-ray diffraction (XRD), Fourier transform infrared (FT-IR) spectroscopy, scanning electron microscopy (FESEM), X-ray photoelectron microscopy (XPS) and transmission electron microscopy (TEM), which confirmed the successful formation of VCu LDH/TiO2. The electrochemical CO2 reduction reaction (CO2RR) was performed in 0.1 M KHCO3 using an H-type cell and afforded CO, H2, CH4, and C2H4 as value-added end products. The highest faradaic efficiency of 84% was obtained for C2H4 at −0.4 V vs. RHE. The above results suggest that the VCu LDH/TiO2 NP electrocatalyst may be an excellent candidate for CO2 reduction and can also be utilized in a wide range of energy conversion and storage applications.
1. Introduction
Carbon dioxide (CO2) reduction provides hope for mitigating climate change through the production of clean fuels and chemicals from CO2. Since the advent of the industrial revolution, humanity has heavily relied on fossil fuels, resulting in substantial CO2 emissions into the atmosphere. The rapid increase in CO2 levels has led to a global temperature rise of approximately 2 °C, posing a grave threat to both the human life and property. Nonetheless, it is worth noting that CO2 is a cost-effective C1 molecule. This innovation can revolutionize the fossil fuel industry and make it more sustainable. It involves using electricity from renewable sources (such as wind, solar, and hydro) to convert carbon dioxide, a greenhouse gas, into valuable fuels, alcohols, and chemicals commonly used in energy and chemical production. This process, called electrochemical CO2 reduction, can help us achieve carbon neutrality and combat the harmful effects of climate change.1–4 In this process, electrons serve as the primary agents for reduction, working alongside a proton source commonly found in water (H2O). The electrochemical CO2 reduction reaction (CO2RR) can be conducted at normal temperature and pressure, making it an environmentally sustainable reaction. The resulting reduction products, including carbon monoxide (CO),5 formate,6 methanol,7 methane,8 ethylene,9 and ethanol,10 hold significant value as essential raw materials for both chemicals and fuels.11,12Among the various products produced from the reduction of carbon dioxide, ethylene is highly sought after because of its widespread industrial applications and massive market demand. Reports indicate that the global ethylene market is projected to experience significant growth, from $190.29 billion in 2020 to $302.22 billion in 2025, with a compound annual growth rate (CAGR) of 7%.13–15 Reducing CO2 to ethylene is the most sought and valuable reduction product due to its great market demand. Ethylene is a key raw ingredient in the polymer, pharmaceutical, and high-tech industries. Additionally, ethylene can be used as a welding fuel or natural gas additive. Currently, ethylene is mostly produced by cracking non-renewable naphtha under high temperatures. The production process consumes energy and typically has a detrimental influence on the environment. The CO2RR is a sustainable and environmentally friendly method for the selective production of ethylene.16 Hence, the electrochemical conversion of the greenhouse gas CO2 into ethylene serves to reduce CO2 emissions, enhance atmospheric conditions, and store renewable energy, offering substantial economic advantages.
CO2 is an inert linear molecule with a robust C![[double bond, length as m-dash]](https://www.rsc.org/images/entities/char_e001.gif) O bond (750 kJ mol−1), which necessitates a high amount of energy for electrochemical conversion. The conversion of CO2 to multi-carbon (C2+) hydrocarbons or oxygenates is a complex process involving multiple proton-coupled electron transfers (PCET), which can result in various reaction intermediates and products. This complexity often leads to low selectivity for ethylene. Theoretical studies suggest that adjusting the stability of these intermediates is key to customizing the selectivity of the CO2RR.17–19 Electrochemical CO2 reduction reactions face problems, such as high overpotential, low faradaic efficiency, competition with HER in aqueous electrolytes, and poor product selectivity.20 Among CO2RR catalysts, such as Ag, Au, Zn, Pd, and others, can either enhance CO2-to-C1 activity or lead to catalyst poisoning depending on their adsorption strength for C1 intermediates. On the other hand, copper (Cu) catalysts possess a unique electronic structure that promotes the formation of C1 intermediates with moderate adsorption strength. This characteristic results in their superior catalytic performance in CO2-to-C2+ conversion.21 Hence, Cu-based catalysts are considered the most promising catalysts for producing ethylene via the CO2RR. Furthermore, the easy and energy-efficient synthesis, multiple valence states, and complicated molecular chemistry of vanadium-based compounds have spurred a lot of interest in the development of vanadium-based materials like VO2, V3O7, V6O13, V2O5, and metal vanadates. Vanadium oxides can exist in a variety of crystalline forms and exhibit excellent specific capacity, energy density, and electrochemical properties, making them very attractive as cathode materials for lithium-ion batteries. Furthermore, these compounds have robust interactions with molecular and ionic species, endowing semiconductor materials with excellent electrocatalytic and/or photocatalytic properties.22–24 Titanium dioxide (TiO2) is a cheap, widely available, and ecologically benign material with a variety of uses. Because of its high activity and sufficient stability, TiO2 is widely employed in many different applications.25
O bond (750 kJ mol−1), which necessitates a high amount of energy for electrochemical conversion. The conversion of CO2 to multi-carbon (C2+) hydrocarbons or oxygenates is a complex process involving multiple proton-coupled electron transfers (PCET), which can result in various reaction intermediates and products. This complexity often leads to low selectivity for ethylene. Theoretical studies suggest that adjusting the stability of these intermediates is key to customizing the selectivity of the CO2RR.17–19 Electrochemical CO2 reduction reactions face problems, such as high overpotential, low faradaic efficiency, competition with HER in aqueous electrolytes, and poor product selectivity.20 Among CO2RR catalysts, such as Ag, Au, Zn, Pd, and others, can either enhance CO2-to-C1 activity or lead to catalyst poisoning depending on their adsorption strength for C1 intermediates. On the other hand, copper (Cu) catalysts possess a unique electronic structure that promotes the formation of C1 intermediates with moderate adsorption strength. This characteristic results in their superior catalytic performance in CO2-to-C2+ conversion.21 Hence, Cu-based catalysts are considered the most promising catalysts for producing ethylene via the CO2RR. Furthermore, the easy and energy-efficient synthesis, multiple valence states, and complicated molecular chemistry of vanadium-based compounds have spurred a lot of interest in the development of vanadium-based materials like VO2, V3O7, V6O13, V2O5, and metal vanadates. Vanadium oxides can exist in a variety of crystalline forms and exhibit excellent specific capacity, energy density, and electrochemical properties, making them very attractive as cathode materials for lithium-ion batteries. Furthermore, these compounds have robust interactions with molecular and ionic species, endowing semiconductor materials with excellent electrocatalytic and/or photocatalytic properties.22–24 Titanium dioxide (TiO2) is a cheap, widely available, and ecologically benign material with a variety of uses. Because of its high activity and sufficient stability, TiO2 is widely employed in many different applications.25
In CO2 reduction, H coverage is crucial to the process of hydrogenation. Therefore, one possible tactic to encourage the synthesis of C2 and the crucial intermediate is to increase H adsorption on the catalyst surface. In fact, elements like Cr, Mo, V, W, and others that are close to group VI elements have a strong affinity to hydrogen. According to earlier studies, doping with vanadium or chromium oxide can speed up the kinetics of hydrolysis and produce hydrogen protons. Cu surfaces decorated with oxides or hydroxides have been shown in earlier studies to have greater affinity for H atoms and accelerate H2O dissociation, both of which can accelerate the hydrogenation step of the CO2RR.26 Ganganahalli K. Ramesha and co-workers carried out studies to find out the catalytic effect of TiO2 on CO2 reduction through spectroelectrochemistry and product analysis. The Ti3+ species, which are produced when a negative potential is applied to the TiO2 layer, were found to be the active reduction sites. The first one-electron reduction step is facilitated by the binding of CO2 to catalytically active Ti3+ and subsequent electron transfer. The findings demonstrate that the TiO2 surface functions as an electrocatalyst by reducing the voltage needed to reduce CO2.27 Haiying He et al. reported a 0.24 V drop in the reduction potential of adsorbed CO2 on the (101) surface of TiO2 compared to a CO2 molecule in an aqueous solution using first-principles calculations. The monodentate and bidentate configurations of CO2 with TiO2 lead to charge transfer through hybridised orbitals, resulting in a decreased reduction potential28 (Scheme 1).
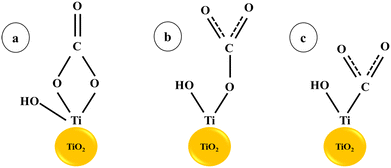 | ||
| Scheme 1 CO2 adsorption on the TiO2 surface: (a) bidentate and (b) monodentate interactions, (c) CO2 adsorption at an oxygen vacancy (or Ti3+) site.28. | ||
In the spheres of energy and environmental science, layered double hydroxides (LDH) have recently emerged as a significant group due to their unique properties. Their importance in both theoretical investigations and practical applications has led to a growing interest in the development of visibly active LDH catalysts. This is a testament to the versatility and potential of LDH in these fields.29–31 Layered double hydroxides (LDHs), also referred to as brucite-like materials, are a type of anionic clay that consists of cationic layers interspersed with anions. They have demonstrated significant potential and have been successfully used in various catalytic applications.32 LDHs are utilized widely in applications, such as sensors, sorbents, luminescence, water oxidation, water treatment, dye degradation, and seawater electrolysis33–37 due to their versatile nature and facile synthesis. The structure of LDH is [MII1−x MIIIx(OH)2]Z+(An−)z/n·mH2O, where MII and MIII are divalent and trivalent metal ions, respectively, and (An−) are the interlayered anions.38
The main objective of this work is to develop a low-cost system for the reduction of CO2 to various hydrocarbon fuels via the electrochemical route. This study reports the synthesis of 2D/0D VCu LDH/TiO2 as a highly efficient electrocatalyst via a simple and facile hydrothermal method for CO2 reduction to value-added products. The VCu LDH/TiO2 electrocatalyst exhibited excellent performance in CO2RR in a conventional H-type cell with a C2H4 faradaic efficiency (FEC2H4) of ∼92% at −0.4 V vs. RHE in a 0.1 M KHCO3 aqueous electrolyte, besides producing CO and CH4 with FECO = 0.004% and FECH4 = 7.8%. The catalyst also revealed the highest partial current density of 377.8 mA cm−2 at the same potential.
2. Materials and methods
2.1. Materials
Copper sulphate pentahydrate [CuSO4·5H2O, EMPLURA Merck, ≥98%], vanadyl sulphate pentahydrate [VOSO4·5H2O, Kemphasol, 97.0%], titanium oxide [TiO2 nanopowder, primary particle size = 21 nm (TEM), ≥99.5%, Sigma Aldrich], methanol [CH3OH, Loba Chemie Pvt Ltd, AR grade 99.9%], isopropyl alcohol [C3H8O, Loba Chemie Pvt Ltd, AR grade 99.5%] and deionized water. All the chemicals were used without any further treatment.2.2. Methodology
![[thin space (1/6-em)]](https://www.rsc.org/images/entities/char_2009.gif) :
:![[thin space (1/6-em)]](https://www.rsc.org/images/entities/char_2009.gif) 3 were dissolved in deionised water. After dissolving the required quantity of TiO2 nanopowder in deionised water, it was combined with the transition metal precursor solution that was previously prepared. After achieving homogeneity, the reaction mixture was heated for 17 hours at 160 °C in a 100-mL Teflon autoclave made of stainless steel. A substantial amount of DI water and methanol were used to cleanse the resulting solution once the reaction mixture was cooled to room temperature. The product was cleaned and then vacuum-oven dried overnight at 80 °C. After drying, a green finished product was obtained, which was then placed in a vial and preserved in a desiccator. Identical sets of reactions were performed with reaction times of 3 and 6 hours, and the resultant products were stored for later investigation (Fig. 1).
3 were dissolved in deionised water. After dissolving the required quantity of TiO2 nanopowder in deionised water, it was combined with the transition metal precursor solution that was previously prepared. After achieving homogeneity, the reaction mixture was heated for 17 hours at 160 °C in a 100-mL Teflon autoclave made of stainless steel. A substantial amount of DI water and methanol were used to cleanse the resulting solution once the reaction mixture was cooled to room temperature. The product was cleaned and then vacuum-oven dried overnight at 80 °C. After drying, a green finished product was obtained, which was then placed in a vial and preserved in a desiccator. Identical sets of reactions were performed with reaction times of 3 and 6 hours, and the resultant products were stored for later investigation (Fig. 1).
3. Instrumentation
Powder X-ray diffraction (PXRD) of VCu LDH/TiO2 was conducted using Cu Kα radiation on an XRD-D2 Phaser and LYNXEYE XE-T detector at λ = 0.15418 nm (Bruker Ltd Germany). Fourier transform infrared spectroscopy (FT-IR) was performed with PerkinElmer Spectrum-2. X-ray photoelectron spectrometry (XPS) was recorded using Al Kα radiation (Thermo Fisher Scientific). The surface morphology of the catalyst was analyzed by field emission scanning electron microscopy (FESEM, Zeiss ULTRA) with energy dispersive X-ray spectroscopy (EDS). A high-resolution transmission electron microscope (Talos Cryo-TEM) was used to capture high-resolution micrographs along with selected area electron diffraction (SAED). Inductively coupled plasma optical emission spectrometric (ICP-OES) analysis was performed using Model 7300:DV from PerkinElmer. All electrochemical data were recorded using a Gamry Interface-E0101 potentiostat (Gamry Instruments). The end products of CO2 reduction were analyzed using a gas chromatography system (Chromatec Crystal 9000).4. CO2 reduction setup
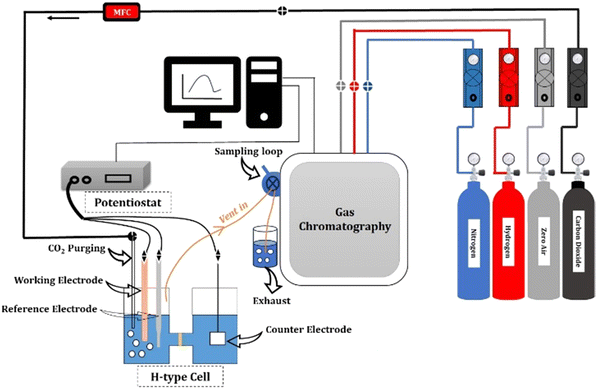
For the CO2RR, 0.1 M KHCO3 was used as an electrolyte. A platinum foil and an Ag/AgCl were used as the counter and reference electrodes, respectively. A gastight H-type glass cell separated by Nafion (117) was used for the 3-electrode assembly. The working electrode and reference electrode were placed in one compartment of the H-cell and the counter electrode was placed in the other chamber, as shown in Fig. 2. The electrolyte solution (75 mL) was injected into each compartment of the H-type electrochemical cell. The three electrodes in the H-type cell were connected to the electrochemical workstation for controlling the potential. The electrolyte was bubbled with CO2 at 50 sccm using a mass flow controller for 30 min to achieve CO2-saturated 0.1 M KHCO3, and the CO2 flow was maintained at 50 sccm throughout the duration of electrolysis.The pH of the electrolyte, i.e. 0.1 M KHCO3 saturated with CO2, was determined using a pH meter. All potentials measured against Ag/AgCl were converted to the reversible hydrogen electrode (RHE) scale using eqn (1).
| ERHE = EAg/AgCl + E0Ag/AgCl + 0.059 pH | (1) |
5. Results and discussion
5.1. X-Ray diffraction
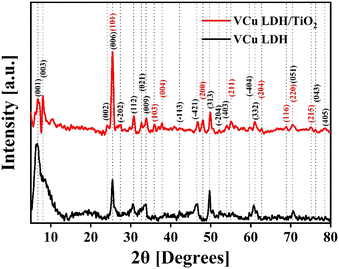
The XRD spectrum of VCu LDH/TiO2 synthesized via a hydrothermal process for a reaction time of 17 h, as depicted in Fig. 3, exhibited distinct peaks. They indicated that the as-synthesized catalyst exhibits considerable crystallinity, which can be attributed to the carefully calibrated hydrothermal reaction parameters that promote crystal growth. For comparison, the XRD patterns of VCu LDH/TiO2 synthesized for 3 h and 6 h are shown in Fig. S3 (ESI†).The XRD pattern of the VCu LDH exhibited several peaks, indicating a layered structure. The peaks observed at 6.69° (d = 1.32 nm), 7.54° (d = 1.17 nm), 23.23° (d = 0.38 nm), 25.52° (d = 0.35 nm), 27.26° (d = 0.33 nm), 30.64° (d = 0.29 nm), 32.69° (d = 0.27 nm), 33.54° (d = 0.27 nm), 40.91° (d = 0.22 nm), 42.25° (d = 0.21 nm), 47.73° (d = 0.19 nm), 52.22° (d = 0.18 nm), 54.01° (d = 0.17 nm), 59.74° (d = 0.16 nm), 60.79° (d = 0.19 nm), 70.75° (d = 0.13 nm), 76.23° (d = 0.12 nm) and 78.43° (d = 0.12 nm) can be attributed to the following hkl diffraction planes of the layered double hydroxide structure, respectively: (001), (003), (002), (006), (−202), (112), (021), (009), (−113), (−421), (313), (−204), (403), (−404), (332), (051), (043) and (405). The presence of these peaks confirms the successful synthesis of the VCu LDH material with a well-defined layered structure, as shown in our previous work.39 The XRD pattern matches the JCPDS: 01-078-2077 standard of copper hydroxide vanadium oxide hydrate. The locations, strengths, and forms of the (003), (006), and (009) peaks, along with other peaks in the XRD pattern, provide researchers with important information about the interlayer spacing, composition of the interlayer, crystallinity, and structural organization of the LDH material being studied.39
Moreover, for TiO2, the peaks visible at 25.5° (d = 0.35 nm), 35.93° (d = 0.25 nm), 37.9° (d = 0.24 nm), 48.1° (d = 0.19 nm), 55.1° (d = 0.17 nm), 62.8° (d = 0.15 nm), 68.8° (d = 0.14 nm), 70.4° (d = 0.13 nm) and 75.1° (d = 0.13 nm) correspond to the JCPDS: 21-1272 standard40 and represent the hkl values (101), (103), (004), (200), (211), (204), (116), (220) and (215), respectively. The XRD plot in Fig. 3 shows the characteristic peaks of VCu LDH and TiO2 that merged together to form the VCu LDH/TiO2 heterostructure. The standard reference cards corresponding to VCu LDH and TiO2 are attached in Fig. S4 (ESI†).
5.2. Field-emission scanning electron microscopy (FESEM)
The surface morphology of the catalyst was studied by FESEM. The synthesized catalyst showed a uniform flower-like morphology, which can be attributed to VCu LDH,39 with TiO2 nanoparticles decorated on the surface of the LDH flower. The FESEM images of VCuLDH/TiO2 obtained at different resolutions of 10 μm, 2 μm, 1 μm and 200 nm are shown in Fig. 4 below. The average thickness of VCu LDH was ∼18 nm, whereas TiO2 nanoparticles of size ∼21 nm were used for synthesis. When the reaction was carried out at 3 h and 6 h, the uniform flower-like morphology was not observed in the FESEM images (Fig. S2, ESI†). Therefore, the catalyst synthesized in the 17-h reaction was used for further characterization and analysis. The uniform distribution of elements V (green), Cu (purple), Ti (blue) and O (red) was observed, as shown in Fig. 4 below.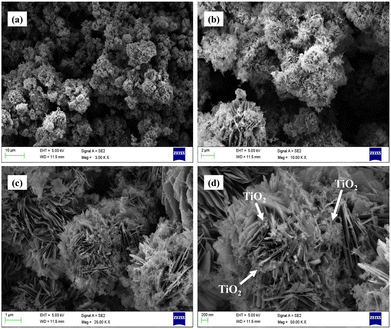 | ||
| Fig. 4 Field-emission scanning electron microscopy images of VCu LDH/TiO2 at different resolutions: (a) 10 μm, (b) 2 μm, (c) 1 μm and (d) 200 nm. | ||
5.3. Fourier transform infrared spectroscopy (FT-IR)
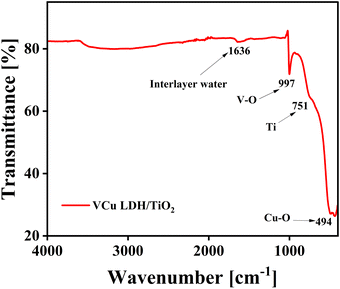
The FT-IR spectrum of VCu LDH/TiO2 is shown in Fig. 5. The water molecules in the interlayer and the O–H group stretching vibrations of the hydroxide layers are linked to the wide absorption band in the 3600–3100 cm−1 region. The bending vibration of the interlayer water can be attributed to the band at around 1629 cm−1. The M–O and O–M–O (M = V, Cu, and Ti) stretching vibrations are responsible for the peaks located below 800 cm−1.41 The development of LDH/TiO2 as a composite is confirmed by the FTIR spectrum.5.4. High-resolution transmission electron microscopy (HR-TEM)
Fig. 6 shows the high-resolution transmission electron microscopic images of the VCu LDH/TiO2 nanostructure at different resolutions of (a) 50 nm, (b) 20 nm, and (c) 5 nm, and panel (d) depicts the selected area electron diffraction (SAED). As seen in Fig. 6(a) and (b), VCu LDH acts as a porous support for TiO2 nanoparticles, forming a 2D/0D hybrid nanostructure. This formation leads to an increase in active sites for CO2 adsorption. Fig. 6(d) shows the lattice fringes; the planes (003) and (002) correspond to VCu LDH, and (101) corresponds to TiO2, thus matching the XRD planes. The SAED pattern exhibits d-spacings of 0.13, 0.17, 0.23 and 0.35 nm corresponding to the (220), (211), (004) and (006) planes.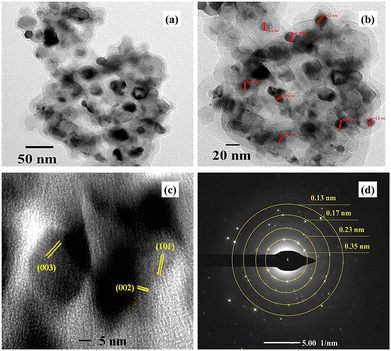 | ||
| Fig. 6 High-resolution transmission electron microscopy images of VCu LDH/TiO2 at (a) 50 nm, (b) 20 nm, and (c) 5 nm. (d) SAED of VCu LDH/TiO2. | ||
5.5. X-ray photoelectron spectroscopy
Fig. 7(a) is the full XPS scan of the VCu LDH/TiO2 nanostructure. In Fig. 7(b)–(d), the V 2p, Cu 2p and Ti 2p spectra are shown, respectively. Fig. 7(e) presents the O 1s spectrum. The binding energy peak at 514.3 eV can be attributed to the V 2p3/2 spin corresponding to the V(III) oxidation state. The weak binding energy peaks at 929.0 and 948.6 eV in the Cu 2p spectrum show the presence of the Cu(0) oxidation state. The peaks at 932.0 and 951.7 eV signify the presence of the Cu(II) oxidation state with a Cu 2p1/2 spin. In the Ti 2p region, the binding energy peaks at 455.7 and 461.5 eV indicate the Ti(III) oxidation state in the VCu LDH/TiO2 nanostructure. In the formula of LDH, [MII1−x MIIIx(OH)2]Z+(An−)z/n·mH2O, MII corresponds to copper and MIII to vanadium in this study.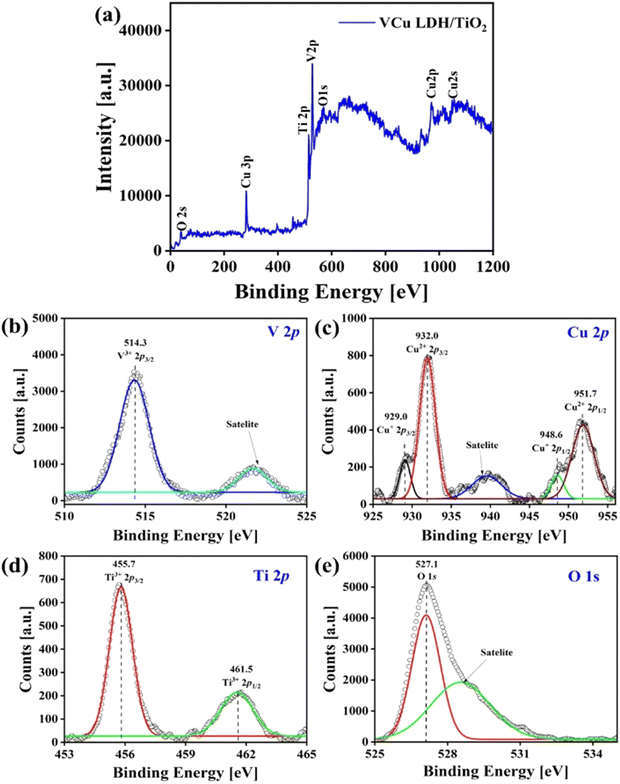 | ||
| Fig. 7 X-ray photoelectron spectra of VCu LDH/TiO2: (a) full scan, (b) V 2p, (c) Cu 2p, (d) Ti 2p and (e) O 1s. | ||
5.6. Inductive coupled plasma-optical emission spectroscopy (ICP-OES)
The ICP-OES analysis is performed to find out the exact concentrations of the elements present in any material. For analysis, the samples were prepared by dissolving or digesting 4 mg of the VCu LDH/TiO2 catalyst with 50 mL nitric acid (HNO3). The sample was stirred and heated at around 70 °C till a transparent solution was achieved. From the final solution, 200 μL was taken and added to 25 mL of Milli-Q water, and further filtered by using a 0.45 mm nylon filter. The concentrations obtained were 0.042 mg L−1 for copper (6.56 wt%), 0.277 mg L−1 for vanadium (43.28 wt%) and 0.049 mg L−1 for titanium (7.65 wt%).5.7. Pathway of CO2 reduction to ethylene
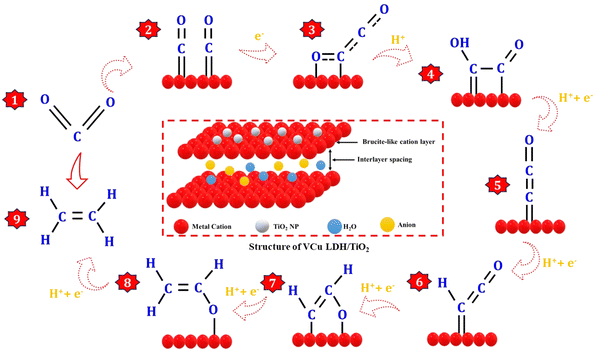
The CO2RR process can be categorized into three distinct stages: the formation of a CO intermediate, C–C coupling, and hydrodeoxygenation of C2 intermediates, as shown in Fig. 8. Drawing inspiration from the behavior of Cu clusters, the controllable hydrodeoxygenation process can also be achieved by introducing additional active sites on the Cu surface through bimetallic synergy, which can enhance the relative stability of the oxygenated C2 intermediates or the C–O bond.42 Regarding the formation of the CO intermediate, CO2 initially adsorbs onto the catalyst surface through strong M–O and M–C (M-metal) bonds, causing the linear O–C–O bonds to bend due to activation by the metals. Subsequently, the oxygen atoms in *CO2 that are farther away from the metal surface become susceptible to attack by *H, which leads to the generation of the *COOH intermediate, followed by the formation of the *CO species through the cleavage of a C–O bond. *CO is considered a crucial intermediate in the formation of CO2RR products with more than two electrons (>2e−)18 because of the similar product distribution observed in both CO and CO2 reduction over Cu-based catalysts.43 The *CO species, when adsorbed on the metal surface, can adopt different configurations, such as atop-, bridge-, and hollow-bound CO. In these configurations, the CO species interact with one, two, and more than three metal atoms, respectively.13,44,45 The adsorption states of *CO play a significant role in determining the binding energy of *CO on the metal surface, which is vital for the subsequent hydrogenation process and influences the distribution of products.46,47 This phenomenon elucidates the ability of Cu to catalyze the electroreduction of CO2 to hydrocarbons and multi-carbon products. The pairing of the *CO-atop and *CO-bridge species offers potential for C2 production through C–C coupling. On the other hand, *CO-hollow, an inert species on the Cu surface, does not noticeably contribute to the formation of hydrocarbons due to its strong binding strength.44,45,48,49The C–C coupling process is pivotal for the formation of C2+ products. However, the CO dimerization step is influenced by multiple factors. For example, a high local *CO intermediate coverage brings the reaction intermediates in close proximity to the catalyst surface, facilitating C–C coupling. The atomic configuration and valence state of the metals impact the CO adsorption state and bond strength, which can modulate the rate of C–C coupling. The presence of two *CO with moderate binding strength on the metal surface results in C–C coupling, which is a structure-sensitive reaction that also determines the rate of C2 product formation.49–51 In addition to *CO dimerization, several other thermodynamically viable C–C coupling mechanisms have been suggested. These include the formation of CHO–CHO, CO–COH, CH2–CH2, CH2–CO, CH3–CO2˙−, and HCHO–HCHO as intermediates. The active sites and reaction conditions govern the surface concentration of these intermediates and control the primary source of C–C bonds. Following C–C coupling, the subsequent *OCCO hydrodeoxygenation step dictates the selectivity of CO2RR to ethylene production.52–57 The overall conversion reaction of CO2 to ethylene at the cathode and the anode is given below.
At the cathode:
| 2CO2 + 12H+ + 12e− → C2H4 + 4H2O | (R1) |
At the anode:
| 2H2O → O2 + 4H+ + 4e− | (R2) |
6. Electrochemical CO2 reduction and end-product analysis
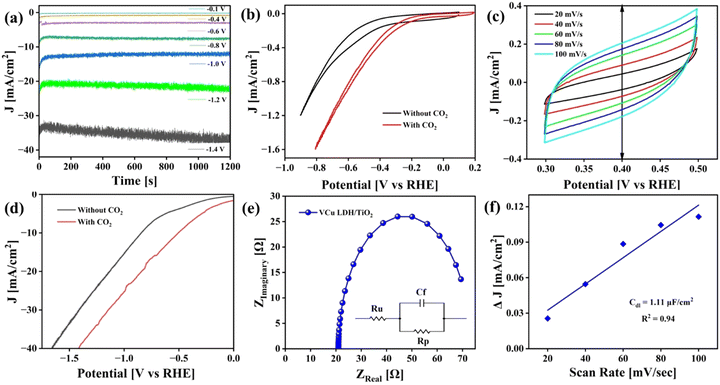
The CO2RR was carried out in an H-cell with 0.1 M KHCO3 as the electrolyte. Gamry Framework software was used to control all the electrochemical analyses. Cyclic voltammetry (CV) was performed for 10 continuous cycles in the voltage window of 1 V to −1.5 V (vs. Ag/AgCl) at a scan rate of 500 mV s−1 in CO2-saturated 0.1 M KHCO3 to activate the working catalyst. Chronoamperometry curves of CO2 reduction were recorded at different potentials, as displayed in Fig. 9(a), using a potentiostat. Steady-state chronoamperometry was performed from −0.1 V to −1.4 V vs. RHE. CV curves obtained before and after purging CO2 from 0 V to −1 V vs. Ag/AgCl are presented in Fig. 9(b). Moreover, CV was performed at different scan rates i.e. 20, 40, 60, 80 and 100 mV s−1 to calculate double-layer capacitance, as shown in Fig. 9(c). Linear sweep voltammetry (LSV) was also performed before and after CO2 purging from 0 V to −2 V vs. Ag/AgCl and later converted to RHE (Fig. 9(d)). The current density of 40 mA cm−2 was achieved at ∼1.8 V vs. RHE. The CV and LSV curves are not iR-compensated.Fig. 9(e) presents the electrochemical impedance spectroscopy (EIS) plot in the frequency range of 100 kHz to 0.1 Hz at an amplitude of 10 mV AC voltage to determine the resistance of the catalyst (Rp) and the electrolyte (Ru). The obtained Nyquist plot was fitted to Randle's circuit using Gamry E-chem analyst. VCu LDH/TiO2 exhibited Rp and Ru values of 52.27 and 20.99 Ω, respectively. The Cdl value mentioned in Fig. 9(f) was calculated as per eqn (2).
| Cdl = ΔJ(ja − jc)/2γ | (2) |
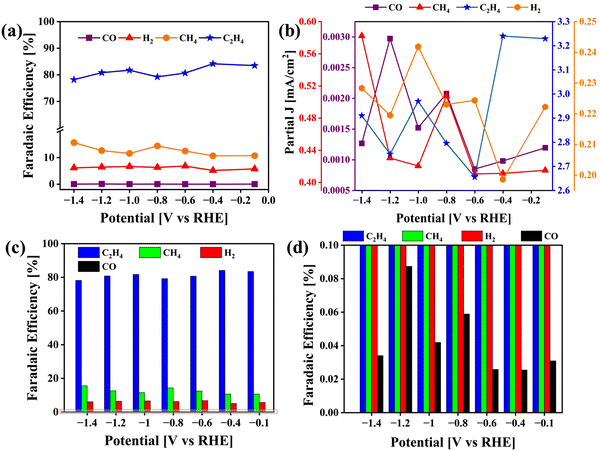
An online GC equipped with a Porapak-R column and a 1 mL sampling loop was used for the analysis of gas products generated during the CO2RR. The quantitative analysis of CO and hydrocarbons was done by a flame ionization detector (FID) with a methanizer, and H2 was detected using a thermal conductivity detector (TCD). A standard gas mixture was used for the calibration of CO, H2, CH4 and C2H4 (CO: 1002 ppm; H2: 1002 ppm, CH4: 1002 ppm and C2H4: 1001 ppm; balanced with nitrogen). During electrolysis, the CO2 gas flow rate was maintained at 50.0 sccm, delivering CO2 into the cathodic compartment containing the CO2-saturated 0.1 M KHCO3 electrolyte, and vented into the GC sampling loop. The voltage was tuned stepwise on the working electrode using the potentiostat, with 20 min at each potential, and the corresponding chronoamperometric curves were recorded. The gas products were sampled after continuous electrolysis for 20 min under each potential. The 50 sccm CO2 gas was mixed with the continuously produced end products and flowed through the sampling loop (1 mL) of GC during electrolysis. The CO, CH4 and C2H4 contents were analysed by FID, as shown in Fig. S4 (ESI†). The final concentrations were obtained by applying the calibration method (with the above-mentioned calibration standards) using Chromatec Navigator. Further, calculations of partial current density and faradaic efficiency (ESI†) were done as mentioned below in eqn (3) and (4), respectively.
The partial current density (Fig. 10(b)) of a given gas product was calculated as
 | (3) |
The corresponding FE at each potential (Fig. 10(a), (c) and (d)) was calculated as
 | (4) |
The calculated FEs for CO, H2, CH4 and C2H4 are displayed in Fig. 10(a), (c) and (d) along with the partial current density plot in Fig. 10(b). Some examples of catalysts reported for the conversion of CO2 to ethylene are mentioned in Table 1. The highest FE was obtained at −0.4 V vs. RHE along with a partial current density of 3.24 mA cm−2. The turnover frequency values (TOF) were obtained for CO, CH4 and C2H4 with respect to the potential applied during electrolysis (ESI†). At −0.4 V vs. RHE, the TOF was found to be 16.6 (h−1) at a catalyst loading of only 0.12 mg cm−2 (Fig. S1, ESI†). For comparison, we carried out the same set of experiments to test the activity of pristine VCu LDH in CO2RR, as presented in Fig. S7 (ESI†). The FE values of VCu LDH and VCu LDH/TiO2 are shown in Table S1 (ESI†). With VCu LDH, the FE achieved at −0.4 V RHE was 77.96%, which is ∼6% lower than that obtained with VCu LDH/TiO2.
| Catalyst | Electrolyte | Electrolyser | Faradaic efficiency (%) | Ref. |
|---|---|---|---|---|
| Carbon-Cu-PTFE | Neutral | Flow cell | 70 | 58 |
| Fluorine-modified copper | 0.1 M KHCO3 | Flow cell | 80 | 59 |
| Nano dendritic copper catalyst | 0.1 M KHCO3 | Flow cell | 57 | 60 |
| CuAg alloy | 1 M KOH | Flow cell | 60 | 61 |
| Cu-Polyamine | 1 M KOH | Flow cell | 72 | 62 |
| Cu nanoparticles on pyridinic-N-rich graphene | 0.5 M KHCO3 | H-Cell | 19 | 63 |
| Cu–Zn Alloy | 0.1 M KHCO3 | H-Cell | 33.3 | 64 |
| a-Ni/Cu-NP@CMK | 0.1 M KHCO3 | Flow cell | 72.3 | 65 |
| Ultrathin CuO nanoplate arrays | Neutral KCl | Flow cell | 84.5 | 66 |
| Polyamine incorporated Cu electrodes | 10 M KOH | Flow cell | 87 | 67 |
| Zn–Cu bimetallic GDE | — | H-Cell | 40 | 68 |
| MgAl LDH/Cu | 1 M KHCO3 | Flow cell | 55.1 | 69 |
| Electrodeposited Cu | Acidic | Flow cell | 60 | 70 |
| VCu LDH/TiO2 | 0.1 M KHCO3 | H-Cell | 84.13 | Our work |
7. Conclusion
The low-cost and highly efficient VCu LDH/TiO2 electrocatalyst was successfully synthesized by a hydrothermal process. The X-ray diffraction data showed the crystalline nature of the VCu LDH/TiO2 electrocatalyst. A uniform flower-like morphology with TiO2 nanoparticles embedded on the surface of petals was observed by FESEM. The FT-IR spectra exhibited vibrational stretching corresponding to the formation of the LDH material, along with the metal peaks below 800 cm−1. The HRTEM analysis verified that the porous structure of LDH acts as the template for TiO2 nanoparticles. The XPS result showed the existence of the constituent elements of the VCu LDH/TiO2 electrocatalyst and their oxidation states. The strong binding energies of the XPS peaks corresponded to V3+, Cu2+, Ti3+ and O1s. The electrochemical performance analysis of the catalyst in CO2 reduction showed the formation of value-added end products, such as CH4 and C2H4. The LSV data suggests that VCu LDH/TiO2 reached high current densities at lower voltages. CO2 was reduced in a traditional H-type cell by utilizing VCu LDH/TiO2 electrocatalyst into CO, CH4 and C2H4, and the highest FE was observed for C2H4 at a potential of −0.4 V vs. RHE. The lowest concentrations of CO (∼0) were obtained throughout the range of electrolysis. For C2H4, the highest FE was found to be around 84%. When the potential was increased beyond −0.4 V, the corresponding FE for C2H4 reduced and then increased again. These results exemplify that the existence of active Cu sites in VCu LDH/TiO2 facilitates the generation of the C2H4 product. This is attributed to the known propensity of Cu-based materials to yield C2 products. As the results suggest, VCu LDH/TiO2has the potential to augment ethylene production through this process. The developed electrocatalyst may be utilized for the fabrication of electrodes at a larger scale and CO2 electrolyzers. The findings of this work suggest that ethylene can be produced at a larger scale via the electrochemical conversion of CO2, which may be an effective strategy to achieve net zero carbon as per the Paris Agreement on climate change.Author contributions
Sneha S. Lavate: methodology, investigation, validation, and writing – original draft. Rohit Srivastava: conceptualization, reviewing, supervision, and funding acquisition.Data availability
The data supporting this article have been included as part of the ESI.†Conflicts of interest
There are no conflicts to declare.Acknowledgements
This research work was funded by United States-India Science and Technology Endowment Fund (USISTEF) (Grant No.: USISTEF/IG-STAGE-I/019/2022). Sneha S. Lavate and Rohit Srivastava would like to thank the Department of Petroleum Engineering, School of Energy Technology, Pandit Deendayal Energy University, for providing infrastructure and facilities.References
- D. Higgins, C. Hahn, C. Xiang, T. F. Jaramillo and A. Z. Weber, ACS Energy Lett., 2018, 4, 317 CrossRef.
- L. Yuan, S. Zeng, X. Zhang, X. Ji and S. Zhang, Mater. Rep.: Energy, 2023, 3, 100177 CAS.
- S. K. Ray, R. Dahal, M. D. Ashie and B. P. Bastakoti, Sci. Rep., 2024, 14, 1 CrossRef PubMed.
- S. K. Ray, R. Dahal, M. D. Ashie, G. Pathiraja and B. P. Bastakoti, Catal. Sci. Technol., 2024, 14, 4479–4486 RSC.
- H. Rabiee, L. Ge, X. Zhang, S. Hu, M. Li and Z. Yuan, Energy Environ. Sci., 2021, 14, 1959 RSC.
- W. Lv, J. Zhou, J. Bei, R. Zhang, L. Wang, Q. Xu and W. Wang, Appl. Surf. Sci., 2017, 393, 191 CrossRef CAS.
- P. Li, J. Bi, J. Liu, Q. Zhu, C. Chen, X. Sun, J. Zhang and B. Han, Nat. Commun., 2022, 13, 1 Search PubMed.
- J. Cai, Q. Zhao, W. Y. Hsu, C. Choi, Y. Liu, J. M. P. Martirez, C. Chen, J. Huang, E. A. Carter and Y. Huang, J. Am. Chem. Soc., 2023, 145, 9136 CrossRef CAS PubMed.
- H. Chen, Z. Wang, X. Wei, S. Liu, P. Guo, P. Han, H. Wang, J. Zhang, X. Lu and B. Wei, Appl. Surf. Sci., 2021, 544, 148965 CrossRef CAS.
- D. Karapinar, C. E. Creissen, J. G. Rivera De La Cruz, M. W. Schreiber and M. Fontecave, ACS Energy Lett., 2021, 6, 694 CrossRef CAS.
- R. Srivastava, Nano-Catalysts for Energy Applications, CRC Press, Taylor & Francis Group, 2021 Search PubMed.
- P. Singh and R. Srivastava, J. CO2 Util., 2021, 53, 101748 CrossRef CAS.
- Y. Wang, J. Liu and G. Zheng, Adv. Mater., 2021, 33, 2005798 CrossRef CAS.
- W. Zhou, K. Cheng, J. Kang, C. Zhou, V. Subramanian, Q. Zhang and Y. Wang, Chem. Soc. Rev., 2019, 48, 3193 RSC.
- Z. Zhang, L. Bian, H. Tian, Y. Liu, Y. Bando, Y. Yamauchi and Z. Wang, Small, 2022, 18, 2107450 CrossRef CAS PubMed.
- J. Qu, X. Cao, L. Gao, J. Li, L. Li, Y. Xie, Y. Zhao, J. Zhang, M. Wu and H. Liu, Electrochemical Carbon Dioxide Reduction to Ethylene: From Mechanistic Understanding to Catalyst Surface Engineering, 2023 Search PubMed.
- J. Yu, J. Wang, Y. Ma, J. Zhou, Y. Wang, P. Lu, J. Yin, R. Ye, Z. Zhu and Z. Fan, Adv. Funct. Mater., 2021, 31, 2102151 CrossRef CAS.
- L. Fan, C. Xia, F. Yang, J. Wang, H. Wang and Y. Lu, Sci. Adv., 2020, 6, eaay3111 CrossRef CAS PubMed.
- G. Wang, J. Chen, Y. Ding, P. Cai, L. Yi, Y. Li, C. Tu, Y. Hou, Z. Wen and L. Dai, Chem. Soc. Rev., 2021, 50, 4993 RSC.
- P. Su, W. Xu, Y. Qiu, T. Zhang, X. Li and H. Zhang, ChemSusChem, 2018, 11, 848 CrossRef CAS PubMed.
- D. Gao, R. M. Arán-Ais, H. S. Jeon and B. Roldan Cuenya, Nat. Catal., 2019, 2, 198 CrossRef CAS.
- K. Zhao, F. Liu, C. Niu, W. Xu, Y. Dong, L. Zhang, S. Xie, M. Yan, Q. Wei, D. Zhao and L. Mai, Adv. Sci., 2015, 2, 1 Search PubMed.
- J. M. Gonçalves, M. Ireno Da Silva, L. Angnes and K. Araki, J. Mater. Chem. A, 2020, 8, 2171 RSC.
- O. Monfort and P. Petrisková, Processes, 2021, 9, 1 RSC.
- A. Anzai, M.-H. Liu, K. Ura, T. G. Noguchi, A. Yoshizawa, K. Kato, T. Sugiyama and M. Yamauchi, Catalysts, 2022, 12, 478 CrossRef CAS.
- Q. Yang, X. Liu, W. Peng, Y. Zhao, Z. Liu, M. Peng, Y. R. Lu, T. S. Chan, X. Xu and Y. Tan, J. Mater. Chem. A, 2021, 9, 3044 RSC.
- G. K. Ramesha, J. F. Brennecke and P. V. Kamat, ACS Catal., 2014, 4, 3249 CrossRef CAS.
- H. He, P. Zapol and L. A. Curtiss, J. Phys. Chem. C, 2010, 114, 21474 CrossRef CAS.
- L. Mohapatra, K. M. Parida and K. Parida, J. Mater. Chem. A, 2016, 4, 10744–10766 RSC.
- S. Lokesh and R. Srivastava, Energy Fuels, 2022, 36, 13417 CrossRef CAS.
- S. Lokesh and R. Srivastava, Int. J. Hydrogen Energy, 2023, 48, 35 CrossRef CAS.
- S. Kawamura, M. C. Puscasu, Y. Yoshida, Y. Izumi and G. Carja, Appl. Catal., A, 2015, 504, 238 CrossRef CAS.
- R. Gao, J. Zhu and D. Yan, Nanoscale, 2021, 13, 13593 RSC.
- Z. Guo, W. Ye, X. Fang, J. Wan, Y. Ye, Y. Dong, D. Cao and D. Yan, Inorg. Chem. Front., 2019, 6, 687–693 RSC.
- A. L. Johnston, E. Lester, O. Williams and R. L. Gomes, J. Environ. Chem. Eng., 2021, 9, 105197 CrossRef CAS.
- D. Panchal, A. Sharma, P. Mondal, O. Prakash and S. Pal, Appl. Surf. Sci., 2021, 553, 149577 CrossRef CAS.
- Y. Zhao, H. Lin, M. Chen and D. Yan, Ind. Eng. Chem. Res., 2014, 53, 3140 CrossRef CAS.
- S. Guru, S. Kumar, S. Bellamkonda and R. R. Gangavarapu, Int. J. Hydrogen Energy, 2021, 46, 16414 CrossRef CAS.
- S. S. Lavate and R. Srivastava, ChemSusChem, 2024, e202400774 CrossRef PubMed.
- C. Wang, M. Cao, P. Wang, Y. Ao, J. Hou and J. Qian, Appl. Catal., A, 2014, 473, 83 CrossRef CAS.
- L. Wang, X. Gao, Y. Cheng, X. Zhang, G. Wang, Q. Zhang and J. Su, J. Photochem. Photobiol., A, 2019, 369, 44 CrossRef CAS.
- Z. Zhang, L. Bian, H. Tian, Y. Liu, Y. Bando, Y. Yamauchi and Z. L. Wang, Small, 2022, 18, 2107450 CrossRef CAS PubMed.
- J. Li, Z. Wang, C. McCallum, Y. Xu, F. Li, Y. Wang, C. M. Gabardo, C.-T. Dinh, T.-T. Zhuang and L. Wang, Nat. Catal., 2019, 2, 1124 CrossRef CAS.
- C. M. Gunathunge, V. J. Ovalle, Y. Li, M. J. Janik and M. M. Waegele, ACS Catal., 2018, 8, 7507 CrossRef CAS.
- E. Pérez-Gallent, M. C. Figueiredo, F. Calle-Vallejo and M. T. M. Koper, Angew. Chem., Int. Ed., 2017, 56, 3621 CrossRef PubMed.
- C. Choi, S. Kwon, T. Cheng, M. Xu, P. Tieu, C. Lee, J. Cai, H. M. Lee, X. Pan and X. Duan, Nat. Catal., 2020, 3, 804 CrossRef CAS.
- Y. Zhou, F. Che, M. Liu, C. Zou, Z. Liang, P. De Luna, H. Yuan, J. Li, Z. Wang and H. Xie, Nat. Chem., 2018, 10, 974 CrossRef CAS PubMed.
- F. Li, A. Thevenon, A. Rosas-Hernández, Z. Wang, Y. Li, C. M. Gabardo, A. Ozden, C. T. Dinh, J. Li and Y. Wang, Nature, 2020, 577, 509 CrossRef CAS PubMed.
- T.-C. Chou, C.-C. Chang, H.-L. Yu, W.-Y. Yu, C.-L. Dong, J.-J. Velasco-Vélez, C.-H. Chuang, L.-C. Chen, J.-F. Lee and J.-M. Chen, J. Am. Chem. Soc., 2020, 142, 2857 CrossRef CAS PubMed.
- S. Nitopi, E. Bertheussen, S. B. Scott, X. Liu, A. K. Engstfeld, S. Horch, B. Seger, I. E. L. Stephens, K. Chan and C. Hahn, Chem. Rev., 2019, 119, 7610 CrossRef CAS PubMed.
- S. Xie, W. Ma, X. Wu, H. Zhang, Q. Zhang, Y. Wang and Y. Wang, Energy Environ. Sci., 2021, 14, 37 RSC.
- A. A. Peterson, F. Abild-Pedersen, F. Studt, J. Rossmeisl and J. K. Nørskov, Energy Environ. Sci., 2010, 3, 1311 RSC.
- X. Sun, Q. Zhu, X. Kang, H. Liu, Q. Qian, J. Ma, Z. Zhang, G. Yang and B. Han, Green Chem., 2017, 19, 2086 RSC.
- H. Xiao, T. Cheng, W. A. Goddard III and R. Sundararaman, J. Am. Chem. Soc., 2016, 138, 483 CrossRef CAS PubMed.
- X. Nie, M. R. Esopi, M. J. Janik and A. Asthagiri, Angew. Chem., Int. Ed., 2013, 52, 2459–2462 CrossRef CAS PubMed.
- S. Ma, M. Sadakiyo, R. Luo, M. Heima, M. Yamauchi and P. J. A. Kenis, J. Power Sources, 2016, 301, 219 CrossRef CAS.
- C. Genovese, C. Ampelli, S. Perathoner and G. Centi, Green Chem., 2017, 19, 2406 RSC.
- Z. Wang, Y. Li, X. Zhao, S. Chen, Q. Nian, X. Luo, J. Fan, D. Ruan, B. Q. Xiong and X. Ren, J. Am. Chem. Soc., 2023, 145, 6339 CrossRef CAS PubMed.
- W. Ma, S. Xie, T. Liu, Q. Fan, J. Ye, F. Sun, Z. Jiang, Q. Zhang, J. Cheng and Y. Wang, Nat. Catal., 2020, 3, 478 CrossRef CAS.
- C. Reller, R. Krause, E. Volkova, B. Schmid, S. Neubauer, A. Rucki, M. Schuster and G. Schmid, Adv. Energy Mater., 2017, 7, 1602114 CrossRef.
- T. T. H. Hoang, S. Verma, S. Ma, T. T. Fister, J. Timoshenko, A. I. Frenkel, P. J. A. Kenis and A. A. Gewirth, J. Am. Chem. Soc., 2018, 140, 5791 CrossRef CAS PubMed.
- X. Chen, J. Chen, N. M. Alghoraibi, D. A. Henckel, R. Zhang, U. O. Nwabara, K. E. Madsen, P. J. A. Kenis, S. C. Zimmerman and A. A. Gewirth, Nat. Catal., 2021, 4, 20 CrossRef CAS.
- Q. Li, W. Zhu, J. Fu, H. Zhang, G. Wu and S. Sun, Nano Energy, 2016, 24, 1 CrossRef CAS.
- Y. Feng, Z. Li, H. Liu, C. Dong, J. Wang, S. A. Kulinich and X. Du, Langmuir, 2018, 34, 13544 CrossRef CAS PubMed.
- B. Chen, L. Gong, N. Li, H. Pan, Y. Liu, K. Wang and J. Jiang, Adv. Funct. Mater., 2024, 34, 2310029 CrossRef CAS.
- J. Yuan, J. J. Zhang, M. P. Yang, W. J. Meng, H. Wang and J. X. Lu, Catalysts, 2018, 8, 171 CrossRef CAS.
- X. Chen, J. Chen, N. M. Alghoraibi, D. A. Henckel, R. Zhang, U. O. Nwabara, K. E. Madsen, P. J. A. Kenis, S. C. Zimmerman and A. A. Gewirth, Nat. Catal., 2021, 4, 20 CrossRef CAS.
- M. H. Suliman, H. Al Naji and M. Usman, Electrochim. Acta, 2024, 500, 144723 CrossRef CAS.
- Y. N. Xu, W. Li, H. Q. Fu, X. Y. Zhang, J. Y. Zhao, X. Wu, H. Y. Yuan, M. Zhu, S. Dai and P. F. Liu, Angew. Chem., 2023, 135, e202217296 CrossRef.
- Y. Cao, Z. Chen, P. Li, A. Ozden, P. Ou, W. Ni, J. Abed, E. Shirzadi, J. Zhang, D. Sinton, J. Ge and E. H. Sargent, Nat. Commun., 2023, 14, 2387 CrossRef CAS PubMed.
Footnote |
| † Electronic supplementary information (ESI) available: ICP-OES, electrode preparation, TOF calculations, FESEM, XRD and gas chromatography data. See DOI: https://doi.org/10.1039/d4ya00417e |
| This journal is © The Royal Society of Chemistry 2024 |


