Ti-based MOF nanosheets as a mass spectrometry imaging matrix for low molecular weight compounds to reveal the spatiotemporal content changes of hepatotoxic components during the processing of Polygonum multiflorum†
Feng-yan
Kuang‡
a,
De-jun
Hu‡
b,
Lu
Wang
 a,
Fei
Chen
*c and
Guang-ping
Lv
*a
aSchool of Food Science and Pharmaceutical Engineering, Nanjing Normal University, Nanjing 210023, P. R. China. E-mail: guangpinglyu@njnu.edu.cn
bDepartment of Food Quality and Safety/National R&D Center for Chinese Herbal Medicine Processing, College of Engineering, China Pharmaceutical University, Nanjing, Jiangsu 211198, China
cJiangsu Engineering and Technology Research Center for Industrialization of Microbial Resources, Jiangsu Key Laboratory for Pathogens and Ecosystems, School of Life Sciences, Nanjing Normal University, Nanjing 210023, China. E-mail: chenfei@njnu.edu.cn
First published on 21st October 2024
Abstract
The selection of the matrix is crucial for matrix assisted laser desorption ionization mass spectrometry imaging (MALDI-MSI). This work successfully synthesized metal–organic framework (MOF) matrices to address the limitations on the application of traditional organic matrices in the study of small molecule compositions, and Ti-based MOF nanosheets were screened as matrices for imaging the hepatotoxic components of Polygonum multiflorum. Comparison between six MOF materials and traditional organic matrices showed that Ti-based MOF nanosheets have less background interference, significant stability, and high salt resistance. The imaging results indicated that the main components of Polygonum multiflorum, free anthraquinone and stilbene glycoside have unique spatial distribution characteristics. Successful application of the synthesized Ti-based MOF nanosheets in mass spectrometry imaging improved the detection ability of mass spectrometry imaging in the small molecule field, and spatiotemporal content changes of hepatotoxic components in Polygonum multiflorum during the steaming process were observed, providing a scientific basis for steaming.
1. Introduction
As a soft ionization analysis technique, MALDI-MS has the advantages of fast analysis, wide quality detection range, and high throughput. It has been applied in the imaging of endogenous metabolites in animals and plants, the screening of biomarkers, pesticide residue detection, clinical analysis, and other fields. MALDI-MSI has demonstrated excellent performance in analyzing biological macromolecules such as proteins and peptides,1 typically using the organic matrices 2,5-dihydroxybenzoic acid (DHB) and cyano-4-hydroxycinnamic acid (CHCA). However, these organic matrices generate a large number of background interference peaks in the detection area of small molecules, which affects the normal analysis of small molecules. To solve this problem, a variety of new low-background inorganic matrices have been developed. Metal materials including Au,2 Ag,3 Pd,4 and Te5 have been used as matrices for analyzing glucose, fatty acids, amino acids, and nucleoside groups. Metal oxides such as TiO2 NPs6 have been used to analyze endogenous low molecular weight metabolites in mouse brain. Silicon- and carbon-based nanoparticles such as Si NPs,7 Si pillars,8 N-doped graphene,9 and N-doped C dots10 have been used to analyze nilotinib and arginine. The advantage of these materials is that they generate very little background signal. However, compared to traditional matrices, these inorganic matrices have low dispersibility in solution and have a poor co-crystallization effect with the analyte, resulting in relatively low sensitivity and reproducibility. Therefore, it is necessary to explore new matrices with high signal-to-noise ratios, reproducibility, and stability for MALDI-MSI analysis of small molecules.11MOFs can be uniformly dispersed in solution due to their π–π stacking structure, and their large surface area also helps them absorb the energy of ultraviolet laser radiation, thereby promoting desorption/ionization of analytes. In previous studies, Fe3O4@ZIF-8 MNC12 was used as a MALDL-MS substrate for the analysis of amino acids, ZIF-8 showed excellent chemical and thermal stability, while iron oxide was commonly used as an inorganic substrate due to its strong ionization effect. Ti-based MOF nanosheets13 serve as a matrix for analyzing oligosaccharides and glucose, and titanium metal can provide strong ultraviolet absorption, while two-dimensional nanosheets, due to their large surface area, will also produce more stable signals during ionization. MIL-101(Cr)14 has been developed as a matrix for the analysis of quercetin due to its high specific surface area, macropores, coordination of unsaturated chromium sites (CUS), and excellent chemical and thermal stability. UiO-66-PDC, UiO-66-(OH)2,15 and UiO-66-GA16 are used as matrices for analyzing oligosaccharides, amino acids, nucleosides, and polyphenols. Among them, zirconium based MOFs have excellent water resistance, acid resistance, and thermal stability. In addition, these three ligands have structures similar to those of traditional organic substrates such as 2-pyridine carboxylic acid (PA) and 2,5-dihydroxybenzoic acid (DHB), and have strong UV visible absorption ability. Although the above MOFs initially showed effectiveness in MALDI-MS, they have not been developed for MALDI-MSI.
P. multiflorum has been widely used as a nourishing medicine in traditional Chinese medicine clinical practice since ancient times, with the application basis of medicinal and dietary homology. However, in recent years, the number of reports on the hepatotoxicity of P. multiflorum has gradually increased; the National Center for Adverse Drug Reaction Monitoring has received reports of adverse reactions related to P. multiflorum and some related preparations, ranking it near the top in the category of traditional Chinese medicine, with most cases being liver injury. As a result, P. multiflorum has become one of the most concerning Chinese herbal medicines with regard to liver injury, and significant progress has been made in the study of traditional Chinese medicine induced liver injury, including P. multiflorum, in terms of both epidemiology and molecular mechanisms. The existing toxicity research results indicate that the toxicity of P. multiflorum may be related to anthraquinone components, especially emodin.17,18 Studies have shown that steaming can significantly reduce liver toxicity.19 However, the spatiotemporal dynamic distribution of hepatotoxic components during steaming is not yet known and mass spectrometry imaging can precisely achieve this. Therefore, exploring the distribution and trend of changes of hepatotoxic components such as emodin using mass spectrometry imaging can provide a basis for the quality control of P. multiflorum processing.
In this study, six MOFs were synthesized with different metal clusters and ligands as matrices to ionize free anthraquinone, including Fe3O4@ZIF-8 MNCs, Ti-based MOF nanosheets, MIL-101(Cr), UiO-66-PDC, UiO-66-(OH)2 and UiO-66-GA. By comparing background noise, ionization intensity, stability, and salt resistance, Ti-based MOF nanosheets exhibit excellent performance. Therefore, they was chosen as a matrix for imaging P. multiflorum in negative ion reflection mode to observe the spatiotemporal changes of liver toxic components during the steaming process of P. multiflorum. Compared with traditional liquid chromatography, this not only simplifies the operation but also achieves in situ visualization of liver toxic components.
2. Experimental section
2.1. Materials and reagents
N,N-Diethylformamide (DEF), 2,5-dihydroxyterephthalic acid (H4DOBDC), N,N-dimethylformamide (DMF), ferric chloride hexahydrate (FeCl3·6H2O), titanium isopropoxide, isopropanol, sodium acetate, ethylene glycol, zinc nitrate (Zn(NO3)2·6H2O), 2-methylimidazole (HMeIM), zirconium chloride (ZrCl4), sodium citrate dehydrate (Na3Cit·2H2O), 1,4-benzenedicarboxylic acid (BDC), 2,5-pyridinedicarboxylic acid (PDC), gallic acid (GA), 2,5-dihydroxyterephthalic acid (DHT), chromium nitrate nonahydrate (Cr(NO3)3·9H2O), 2-hydroxyterephthalic acid (H2BDC), emodin, physcion, chrysophanol, methanol (MeOH), ethanol (EtOH), and acetonitrile (ACN) were purchased from Macklin (Shanghai, China). 2,5-Dihydroxybenzoic acid (DHB) and cyano-4-hydroxycinnamic acid (CHCA) were purchased from Sigma-Aldrich (Shanghai, China). Fresh P. multiflorum was collected from mountainous areas in Guizhou, China, and stored at −80 °C until use.2.2. Preparation of Ti-based MOF nanosheets
H4DOBDC (0.95 g, 5 mmol) and DEF (3 mL) were added to a 25 mL polytetrafluoroethylene (PTFE) autoclave and stirred at room temperature for 5 minutes; then, isopropoxytitanium (0.35 mL, 1.16 mmol) was added, and the resulting mixture was sealed and heated in an oven at 200 °C for 20 hours. The product was allowed to cool down to room temperature, and the dark red solid was collected by centrifugation and washed several times with DMF and methanol. Finally, it was placed in a vacuum oven and dried at 120 °C for 24 hours.50 mg of Ti-based MOF was added to 50 ml of isopropanol and sonicated for 48 hours. The resulting mixture was centrifuged at 3000 rpm for 5 minutes, and then the collected supernatant was further centrifuged at 12![[thin space (1/6-em)]](https://www.rsc.org/images/entities/char_2009.gif) 000 rpm for 20 minutes. The precipitate was dried overnight at 50 °C to obtain Ti-based MOF nanosheets.
000 rpm for 20 minutes. The precipitate was dried overnight at 50 °C to obtain Ti-based MOF nanosheets.
The detailed synthesis information for Fe3O4@ZIF-8 MNCs, UiO-66-PDC, UiO-66-(OH)2, UiO-66-GA, and MIL-101(Cr) is provided in the ESI.†
2.3. Characterization of the Ti-based MOF nanosheets
Scanning electron microscopy (SEM) images of the Ti-based MOF nanosheets were captured using a high-resolution scanning electron microscope (Apreo 2S, USA). The X-ray diffraction (XRD) spectra were obtained in an X-ray powder diffractometer (D/max 2500/PC target conversion, Japan). The UV absorption spectra were collected using a UV-vis spectrophotometer (Cary 5000, USA).2.4. Matrix preparation for MALDI-TOF-MS
To compare the performance of different MOF materials as matrices for MALDI-MS, the matrices of Fe3O4@ZIF-8 MNCs (2 mg mL−1, EtOH![[thin space (1/6-em)]](https://www.rsc.org/images/entities/char_2009.gif) :
:![[thin space (1/6-em)]](https://www.rsc.org/images/entities/char_2009.gif) H2O, 1
H2O, 1![[thin space (1/6-em)]](https://www.rsc.org/images/entities/char_2009.gif) :
:![[thin space (1/6-em)]](https://www.rsc.org/images/entities/char_2009.gif) 1, v/v), Ti-based MOF nanosheets (1 mg mL−1, EtOH
1, v/v), Ti-based MOF nanosheets (1 mg mL−1, EtOH![[thin space (1/6-em)]](https://www.rsc.org/images/entities/char_2009.gif) :
:![[thin space (1/6-em)]](https://www.rsc.org/images/entities/char_2009.gif) H2O, 1
H2O, 1![[thin space (1/6-em)]](https://www.rsc.org/images/entities/char_2009.gif) :
:![[thin space (1/6-em)]](https://www.rsc.org/images/entities/char_2009.gif) 1, v/v), UiO-66-PDC (5 mg mL−1, ACN
1, v/v), UiO-66-PDC (5 mg mL−1, ACN![[thin space (1/6-em)]](https://www.rsc.org/images/entities/char_2009.gif) :
:![[thin space (1/6-em)]](https://www.rsc.org/images/entities/char_2009.gif) H2O, 1
H2O, 1![[thin space (1/6-em)]](https://www.rsc.org/images/entities/char_2009.gif) :
:![[thin space (1/6-em)]](https://www.rsc.org/images/entities/char_2009.gif) 1, v/v), UiO-66-(OH)2 (5 mg mL−1, ACN
1, v/v), UiO-66-(OH)2 (5 mg mL−1, ACN![[thin space (1/6-em)]](https://www.rsc.org/images/entities/char_2009.gif) :
:![[thin space (1/6-em)]](https://www.rsc.org/images/entities/char_2009.gif) H2O, 1
H2O, 1![[thin space (1/6-em)]](https://www.rsc.org/images/entities/char_2009.gif) :
:![[thin space (1/6-em)]](https://www.rsc.org/images/entities/char_2009.gif) 1, v/v), UiO-66-GA (3 mg mL−1, EtOH
1, v/v), UiO-66-GA (3 mg mL−1, EtOH![[thin space (1/6-em)]](https://www.rsc.org/images/entities/char_2009.gif) :
:![[thin space (1/6-em)]](https://www.rsc.org/images/entities/char_2009.gif) H2O, 1
H2O, 1![[thin space (1/6-em)]](https://www.rsc.org/images/entities/char_2009.gif) :
:![[thin space (1/6-em)]](https://www.rsc.org/images/entities/char_2009.gif) 1, v/v), and MIL-101(Cr) (5 mg mL−1, H2O) were sonicated for 10 min to form a matrix suspension. The CHCA matrix (10 mg mL−1, ACN
1, v/v), and MIL-101(Cr) (5 mg mL−1, H2O) were sonicated for 10 min to form a matrix suspension. The CHCA matrix (10 mg mL−1, ACN![[thin space (1/6-em)]](https://www.rsc.org/images/entities/char_2009.gif) :
:![[thin space (1/6-em)]](https://www.rsc.org/images/entities/char_2009.gif) H2O, 1
H2O, 1![[thin space (1/6-em)]](https://www.rsc.org/images/entities/char_2009.gif) :
:![[thin space (1/6-em)]](https://www.rsc.org/images/entities/char_2009.gif) 1, v/v), DHB matrix (30 mg mL−1, MeOH
1, v/v), DHB matrix (30 mg mL−1, MeOH![[thin space (1/6-em)]](https://www.rsc.org/images/entities/char_2009.gif) :
:![[thin space (1/6-em)]](https://www.rsc.org/images/entities/char_2009.gif) H2O, 1
H2O, 1![[thin space (1/6-em)]](https://www.rsc.org/images/entities/char_2009.gif) :
:![[thin space (1/6-em)]](https://www.rsc.org/images/entities/char_2009.gif) 1, v/v), emodin standard solution (50 μg mL−1, MeOH), physcion (50 μg mL−1, MeOH), chrysophanol standard solution (50 μg mL−1, MeOH) and rhein standard solution (50 μg mL−1, MeOH) were prepared. 1 μL of the analyte solution was sedimented onto an MTP AnchorChip 384 plate, and then 1 μL of the matrix suspension was deposited, blown repeatedly, mixed thoroughly, air-dried and tested.
1, v/v), emodin standard solution (50 μg mL−1, MeOH), physcion (50 μg mL−1, MeOH), chrysophanol standard solution (50 μg mL−1, MeOH) and rhein standard solution (50 μg mL−1, MeOH) were prepared. 1 μL of the analyte solution was sedimented onto an MTP AnchorChip 384 plate, and then 1 μL of the matrix suspension was deposited, blown repeatedly, mixed thoroughly, air-dried and tested.
2.5. Sample preparation for MALDI-MSI
The root of P. multiflorum was cut into triangular shapes of equal size and steamed for different times then fixed on a sample plate with deionized water; a freeze slicer (3050S, Leica, Germany) was used to obtain 18 μm thick P. multiflorum slices at −20 °C. They were stuck onto ITO conductive glass slides. Before spraying the matrix, the tissue slices were dehydrated in a vacuum dryer for 10 minutes, and then the Ti-based MOF nanosheet solution was uniformly deposited on the glass slides with slices using a gas-assisted electric sprayer. The parameters were as follows: gas flow rate, 5 mL min−1; syringe volume, 1 mL; and matrix flow rate, 20 μL min−1.2.6. MALDI-MS and -MSI experiments
MALDI-MS and MALDI-MSI were conducted on a MALDI-TOF/TOF-MS (Bruker Daltonics, USA) equipped with frequency doubling solid-state lasers (Nd:YAG 355 nm). In negative ion mode, the m/z range is 80–1000. A single scan spectrum includes 100 cumulative laser shots at a frequency of 1 kHz, with the laser focus set to “small” and a laser power of 70%. MALDI images of P. multiflorum tissue were collected at a spatial resolution of 200 μm. Data were analyzed using flexAnalysis 3.4 and flexImaging 4.1 (Bruker Daltonics, USA).2.7. HPLC experiments
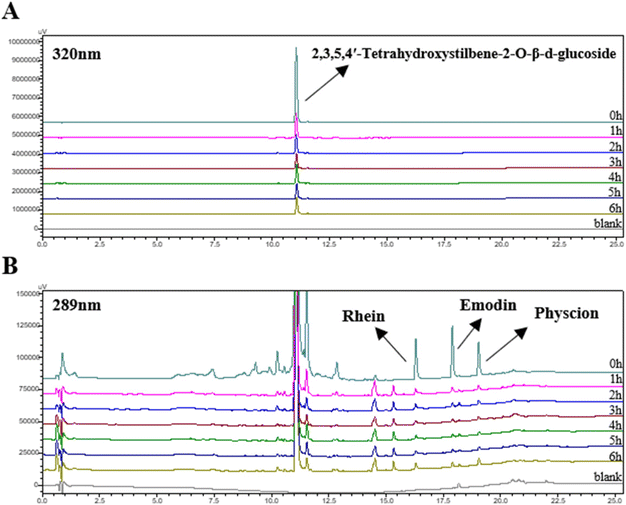
To verify the MALDI-MSI results, an HPLC-UV method was also developed. 1 g of P. multiflorum powder was weighed and soaked in 10 mL of ethanol, after which the resulting mixture was refluxed and extracted at 100 °C for 60 minutes; then, it was centrifuged at 25 °C and 8000 rpm for 5 min, and the supernatant was collected and the residue was extracted twice under the same conditions. The three extracts were combined and stored at −20 °C before use.17All the supernatants were filtered through a 0.22 μm organic filter membrane and injected into a Shimadzu LC-40D system (Shimadzu Technology Co., Ltd, Japan). A BEH C18 column (50 mm × 2.1 mm i.d., 1.7 μm) was used for separation at 40 °C. The mobile phase consisted of (A) ultrapure water and (B) acetonitrile. The gradient was as follows: 0–5 min, 5% B; 5–20 min, 5–100% B; 20–25 min, 100% B. The flow rate was 0.2 mL min−1 and the sample injection volume was 1 μL. The analytes were simultaneously monitored at 289 nm (rhein, emodin, and physcion) and 320 nm (2,3,5,4′-tetrahydroxystilbene-2-O-β-D-glucopyranoside).
3. Results and discussion
3.1. Characterization of MOF materials
The dissolved state of MOFs is shown in Fig. 1A, and the six MOFs have good dispersibility. Nowadays, the main laser source of most MALDI-MS instruments operates at a wavelength of 355 nm. According to the reports, a matrix with good strong light absorption at this wavelength can strongly enhance the ionization of the analyte.20 As shown in Fig. 1B, Ti-based MOF nanosheets show the highest absorption intensity at a wavelength of 355 nm in six matrices, which means that they may have the best ionization efficiency. The obtained Ti-based MOF nanosheets were further characterized through SEM, showing sizes of 10 μm and layered structures (Fig. 1C).21 The XRD patterns shown in Fig. 1D confirm the successful synthesis of Ti-based MOFs according to previous studies.22–24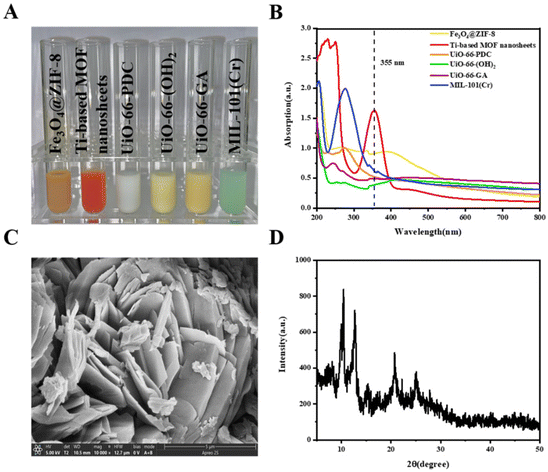 | ||
| Fig. 1 Synthesis and characterization of MOFs. (A) Material synthesis. (B) UV-vis. (C) SEM. (D) XRD. | ||
3.2. Comparison with metal–organic frameworks (MOFs) and conventional matrices for MALDI-MS
In order to compare the ionization performance of anthraquinone compounds, which are the main bioactive components in P. multiflorum, between MOFs and traditional MALDI matrices, traditional CHCA and DHB matrices and six stable metal–organic frameworks were compared, including Fe3O4@ZIF-8, Ti-based MOF nanosheets, UiO-66-PDC, UiO-66-(OH)2, UiO-66-GA and MIL-101(Cr).In the positive-ion reflector mode, the traditional organic matrix CHCA has significant matrix background interference in the low molecular weight region, while DHB also accompanies a small amount of interference in the range of 100–400 Da. In MOF matrices except for Fe3O4@ZIF-8, the background interference is relatively small, especially for UiO-66-PDC, UiO-66-GA and MIL-101(Cr), as shown in Fig. 2A. Compared with the positive-ion reflector mode, the background interference in the negative-ion reflector mode is usually significantly reduced. From the mass spectrometry analysis, it can be seen that the background of five MOFs (Ti-based MOF nanosheets, UiO-66-PDC, UiO-66-(OH)2, UiO-66-GA, and MIL-101(Cr)) is very clean (Fig. 2B) in negative-ion reflector mode, reflecting the advantages of MOFs as matrices in low background interference.
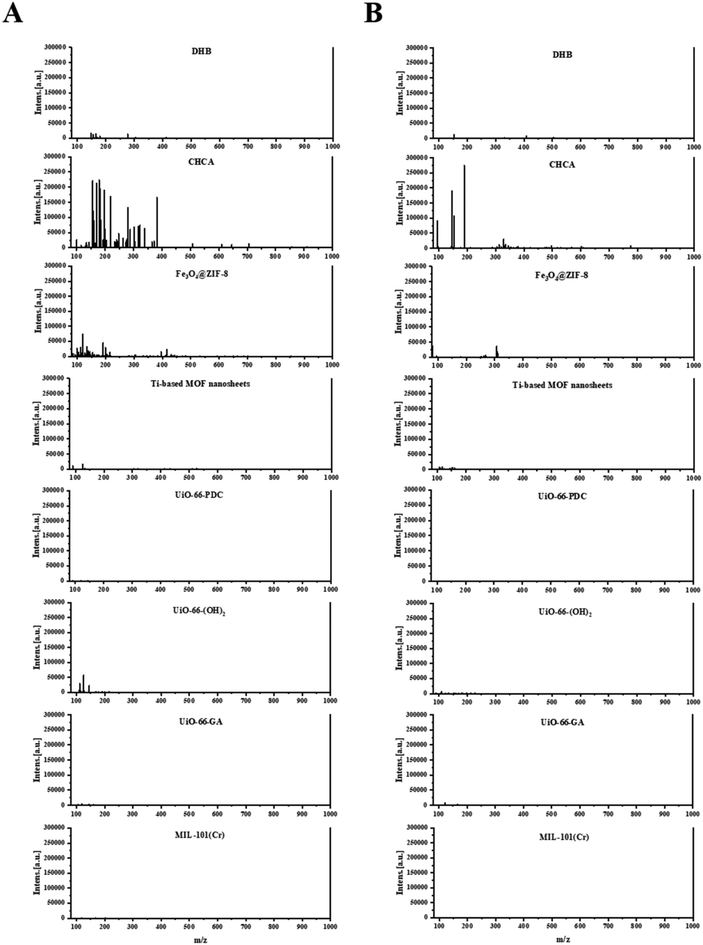 | ||
| Fig. 2 Comparison of background noise in positive- and negative-ion reflector modes. (A) Positive-ion reflector mode. (B) Negative-ion reflector mode. | ||
Due to the dominant role of emodin in the hepatotoxic components of P. multiflorum, emodin was selected to further compare the performance of different matrices. As shown in Fig. 3A and Table S1,† in positive-ion reflector mode, DHB and CHCA exhibited characteristic peaks in the form of [M + Na]+, accompanied by many interference peaks, and the signal-to-noise ratio was very low. Fe3O4@ZIF-8, Ti-based MOF nanosheets, and UiO-66-(OH)2 all exhibited characteristic peaks in the form of [M + H]+, which improved the signal-to-noise ratio compared to other organic matrices. Among them, Ti-based MOF nanosheets had the highest signal-to-noise ratio (Fig. 3A and Table S1†). However, mass spectrometry shows that all three MOF materials are accompanied by other forms of ion fragment interference, especially Fe3O4@ZIF-8. In addition, MIL-101(Cr) produced characteristic peaks in the form of [M + K]+, but the signal-to-noise ratio was lower. UiO-66-PDC and UiO-66-GA did not show the target characteristic peak. This shows that in the positive-ion mode, not only is the addition form complex, but the signal-to-noise ratio is also generally not high. When using the negative-ion mode, the situation is improved, as shown in Fig. 3B and Table S1.† All eight matrices exhibit characteristic peaks in the form of [M − H]−, and the signal-to-noise ratio is generally improved. The order of signal-to-noise ratio from high to low is Ti-based MOF nanosheets > Fe3O4@ZIF-8 > UiO-66-GA > UiO-66-(OH)2 > UiO-66-PDC > CHCA > DHB > MIL-101(Cr). From this, it can be seen that the negative-ion mode is more suitable for ionizing emodin, and the MOF matrices show their advantages as matrices for MALDI-MS.
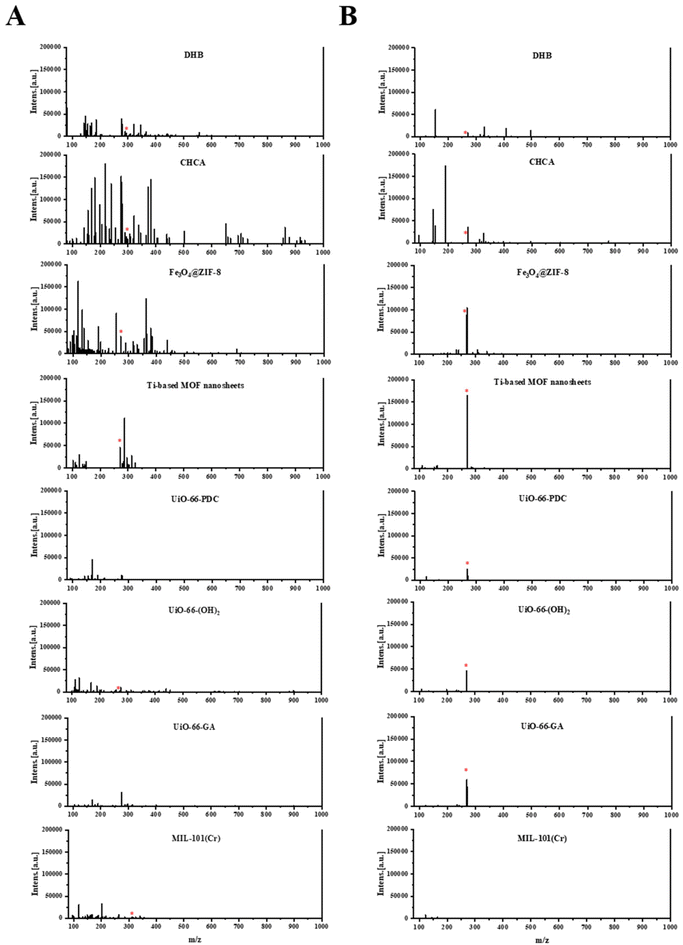 | ||
| Fig. 3 Ionization efficiency of different matrices in emodin in positive- and negative-ion reflector modes. (A) Positive-ion reflector mode. (B) Negative-ion reflector mode. | ||
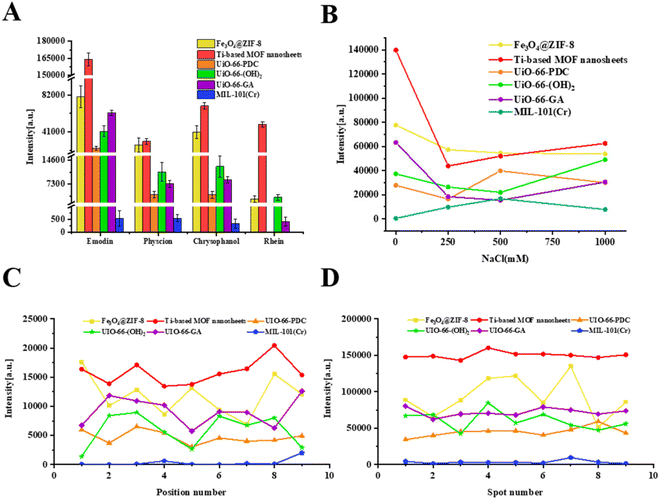
In order to verify whether the MOF matrices are equally effective for other anthraquinone components in P. multiflorum, the ionization effects of the other three target compounds with different MOF matrices were also investigated, and the results are shown in Fig. 4A (physcion), B (chrysophanol), and C (rhein). In addition to generating characteristic peaks at m/z 283.095 ([M − H]−), physcion also generated characteristic peaks at m/z 269.045 ([M − CH3 − H]−), which is due to the demethylation and conversion of physcion into emodin during the ionization process (Fig. 4A). The results show that Ti-based MOF nanosheets can also achieve the highest ionization intensity when ionizing other free anthraquinones (Fig. 5A), and the signal-to-noise ratio is also significantly higher than those for other MOF materials (Table S1†).
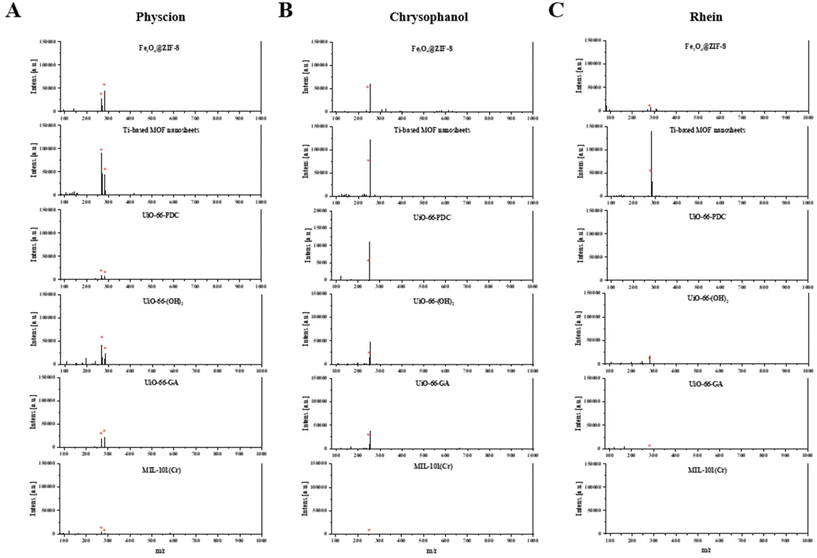 | ||
| Fig. 4 Ionization efficiency of different MOF matrices on free anthraquinone in negative-ion reflector mode. (A) Physcion. (B) Chrysophanol. (C) Rhein. | ||
3.3. Evaluation of salt resistance and signal reproducibility
When conducting MALDI-MSI analysis on real samples, it is necessary to consider the problem of a high concentration of salt, which usually reduces ionization efficiency and leads to signal suppression.25 In this study, a series of NaCl solutions (0 mM, 250 mM, 500 mM, and 1000 mM) containing emodin mixtures were prepared to simulate the environment of real samples.26 As shown in Fig. 5B, when the NaCl concentration increased to 250 mM, except for MIL-101(Cr), the signal intensity obtained by the other five MOFs decreased to varying degrees compared to the initial value. Although the signal intensity of Ti-based MOF nanosheets initially decreased significantly, the signal suppression was alleviated as the salt concentration continued to increase, and the highest ionization intensity was still maintained at a salt concentration of 1000 mM. Compared to other studies with 50% signal attenuation at a 500 mM salt concentration, the salt tolerance is satisfactory,27 indicating that Ti-based MOF nanosheet matrices can withstand high concentrations of salt and are suitable for real sample analysis and tissue imaging.The intra-point stability is obtained by accumulating one signal at different positions within a single point (Fig. 5C), while the inter-point stability signal is obtained through 9 parallel points, with each point accumulating nine signals (Fig. 5D). The coefficients of variation (CV) of signal intensity at different positions within a single point or parallel points obtained from Ti-based MOF nanosheets are 13.70% and 3.13%, respectively, not only lower than the values for the other five MOF materials (Table S2†) but also at the same level compared to inorganic matrices developed in other research studies, such as heteroatom-doped graphene quantum dots.26 This comparison confirms the good distribution uniformity and MS signal reproducibility of Ti-based MOF nanosheets, which indicate that Ti-based MOF nanosheets are promising as matrices for MALDI-MSI.
3.4. Spatial distribution of small molecules in P. multiflorum at different steaming times
As the root system of P. multiflorum grows, it forms some unique morphological features inside, including rings composed of vascular bundles and normal phloem parenchyma at the center of vascular bundles.28,29 In this study, a whole root of P. multiflorum was cut into chunks and steamed with water in a steamer for 0–6 hours. The steaming method is based on the general rule 0213 of the Chinese Pharmacopoeia 2020, that is, steam until the inside and outside are brown, but the specific times are not specified. When P. multiflorum is steamed, the color of the cortex and anomalous vascular bundle areas gradually deepen and darken, and the texture of P. multiflorum gradually becomes soft, as shown in Fig. 6A. However, methods such as liquid chromatography require pre-treatment steps such as pulverization, extraction, long-time HPLC analysis, etc. Moreover, component changes corresponding to color changes in each region cannot be detected in situ. Therefore, the advantages of mass spectrometry imaging appear to be particularly important.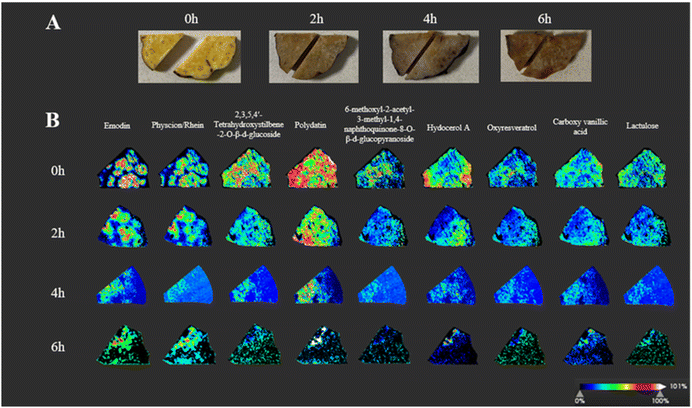 | ||
| Fig. 6 MALDI-MSI of P. multiflorum at different steaming times. (A) Photos of cross-sections of analyzed sections of P. multiflorum at different steaming times. (B) MALDI-MS images. | ||
By comparing the six MOF materials with the traditional organic matrix, the Ti-based MOF nanosheets showed the characteristics of low background interference, good stability and high salt tolerance, so we chosed the ultimately screened Ti-based MOF nanosheets as the imaging matrix, most of the main components were imaged in the slices of P. multiflorum, including three free anthraquinones, three stilbene glycosides, lactulose, vanillic acid, and hydocerol A.30Fig. 6B shows the spatial distribution changes of these 10 components and their relative abundances in the slices at different steaming times. These components are emodin ([M − H]−, m/z 269.045), physcion ([M − H]−, m/z 283.095), rhein ([M − H]−, m/z 283.024), 2,3,5,4′-tetrahydroxystilbene-2-O-β-D-glucoside ([M − H]−, m/z 405.119), polydatin ([M − H]−, m/z 389.125), oxyresveratrol ([M − H]−, m/z 243.066), 6-methoxyl-2-acetyl-3-methyl-1,4-naphthoquinone-8-O-β-D-glucopyranoside ([M − H]−, m/z 421.111), hydocerol A ([M − H]−, m/z 191.018), carboxy vanillic acid ([M − H]−, m/z 211.023), and lactulose ([M − H]−, m/z 341.109).30,31
The images of 0 h in Fig. 6B showed the mass spectra of 10 components in the unsteamed slices of P. multiflorum, with abundant content of free anthraquinone and stilbene glycosides, and distinct distribution characteristics. Emodin is dominant in free anthraquinone, with the highest abundance, mainly distributed in the abnormal vascular bundle area, and almost non-existent in the cortex area;32 the other two anthraquinone components, physion and rhein, also have similar distribution patterns. In contrast, stilbene glycosides, hydocerol A, oxyresveratrol, lactulose, and carboxylvanillic acid are mainly distributed in the cortex area, and the content of abnormal vascular bundle areas is relatively low; it is worth noting that the content of polydatin is particularly rich.
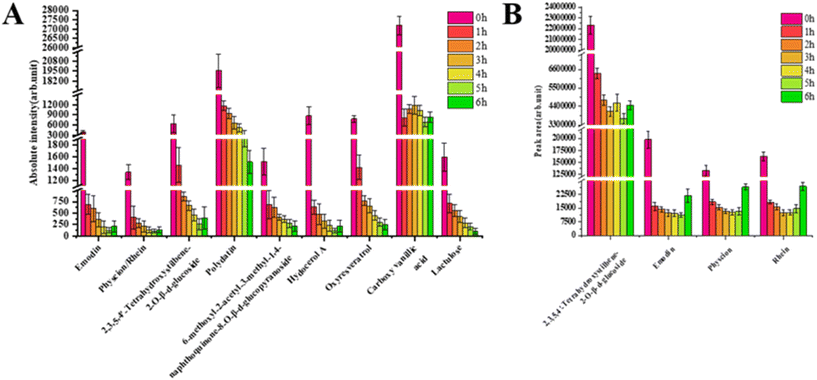
After two hours of steaming, the components in P. multiflorum began to show significant changes. Emodin, physcion, and rhein gradually detached from the anomalous vascular bundle area and invaded the cortical area. The specific distribution of stilbene glycosides, hydocerol A, and oxyresveratrol in the cortex area also became less obvious. Both anthraquinone and stilbene glycosides showed a sharp decrease in their contents after two hours of steaming, as shown in Fig. 7A. In addition, it can be clearly observed through MS images that the contents of other types of compounds are also significantly decreasing.
When the steaming time reached 4 hours, the abundance of each component still showed a downward trend. The delocalization phenomenon became increasingly severe, at which time the free anthraquinone almost completely moved from the vascular bundle area to the cortex area, and there was a phenomenon of component accumulation.
As the steaming time reached 6 hours, the contents of various components showed a new trend. The abundance of free anthraquinone gradually increased, which is closely related to the transition from bound anthraquinone to free anthraquinone during the steaming process, such as emodin 8-O-β-glucoside and physion 8-O-β-D-glucoside undergoing hydrolysis reactions to produce emodin and physcion, respectively.33 The content of hydropero A also began to increase, while the contents of stilbene glycosides, oxyresveratrol, lactose, and carboxylvanillic acid continued to show a downward trend. From this, it can be seen that 4 h is the time point for the change of free anthraquinone, and after 4 h, the content will begin to increase. Due to the fact that anthraquinone is the main hepatotoxic component, a 4-hour steaming time can significantly reduce the liver toxicity of P. multiflorum. If further toxicity reduction is desired, based on the MALDI-MSI in situ spatial distribution results, the cortical area can be appropriately cut off after steaming.
We also conducted HPLC analysis on P. multiflorum with different steaming times and compared the results with those for MALDI-MSI. Fig. 7B shows the peak areas of the main free anthraquinone and 2,3,5,4′-tetrahydroxystilbene-2-O-β-D-glucoside in P. multiflorum at different steaming times. The trend of their content changes is basically consistent with the absolute intensity of MALDI-MSI, and the chromatogram is shown in Fig. 8. However, due to their high polarity, components such as polydatin, carboxylvanillic acid, and lactulose may be eluted before stilbene glycoside, making it difficult to achieve separation and resulting in a failure to identify these components by high-performance liquid chromatography.17 MALDI-MSI can directly achieve in situ qualitative analysis without chromatographic separation, which has advantages in the detection time and detection range.
4. Conclusion
In this work, we synthesized six types of MOFs as MALDI matrices and compared them with organic matrices. Among them, Ti-based MOF nanosheets were ultimately selected as the imaging matrix for P. multiflorum due to their clean background, excellent stability, salt resistance, and ionization efficiency. The imaging results showed the unique spatial distribution of free anthraquinone, stilbene glycosides, phenols, and other components, as well as the spatiotemporal content changes of hepatotoxic components during the steaming process, which can provide a theoretical basis for the detoxification processing of P. multiflorum. The excellent performance indicates that Ti-based MOF nanosheets can serve as an effective inorganic matrix for the spatial localization of various small molecules in plant tissues.Author contributions
Fengyan Kuang: conceptualization, methodology, data curation, investigation, writing – original draft and writing – review & editing. Dejun Hu: data curation, investigation, and writing – review & editing. Wang Lu: conceptualization, methodology and formal analysis. Fei Chen: conceptualization and supervision. Guangping Lv: conceptualization, supervision, and funding acquisition.Data availability
The datasets used and analysed during the current study are available from the corresponding author on reasonable request.Conflicts of interest
There are no conflicts to declare.Acknowledgements
The study was supported by grants from Major Natural Science Research Projects of Colleges and Universities in Jiangsu Province (22KJA360010) and the Postgraduate Research & Practice Innovation Program of Jiangsu Province (no. 181200003023339).References
- B. S. R. Claes, K. K. Krestensen, G. Yagnik, A. Grgic, C. Kuik, M. J. Lim, K. J. Rothschild, M. Vandenbosch and R. M. A. Heeren, Anal. Chem., 2023, 95, 2329–2338 CrossRef CAS PubMed.
- C.-W. Tsao and Z.-J. Yang, ACS Appl. Mater. Interfaces, 2015, 7, 22630–22637 CrossRef CAS PubMed.
- J. Niziol, W. Rode, Z. Zielinski and T. Ruman, Int. J. Mass Spectrom., 2013, 335, 22–32 CrossRef CAS.
- Y. E. Silina, M. Koch and D. A. Volmer, J. Mass Spectrom., 2015, 50, 578–585 CrossRef CAS.
- Y.-S. Chen, J. Ding, X.-M. He, J. Xu and Y.-Q. Feng, Microchim. Acta, 2018, 185, 368 CrossRef PubMed.
- K. Shrivas, T. Hayasaka, Y. Sugiura and M. Setou, Anal. Chem., 2011, 83, 7283–7289 CrossRef CAS PubMed.
- H. Z. Alhmoud, T. M. Guinan, R. Elnathan, H. Kobus and N. H. Voelcker, Analyst, 2014, 139, 5999–6009 RSC.
- Q. Zhu, F. Teng, Z. Wang, Y. Wang and N. Lu, Anal. Bioanal. Chem., 2019, 411, 1135–1142 CrossRef CAS PubMed.
- Q. Min, X. Zhang, X. Chen, S. Li and J.-J. Zhu, Anal. Chem., 2014, 86, 9122–9130 CrossRef CAS.
- S. Maleki, D. Lee, Y. Kim and J. Kim, Int. J. Mass Spectrom., 2019, 442, 44–50 CrossRef CAS.
- S. Wang, H. Niu, T. Zeng, X. Zhang, D. Cao and Y. Cai, Microporous Mesoporous Mater., 2017, 239, 390–395 CrossRef CAS.
- Z. Lin, W. Bian, J. Zheng and Z. Cai, Chem. Commun., 2015, 51, 8785–8788 RSC.
- Y.-J. Chang, S.-S. Yang, X. Yu, H. Zhang, W. Shang and Z.-Y. Gu, Anal. Chim. Acta, 2018, 1032, 91–98 CrossRef CAS PubMed.
- G. Han, Q. Zeng, Z. Jiang, T. Xing, C. Huang and Y. Li, Talanta, 2017, 164, 355–361 CrossRef CAS PubMed.
- L. Chen, J. Ou, H. Wang, Z. Liu, M. Ye and H. Zou, ACS Appl. Mater. Interfaces, 2016, 8, 20292–20300 CrossRef CAS PubMed.
- J. Wu, D. Ouyang, Y. He, H. Su, B. Yang, J. Li, Q. Sun, Z. Lin and Z. Cai, ACS Appl. Mater. Interfaces, 2019, 11, 38255–38264 CrossRef CAS PubMed.
- G. P. Lv, L. Z. Meng, D. Q. Han, H. Y. Li, J. Zhao and S. P. Li, J. Pharm. Biomed. Anal., 2015, 109, 105–111 CrossRef CAS.
- Y. Liu, Q. Wang, J. Yang, X. Guo, W. Liu, S. Ma and S. Li, Front. Pharmacol., 2018, 9, 364 CrossRef PubMed.
- X. Wu, X. Chen, Q. Huang, D. Fang, G. Li and G. Zhang, Fitoterapia, 2012, 83, 469–475 CrossRef CAS PubMed.
- R. Sun, W. Tang and B. Li, Appl. Mater. Today, 2022, 26, 101336 CrossRef.
- S.-S. Yang, Y.-J. Chang, H. Zhang, X. Yu, W. Shang, G.-Q. Chen, D. D. Y. Chen and Z.-Y. Gu, Anal. Chem., 2018, 90, 13796–13805 CrossRef CAS.
- J. Gao, J. Miao, P.-Z. Li, W. Y. Teng, L. Yang, Y. Zhao, B. Liu and Q. Zhang, Chem. Commun., 2014, 50, 3786–3788 RSC.
- H. Assi, L. C. P. Perez, G. Mouchaham, F. Ragon, M. Nasalevich, N. Guillou, C. Martineau, H. Chevreau, F. Kapteijn, J. Gascon, P. Fertey, E. Elkaim, C. Serre and T. Devic, Inorg. Chem., 2016, 55, 7192–7199 CrossRef CAS PubMed.
- H. Chun and D. Moon, Cryst. Growth Des., 2017, 17, 2140–2146 CrossRef CAS.
- B. A. Boughton, D. Thinagaran, D. Sarabia, A. Bacic and U. Roessner, Phytochem. Rev., 2016, 15, 445–488 CrossRef CAS PubMed.
- Z. Jin, M. Liu, X. Huang, X. Zhang, Z. Qu, J.-J. Zhu and Q. Min, Anal. Chem., 2022, 94, 7609–7618 CrossRef CAS PubMed.
- F. Li, M. Wang, J. Zhou, M. Yang and T. Wang, J. Hazard. Mater., 2022, 429, 128055 CrossRef CAS PubMed.
- Z.-T. Liang, Y.-X. Shi, H.-B. Chen and Z.-Z. Zhao, Microsc. Res. Tech., 2011, 74, 488–495 CrossRef CAS PubMed.
- M.-T. Cai, Y. Zhou, W.-L. Ding, Y.-H. Huang, Y.-S. Ren, Z.-Y. Yang, L. Zhang, F. Sun, H.-B. Guo, L.-Y. Zhou, Z.-H. Gong, X.-H. Piao, S.-M. Wang and Y.-W. Ge, Phytochemistry, 2023, 206, 113527 CrossRef CAS.
- Y. Zhao, S. Chu, S. Gui, Y. Qin, R. Xu, T. Shan and H. Peng, J. Pharm. Biomed. Anal., 2021, 200, 114070 CrossRef CAS PubMed.
- J. Niziol, J. Sekula and T. Ruman, Phytochemistry, 2017, 139, 72–80 CrossRef CAS PubMed.
- Z. Liang, T. Sham, G. Yang, L. Yi, H. Chen and Z. Zhao, Anal. Bioanal. Chem., 2013, 405, 4199–4212 CrossRef CAS.
- L. Liang, J. Xu, W.-W. Zhou, E. Brand, H.-B. Chen and Z.-Z. Zhao, Front. Pharmacol., 2018, 9, 934 CrossRef PubMed.
Footnotes |
| † Electronic supplementary information (ESI) available. See DOI: https://doi.org/10.1039/d4an00964a |
| ‡ These authors contributed equally to this work. |
| This journal is © The Royal Society of Chemistry 2025 |

