
 Open Access Article
 This Open Access Article is licensed under a Creative Commons Attribution-Non Commercial 3.0 Unported Licence
A perylene-based fluorescent probe for highly efficient SDS detection†
Amrit
Kaur‡
,
Mina
Bagherifard‡
,
Alissa Brooke
Anderson
 ,
Neelam
Tariq
,
Zois
Syrgiannis
and
Ioannis
Spanopoulos
*
,
Neelam
Tariq
,
Zois
Syrgiannis
and
Ioannis
Spanopoulos
*
Department of Chemistry, University of South Florida, Tampa, Florida 33620, USA. E-mail: spanopoulos@usf.edu
First published on 31st January 2025
Abstract
Sodium dodecyl sulfate (SDS) is widely used in numerous household products and pharmaceuticals due to its excellent water solubility, emulsification, foaming, and dispersing properties. However, the extensive use of SDS has made it a significant environmental pollutant, posing a great threat to aquatic ecosystems. Therefore, developing a rapid, efficient, and sensitive probe for detecting SDS in aqueous environments is crucial. In this study, we present a cationic imidazolium-conjugated perylene bisimide (PBI) compound, as an effective probe for detecting SDS in aqueous media. The probe exhibits a distinct color change from dark pink to light pink upon interaction with SDS, making it a simple yet powerful tool for naked-eye detection. Moreover, the strong electrostatic interaction between the positively charged PBI compound and the negatively charged sulfate group in SDS leads to the formation of closely packed molecular aggregates. This results in significant quenching of fluorescence emission, enabling the detection of SDS at micromolar concentrations. We further demonstrate the practical application of PBI compound for sensitive and selective fluorometric detection of SDS in home-care items and tap water samples. These findings highlight the potential of such compounds as versatile tools for both environmental monitoring and product safety applications involving sulfate-containing species.
1. Introduction
Sodium dodecyl sulfate (SDS), also known as sodium lauryl sulfate (SLS), is one of the most widely used anionic surfactants in various commercial products, including shampoos, cosmetics, pharmaceuticals, and laundry detergents.1 Its popularity stems from its excellent emulsifying properties, water solubility, and ability to disperse particles effectively.2,3 However, because SDS is not biodegradable and can be absorbed by the human body, it is considered an environmental pollutant and potentially toxic to humans, especially at higher concentrations.4–6 For these reasons, accurately monitoring SDS levels is essential for ensuring commercial product safety, preventing environmental pollution, and maintaining compliance with regulatory guidelines.Various techniques are utilized to detect SDS with high selectivity and sensitivity, including mass spectrometry, liquid chromatography, and polyelectrolyte microcapsules (PMC).7–9 However, these methods often involve elaborate sample preparation, expensive equipment, and complex operational procedures. Consequently, utilizing fluorescence probe molecules for these applications has received tremendous attention, as they pose a versatile alternative strategy for facile, highly sensitive, and selective detection. Recently, Ghosh et al.10 reported a zirconium(IV)-based functionalized Metal–Organic Framework (MOF) for the selective detection of SDS; however, the time-consuming sample preparation, emission in the blue region and detection time along with the heavy metal composition limits its potential for widespread use. Shanmugam et al.11 developed a phenanthridinium-based conjugated probe for the detection of SDS; despite the good sensitivity of the probe, the utilization of the organic medium DMSO for sensing purposes limits the commercial potential of the probe. Moreover, various conjugated polymer complexes with nanoparticle or fluorescent dyes have been reported to detect SDS; however, tedious synthesis of the polymers and the requirement of an additional dye or nanoparticle necessary for detection hinder further development and field implementation.12,13 Zhang et al.14 developed a tetraphenylethylene (TPE)-based fluorescent probe for detecting anionic surfactants through aggregation-induced fluorescence enhancement; despite achieving a detection limit of approximately 0.01 μM, the synthesis of this probe is challenging. Other studies, such as those by Chen et al., Feng et al., and Gao et al.,15–17 have explored the use of cationic fluorescent probes for detecting negatively charged species like sulfate groups. However, these approaches often face challenges such as limited detection sensitivity, the use of heavy metals, and complex, multi-step synthesis.
Motivated by the above deficiencies, we designed and synthesized the imidazolium conjugated perylene bisimide (PBI)-based compound 5 as shown in Scheme 1, for the efficient detection of sulfate-containing compounds such as SDS in 99% aqueous media. We point out that this molecule is reported for the first time in literature. Compound 5 is readily synthesized in 90% yield by the N-acylation of 3,4,9,10-perylenetetracarboxylic dianhydride with 4-aminoethyl-imidazole followed by methylation.18–22
 | ||
| Scheme 1 The synthetic route for the acquisition of compound 5. | ||
Compared to literature reports (Table S3, ESI†), the simple and cost-effective synthesis, emission in the visible region, quick response time, and ease of sample preparation for fluorescence studies demonstrate the competitive performance of compound 5 towards SDS detection. To the best of our knowledge, the response time of compound 5 (∼10 s) is among the best reported so far. Notably, PBI-surfactant assemblies have been evaluated previously for the detection of, e.g., metal ions or antibiotics. However, they are less explored for the direct detection of surfactants in home-care products.23,24
The reason for selecting PBI as a probe fluorophore stems from its high photostability, high fluorescence quantum yield, and strong absorption in the visible range.22,25–27 Further, conjugating it with a positively charged N-methylated imidazolium ring allows it to interact with negatively charged surfactants such as SDS via electrostatic interactions.28 Dissolution of compound 5 in aqueous solutions renders the solution pink; however, upon adding SDS, the color fades and gradually becomes colorless. The optical change results from the electrostatic interaction between compound 5 and SDS, leading to the formation of closely packed self-assemblies, thus quenching fluorescence emission and triggering a color change. Compound 5 can efficiently detect SDS up to the micromolar range, while it features high selectivity towards SDS in household items such as detergents, soaps, facewash, shampoo, and tap water.
2. Experimental
2.1. Synthesis and characterization of precursor compound 3 (ref. 21, 29 and 30)
To a well-stirred suspension of perylene-3,4,9,10-tetracarboxylic dianhydride 1 (2.7 mmol) in 80 mL dry dimethylformamide, 1-(3-aminopropyl)imidazole 2 (5.86 mmol) was added slowly dropwise under inert atmosphere (Ar). The resulting reaction mixture was refluxed at 140 °C for 72 h. The resultant red precipitate was filtered off and thoroughly washed with cold water and methanol to yield compound 3 (1.50 g, 93%). As compound 3 has poor solubility in CDCl3, 1H and 13C NMR spectra were obtained only after its methylation.2.2. Synthesis and characterization of compound 5
To a suspension of compound 3 (1 equiv.) in 30 mL dry DMF, methyl iodide (2.5 equiv.) was added dropwise; the resultant mixture was refluxed at 140 °C for 72 h. Following this, the reaction mixture was cooled down, and the resultant solvent was removed under vacuum. The reddish solid was filtered and washed with water and methanol, yielding pure compound 5 (90% yield). The structure of compound 5 was confirmed from its spectroscopic data (Fig. S1–S3, ESI†). The 1H-NMR spectrum of compound 5 exhibited a singlet at 9.19 ppm corresponding to protons of imidazolium ring, two doublets at 8.60 and 8.35 ppm corresponding to aromatic protons, two singlets at 7.87 and 7.79 ppm corresponding to imidazolium protons, a triplet at 4.37 ppm, a broad peak at 4.16 ppm and a broad multiplet at 2.31 ppm corresponding to aliphatic protons, the singlet at 3.93 ppm is corresponding to –CH3 protons. The exact mass of the compound deriving from the molecular formula C38H32N6O42+ corresponds to 636.247 and was confirmed by MALDI-TOF measurements.3. Results and discussion
3.1. Photo-physical properties of compound 5
 | ||
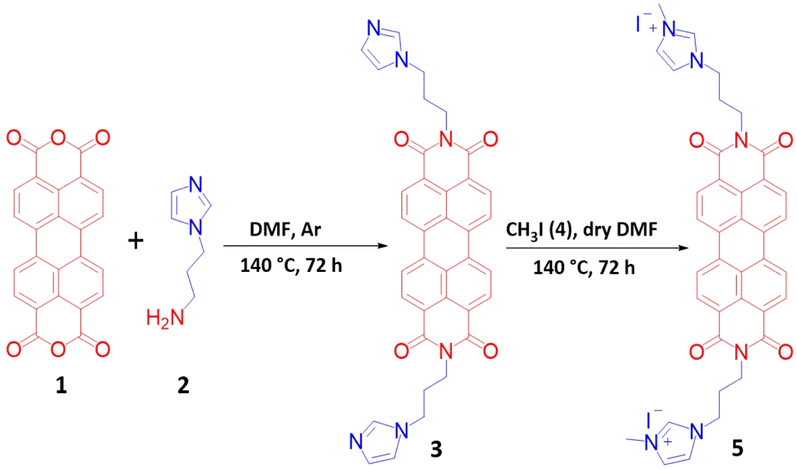
| Fig. 1 (A) The absorption and (B) the fluorescence spectra of compound 5 (10.0 μM) at λex = 490 nm in 0% and 99% H2O in DMSO. | ||
Fluorescence studies show that a DMSO solution of compound 5 (10.0 μM) is highly emissive (ϕf = 12.82%), exhibiting three emission bands at 542, 579, and 630 nm, respectively, when excited at λex = 490 nm. Further, the emission spectrum of compound 5 in 99% volume fraction (fw) of H2O is red shifted (544, 587 and 640 nm) followed by a sharp decrease in emission intensity (ϕf = 4.94%) (Fig. 1B). This reduction in intensity and red shift in the absorbance and emission spectrum in 99% volume of H2O fraction (fw), is due to the strong intermolecular π–π stacking indicating formation of aggregates.35 Further, SEM images of assemblies of compound 5 showcase an aggregate formation (Fig. 2B).
 | ||
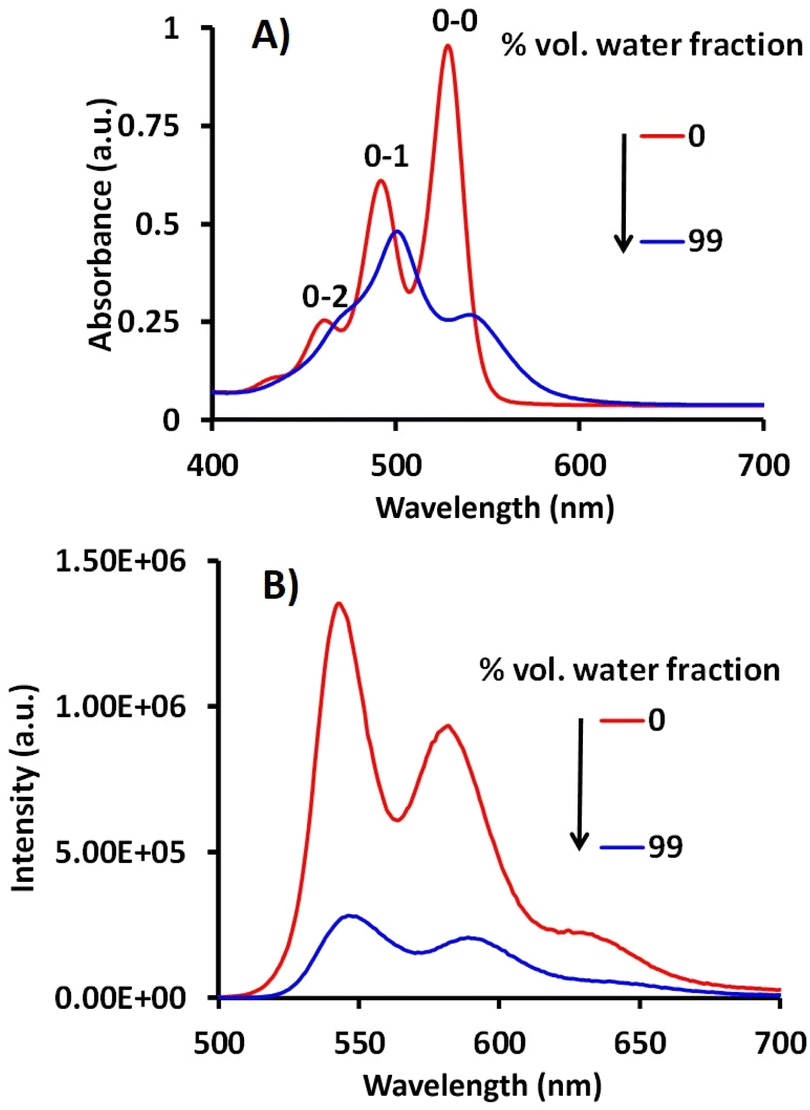
| Fig. 2 (A) The emission spectra of compound 5 (10.0 μM) upon step wise addition of 1.0 mM SDS (0.0–200.0 μL) in 99% H2O in DMSO at λex = 490 nm; inset photograph of compound 5 (i) in absence of SDS (ii) in presence of SDS; SEM images of compound 5 at 50 μm scale (B) in absence of SDS and (C) in presence of SDS in 99% H2O fraction. | ||
Subsequently, we examined the self-assembly behavior of compound 5 in 99% H2O (fw) by observing changes in the absorbance and emission spectra by varying the solution temperature. Upon progressive increase in temperature from 25 °C to 90 °C, the vibronic transitions 0–0 and 0–1 display a hypsochromic shift together with a gradual increment in A0–0/A0–1 value from 0.55 to 0.85 (Fig. S4A, ESI†). On the other hand, with the gradual increase in temperature, the emission spectrum exhibits a significant 8.9-fold increment (Fig. S4B, ESI†). The increase in absorption and emission intensity, accompanied by an increase in the Frank–Condon vibration coupling ratio, indicates that at ambient temperature, the molecule of compound 5 exists in aggregated forms, which tend to disaggregate at higher temperatures.36 Additionally, these observations strongly suggest the occurrence of H-aggregates, in which perylene nuclei stack in a face-to-face fashion along the longitudinal axis of the molecule.37
3.2. Sensing performance of compound 5
As compound 5 is functionalized with perylene bisimide units appended to positively charged N-methylated imidazolium rings, we examined its response toward the anionic surfactant SDS. The UV-vis spectrum of compound 5 (10.0 μM), upon progressive addition of 1.0 mM SDS solution (0.0–200.0 μL) in 99% volume of H2O fraction (fw), displays a broadening of the absorbance band along with the bathochromic shift of the two bands and appearance of leveling of the tail (Fig. S5, ESI†). This indicates surfactant-induced enhanced π–π stacking, thus increasing the tendency of aggregation within the molecules of compound 5.The fluorescence studies of compound 5 in the presence of 1.0 mM SDS solution (0.0–200.0 μL) displayed a strong quenching in emission intensity by 97% (ϕf = 1.18%) (Fig. 2A). This optical change in the presence of SDS was visible to the naked eye as the color of the solution, changed from pink to light pink. According to studies, exposure to a concentration of SDS of more than 1.25 mM is toxic to human health.38 Hence, it is paramount to determine our method's detection limit. Thus, the detection limit of compound 5 for SDS calculated by the standard calibration method was found to be 8.65 × 10⁻⁵ M (86.5 μM), which is low enough to detect SDS in real-world samples (Fig. S6, ESI†).39
Further, to evaluate the selectivity of compound 5 for SDS, we examined the emission response towards various interfering anions (CO32−, SO42−, S2O32−, PO43−, CH3COO−, Cl−, Br−, NO3−, SCN−), metal ions (K+, Na+, Ca2+, Mg2+), cationic surfactant CTAB and neutral surfactant TritonX in 99% H2O volume fraction (fw).40
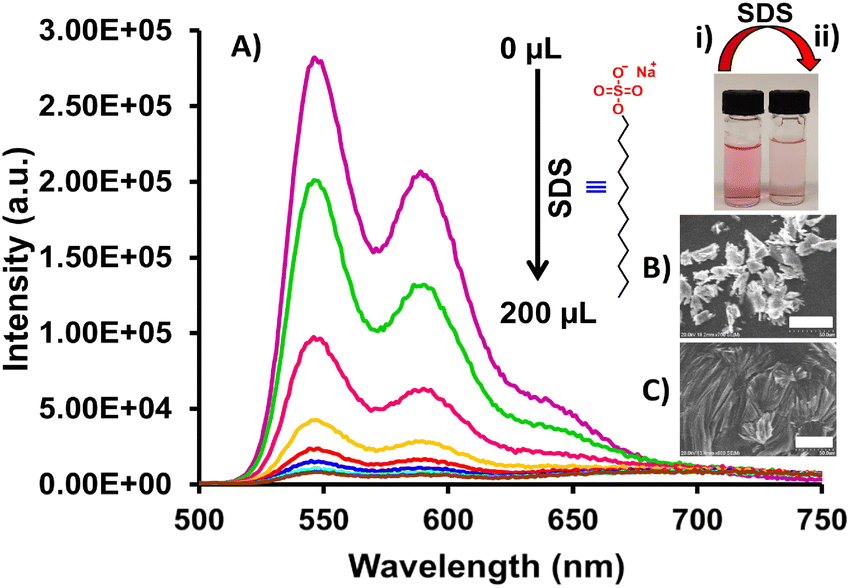
Interestingly, the emission spectrum in the presence of these interfering analytes (0.0–1.0 mM) does not exhibit a significant change, showcasing the minimum impact on the PL spectra of 5. Notably, we also examined the response towards sulfate anions such SO42− and S2O32−. Apparently, only a slight 0.67-fold quenching was observed in the presence of these analytes (Fig. S7, ESI†). Moreover, to illustrate the potential of compound 5 in complex matrices, we carried out a selectivity experiment in the presence of SDS mixed with the corresponding interfering analytes (0.0–1.0 mM) (Fig. 3A). Evidently, no significant change was observed. The above studies demonstrate the high selectivity of compound 5 towards SDS, even in the presence of interfering analytes.
 | ||
Fig. 3 (A) The fluorescence emission response for compound 5 (10.0 μM) in 99% H2O in DMSO in the presence of SDS and various competitive interfering analytes (0.0–1.0 mM) at λex = 490 nm. The red column represents the fluorescence emission of the probe alone; the green columns show the fluorescence emission of each interfering substance added to the probe; and the light pink column represents the fluorescence emission of the probe after adding SDS to each sample containing the specific interfering substances. (B) The 1H-NMR of compound 5 in DMSO-d6![[thin space (1/6-em)]](https://www.rsc.org/images/entities/char_2009.gif) :D2O (9:1, v/v) upon addition of SDS (1.0 mM) dissolved in DMSO-d6:D2O (9:1, v/v) as solvent mixture. (C) The fluorescence response of compound 5 (10.0 μM) in aqueous media, in the presence of various household items that may contain SDS (Table S1, ESI†). :D2O (9:1, v/v) upon addition of SDS (1.0 mM) dissolved in DMSO-d6:D2O (9:1, v/v) as solvent mixture. (C) The fluorescence response of compound 5 (10.0 μM) in aqueous media, in the presence of various household items that may contain SDS (Table S1, ESI†). | ||
3.3. Sensing mechanism
The sensing mechanism for SDS was investigated by zeta potential, scanning electron microscopy (SEM) and 1H-NMR studies. The zeta potential gives the surface charge of the aqueous assemblies of compound 5 and is the key parameter in controlling electrostatic interactions between the probe molecule and the analyte. A solution of compound 5 (10.0 μM) in H2O, exhibited a positively charged zeta potential (ξ) value of +25.7 mV in an aqueous medium (Fig. S8, ESI†). In contrast, the zeta potential of SDS (1.0 mM) was measured to be −42.5 mV under the same conditions (Fig. S9, ESI†). After the addition of SDS to the aqueous solution of compound 5, the zeta potential (ξ) of compound 5-SDS was reduced to −2.40 mV, which suggests that compound 5 interacts with the negatively charged SDS via electrostatic interactions (Fig. S10, ESI†).10,16,41,42 SEM studies of compound 5 in an aqueous medium show segregated aggregates, whereas in the presence of SDS, tend to form closely packed aggregates (Fig. 2B and C).The interaction between compound 5 and SDS was further investigated by 1H-NMR titration carried out in DMSO-d6:D2O (9:1, v/v) solvent mixture (Fig. 3B). Upon adding 1.0 mM of SDS solution (DMSO-d6:D2O, 9:1, v/v) to a compound 5 solution, there is an downfield shift of the imidazolium's protons. This indicates increased deshielding of these protons, which can be explained by the appearance of hydrogen bonds between SDS and imidazolium (∼Δδ = 0.01 ppm).43–45 Conversely, the protons in the perylene core have been up-fielded (Δδ = 0.06 ppm). This is a characteristic protection effect of the aromatic protons upon distancing the aromatic cores of perylenes. The SDS intercalates the molecules, and the higher distance between the perylene cores yields an upfield shift of the specific protons. It can be viewed as a side effect of the electrostatic interaction of the SDS with imidazolium, yielding a higher steric effect and, in such a way, shifting the π–π interactions.46,47 This agrees with the aforementioned reported interaction mechanism between SDS and compound 5.
3.4. Fluorescence lifetime studies in the presence of SDS
We investigated the fluorescence decay life-time of compound 5 in the absence and presence of SDS in 99% H2O fraction (fw) volume using time-resolved fluorescence spectroscopy (Fig. S11, ESI†). The 99% aqueous solution of compound 5 exhibits bi-exponential decay lifetimes with values of 92.86%, τ1 = 4.00 ns and 7.14% τ2 = 7.38 ns. Upon adding SDS, the corresponding lifetimes decrease (12.11%, τ1 = 2.46 ns, 87.84%, τ2 = 4.54 ns). This suggests that the interaction between compound 5 and SDS is dynamic in nature.4. Applications
The methylene blue active substances (MBAS) method is standard for determining anionic surfactants such as SDS in various water sources and samples.48 The method relies on the development of an ion pair between the anionic surfactant SDS and the cationic dye MB, followed by their transportation from the water phase to the organic phase (chloroform). There is a color change once methylene blue is transported to the organic layer. Though this method has gained a lot of attention due to its simplicity, it is a time-consuming, cumbersome procedure, and using the toxic organic solvent chloroform makes it less desirable. On the other hand, our strategy involves utilizing a single phase, while no secondary preparation allows the direct detection of SDS in aqueous media. Based on the above results, we explored our developed probe for the (i) qualitative detection of surfactants in commercial products and (ii) tap water.4.1. Qualitative detection of surfactants in real samples
Based on the excellent sensitivity and selectivity of compound 5 towards SDS, we evaluated the performance of an aqueous solution of compound 5 for the detection of anionic surfactants such as sodium lauryl sulfate (SLS) in 17 commercially available household items: shampoo, hand wash soap, dishwasher soap, surface cleaner, etc. Towards this end, corresponding household samples (0.5 mL) were dissolved in deionized water (15 mL), followed by centrifugation for 90 minutes at 40000 rpm to obtain a clear solution. The emission intensity of the aqueous solution of compound 5 was quenched in the samples containing SDS/SLS, whereas the samples without this surfactant did not show a significant change in emission intensity (Fig. 3C, Table S1, ESI†). This emission change was visible to the naked eye as the pink aqueous solution of compound 5 gradually faded. Despite this performance, a quantitative analysis of these surfactants could not be performed due to the complex matrix of corresponding commercial products.
4.2. Detection of SDS in tap water
The selective response of compound 5 towards SDS, even in the presence of other interfering ions and molecules, was evaluated using tap water. The tap water was diluted 150 times with distilled water; the emission spectrum of compound 5 was recorded, which in the presence of SDS featured a quenching in the sample's emission intensity (Fig. S12, ESI†). Furthermore, to identify the detection performance of compound 5, various concentrations of SDS were added to the tap water solution, followed by a standard calibration procedure to calculate the SDS concentration. As shown in Table S2,† after adding a certain concentration of SDS (0.050 and 0.200 mM) into the tap water, the determined SDS concentrations were found to be 0.045 and 0.200 mM with the recovery percentage ranging from 90 to 100%, coupled by RSD values of 0.005 to 0.021 (n = 5).Taking a step further, we decided to use tap water without dilution. Various concentrations of SDS were added to the tap water and analyzed with an aqueous solution of compound 5 using a standard calibration method (Fig. S13, ESI†).49 As shown in Table 1, after the addition of a specific concentration of SDS (0.080, 0.090, and 0.200 mM) into the tap water, the determined SDS concentrations were found to be 0.073, 0.094, and 0.199 mM, respectively. The addition exhibits an excellent recovery percentage from 91.2 to 99.5%, along with recorded relative standard deviations of 0.47–2.91%, demonstrating the potential of compound 5 to detect SDS in real water samples.
| Sample number | Spike concentration (mM) | Determined concentration (mM) | % RSD (N = 3) | Recovery (%) |
|---|---|---|---|---|
| 1 | 0.080 | 0.073 | 1.28 | 91.2 |
| 2 | 0.090 | 0.094 | 2.91 | 95.7 |
| 3 | 0.200 | 0.199 | 0.47 | 99.5 |
5. Conclusions
This study introduces a novel approach using a cationic imidazolium-conjugated perylene bisimide (PBI) molecule, termed compound 5, designed for sensitive and selective detection of SDS. We point out that this molecule is reported for the first time in literature. The probe exhibits dual functionality, enabling both colorimetric detection through a visible color shift (from pink to light pink) and fluorometric detection via fluorescence quenching, effective at micromolar concentrations. These detection mechanisms are based on the strong electrostatic interactions between the positively charged probe and the negatively charged sulfate groups in SDS, resulting in molecular aggregation and a marked fluorescence quenching effect. The versatility of our method, allowing for naked-eye detection and quantitative analysis with minimal instrumentation, sets it apart as a facile, practical solution for SDS monitoring across diverse applications. Beyond addressing a specific analytical challenge, our work contributes to the broader field of nanoscale materials by demonstrating the versatility of perylene bisimide derivatives as sensitive, sulfate-specific probes. Moreover, the possibility of depositing a water-soluble derivative and using it to detect SDS even in the vapor phase represents an important advancement for developing sensors for food and dairy product quality assessment without sample pre-preparation.Data availability
The data supporting this article have been included as part of the ESI.†Conflicts of interest
The authors declare no competing financial interest.Acknowledgements
We acknowledge financial support from USF start-up funds. We also appreciate the assistance of Dr Chavdar Slavov, and Dr Wayne Guida for providing access to their equipment.Notes and references
- T. Arakawa, T. Niikura, Y. Kita and T. Akuta, Curr. Issues Mol. Biol., 2024, 46, 621–633 CrossRef CAS PubMed.
- M. Choudhary and S. M. Kamil, ACS Omega, 2020, 5, 22891–22900 CrossRef CAS PubMed.
- T. Cserháti, E. Forgács and G. Oros, Environ. Int., 2002, 28, 337–348 CrossRef PubMed.
- Y. Wang, Y. Zhang, X. Li, M. Sun, Z. Wei, Y. Wang, A. Gao, D. Chen, X. Zhao and X. Feng, Sci. Rep., 2015, 5, 10107 CrossRef PubMed.
- S. A. V. Morris, J. R. Bobbitt, K. P. Ananthapadmanabhan and G. B. Kasting, Toxicol. In Vitro, 2021, 77, 105246 CrossRef CAS PubMed.
- C. A. M. Bondi, J. L. Marks, L. B. Wroblewski, H. S. Raatikainen, S. R. Lenox and K. E. Gebhardt, Environ. Health Insights, 2015, 9, 27–32 Search PubMed.
- N. Shende, A. Karale, P. Marathe, S. Chakraborty, A. D. Mallya and R. M. Dhere, Biologicals, 2019, 60, 68–74 CrossRef CAS PubMed.
- C. J. Tereba-Mamani, M. A. Janczuk, M. J. Ruiz-Angel and M. C. García-Alvarez-Coque, J. Chromatogr. A, 2023, 1689, 463740 CrossRef CAS PubMed.
- A. L. Kim, E. V. Musin, A. V. Dubrovskii and S. A. Tikhonenko, Sci. Rep., 2022, 12, 232 CrossRef CAS PubMed.
- S. Ghosh, J. Krishnan, V. Karthik, A. Dhakshinamoorthy and S. Biswas, Inorg. Chem., 2023, 62, 8605–8614 CrossRef CAS PubMed.
- K. Jamuna, A. T. Sebastian, S. Subbiah, N. Selvapalam and S. Shanmugam, J. Surfactants Deterg., 2025, 28, 147–153 CrossRef CAS.
- W. Fu, F. Qu, G. Yu and J. You, Sens. Actuators, B, 2017, 245, 774–779 CrossRef CAS.
- A. H. Malik, F. Habib, M. J. Qazi, M. A. Ganayee, Z. Ahmad and M. A. Yatoo, J. Polym. Res., 2023, 30, 115 CrossRef CAS.
- M. Zhang, Z. Sun, Y. Sun, L. Zhao, R. Yang and L. Qu, Talanta, 2024, 270, 125614 CrossRef CAS PubMed.
- H. Chen, X. Mu, J. Li, Y. Qin and L. Yan, Anal. Methods, 2021, 13, 3292–3296 RSC.
- A. Feng, F. Jiang, G. Huang and P. Liu, Spectrochim. Acta, Part A, 2020, 224, 117446 CrossRef CAS PubMed.
- T. Gao, X. Cao, J. Dong, Y. Liu, W. Lv, C. Li, X. Feng and W. Zeng, Dyes Pigm., 2017, 143, 436–443 CrossRef CAS.
- Y. Jiang, J. Tian, W. Liu, X. Chang, Y. Duan, Z. You, X. Wang and Y. Liu, ACS Appl. Energy Mater., 2024, 7, 2570–2578 CrossRef CAS.
- Y. Zhang, J. Gui, D. Wang, J. Mao, C. Zhang and F. Li, Nanoscale, 2023, 15, 1092–1098 RSC.
- R. Yang, J. Tian, W. Liu, Y. Wang, Z. Chen, T. P. Russell and Y. Liu, Chem. Mater., 2022, 34, 7293–7301 CrossRef CAS.
- F. D'Anna, S. Marullo, G. Lazzara, P. Vitale and R. Noto, Chem.–Eur. J., 2015, 21, 14780–14790 CrossRef PubMed.
- F. Rigodanza, E. Tenori, A. Bonasera, Z. Syrgiannis and M. Prato, Eur. J. Org. Chem., 2015, 2015, 5060–5063 CrossRef CAS.
- A. K. Dwivedi, M. Pandeeswar and T. Govindaraju, ACS Appl. Mater. Interfaces, 2014, 6, 21369–21379 CrossRef CAS PubMed.
- R. Zhang, Z. Yan, Z. Xue, W. Xu, M. Qiao, L. Ding and Y. Fang, Spectrochim. Acta, Part A, 2024, 321, 124735 CrossRef CAS PubMed.
- V. L. Berruyer, A. Perrier and M. Collot, Adv. Opt. Mater., 2024, 2401511 CrossRef CAS.
- S. Bettini, Z. Syrgiannis, M. Ottolini, V. Bonfrate, G. Giancane, L. Valli and M. Prato, Front. Bioeng. Biotechnol., 2020, 8, 1–11 CrossRef PubMed.
- S. Bettini, Z. Syrgiannis, R. Pagano, L. Đorđević, L. Salvatore, M. Prato, G. Giancane and L. Valli, ACS Appl. Mater. Interfaces, 2019, 11, 17079–17089 CrossRef CAS PubMed.
- S. Hussain, A. H. Malik and P. K. Iyer, ACS Appl. Mater. Interfaces, 2015, 7, 3189–3198 CrossRef CAS PubMed.
- E. Marinho, P. R. Figueiredo, R. Araújo and M. F. Proença, RSC Adv., 2024, 14, 11141–11150 RSC.
- J. Cho, C. Keum, S.-G. Lee and S.-Y. Lee, Analyst, 2020, 145, 7312–7319 RSC.
- M. Kar, M. Anas, P. Banerjee, A. Singh, P. Sen and T. K. Mandal, ACS Appl. Polym. Mater., 2022, 4, 3697–3710 CrossRef CAS.
- J. H. Mondal, B. Pramanik, M. N. Shinde, R. Khurana, N. Barooah, A. C. Bhasikuttan, D. Das and J. Mohanty, J. Phys. Chem. C, 2018, 122, 18061–18069 CrossRef CAS.
- C. K. Wong, A. F. Mason, M. H. Stenzel and P. Thordarson, Nat. Commun., 2017, 8, 1240 CrossRef PubMed.
- E. Kozma, G. Grisci, W. Mróz, M. Catellani, A. Eckstein-Andicsovà, K. Pagano and F. Galeotti, Dyes Pigm., 2016, 125, 201–209 CrossRef CAS.
- M. A. Martínez, D. Aranda, E. Ortí, J. Aragó and L. Sánchez, Org. Chem. Front., 2023, 10, 1959–1967 RSC.
- Y. Wang, J. Chen, H. Jiao, Y. Chen, W. Li, Q. Zhang and C. Yu, Chem.–Eur. J., 2013, 19, 12846–12852 CrossRef CAS PubMed.
- C. Huang, S. Barlow and S. R. Marder, J. Org. Chem., 2011, 76, 2386–2407 CrossRef CAS PubMed.
- J. Welch, J. Wallace, A. B. Lansley and C. Roper, Regul. Toxicol. Pharmacol., 2021, 125, 105022 CrossRef CAS PubMed.
- L. Zeng, T. Chen, B. Zhu, S. Koo, Y. Tang, W. Lin, T. D. James and J. S. Kim, Chem. Sci., 2022, 13, 4523–4532 RSC.
- S. Marullo, M. Feroci, R. Noto and F. D'Anna, Dyes Pigm., 2017, 146, 54–65 CrossRef CAS.
- B. White, S. Banerjee, S. O'Brien, N. J. Turro and I. P. Herman, J. Phys. Chem. C, 2007, 111, 13684–13690 CrossRef CAS.
- A. Narula and C. P. Rao, J. Phys. Chem. C, 2019, 123, 21271–21280 CrossRef CAS.
- U. Preiss, C. Jungnickel, J. Thöming, I. Krossing, J. Łuczak, M. Diedenhofen and A. Klamt, Chem.–Eur. J., 2009, 15, 8880–8885 CrossRef CAS PubMed.
- I. M. Umlong and K. Ismail, Colloids Surf., A, 2007, 299, 8–14 CrossRef CAS.
- J. Zhou, S.-K. Dong, Z.-H. He, J.-L. Caesar Puoza and Y.-H. Zhang, Chin. Phys. B, 2019, 28, 017801 CrossRef CAS.
- C. Shao, M. Grüne, M. Stolte and F. Würthner, Chem.–Eur. J., 2012, 18, 13665–13677 CrossRef CAS PubMed.
- Z. Chen, A. Lohr, C. R. Saha-Möller and F. Würthner, Chem. Soc. Rev., 2009, 38, 564–584 RSC.
- L. Cui, M. Puerto, J. L. López-Salinas, S. L. Biswal and G. J. Hirasaki, Anal. Chem., 2014, 86, 11055–11061 CrossRef CAS PubMed.
- A. G. Ryder, C. A. Stedmon, N. Harrit and R. Bro, Pure Appl. Chem., 2017, 89, 1849–1870 CrossRef CAS.
Footnotes |
| † Electronic supplementary information (ESI) available. See DOI: https://doi.org/10.1039/d4ay02122c |
| ‡ These authors contributed equally. |
| This journal is © The Royal Society of Chemistry 2025 |