 Open Access Article
Creative Commons Attribution 3.0 Unported Licence
Manganese electrode for all-solid-state fluoride batteries†
Atsushi
Inoishi
 *ab,
Naoko
Setoguchi
a,
Megumi
Motoyama
a,
Shigeto
Okada
b and
Hikari
Sakaebe
 ab
ab
aInstitute for Materials Chemistry and Engineering, Kyushu University, 6-1 Kasuga-koen, Kasuga 816-8580, Japan. E-mail: inoishi@cm.kyushu-u.ac.jp
bTransdisciplinary Research and Education Center for Green Technology, Kyushu University, 6-1 Kasuga-koen, Kasuga-Shi 816-8580, Japan
First published on 24th December 2024
Abstract
We investigate MnF3 as an electrode material for all-solid-state fluoride batteries. The initial discharge capacity due to defluorination was 535 mA h g−1. Manganese was confirmed to be reduced and oxidized during charge–discharge measurements. Metallic Mn was also reversibly fluorinated and defluorinated as a starting material.
Fluoride batteries have attracted attention as next-generation batteries because of their high chemical stability and high theoretical energy density due to the flexible choice of electrode materials. Fluoride (F−) anions function as charge carriers in fluoride batteries; therefore, various metals are potential candidates for the conversion-type electrodes.1 In addition, there is a wide variety of solid electrolytes, including PbSnF4, BaSnF4, BaCaF4, and tysonite-type and BaF2-based fluorites.1–16 In 2011, A. Reddy et al. reported the first all-solid-state fluoride battery, and since then, there have been many recent reports of all-solid-state fluoride batteries.17–32 We recently reported the application of a FeF3 cathode for fluoride batteries, where a large discharge capacity of 579 mA h g−1 was observed at first discharge.29 In addition, many groups reported CuF2 as a cathode material for fluoride batteries.18,27 As such, transition metal fluorides have been shown to be promising cathode materials for large-capacity batteries. Among the possible electrode materials for fluoride batteries, MnF3 has advantages of a large theoretical capacity (718 mA h g−1) and low cost. The theoretical gravimetric energy density for a full cell composed of a MnF3 cathode and a Mg anode is 1127 W h kg−1, which is comparable with that for a FeF3 cathode. However, in the case of Li+-ion batteries, manganese fluoride shows a large overpotential.28 On the other hand, the following simple reaction may occur in the fluoride battery:
| MnF3 + 3e− ⇌ Mn + 3F− | (1) |
This reaction does not form the LiF insulator, which is typically formed in lithium-conversion type batteries when metal fluorides are used as an electrode material. Therefore, the use of MnF3 as an electrode in fluoride batteries is considered to be reasonable with respect to advantages such as the low cost and large capacity. Here we report all-solid-state fluoride batteries based on a MnF3 electrode with Ba0.6La0.4F2.4 (BLF) used as the electrolyte and a Pb-based counter electrode.
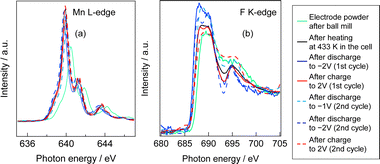
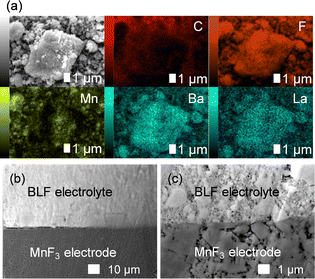
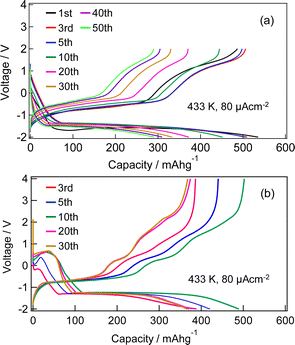
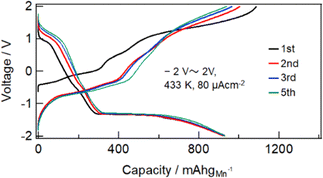
Fig. S1 (ESI†) show SEM images of the MnF3 powder before and after ball-milling. Although the particle size before ball-milling was 100 nm–3 μm, that after mechanical ball-milling at 600 rpm for 12 h was more uniform at 100 nm–1 μm. The crystallinity of the MnF3 powder was significantly decreased after ball-milling (Fig. S2, ESI†). The electrochemical performance was evaluated at 433 K because of the large IR drop in the solid BLF electrolyte at room temperature. Considering high-temperature operation, the chemical stability of MnF3 was evaluated at high temperatures. XRD patterns for MnF3 after heating at various temperatures under Ar are shown in Fig. S3 (ESI†). Peaks assigned to MnF3 were observed up to 433 K; however, MnF3 was decomposed at 473 K and peaks assigned to MnF2 were newly formed. On the other hand, FeF3 is stable even at 473 K, as we previously reported.29 Therefore, FeF3 is more stable than MnF3 at high temperature. Fig. 1(a) shows SEM images of the MnF3-based composite powder (MnF3, BLF, acetylene black(AB)). The primary BLF solid electrolyte particles were smaller than 1 μm and secondary particles were larger than 10 μm, which is good agreement with our previous study.29Fig. 1(b) and (c) show cross-sectional images of the BLF/MnF3 electrode interface after heating at 433 K. Fig. 1(b) shows both a highly connected interface region and a region where separation has occurred. Fig. S4 (ESI†) shows a cross-sectional SEM image of the MnF3 electrode/BLF electrolyte interface after heating at 433 K. The thickness of the MnF3 electrode was 88 μm. Fig. 2(a) shows discharge–charge curves for an all-solid-state fluoride battery with a Pb/PbF2–SnF2–AB/BLF/MnF3–BLF–AB structure between −2 V and 2 V at 433 K (defluorination of MnF3). The initial discharge capacity (starting from defluorination) was 535 mA h g−1, which was 75% of the theoretical capacity for MnF3 (718 mA h g−1). Therefore, 2.2 F− ions were shuttled from the MnF3 electrode during the initial discharge. This indicates that most of the MnF3 is decomposed to MnF2 before discharge. The observed capacity is larger than that reported for BiF3 or CuF2 electrodes at 413 K in an all-solid-state fluoride battery.17,27 However, this is still lower than that for an FeF3 electrode (579 mA h g−1 at first cycle), which was reported in our previous study.29 The observed single potential plateau is in good agreement with the theoretical redox potential for MnF2/Mn (−0.991 vs. PbF2/Pb) and also indicates that the initial state before discharge is mainly MnF2. A discharge capacity of 290 mA h g−1 was retained at the 50th cycle. The open-circuit voltage gradually increased with cycling, which indicates that the oxidation state of manganese is gradually increased, but is mainly charged to the Mn2+ state. Fig. 2(b) shows discharge–charge curves for the all-solid-state fluoride battery with a MnF3 electrode in the range of −2 V to 4 V at 433 K (starting from defluorination). The cell structure is the same as that in Fig. 2(a). Unlike the case for −2 V to 2 V (Fig. 2(a)), a discharge plateau is observed between 0 and 1 V and a charge plateau between 1 and 3 V. The theoretical potentials for the MnF3/MnF2 and MnF2/Mn couples are 1.217 V (vs. PbF2/Pb) and −0.991 V (vs. PbF2/Pb), respectively. The observed potential plateaus are reasonably matched with these theoretical potentials, as shown in Fig. S5 (ESI†), which indicates that manganese is reduced and oxidized. By comparison with Fig. 2(a), oxidation of Mn3+/Mn2+ should occur between 1 V and 2 V, and also above 2 V. The potential and capacity of the Mn3+/Mn2+ region gradually increased with cycling, which may be due to stabilization of the Mn3+ species. The discharge capacity of 489 mA h g−1 at the 10th cycle is larger than that for FeF3 (461 mA h g−1 at the 10th cycle) within the same potential range.29 On the other hand, the hysteresis of the discharge–charge curve was dependent on the voltage range. The voltage difference for the 10th discharge–charge cycle at 350 mA h g−1 (see the point in Fig. S6, ESI†) is 0.945 V between −2 V and 2 V and 0.641 V between −2 V and 4 V. The decrease in overpotential after charging to 4 V may be related to the formation of Mn3+ species; however, this has yet to be verified. On the other hand, the voltage difference for the 10th discharge–charge cycle at 350 mA h g−1 for the FeF3 and MnF3 electrodes are 0.753 V and 0.641 V, respectively. Therefore, the overpotential of the MnF3 electrode is much lower than that of the FeF3 electrode when the voltage range of the charge–discharge measurement is between −2 V and 4 V. The IR drop for the BLF solid electrolyte is 0.06 V during operation (433 K and 80 μA cm−2); therefore, the internal resistance between 2 V and 4 V, excluding the IR drop, is 0.58 V. This is much lower than that for a manganese fluoride electrode for a lithium battery.33 These results suggest that the charge transfer resistance differs significantly depending on the discharge–charge mechanism, although the operating temperature is different. In the case of lithium battery, insulating LiF is formed during conversion reaction. The effect of operating temperature on the all-solid-state fluoride battery with a MnF3 electrode was investigated (Fig. S7, ESI†). The cell was heated once to 433 K, then cooled to each respective temperature for measurement (413 K and 393 K). The initial defluorination capacities at 413 K and 393 K were 215 mAhg−1 defluorination capacities at 413 K and 393 K were 215 mA h g−1 and 41 mA h g−1, respectively, showing a substantial decrease compared to the performance at 433 K. A significant factor contributing to this high resistance is the decreased ionic conductivity of the electrolyte, indicating that applying a solid electrolyte with high conductivity at lower temperatures is essential for reducing the operating temperature. Ex situ XAS measurements were conducted to clarify the discharge–charge mechanism for the MnF3 electrode. Fig. 3(a) and (b) show Mn L-edge and F K-edge X-ray adsorption spectra of the MnF3 electrode before and after the discharge–charge measurements. Peaks associated with L3 and L2 can be observed in this region of the Mn L-edge spectra.34 Following heating of the constructed cell, the XAS peak positions shifted to lower energy. This indicates that MnF3 is decomposed or reacts with the BLF electrolyte or AB in the composite electrode due to the high temperature or high pressure during construction of the cell. Therefore, the MnF3 composite electrode is not sufficiently stable in this structure. The adsorption peak at around 640 eV associated with MnF3 decreased after discharging and was then recovered after charging. Therefore, the Mn-based species is active for the redox reaction. As shown in Fig. S8 (ESI†), The F K-edge XAS spectra for the MnF3 electrode charged at different voltages (yielding MnF3 and MnF2) revealed the formation of Mn3+ by the peak at around 684 V observed after charging to 4 V, which is in contrast to the electrode charged to 2 V (no adsorption due to MnF2 was observed around this region, Fig. S8, ESI†), i.e., Mn3+ is formed only after charging to 4 V. We have reported that the BLF of the solid electrolyte shows two peaks around 689 eV in our previous work.29 In the charged state of manganese fluoride electrode (Fig. 3(b)), contributions from the fluorine in manganese fluoride overlap, so clearly split peaks assigned to BLF electrolyte are not observed. On the other hand, after discharge in the second cycle, the spectrum is very similar to that of BLF, suggesting that metallic Mn is formed. From these results, the changes in the F K-edge spectrum indicate that a reversible redox reaction is occurring between manganese fluoride and metallic manganese. The XRD pattern after charging to 2 V did not indicate any formation of manganese fluoride; the species formed was thus amorphous (Fig. S9, ESI†). Fig. S10 (ESI†) shows SEM images of the MnF3 electrode before and after 58 cycles between −2 V and 2 V. A comparison of these figures indicates that heating at 433 K produced a denser morphology. In addition, the morphology became denser after discharge–charge cycling, which may be due to long-term heating and pressing. EDS maps of the MnF3 electrode after discharge–charge cycling are shown in Fig. S11 (ESI†). The particle size for the active manganese material is ca. 30 μm, which is much larger than that for the pristine material (ca. 1 μm, see Fig. 1). Therefore, degradation of the active electrode material is mainly caused by agglomeration during discharge–charge cycling. When the counter electrode for the full cell is a fluoride, the manganese electrode must accept fluoride ions during the first charge process. Therefore, charge–discharge cycling was also evaluated from the fluorination of metallic Mn. The metallic manganese powder consisted of particles with two different sizes, small (<1 μm) and large (ca. 7 μm) as shown in Fig. S12 (ESI†). Fig. 4 shows discharge–charge curves for the all-solid-state fluoride battery with a metallic Mn electrode between −2 V and 2 V at 433 K. The cell had a Pb/PbF2–SnF2–AB/BLF/Mn–BLF–AB structure. The initial charge capacity (fluorination of the cathode) was 1087 mA h g−1, which was 74% of the theoretical capacity (1463 mA h g−1) for the Mn electrode. The first discharge (fluorination) capacity was 931 mA h g−1, which was 63% of the theoretical capacity. This indicates slightly lower utilization efficiency compared with that starting from defluorination (75%, see Fig. 2(a)), although the difference is not significant. The open-circuit voltage before the initial charge was −0.648 V, which was higher than the theoretical potential for a MnF2/Mn couple (−0.991 V vs. PbF2/Pb). This is considered to be due to the oxidized layer formed on the metallic Mn. The second charge started from around −2 V, which indicates that the oxidized layer was removed during the initial charge and discharge process. This cell was prepared on the same day as the electrode powder. However, after the powder was stored for 11 days in a glovebox, the first defluorination capacity decreased to 690 mA h g−1. This indicates that metallic manganese is highly sensitive and the oxidation layer decreases the reversible capacity. In order to compare the difference in profiles between the cases from the MnF3 and Mn, charge–discharge profiles for all-solid-state fluoride battery with MnF3 electrode and Mn electrode are shown in Fig. S13 (ESI†). During the initial defluorination, starting from Mn, the overall potential is high. This is influenced by the surface oxidation layer. However, from the second fluorination cycle onward, the fluorination curves show a profile similar to that of electrodes starting from MnF3, while only the defluorination curve for the electrode starting from MnF3 showed a short plateau for the Mn3+/Mn2+ redox couple appeared, even though the voltage range was same. This could be due to the lower charge transfer resistance due to the high electrical conductivity of metallic Mn as a starting material. These results suggest that a manganese electrode is a promising active material for both directions, i.e., starting from defluorination or fluorination.
 | ||
| Fig. 3 (a) Mn L-edge and (b) F K-edge XAS spectra of MnF3 electrode obtained from current collector side. | ||
In summary, the electrochemical reversibility of MnF3 and metallic Mn was demonstrated in an all-solid-state fluoride battery. The MnF3 electrode exhibited a defluorination capacity of 535 mA h g−1 during the initial cycle and retained a defluorination capacity of 290 mA h g−1 at the 50th cycle. The XAS results suggested that manganese was reduced and oxidized during the discharge–charge process. Metallic Mn was also reversibly fluorinated and defluorinated. A manganese-based electrode is thus a promising active material for fluoride batteries with a large energy storage capacity.
This article is based on results obtained from a project, JPNP21006, commissioned by the New Energy and Industrial Technology Development Organization (NEDO). The experiments using synchrotron radiation were performed at the BL12 beamline of the SAGA Light Source (Proposal No. 2201156F, 2203014F, 2201149F, 2308043P and 2311080P).
Data availability
The data supporting this article have been included as part of the ESI.†Conflicts of interest
There are no conflicts to declare.Notes and references
- M. Zhang, X. Cao, Y. Hao, H. Wang, J. Pu, B. Chi and Z. Shen, Energy Rev., 2024, 3, 100083 CrossRef.
- R. Kanno, S. Nakamura, K. Ohno and Y. Kawamoto, Mater. Res. Bull., 1991, 26, 1111–1117 CrossRef.
- S. Vilminot, G. Perez, W. Granier and L. Cot, Solid State Ionics, 1981, 2, 91–94 CrossRef.
- Y. Ito, T. Mukoyama and S. Yoshikado, Solid State Ionics, 1995, 80, 317–320 CrossRef CAS.
- L. Liu, L. Yang, M. Liu, X. Li, D. Shao, K. Luo, X. Wang and Z. Luo, J. Alloys Compd., 2020, 819, 152983 CrossRef CAS.
- F. P. Pflügl, V. Epp, S. Nakhal, M. Lerch and M. Wilkening, Phys. Status Solidi C, 2015, 12, 10–14 CrossRef.
- L. Xiong, P. Wen, Y. Zhang, X. Liu, J. Ning, X. Wang, H. Wang and Z. Yang, J. Power Sources, 2022, 518, 230718 CrossRef CAS.
- S. Breuer and M. Wilkening, Dalton Trans., 2018, 47, 4105–4117 RSC.
- L. Zhang, M. A. Reddy and M. Fichtner, Solid State Ionics, 2015, 272, 39–44 CrossRef CAS.
- S. Breuer, S. Lunghammer, A. Kiesl and M. Wilkening, J. Mater. Sci., 2018, 53, 13669–13681 CrossRef CAS.
- J. Chable, B. Dieudonné, M. Body, C. Legein, M. P. Crosnier-Lopez, C. Galven, F. Mauvy, E. Durand, S. Fourcade, D. Sheptyakov, M. Leblanc, V. Maisonneuveb and A. Demourgues, Dalton Trans., 2015, 44, 19625–19635 RSC.
- C. Rongeat, M. A. Reddy, R. Witter and M. Fichtner, ACS Appl. Mater. Interfaces, 2014, 6, 2103–2110 CrossRef CAS.
- B. Dieudonné, J. Chable, M. Body, C. Legein, E. Durand, F. Mauvy, S. Fourcade, M. Leblanc, V. Maisonneuveb and A. Demourgues, Dalton Trans., 2017, 46, 3761–3769 RSC.
- A. Duvel, J. Bednarcik, V. Sepelak and P. Heitjans, J. Phys. Chem. C, 2014, 118, 7117–7119 CrossRef.
- C. Rongeat, M. A. Reddy, R. Witter and M. Fichtner, J. Phys. Chem. C, 2013, 117, 4943–4950 CrossRef CAS.
- N. Matsui, T. Seki, K. Suzuki, M. Hirayama and R. Kanno, ACS Appl. Energy Mater., 2023, 6(22), 11663–11671 CrossRef CAS.
- M. A. Reddy and M. Fichtner, J. Mater. Chem., 2011, 21, 17059–17062 RSC.
- D. T. Thieu, M. H. Fawey, H. Bhatia, T. Diemant, V. S. Chakravadhanula, R. J. Behm, C. Kübel and M. Fichtner, Adv. Funct. Mater., 2017, 27, 1701051 CrossRef.
- C. Rongeat, M. Anji Reddy, Y. Diemant, R. J. Behm and M. Fuchtner, J. Mater. Chem. A, 2014, 2, 20861 RSC.
- O. Clemens, C. Rongeat, M. A. Reddy, A. Giehr, M. Fichtner and H. Hahna, Dalton Trans., 2014, 43, 15771–115778 RSC.
- K. Nakayama, R. Ishikawa, T. Tojigamori, H. Miki, H. Iba, N. Shibata and Y. Ikuhara, J. Mater. Chem. A, 2022, 10, 3743–3749 RSC.
- D. Zhang, K. Yamamoto, Y. Wang, S. Gao, T. Uchiyama, T. Watanabe, T. Takami, T. Matsunaga, K. Nakanishi, H. Miki, H. Iba, K. Amezawa, K. Maeda, H. Kageyama and Y. Uchimoto, Adv. Energy Mater., 2021, 11, 2102285 CrossRef.
- T. Tojigamori, H. Nakajima, H. Miki, N. Matsui, T. Nakatani, S. Fujinami, K. Noi, H. Tsukasaki, K. Suzuki, M. Hirayama, S. Mori, T. Abe and R. Kanno, ACS Appl. Energy Mater., 2022, 5, 1002–1009 CrossRef.
- I. Mohammad, R. Witter, M. Fichtner and M. A. Reddy, ACS Appl. Energy Mater., 2018, 1, 4766–4775 CrossRef.
- K. Nakayama, H. Miki, T. Nakagawa, K. Noi, Y. Sugawara, S. Kobayashi, K. Sakurai, H. Ima, A. Kuwabara, Y. Ikuhara and T. Abe, J. Mater. Chem. A, 2024, 12, 8350–8358 RSC.
- T. Tojigamori, N. Matsui, K. Suzuki, M. Hirayama, T. Abe and R. Kannno, ACS Appl. Energy Mater., 2024, 7, 1100–1108 CrossRef.
- K. Shimoda, Y. Morita, K. Noi, T. Fukunaga, Z. Ogumi and T. Abe, ACS Energy Lett., 2023, 8, 2570–2575 CrossRef.
- Z. L. Cao, K. Yamamoto, T. Matsunaga, M. Kumar, N. Thakur, T. Watanabe, K. Nakanishi, H. Miki, H. Iba, K. Amezawa, H. Kageyama and Y. Uchimoto, ACS Appl. Energy Mater., 2024, 7, 6640–6648 CrossRef.
- A. Inoishi, N. Setoguchi, H. Hori, E. Kobayashi, R. Sakamoto, H. Sakaebe and S. Okada, Adv. Energy Sustainability Res., 2022, 3, 2200131 CrossRef.
- H. Miki, K. Yamamoto, H. Nakaki, T. Yoshinari, K. Nakanishi, S. Nakanishi, H. Iba, J. Miyawaki, Y. Harada, A. Kuwabara, Y. C. Wang, T. Watanabe, T. Matsunaga, K. Maeda, H. Kageyama and Y. Uchimoto, J. Am. Chem. Soc., 2024, 146, 3844–3853 CrossRef PubMed.
- Z. L. Cao, K. Yamamoto, T. Matsunaga, T. Watanabe, M. Kumar, N. Thakur, R. Ohashi, S. Tachibana, H. Miki, K. Ide, H. Iba, H. Kiuchi, Y. Harada, Y. Orikasa and Y. Uchimoto, Chem. Mater., 2024, 36, 1928–1940 CrossRef.
- S. X. Zhang, T. D. Wang, J. Zhang, Y. D. Miao, Q. Yin, Z. L. Wu, Y. J. Wu, Q. Y. Yuan and J. B. Han, ACS Appl. Mater. Interfaces, 2022, 14, 24518–24525 CrossRef CAS.
- K. Rui, Z. Wen, Y. Lu, J. Jin and C. Shen, Adv. Energy Mater., 2015, 5, 1401716 CrossRef.
- M. Kubin, J. Kern, M. Guo, E. Källman, R. Mitzner, V. K. Yachandra, M. Lundberg, J. Yano. and P. Wernet, Phys. Chem. Chem. Phys., 2018, 20, 16817–16827 RSC.
Footnote |
| † Electronic supplementary information (ESI) available. See DOI: https://doi.org/10.1039/d4cc04418e |
| This journal is © The Royal Society of Chemistry 2025 |


![[thin space (1/6-em)]](https://www.rsc.org/images/entities/char_2009.gif) 000× magnification).
000× magnification).
