
 Open Access Article
 This Open Access Article is licensed under a Creative Commons Attribution-Non Commercial 3.0 Unported Licence
Unveiling pseudocapacitance: a kinetic treatment of the pseudocapacitive biosensor†
Rokas Gerulskisa,
Egor Baiarashovab,
Maryam Karimib,
Wassim El Housseiniab and
Shelley D. Minteer *ab
*ab
aDepartment of Chemistry, University of Utah, Salt Lake City, Utah 84112, USA
bKummer Institute Center for Resource Sustainability, Missouri University of Science and Technology, Rolla, Missouri 65409, USA. E-mail: shelley.minteer@mst.edu
First published on 2nd May 2025
Abstract
A kinetic framework is introduced for a pseudocapacitive potentiometric biosensor. Mathematical derivation and kinetic modeling demonstrate that experimentally observed linearity in analyte-OCP response arises from a dynamic equilibrium between competing redox reactions on a single electrode. This system can be expanded to develop a new generation of biosensors.
In 2024, we published a glucose biosensor employing bilirubin oxidase (BOD) from Bacillus subtilis and FAD-dependent glucose dehydrogenase (GDH) from Aspergillus sp., co-immobilized in a dimethylferrocene-functionalized linear polyethylenimine (FcMe2-LPEI) polymer.1 The system demonstrates a linear relationship between open circuit potential (OCP) and the logarithm of glucose concentration (0.28 mM to 102 mM, Fig. 1). In this work, we present an enzyme kinetic model that explains the mechanism observed in this system as relying on BOD-catalyzed pseudocapacitive accumulation of ferrocenium, and provides a framework to understand other bio-pseudocapacitive systems. Our model explains how enzyme turnover rates and mediator dynamics contribute to potential stabilization, enabling rational tuning of biosensor performance. This framework establishes a generalizable design principle for potentiometric biosensors coupling pseudocapacitive charging elements with analyte-responsive counterparts on a single electrode.
 | ||
Fig. 1 OCP was monitored employing the GDH-BOD-FcMe2-LPEI electrode with successive glucose additions from 0.28 mM to 102 mM. (A) Full time-course experiment, (B) extracted OCP values vs. ln(glucose). Line of best fit: OCP = 0.154–0.0252![[thin space (1/6-em)]](https://www.rsc.org/images/entities/char_2009.gif) ln(glucose), R2 = 0.997. ln(glucose), R2 = 0.997. | ||
The individual reactions catalysed by BOD and GDH, respectively, are as follows:
| O2 + 4H+ + 4FcMe2 ⇌ 2H2O + 4FcMe2+ | (1) |
| Glucose + 2FcMe2+ ⇌ Gluconolactone + 2FcMe2 + 2H+ | (2) |
Because both BOD and GDH undergo ping-pong bi–bi mechanisms2,3 their catalytic turnover rates can be modelled by the following kinetic equations:
 | (3) |
 | (4) |
Consider the behaviour of BOD according to eqn (3), bubbling O2, with the majority of FcMe2 in its initial, neutral state. BOD oxidizes M to M+ as an enzyme-catalysed, pseudocapacitive charging current (iBOD = 4FnVBOD), and the FcMe2+/FcMe2 ratio grows until catalysis is slowed when the potential achieved by the polymer fails to provide thermodynamic driving force for electron transfer to BOD.4 The activity ratio of FcMe2+/FcMe2 is monitored experimentally as open circuit potential (OCP) of the electrode vs. SCE (saturated calomel electrode), according to the Nernst equation:
 | (5) |
Monitoring OCP under an argon atmosphere (Fig. 2, red), the OCP grows from −0.036 V vs. SCE to 0.045 V in 30 minutes before returning to a value of −0.0023 V in 9 hours. This gradual variation arises from thermodynamically driven charge equilibration between FcMe2 and the enzyme active sites. This variation may reflect changes in the local distribution and mobility of redox-active FcMe2 and FcMe2+ as a result of swelling, altering their effective concentrations at the electrode interface and modulating OCP as a transient, non-faradaic process. When this electrode is transferred to electrolyte open to atmospheric air, the OCP grows to a value of 0.345 V in 30 minutes, then more slowly to 0.355 V over an additional 30 minutes. This is attributed to BOD-catalysed oxidation of M to M+ in the presence of oxygen according to eqn (3), a faradaic charging process producing a Nernst shift of the FcMe2-LPEI polymer measured here as increasing OCP.4,5 In thermodynamic terms, the upper limit of OCP seen here corresponds to the shifting of the BOD and FcMe2 redox couples towards that of the 4 e− reduction of O2. At this upper limit, the negligible concentrations of reduced BOD and FcMe2 effectively terminate the process of O2 reduction.
 | ||
| Fig. 2 Monitoring the OCP (vs. SCE) of a BOD/GDH/FcMe2-LPEI electrode under argon atmosphere (red), and the same electrode after it is moved to the electrolyte under atmospheric air (blue). | ||
We experimentally demonstrated a linear response of OCP to ln(glucose) for 0.28 mM to 102 mM or ln(glucose) = −8.2 to −2.3, with linear fit OCP = 0.154–0.0252 ln(glucose) (Fig. 1). If we combine this linear fit with eqn (5), a direct relationship between M+/M and glucose can be drawn:
 | (6) |
 | (7) |
The two opposing short-circuit current magnitudes eventually stabilize to a zero net-current value (iBOD = −iGDH) at the sensor's response time (tr). The total charge lost (Δq) over the response time (the difference in current/time integrals) determines the new M+/M ratio, changing the OCP of the system per eqn (5) as follows:
 | (8) |
To develop a kinetic simulation of this system, we start with literature values for KM (0.53–3.21 mM),9 KO2 (34.2 mM),10 KG (3.8 mM),11 and an O2 concentration of 1.3 mM for O2 saturated water at 25 °C.12 Next XBOD and XGDH are approximated from the ratio of enzyme units cast in electrode preparation, 7:1 (a slight modification from the cited 8:1 ratio, based on manufacturer-demonstrated temperature-activity dependence in both enzymes). A KM+ value for GDH has not been published to our knowledge but given the large overpotential between GDH and FcMe2 (−0.5 vs. 0.2 V) and assuming minimal steric or electrostatic interference compared to BOD-FcMe2, we expect KM+ to be 1 to 2 orders of magnitude lower than KM.13,14 While 108 nmol of mediator is cast on the electrode as FcMe2-LPEI polymer, determining the local concentration on the electrode surface, M0, requires experimentally determining the thickness of the pre-swollen polymer. We roughly approximate thickness with a range of unrelated mediating polymer thicknesses in the literature, 6 μm to 200 μm;14,15 thus the 108 nmol of FcMe2 translates to 21.8 mM, or 0.727 mM, respectively.
It is important to recognize that covalent enzyme immobilization often modifies apparent kinetic parameters.16,17 Because the number of enzyme linkages is a function of both crosslinker concentration and total binding sites, it is difficult to vary the concentration of any electrode component without changing the number of covalent linkages within and between the polymer and enzymes, modifying the diffusion coefficient of substrates in the former case, and the kinetic constants of both enzymes in the later. Accordingly, the values discussed above are insufficient to demonstrate linearity in OCP-ln(glucose) response in simulations. The simplest modification to produce linear OCP vs. ln(glucose) is a 50% decrease in XGDH (for R2 > 0.99, Fig. 3B), to an XBOD:XGDH ratio of 14:1. This may arise from the immobilization process inducing flavin dissociation (decrease in XGDH) as suggested for the structurally related glucose oxidase,18,19 possibly exacerbated by GDH's simpler monomeric quaternary structure.20 Several other initial modifications may also yield linear behaviour, e.g. increasing KG 35-fold for an R2 > 0.98. This deviation might emerge from crosslinker-mediated variation in Michaelis constants and diffusion coefficients. This kinetic model does not account for diffusional effects and assumes bulk-like glucose concentration in the active layer. Consequently, the KG/G term could account for experimental glucose concentrations being lower than those provided in the simulation by proportionally increasing KG.
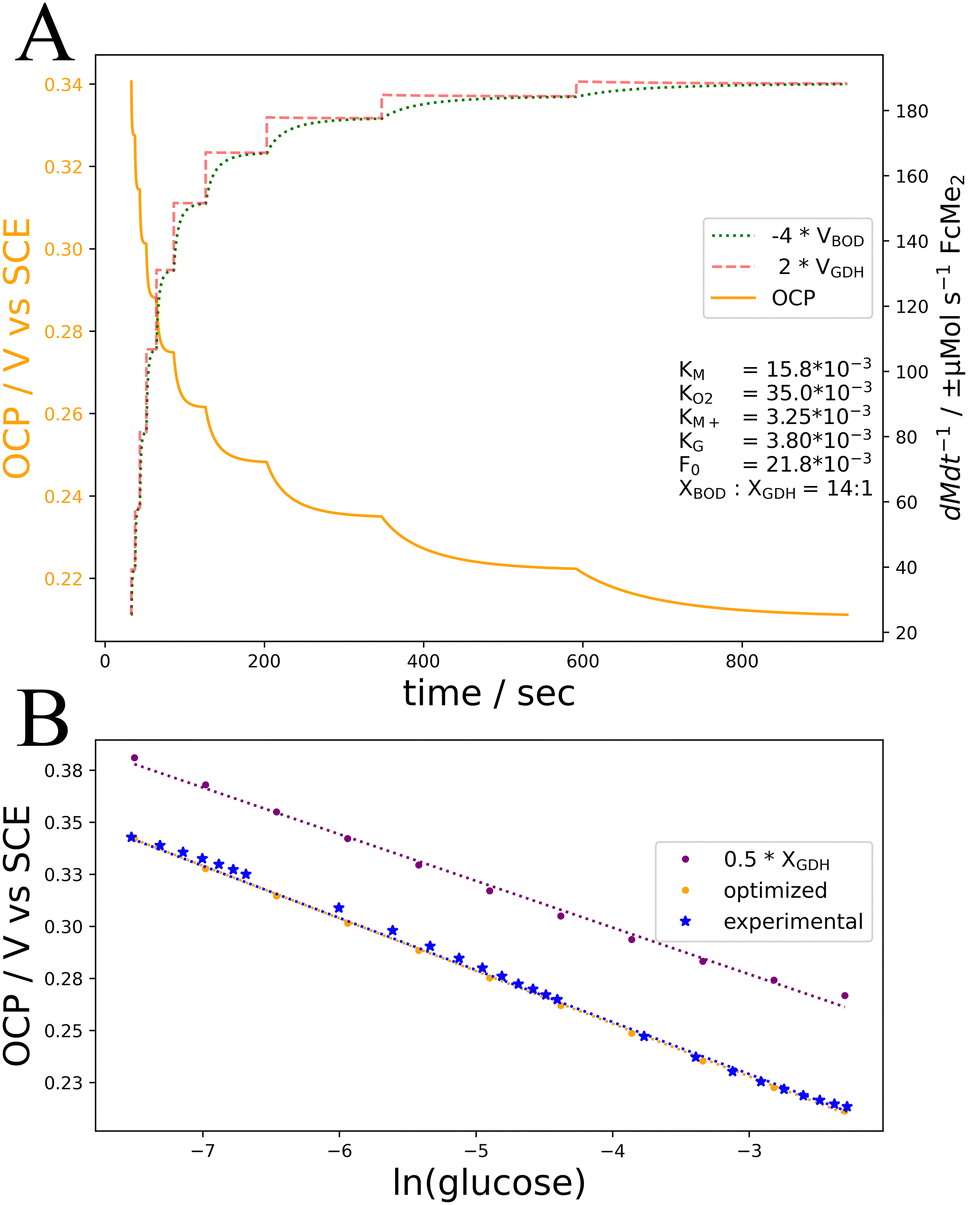 | ||
| Fig. 3 Kinetic simulations and experimental data of the GDH/BOD/FcMe2-LPEI electrode. (A) The rates of FcMe2 oxidation by BOD (green dotted) and reduction by GDH (red dashed) and the resulting OCP values (orange solid) over time, with successive increases in glucose concentration (0.28 to 102 mM) employing optimized kinetic parameters (inset). (B) Experimentally determined OCP measurements (blue), simulated OCP values with optimized parameters as in A (orange), and simulated OCP values with only XGDH decreased 2-fold (purple). Lines of best fit: 0.5 × XGDH: OCP = 0.209–0.023ln(G) R2 = 0.995, optimized parameters: 0.152–0.0253ln(G) R2 = 0.999, experimental: OCP = 0.154–0.0252ln(G) R2 = 0.997. | ||
We performed a basin-hopping optimization of the Michaelis constants using the limited-memory Broyden–Fletcher–Goldfarb–Shanno algorithm with Box constraints (L-BFGS-B) for local minimization. We initialized the process with a milder 50% reduction in XG. The Michaelis constants were restricted to a 10-fold increase, and the objective function minimized deviations in the final slope and intercept terms from experimentally determined values (Fig. 3). This optimization is not meant to calculate the real values for these parameters predicted by experimental data, the experimental data is insufficient given the inter-dependence of parameters tested and their approximation from literature values. The aim is to demonstrate that the kinetic mechanism outlined in this work can explain the OCP-glucose response demonstrated experimentally and can be expanded to understand pseudocapacitive systems more broadly.
The optimization produced a linear fit of OCP = 0.152–0.0253ln(G) with an R2 = 0.999, compared to the experimentally determined fit of OCP = 0.154–0.0252ln(glucose), R2 = 0.997. In accordance with our predictions of BOD activity being largely M-limited, and the decreased diffusion constant for this mediator in its polymer state, the optimal value of KM was determined to be 15.8 mM, a 4.92× increase compared to the published value. This increase in KM likely reflects a failure of these kinetic calculations to account for thermodynamic effects at high concentrations of M+. KO2 and KG also increased, but only by 2% and 1% respectively relative to their published values, suggesting that substrate diffusion may be only mildly limited in this architecture. A discussion on the effects of enzyme loading on response time elucidated by this simulation is discussed in the ESI.†
Integrating rapid simulations with iterative, model-refining experiments organizes hypotheses into a clear electrode function model, enhancing experimental efficiency and fostering a concerted structure–performance landscape in the field. Developing kinetic models for non-enzymatic heterogenous architectures is challenged by active sites arising from component interactions and not merely catalyst loading.21,22 In enzymatic systems, simulation-guided design is challenged by maintaining kinetic parameters across formulations, and the common use of non-specific enzyme–polymer crosslinkers and impure commercial enzyme formulations may pose significant challenges to the design of kinetic models with significant predictive power.
This model differs from other numerical solutions of potentiometric biosensors by demonstrating potential stabilization emerging from a competing redox reaction, not diffusion of the redox-active product.23–26 These models often incorporate finite-difference calculations of substrate diffusion across the enzyme layer, which could improve the predictive power of this model.
The contribution of BOD activity to measured OCP may enable tuning of the sensor's linear range, a property typically defined more strictly by KM in one-enzyme sensors. The system's response time, dependent on relative enzyme activity rather than product diffusion, may allow for thicker, more protective polymer layers.27 Investigating these properties will require more robust control over enzyme immobilization to avoid the interplay of crosslinking quantity and kinetic parameters. Furthermore, this architecture's reliance on the relative activity of two separate enzymes will pose challenges to long-term stability in practical implementations of this system.
This work elucidates the mechanisms underlying a potentiometric glucose biosensor co-immobilizing glucose dehydrogenase and bilirubin oxidase in a dimethyl-ferrocene polymer and provides a kinetic model for pseudocapacitive charge and discharge behaviour in bioelectrochemical cells employing mediating polymers. By coupling experimental observations with a kinetic model and optimizing kinetic parameters, we demonstrate that the linear relationship between OCP and glucose concentration arises from the interplay of enzyme turnover rates and mediator dynamics responding to an initial pseudocapacitive charging of the polymer layer. This model emphasizes the utility of coupling a pseudocapacitive enzyme reaction with an analyte-specific counter-reaction immobilized on a single electrode and could easily be extended to develop potentiometric biosensors for a wide range of analyte species. This work lays the foundation for further exploration of biosensors coupling analyte-sensitive enzymes with pseudocapacitive charging elements.
This work was supported by the National Science Foundation Division of Chemistry under Grant No. CHE-2154206/CHE-2406605, with co-funding from the Division of Chemical, Bioengineering, Environmental, and Transport Systems.
Data availability
Data for this article, including code for the kinetic simulation, and OCP measurements associated with experimental data are available on our GitHub at https://github.com/MinteerLab.Conflicts of interest
There are no conflicts to declare.References
- W. El Housseini, et al., ACS Sens., 2024, 9, 3357–3366 CrossRef PubMed.
- C. Stines-Chaumeil, et al., Biochim. Open, 2017, 4, 36–40 CrossRef PubMed.
- S. Tsujimura, et al., Biosci., Biotechnol., Biochem., 2006, 70, 654–659 CrossRef CAS PubMed.
- F. Conzuelo, et al., Angew. Chem., Int. Ed., 2018, 57, 13681–13685 CrossRef CAS PubMed.
- K. L. Knoche, et al., ACS Energy Lett., 2016, 1, 380–385 CrossRef CAS.
- C. Agnès, et al., Energy Environ. Sci., 2014, 7, 1884–1888 RSC.
- D. Pankratov, et al., Angew. Chem., Int. Ed., 2016, 55, 15434–15438 CrossRef CAS PubMed.
- Y. Zhang, et al., J. Energy Storage, 2022, 8, 110604 Search PubMed.
- K. B. Male and J. H. T. Luong, Enzyme Microb. Technol., 1994, 16, 425–431 CrossRef CAS.
- Á. Torrinha, et al., Electrochim. Acta, 2019, 318, 922–930 CrossRef.
- K. Sode, et al., Biosens. Bioelectron., 2017, 87, 305–311 CrossRef CAS PubMed.
- R. Sander, Atmos. Chem. Phys., 2015, 15, 4399–4981 CrossRef CAS.
- F. Schachinger, et al., Electrochem. Commun., 2023, 14, 107405 CrossRef.
- J. W. Gallaway and S. A. C. Barton, J. Am. Chem. Soc., 2008, 130, 8527–8536 CrossRef CAS PubMed.
- N. Mano, et al., J. Am. Chem. Soc., 2003, 125, 6588–6594 CrossRef CAS PubMed.
- J. S. Weltz, et al., J. Am. Chem. Soc., 2020, 142, 3463–3471 CrossRef CAS PubMed.
- M. J. Cooney, Methods Mol. Biol., 2017, 1504, 215–232 CrossRef CAS PubMed.
- A. Seehuber and R. Dahint, J. Phys. Chem. B, 2013, 117, 6980–6989 CrossRef CAS PubMed.
- P. N. Bartlett and F. A. Al-Lolage, J. Electroanal. Chem., 2018, 819, 26–37 Search PubMed.
- H. Yoshida, et al., Sci. Rep., 2015, 5, 1–13 Search PubMed.
- W. Chen, et al., Acc. Chem. Res., 2022, 55, 3230–3241 CrossRef CAS PubMed.
- W. Chen, et al., Engineering, 2022, 14, 124–133 CrossRef CAS.
- S. D. Caras, et al., Anal. Chem., 1985, 57, 1917–1920 CrossRef CAS PubMed.
- W. E. Morf, et al., J. Electroanal. Chem., 2011, 657, 1–12 CrossRef CAS.
- K. Stepurska, et al., Sens. Actuators, B, 2018, 259, 580–586 Search PubMed.
- V. Martsenyuk, et al., CEUR Workshop Proc., 2023, 3468, 1–11 Search PubMed.
- W. E. Morf, et al., J. Electroanal. Chem., 2011, 657, 13–22 CrossRef.
Footnote |
| † Electronic supplementary information (ESI) available. See DOI: https://doi.org/10.1039/d5cc00926j |
| This journal is © The Royal Society of Chemistry 2025 |