
 Open Access Article
 This Open Access Article is licensed under a
 Creative Commons Attribution 3.0 Unported Licence
Exploitation of pseudo-symmetry in the Cambridge Structural Database for molecular ferroelectric discovery†
Sam Y. Thompson a,
Harold T. Stokesb,
Branton J. Campbellb,
Elliot D. Goldberga and
John S. O. Evans*a
a,
Harold T. Stokesb,
Branton J. Campbellb,
Elliot D. Goldberga and
John S. O. Evans*a
aDepartment of Chemistry, Science Site, Durham University, Durham DH1 3LE, UK. E-mail: john.evans@durham.ac.uk
bDepartment of Physics & Astronomy, Brigham Young University, Provo, Utah 84602, USA
First published on 29th May 2025
Abstract
The search for new useful molecular ferroelectrics is a non-trivial problem. We present the application of an automated symmetry-searching method (FERROSCOPE) to the Cambridge Structural Database (CSD) in order to identify polar structures with a closely-related non-polar phase. Such structures have the possibility of undergoing a polarization-switching phase transition thus forming a ferroelectric-paraelectric pair. FERROSCOPE successfully identifies this relationship in 84% of a curated list of 156 known molecular ferroelectrics from the literature and identifies an additional 17![[thin space (1/6-em)]](https://www.rsc.org/images/entities/char_2009.gif) 000 potentially ferroelectric compounds in the CSD. Our analysis shows that the method identifies CSD structures which have potentially been described in incorrect space groups, extending previous analyses. We describe experimental case studies which reveal phase transitions in two polar systems predicted to have related non-polar phases.
000 potentially ferroelectric compounds in the CSD. Our analysis shows that the method identifies CSD structures which have potentially been described in incorrect space groups, extending previous analyses. We describe experimental case studies which reveal phase transitions in two polar systems predicted to have related non-polar phases.
Introduction
Ferroelectric materials can have their intrinsic electric polarisation reversed by an external electric field. Hysteresis curves of the polarisation against electric field visualise this bistability, which is useful in non-volatile memory applications like ferroelectric random-access memory (FeRAM).1 Other applications of ferroelectrics include in capacitors, field effect transistors, as transducers and in piezoelectric devices.2The phenomenon of ferroelectricity in crystalline systems is intimately linked to symmetry. To possess a spontaneous polarisation a material must crystallize in one of the 10 polar or pyroelectric point groups that have a unique rotation axis, no inversion centre and no symmetry plane perpendicular to the rotation axis (1, 2, m, mm2, 4, 4mm, 3, 3m, 6, 6mm); there are 68 corresponding pyroelectric space groups. When heated above the Curie temperature (TC), the polarisation of the ferroelectric phase is destroyed as it transforms to the paraelectric phase. This transition is accompanied by an increase in long-range symmetry due to the polar distortions becoming averaged out or otherwise destroyed through displacive disorder. The archetypical example is the room temperature displacements of Ti away from the centres of TiO6 octahedra in the tetragonal perovskite BaTiO3 which average to a long-range cubic symmetry at elevated temperatures.3,4
Though ferroelectricity was first discovered in the molecular Rochelle salt,5 industrial applications have been dominated by oxide ceramics like barium titanate and lead zirconate titanate (PZT).6 These materials are, however, dense, require high energy processing and often contain toxic elements. The last few decades have therefore seen a push to re-examine molecular crystals as practical ferroelectrics. These are promising, inter alia, due to their low density, low-energy solution processing and less toxic constituents. Electronic components made from them are therefore potentially lighter and more usable in wearable technology applications.7 The polymeric ferroelectric polyvinylidene fluoride (PVDF), for example, has been used in commercial products.8–10
While molecular materials are unlikely to replace ceramics in all applications, several examples with potentially exploitable properties have been discovered. For example, croconic acid,11 a single-component molecular ferroelectric, has a TC around 400 K and a spontaneous polarisation (Ps) exhibiting an inorganic-rivalling 30 μC cm−2 in thin film devices.12 Memory applications would require materials that display rapid switching over multiple cycles, and compounds such as 4-methylmorpholin-4-ium 2,4,6-trinitrophenolate and [Hdabco][ReO4] (CSD refcodes FIGNER and SIWKEP, respectively; dabco = 1,4-diazabicyclo[2.2.2]octane) have shown switching frequencies >100 kHz at ∼1.5 kV cm−1 and stability over 105 cycles.13,14 Demonstrator devices have been made with properties significantly enhanced over those using PVDF.15 Exploitation of effects close to the morphotropic phase boundary in the molecular perovskite solid solution ((CH3)3CH2F)x((CH3)3CH2Cl)1−xCdCl3 has led to larger piezoelectric coefficients (d33 ∼1540 pC N−1) than PZT.16 There have been a number of recent reviews of the area.17–20
One of the major challenges in the field is how to identify new molecular ferroelectrics. One possible method is to make use of the symmetry ideas discussed above, and to try and identify polar structures that possess higher non-polar pseudo-symmetries. The close relationship between the two structures offers a potential low-energy pathway to switch polarity via the higher symmetry structure. The crystallographic space groups of the non-polar high-symmetry parent structure (HSS) and its polar low-symmetry child structure (LSS) naturally have a group–subgroup relationship. Shi et al. exploited this concept by searching for compounds experimentally known to have both polar and higher-symmetry non-polar phases.17 There is, however, no need for the HSS to have been experimentally identified, or even to be theoretically stable, for this concept to work. If one can identify structures that have higher-symmetry counterparts that are at least chemically plausible, they are good candidates for switchable ferroelectric behaviour. This idea was used by Abrahams, who used the proximity of higher-symmetry structures to try to identify new inorganic ferroelectrics in the ICSD.21–31
The obvious resource for conducting an exhaustive search for new molecular ferroelectrics is the Cambridge Structural Database (CSD).32,33 The CSD is a near-exhaustive collection of published small molecule crystal structures, with over 1300000 entries in its latest release.34 The detailed structural information it contains has previously allowed data mining experiments to identify important materials in disciplines such as polymorphism,35,36 co-crystal37 and hydrate screening,38,39 drug discovery,40,41 molecular magnets,42 organic semiconductors43 and others.34 Exhaustive searching of the CSD for polar LSS with a related HSS provides a route to identify potential molecular ferroelectrics.
There have been a number of previous reports on identifying pseudosymmetry in published structures. Perhaps the most (in)famous of these are the articles published by Marsh, Clemente, and others correcting cases where structures were erroneously published in incorrect space groups.44–49 More recently, an elegant series of papers by Brock50–52 used an approach combining “by eye” inspection of structures with software-tests such as those implemented in PLATON53 to identify pseudosymmetry in structures with Z′ > 1 in a set of low symmetry space groups (P1, Pc, P2 and C2). Brock highlights, for example the high proportion (around 8% for P1 and Pc) of Z′ (= Z for P1) > 1 structures which almost certainly have higher symmetry, with the corresponding proportion for achiral materials or kryptoracemates being higher still (∼40% in P1). Brock calls these examples “PSTG” for “Pseudo Symmetry Too Good”. These papers provide a useful summary of structural features likely to lead to pseudosymmetry and highlight the likelihood of several of the phases to undergo structural transitions on warming. They also provide a useful benchmark for the studies reported here. In addition to “by eye” approaches, a number of methods have been proposed to automate the detection of higher symmetry, including works by Spek (ADDSYMM of PLATON),53,54 the Bilbao group (PSEUDO),55 Baggio,56,57 Gavezzotti,58 the CRYSTALS group (MATCH),59 Brock and Taylor,60 Somov and Chuprunov,61 and Rekis.62
In this manuscript, we describe an extensive search of the CSD with the aim of finding new molecular ferroelectrics using a python programme FERROSCOPE and our FINDSYM63 routine. The approach also identifies structures likely to undergo structural phase transitions on warming. FERROSCOPE applies chemically sensible simplifications to CSD structures then identifies polar low symmetry structures (LSS) that possess higher non-polar pseudo-symmetries (HSS). Each polar candidate is written to an SQL database which interfaces with the CSD and contains key information about the LSS–HSS pair and their symmetry relationship. It can be user-searched to select targets for synthesis and characterisation. Custom CIF files are produced allowing the relationship between the LSS and HSS to be visualised. We describe details of the methods used, test the methods on a curated set of known molecular ferroelectrics, discuss the distribution of potential molecular ferroelectrics in the CSD and provide two experimental case studies on compounds predicted to show symmetry-raising phase transitions by FERROSCOPE.
Experimental
Synthesis
Powder X-ray diffraction (PXRD)
Variable temperature PXRD data were collected using a Bruker D8 ADVANCE Cu Kα1,2 diffractometer, equipped with a LYNXEYE detector and an Oxford Cryosystems Cryostream Plus device. The sample was loaded into a 0.7 mm external diameter borosilicate capillary to a length of 30 mm. The capillary was sealed and attached to a goniometer, which rotated at 10 rotations a minute during the measurements. Data were collected between 150 K and 400 K with a warming/cooling rate of 14 K h−1 for tris(t-butylammonium)trimetaphosphate and 106 K and 439 K with a warming/cooling rate of 20 K h−1 for tetraethylammonium tetrachloroferrate(III). Cryostream temperatures were calibrated using a 1:1 ratio of Al and Si powders, based on their known and significantly different thermal expansion coefficients.65–67
Structure solution from PXRD data was performed with TOPAS-Academic.68–70 Rigid bodies were defined for tetraethylammonium and FeCl4− ions. Rigid body positions and rotations were randomized, and a restricted Rietveld refinement was performed. After convergence, the model was re-randomized and refined to convergence for 100000 least-squares iterations. In each case, the same low R-factor solution was found multiple times. The best structural model was then used in a full Rietveld refinement where peak shapes, atomic displacement parameters rigid body coordinates, cell parameters, and a zero-point correction were refined.
Single-crystal X-ray diffraction
SXRD data were collected using a Bruker D8 VENTURE diffractometer (PHOTON III C7 MM CPAD detector, ImS-microsource, focusing mirrors) equipped with an Oxford Cryosystems Cryostream 700+ device using Mo Kα radiation. Crystal structures were solved within the Olex2 software package.71 H atoms were placed in calculated positions and refined in riding mode.Symmetry detection method
The workflow of the symmetry search program FERROSCOPE is shown in Fig. 1. Polar crystal structures are extracted from the CSD and are subject to several structural simplifications which emulate known ferroelectric switching mechanisms in the literature. By mimicking real systems, we increase the likelihood of a new HSS being identified and it having a chemically plausible ferroelectric switching mechanism. Modified structures are then tested for a higher symmetry and successful candidates are stored in an SQL database. Refcodes and most of the parameters contained in the CSD entry are stored along with data extracted from the symmetry regularisation calculation. Python files and most-recent candidate databases can be accessed from the FERROSCOPE GitHub repository.72 | ||
| Fig. 1 Workflow of the search program. CSD entry MEGJEP73 is shown as an example at each step. | ||
Search filter
For the majority of this study, version 5.45 of the CSD was used including the Mar24, Jun24 and Sep24 updates. Of the 1345704 structures in the CSD, 168195 are reported in polar space groups (12.4%). Structures that have errors or do not have 3D coordinates were discarded leaving us with 157437 structures. Any disordered atoms were removed from the structure.
Structural modifications
In a first step, hydrogen atoms are removed from all structures. Hydrogen positions are often implied by the organic backbone so that their removal results in no significant loss in chemical information. Due to their low X-ray scattering, hydrogens are also more likely to be incorrectly located in a structure74,75 making the HSS more difficult to detect. In addition, hydrogen removal facilitates the identification of ferroelectrics that undergo switching via proton hopping within hydrogen bonds between pseudo-symmetric heteroatoms. Key examples of this mechanism include Rochelle salt5 and croconic acid11 (Fig. 2). Upon warming, the hydrogen atom either displaces to the centre of the hydrogen bond or becomes dynamically disordered between heteroatoms. Both processes can produce a local inversion centre. Often, this hydrogen atom is the only symmetry-breaking atom, and with its removal the HSS can be detected. | ||
| Fig. 2 Common molecular ferroelectric switching mechanisms which are incorporated in FERROSCOPE. Atoms are represented by colour: carbon (grey), oxygen (red), nitrogen (blue), iodine (purple) and hydrogen (white). | ||
The disorder of heteroatom-containing molecules is another common structural change that occurs at symmetry-raising phase transitions in molecular ferroelectrics. Upon heating, molecules can become rotationally disordered such that the heteroatom becomes indistinguishable from other atoms (for example, a pyridine spinning around its pseudo 6-fold axis resembles benzene). This disorder mechanism is modelled by replacing heteroatoms with a single-atom type so FERROSCOPE can identify candidates with potential for this type of disorder. Fig. 2 shows the archetypical example of pyridinium periodate.76
To model the rotational disorder of –CX3 (X = Cl, F) units as observed, for example, in the phase transition of ferroelectric trichloroacetamide,77 X atoms in this environment are removed from the structure. Other common disorders like Cl/H positions swapping in –CH2Cl groups can be readily accounted for by including these groups in a list of groups to be removed.
Compounds containing pseudo-spherical molecules often transition to a dynamically disordered phase on heating prior to their eventual melting or decomposition.78 By averaging out local differences in molecular orientation, the free rotation of these molecules increases symmetry. The often significant increase in symmetry makes crystals that undergo these so-called plastic phase transitions attractive as multiaxial ferroelectrics for use in thin film applications.79 The multiaxial behaviour arises as the symmetry change between the HSS and LSS gives rise to a large number of interconvertible ferroelectric domains in the LSS. These domains can partially align with the electric field, thus realizing a higher proportion of the theoretical saturated polarisation at lower applied fields. Pseudo-spherical molecules commonly present in plastic molecular ferroelectrics include dabco, quinuclidinium and tetrahedral anions (BF4−, ClO4−, IO4− etc.).80,81 For example, quinuclidinium and IO4− combine as a salt to form a ferroelectric82 with a plastic high symmetry (Pm![[3 with combining macron]](https://www.rsc.org/images/entities/char_0033_0304.gif) m) phase and 12 reorientable domains of the LSS (Pmn21) structure (Fig. 2).
m) phase and 12 reorientable domains of the LSS (Pmn21) structure (Fig. 2).
Automatically identifying potential plastic ferroelectrics needs a way to assess sphericity. A recent approach by Sødahl et al. used a so-called globularity method32 to assess a molecule's shape by comparing its convex hull to its bounding sphere. A dimensionless “globularity” parameter was calculated by dividing the volume of the convex hull by the volume of the bounding sphere. This was used to suggest new potential plastic crystals in the CSD. This sphericity measure is not useful for our application as it fails to identify tetrahedra as pseudo-spherical (these were manually included in Sødahl's work), and their disorder is important in many ferroelectrics.
We have chosen to use an alternative method based on moments of inertia which quantifies the degree of sphericity through the distribution of mass in a molecule. This more naturally lends itself to the description of a rotating molecule. The inertial sphericity (Isph) is calculated using the following equation:
 | (1) |
Fig. 3 shows how Isph behaves compared with the Sødahl globularity method. We created a sample set of 50 molecules and labelled them as pseudo-spherical (orange) and aspherical (black) based on whether they are known to rotationally disorder in real materials. We then calculated the globularity value and Isph for each. From Fig. 3 we see a good correlation between the two methods for the majority of cases. There are, however, three regions of disagreement indicated by the red boundaries. Regions 1 and 2 contain planar molecules, for which discrepancies arise because the convex hull volume is zero by definition, meaning that the globularity method cannot differentiate them. Region 1 contains molecules where all atoms sit in the plane. Molecules in region 2 have a non-zero globularity due to a number of small atoms not in the plane (for example, the hydrogen atoms on the ammonium group of anthranilic acid). Isph ranks these planar molecules as one might intuitively expect: pyridinium, guanidinium and imidazolium all sit to the right of region 1 (the points representing pyridinium and guanidinium are on top of one another) and the bulkier 2-aminopyridinium sits to the left of region 1 with a lower Isph. Molecules in region 2 all have similar shapes and thus similar Isph. Region 3 is of more concern for our application. This area represents species (specifically ClO4− and IO4−) which should be considered pseudo-spherical due to their known tendency to disorder. The Isph index clearly does a better job of describing the sphericity of these. For our work, we therefore chose to categorise any molecule with an Isph index of greater than 0.9 (chosen based on Fig. 3) as pseudo-spherical. FERROSCOPE simplifies these by replacing their atoms with a dummy atom at their geometric centre. This is more effective than the 0.34 globularity threshold used by Sødahl which categorises more molecules we deem unlikely to disorder on heating as spherical and does not capture tetrahedra.
 | ||
| Fig. 3 Comparison between the inertia and globularity assessments of molecular sphericity (top). Molecules in the grey region are simplified by FERROSCOPE. Dabco is indicated by the dashed red circle. Geometric constructions used in sphericity calculations (bottom). | ||
There are molecules that are observed to disorder in molecular ferroelectrics that are not captured by the Isph > 0.9 definition. For example, molecules derived from substitutions of dabco or cyclohexane/pentane are known to disorder at high temperatures. These specific cases are simplified in FERROSCOPE using CSD substructure searches. Molecules in the LSS that match the substructure searches are again replaced by a dummy atom at their geometric centre.
Two molecules which we initially designated as non-spherical are in the region Isph > 0.9. Neither are cause for concern as both are borderline cases. The star at (0.95, 0.43) is DABCO-dioxide which gets simplified with the DABCO substructure search. The other star at (0.91, 0.01) is trichloromethane, which is often disordered in solids.
Topology labelling
The symmetry detection step in FERROSCOPE is ultimately limited by the nearest neighbour distance between atoms of the same atom type, as discussed in the next section. When the search for a structural distortion (relating the HSS and LSS) tolerates displacements larger than the shortest nearest neighbour distance, atoms of the same type can trade places unnecessarily, which results in nonsensical outcomes. To allow for HSS identification in compounds with large displacements of molecular components from symmetry-related positions, we replace atomic symbol labels with labels defined by the chemical equivalence of sites within the molecule. Fig. 4 shows this topology labelling for diisobutylamine, a common molecule found in ferroelectrics.86–88 In the standard-labelled structure, the nearest neighbour C–C distance is between C1 and C2, however in the topology-labelled structure this distance has increased to the distance between two Z atoms. We use the algorithm89 developed by Morgan and modified90 by Cole to identify topological equivalence which allows for chemical information to be considered at each site. As discussed below and shown in Fig. 8c, this relabelling increases the number of potential ferroelectrics identified by around 45%. | ||
| Fig. 4 Atomic positions in modified structures are labelled by their chemical equivalence to allow for larger tolerances when searching for higher-symmetry. Red arrows indicate shortest distance between nearest equivalent carbon atoms in the two schemes. | ||
Symmetry detection (FINDSYM)
FERROSCOPE-modified structures are tested for closely related higher symmetry structures. The Linux distribution of the FINDSYM63 program (which was updated specifically for this work) is used to test each modified structure for non-polar pseudo-symmetry, and any pseudo-symmetry detected is then enforced in the HSS output CIF file. FINDSYM first records the symmetries listed in the LSS input CIF file, reduces the symmetry to P1 and transforms the structure to Cartesian coordinates in the user-specified primitive unit cell. It then begins from scratch to identify all space-group symmetries (exact and approximate within tolerance) possessed by the contents of the unit cell, after which it verifies that none of the symmetries specified in the original input file were missed. Note that each new symmetry detected must take every atom of the LSS to a new position that lies within position tolerance (PT) of a matching atom of the same topology type.FINDSYM first identifies additional approximate translations, which must be consistent with some direct sublattice of the primitive lattice of the LSS. When the translation is only approximate (a pseudo-symmetry), the translated atom position and the actual position of the matching atom (of the LSS) may differ. The PT (Å units) is the maximum allowed separation distance between the two, so that any candidate translation resulting in atom-matching discrepancies larger than the PT is rejected. When a candidate translation meets the PT condition, the structure is immediately symmetrized to respect the new translation, the lattice basis is updated, and the translation search continues.
Next, the point operations of the new lattice are identified as those that leave invariant the lengths of the lattice basis vectors and the lengths of their sums and differences to within the lattice tolerance LT (Å units). Then, for each operation R of the lattice point group, FINDSYM searches for an associated fractional translation v such that the space-group operation {R|v} matches each atom in the structure to an atom of the same type within PT. If any of the lattice point operations fail to yield a match, the point group of the space group must be a proper subgroup of the lattice point group. Finally, the space group is detected from its operations, the structure is transformed into the conventional setting of the space group, the conventional unit-cell parameters are adjusted to respect the crystal family, and the details of the structure are symmetrized to respect each of the space-group operations.
To reduce the risk of detecting false pseudo-symmetries, FINDSYM constrains the user-specified position tolerance to obey the inequality PT ≤ RPT*dNN, where dNN is the shortest distance between any two atoms of the same type anywhere in the structure and the relative position tolerance (RPT) is a unitless fraction that defaults to ⅓. However, the user can override the value of the RPT, which proves helpful here.
In this work, FINDSYM used two different methods to make pseudo-symmetry detection in molecular crystals more effective. The first is the topological relabelling of atom types described above. The second uses the average displacements required by a group of atoms rather than the displacement of a single atom so that symmetries can be detected at a lower PT. Consider the case of a trigonal planar PX3 molecule that becomes distorted such that the X3 triangle remains in the xy plane while the P atom is displaced by z = 0.5 Å above the centre of the X3 triangle. If we test the (x, y, −z) mirror operation as a candidate pseudo-symmetry of the distorted molecule, the P atom gets mapped from z = +0.5 Å to z′ = −0.5 Å, so that a shift of (0, 0, 1 Å) would be needed in order to match them up again. This implies that a PT of 1 Å is needed to detect the mirror operation as a pseudo-symmetry. However, the assumption that the 3 X atoms lie in the z = 0 plane is arbitrary. If the X atoms were instead all in the z = 0.125 Å plane, then the candidate mirror operation would only require PT = (0.5–0.125) × 2 = 0.75 Å to be accepted. It is, in fact, the average z displacement of atoms that is important in this case, i.e. ¼(3 × 0 + 1 × 0.5) = 0.125 Å, and this allows the use of a lower PT. This means that larger displacements can be detected before incorrect swapping of nearby sites becomes an issue.
The magnitude of atomic displacements in the transformation from the LSS to the HSS is reported by FINDSYM as a root-mean-square (RMS) value in Å. This is defined as:
 | (2) |
Post-processing
To make it easier to visualise the predicted transformation from the LSS to the HSS, we write both structures to a single CIF file for viewing in Mercury software.91 Fig. 5 shows the superimposed CIF file of diisopropylammonium bromide (CSD refcode: TEJKUO), a known ferroelectric.86,87 In the figure, HSS atom positions are shown in red to differentiate them from LSS atomic positions. In this example, it is clear how the HSS has been found: the ammonium and bromide ions move onto the blue mirror plane. The large experimental spontaneous polarisation of 23 μC cm−2 is rationalised by the centres of positive (nitrogen) and negative (bromine) charges moving in opposite directions away from the mirror plane on ordering. The ferroelectric switching mechanism is also implied by the image, with the nitrogen atoms shifting down and the bromides shifting up. | ||
| Fig. 5 Superposition of the HSS and the LSS for TEJKUO, where HSS atom positions are indicated in red. | ||
The FERROSCOPE workflow also reports further predictions on the potential ferroelectric properties. Firstly, we determine whether the predicted phase transition is Aizu-allowed,92 meaning that any symmetry element relating two orientation states is contained within the point group of the paraelectric phase (i.e. the HSS). Also, the point group of the paraelectric phase should not contain any additional symmetry elements unrelated to ferroelectric switching. This helps filter out non-ferroelectric phase transitions in the results database, for example those where the new symmetry elements detected do not reduce the polarisation to zero. An example (CSD refcode: ACINIJ) of an Aizu-disallowed phase transition is shown in Fig. 6. The CSD entry contains an organotellurium molecule with point symmetry Cs (m) crystallising in space group C2. The symmetry detection process rotates the whole molecule to align the molecular mirror plane with the crystallographic mirror plane of the HSS space group, Aem2 (Abm2). The net crystal polarisation vector is shown for both the HSS and LSS and is invariant under the new symmetry operation. The detected phase transition with Aizu label mm2F2 is thus not of the ferroelectric-paraelectric type.
 | ||
| Fig. 6 An example of an Aizu-disallowed phase transition in ACINIJ, for which the dotted mirror plane indicates a pseudo-symmetry. The polarisation vector (red arrow) is invariant under the new symmetry operation detected. By inspection, polarisation reversal would require a 180° rotation of the polar molecule around the horizontal axis. | ||
We report the number of orientationally distinct domains in the ferroelectric phase via the symmetry index of the phase transition (the HSS:LSS ratio of the number of symmetry elements per unit volume), which can be a helpful indicator for identifying multiaxial ferroelectrics.
The LSS can be viewed as a distortion of the HSS whose order parameters belong to irreducible matrix representations (irreps) of the space group of the HSS. Because this information allows one to determine whether the HSS–LSS phase transition has the potential to be continuous, we write irreps to the results database using the CDML93,94 irrep-labelling convention of the ISOTROPY Software Suite.95
Results
FERROSCOPE's effectiveness at identifying known ferroelectrics
To assess the efficacy of FERROSCOPE, we first tested whether it could identify LSS–HSS pairs for known ferroelectric materials in the CSD. To do this, 275 CSD entries were manually selected based on being described as ferroelectric in associated publications. Of these 275 entries, several have incomplete CSD entries (e.g. missing or erroneous 3D atomic coordinates) or come from publications where our re-analysis of properties data reported suggests that the observation of ferroelectricity is questionable. To provide an effective test set, we chose to restrict it to entries where experimental evidence of ferroelectricity was particularly strong. We required criterion 1 and either criterion 2 or 3 to be fulfilled:1. A detailed discussion of a high symmetry paraelectric phase which ideally had been observed and characterised using diffraction studies.
2. Publication of a well-formed polarisation-electric field hysteresis loop conforming to the standards set out by Scott (i.e. not simply a lossy dielectric and requiring a concave approach to saturation).96
3. Independent evidence of ferroelectric switching through techniques such as piezoelectric force microscopy (PFM).
This gave a test set of 156 structures.
Optimisation of the FINDSYM tolerances PT, RPT and LT (discussed above) was carried out by performing several iterations of the symmetry detection algorithm on CIF files modified using the rules above for each of the reliable ferroelectrics. Each iteration was performed with different values for each of the tolerances used by FINDSYM. The values tested for PT and LT were between 0.1 and 3.0 Å, while RPT was fixed to 0.999 so that PT controlled the atom matching tolerance. Fig. 7a shows the number of successfully detected higher-symmetry potential paraelectric structures as a function of increasing PT. The vertical distribution of points for each PT value corresponds to the different LT values tested. Plotting the same data as a function of LT produces Fig. 7b. LT has a less significant effect on the number of hits found than PT. For large values of PT, LT values from 1.25 to 2.5 Å do not change the number of hits found. The value of LT was therefore set at 1.5 Å.
 | ||
| Fig. 7 The percentage of HSS structures identified from the test set of 156 known molecular ferroelectrics found by FINDSYM for different tolerances: (a) increasing PT, (b) increasing LT. All points are colored by PT value. | ||
While the data of Fig. 7a suggest that a PT of 2.5 Å correctly identifies a HSS for the majority of the ferroelectric test set, later analysis of the whole CSD revealed that many of the HSS predictions make little structural sense. This primarily revealed itself as a “flattening” of molecular structures such that large portions of the molecules become planar. Effectively, a too-high PT encourages FINDSYM to collapse non-planar molecules onto a mirror plane.
FINDSYM calculates the root-mean-square (RMS) displacement of the atomic positions between the LSS input and HSS output (eqn (2)). This proves a useful diagnostic for identifying “flattened” structures. Fig. 8a shows a histogram of RMS displacements for PT = 2.5 Å derived from the whole CSD (157437 polar entries in total matching our inclusion criteria). The shape of the plot suggests there are multiple distributions present. For our discussion, we can approximate the overall shape as the superposition of four peaks. For convenience, the peaks centred at RMS displacement values of 0.00 Å (peak 1) and 0.61 Å (peak 4) were fitted with symmetric Gaussian functions while the peaks centred at 0.05 Å (peak 2) and 0.23 Å (peak 3) were fitted with log-normal functions. Peaks 1 and 2 are likely a result of structures deposited with an incorrect space group and will be discussed in the next section. Peak 3 is our target potential ferroelectric distribution (as discussed later). Upon manual inspection of the corresponding HSS structures, Peak 4 is dominated by the “flattened” structures.
 | ||
| Fig. 8 Distribution of RMS displacement for a) 2.5 Å PT, b) 1.8 Å PT and c) 1.8 Å PT with topology labelling turned off. Distributions 1 (red), 2 (green), 3 (blue) and 4 (purple) are discussed in the text. Of the 157437 filtered polar structures in the CSD, 24175 HSS (15%) were found with PT = 2.5 Å and 16947 HSS (11%) were found with PT = 1.8 Å. Distribution functions plotted for 1, 2 and 3 are identical in all three plots. | ||
To check this, multiple runs of FERROSCOPE were performed with PT values gradually decreased from 2.5 Å to 1.6 Å (histograms showing the reduction of peak 4 are shown in Fig. S1†). As PT decreases, so does the prominence of peak 4 until 1.8 Å where this peak has effectively disappeared (Fig. S1† and 8b). The rest of the distribution is relatively unaffected and can be described by distributions 1–3. To confirm that peak 4 is a result of the flattening problem, a Python script was written to quantify the number of “flat” structures in the HSS CIF files produced. A structure was categorised as flat if all its atoms sat on the same special plane in any axis. For example, a structure, where all atoms have fractional coordinate y = 0.25 is flat. A potentially-flat subset of HSS structures was produced from the criteria that the structure must be found when PT = 2.5 Å, must not be found when PT = 1.8 Å, and must have RMS > 0.5 Å. This subset contained 4996 HSS, 3241 of which were found to be “flat” with respect to at least one axis. By comparison, only 111 flat structures were found amongst the 15353 HSS candidates obtained with PT = 1.8 Å (test performed on a previous version of the CSD without the Sep24 update). By inspection, these 111 structures were found to be flat for chemically sensible reasons – for example, the LSS input structures featured planar molecules. We therefore chose 1.8 Å as the optimal PT value for symmetry searching as it removes the problem of molecular flattening without significantly reducing the ability to correctly identify HSS from the known-ferroelectric test set (Fig. 7a).
The effectiveness of topology relabelling was assessed by performing an equivalent search to that of Fig. 8b without relabelling. The resulting distribution (shown in Fig. 8c) shows an approximately 31% decrease in the number of HSS identified. The RMS range over which HSS are identified also decreases significantly.
With this combination of optimal tolerances and the structural simplification routines discussed above, FERROSCOPE automatically finds HSS for 131 of 156 entries in the ferroelectric test set, a success rate of 84%. The 25 structures that are missed generally undergo some extreme disorder that isn't captured by our structural modifications. For example, many contained non-spherical bulky molecules that our Isph measure does not predict would disorder at high temperatures. 11/25 of these were organic–inorganic hybrid structures with molecular species in the oversized voids of an extended inorganic structure, so that their categorisation as “molecular” ferroelectrics is questionable. Of the 9/25 missed entries that are strictly molecular, 5 do not have a reported HSS in the CSD, which may imply that the level of disorder required to raise the symmetry is unusual. In any case, an 84% success rate on the test set is encouraging, and the optimised FERROSCOPE settings balance finding a large number of realistic HSS structures without too many unrealistic ones. Striving for a more exhaustive scope (by increasing tolerances) leads to less reasonable HSS suggestions.
Distribution of candidate HSS structures in the CSD
Fig. 9a shows the distribution of Bravais lattice types amongst the LSS which have an HSS as compared to the CSD as a whole. Generally, they show a similar distribution to the CSD. The main exception is triclinic structures which are about twice as represented in the positive results as in the CSD. This is likely a result of entries being erroneously labelled as P1 in the CSD, or due to incorrect space-group symmetry being used, as discussed in the following section on pseudo-symmetry. For many of these, the “higher” symmetry found by FERROSCOPE will be the true space group of the structure. | ||
| Fig. 9 a) Comparison of Bravais lattice distribution between FERROSCOPE results and the CSD. b) Distribution of relevant parameters amongst the search program results, darker colours represent a positive result for the relevant property. The organic definition is determined by the CSD internal “is_organic” label. An entry is classed ionic if it contains a “+” character in its CSD molecular formula. | ||
Fig. 9b shows the distribution of chemical and phase-transition properties amongst the HSS candidates. Purely organic structures, which would create more lightweight ferroelectrics, make up 58% of the HSS. 30% are classified as ionic or salts. Due to the stronger intermolecular forces from the coulombic attraction between ions in salts, ionic structures are likely to be stable to higher temperatures such that TC is more likely to be above room temperature. Slightly more of the predicted phase transitions are Aizu-allowed (83%) than continuous (78%). Many of the continuous transitions will also be Aizu-allowed, and many of the Aizu-allowed transitions will be forbidden by symmetry to be continuous.
The space-group frequency was compared between those with a proposed HSS and the whole of the CSD. For each polar space group, we calculate the percentage of CSD structures with that space group for which we find an HSS (from the total of 16947 for all space groups). These are plotted in Fig. 10. The data point size is relative to the logarithm of the space group frequency in the CSD as a whole. Space groups lying significantly far from the mean may be of interest and warrant greater scrutiny.
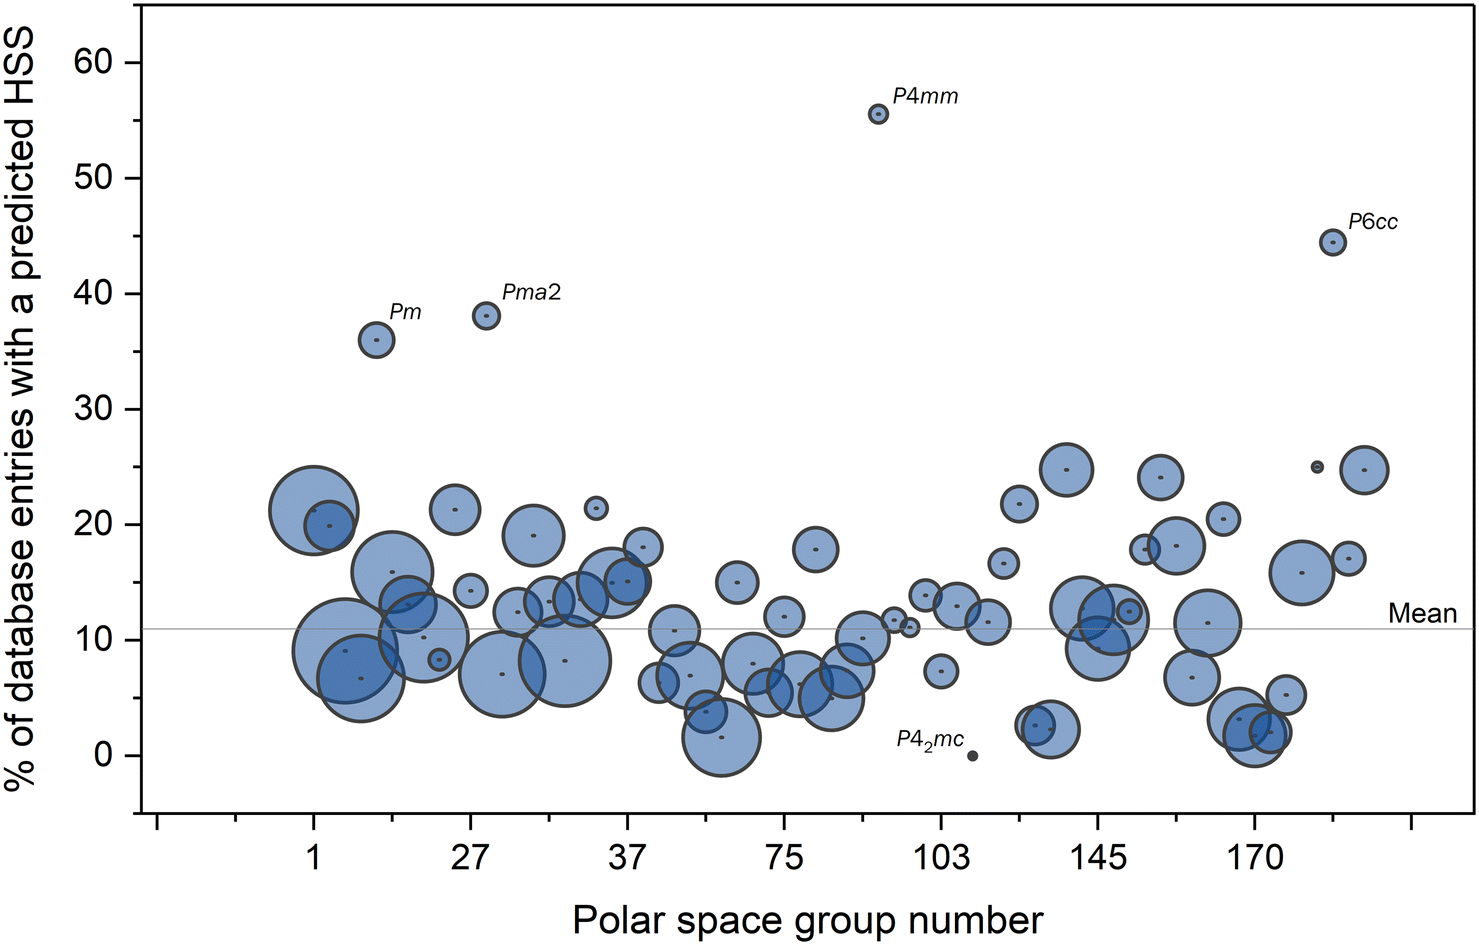 | ||
| Fig. 10 Percentage of structures with an HSS predicted by FERROSCOPE for each of the 68 polar space groups. | ||
In general, most-commonly reported space groups have a similar proportion of identified HSS structures and lie close to the overall mean value of 11%. Four space groups (Pm – #6, Pma2 – #28, P4mm – #99 and P6cc – #184) are overrepresented in the search results with relative frequencies larger than 35%. However, as seen by the small size of their datapoints in Fig. 10, they are extremely uncommon space groups (50, 21, 9 and 18 entries, respectively) and may be considered statistically insignificant. Space group P42mc (#105) only has 3 entries in the CSD and is the only space group to not be represented in the HSS candidate distribution. Again, we judge this result statistically insignificant.
Genuine vs. incorrect pseudo-symmetry
Fig. 8b showed the distribution of RMS displacements for a run of FERROSCOPE on all polar structures in the CSD that pass our filters (tolerances PT = 1.8 Å, LT = 1.5 Å and RPT = 0.999). As previously discussed, the distribution is multimodal but can be approximated by three peaks. Peaks 1 and 2 are centred at very low RMS displacement values (0.00 and 0.04 Å, respectively). These peaks are predominantly the result of CSD entries with incorrect space-group assignments, and include the pseudo-symmetry examples of Marsh, Brock and others discussed above.44–46,50–52,97,98 For example, a Brock-PSTG “pseudo symmetry too good” case we identified is CSD entry CADMIF, which featured two betaine molecules connected through an initially-reported asymmetric O–H⋯O hydrogen bond. The CSD entry is centrosymmetric apart from this hydrogen position, which lowers the symmetry from C2/c to Cc. The oxygen–oxygen distance,99 as well as our own SXRD and NMR experiments, suggests that the hydrogen is actually shared equally between the two oxygens and that the true symmetry should be C2/c. The error in this case is a mistranslation from the imported CIF file to the CSD entry.100 Our automated FERROSCOPE method finds 181 of the 187 PSTG structures that Brock reports in space groups P1, P2, C2 and Pc. Three of the seven we did not identify are solvates or clathrates where the solvent molecule in the CSD structure has been refined as ordered, but where Brock expects disorder to occur. These could be found by FERROSCOPE by including common solvents in the substructure simplification. One has –CH2Cl rotational disorder which we chose not to include in our search, and the remaining two (WOKKIT and KAYSOT) were labelled PSTG tentatively by Brock.Fig. 11a shows the RMS distributions of the 156 LSS–HSS ferroelectric test set (orange) and the 187 Brock PSTG structures (blue) overlaid on the same FERROSCOPE run as Fig. 8b (grey). Ferroelectrics can be found across the whole distribution, but Brock's PSTG structures are clearly concentrated at low RMS. Despite the lower number of examples, they also appear to show a splitting into peaks 1 and 2, as discussed below. This level of agreement supports the effectiveness of our workflow.
 | ||
| Fig. 11 Histograms of RMS shifts showing a) Brock PSTG and known ferroelectric entries overlaid on the whole database, b) the whole database with structures with Z′ = 1 (blue) and 2 (gold) highlighted, c) the prominence of peak 2 relative to peak 3 when searching only P1 structures, and d) absence of peak 2 when analysing non-polar structures in the CSD. The green curve indicates the expected position of peak 2. The spike at RMS = 0.52 Å is a result of a publication that used hydrated oxalic acid as a test case for evaluating the success of aspherical form factors in SXRD structure refinement.101 Over 400 entries were submitted to the CSD with very similar structures. | ||
We might intuitively expect that PSTG structures will predominantly be found with RMS ∼0 Å with a decaying distribution. However, it is clear from Fig. 8b that there are two separate distributions in the region 0.0 ≤ RMS ≤ 0.1 Å. We believe that this reflects the reason underlying the incorrect space group choice. Peak 1 in Fig. 8b, which is centred at RMS = 0.0 Å, describes database structures that are essentially undistorted from the HSS. These are likely due to structural analysis being performed in the correct space group and then being recorded in the database with a lower symmetry subgroup but with exact higher-symmetry relationships between atomic positions. Entries will also be in peak 1 when (restrained) refinements have been done in the wrong space group, but the symmetry breaking is only due to hydrogen atoms, like the CADMIF example discussed above. When hydrogen is the only symmetry-breaking atom (and is removed during FERROSCOPE analysis), the RMS is effectively zero (0.016 Å for the CADMIF case). Other contributions to peak 1 in our approach are structures that FERROSCOPE has simplified in some way. For example, structures that only contain pseudo-spherical molecules will be modified such that the structure sent to FINDSYM only consists of molecular centroids. If the centroid sits close to a symmetry element, little or no displacement is required to find the higher symmetry. Entries AZPADO01 and HMTRAO10 are examples of this and appear to be potential ferroelectrics. Heteroatom replacement can also result in pseudo-symmetry identification that doesn't imply erroneous symmetry; an example of this is LUNRER. A minor contribution to peak 1 comes from non-primitively centred LSS. FINDSYM only outputs primitive structures so an entry in C1, for example, will always return as P1 with zero RMS. There are only 56 such cases in our results database, which does not impact the conclusions made.
P1 structures with Z (= Z′) > 1 are often suspected of having incorrectly assigned space groups.46,50 Missed symmetry will generally increase the Z′ of the structure. One would therefore expect that LSS structures with Z′ = 1 are less likely to contribute to peak 1 than Z′ > 1 structures. Fig. 11b plots the same data as Fig. 8b with contributions from Z′ = 1 and Z′ = 2 structures highlighted blue and gold, respectively. As anticipated, peak 1 is less prominent in Z′ = 1 (gold) relative to peaks 2 and 3 and more prominent for Z′ = 2 structures. The remaining contribution to peak 1 for Z′ ≠ 1, 2 is structures containing only pseudo-spherical molecules on special positions as discussed earlier; these have Z′ < 1 due to the molecules occupying special positions.
We believe that a significant portion of peak 2 is due to structures erroneously refined in a subgroup of the true space group. This results in many ill-defined degrees of freedom being varied during structure refinement which leads to a small but non-zero RMS. To support this conclusion, a subset of entries was extracted from the peak 2 region of Fig. 8b containing the first 100 entries with RMS > 0.04 Å; this RMS region has the lowest overlap with peaks 1 and 3. For each entry, available literature data was consulted to judge whether they were PSTG. This included assessment of any specific rationalisation for space group choice in the publication and ESI,† comparison of R-factors for refinements in different space groups, analysis of reported Flack parameters, or visualisation in Mercury. Of the 100 entries, only 15 gave strong evidence for the choice of the lower-symmetry space group. For example, entry QOBNAY was re-examined by the same group who originally reported a C2/c structure, and the observation of an SHG signal suggested a Cc space group choice. For 6 entries, the evidence wasn't clear enough to make a judgement on the space group choice. The remaining 79 structures are cases that we believe have been assigned an incorrect space group. 33 of these have already been corrected in other places (22 by Marsh, 4 by Brock, 4 by Clemente and 3 by others). The remaining 46 are potential PSTG structures. Integrating peak 2 in Fig. 8b suggests it represents around 2600 structures. If the ∼80% probability of structures being PSTG applies to the whole of peak 2 this would imply around 2000 PSTG entries.
Of the 100 peak 2 entries examined in detail, 26 have space group P1. This is a much higher proportion than the 8% of the polar CSD structures that crystallise in P1 (approximately ×3). Fig. 11c shows the RMS displacement distribution of just the P1-derived HSS structures in our database. Here, peak 2 is much larger relative to the other peaks in the distribution compared to the earlier Fig. 8c (which includes all polar space groups). As 8% of the polar structures in the CSD have P1 symmetry and there are ∼2600 structures in peak 2 of Fig. 8b, we might expect 204 P1 entries in this region in Fig. 11c. Integrating, we find 663 entries, again around ×3 that naively expected.
A significant experimental factor that leads to incorrect space group assignment is the presence of symmetry elements that don't lead to systematic absences: mirror planes, proper rotation axes and inversion centres. Space groups with too low symmetry may then be chosen at the start of the analysis (perhaps to avoid early merging of reflections) and propagate through to the final solution without appropriate symmetry checks. Common group–subgroup pairs where this can occur include P21/m → P21, C2/c → Cc, Cmca → Cmc21 and, most notoriously, P![[1 with combining macron]](https://www.rsc.org/images/entities/char_0031_0304.gif) → P1. These pairs are generally made up of one non-polar and one polar space group. We can infer from this that there might be fewer PSTG structures amongst non-polar structures. Running FERROSCOPE on all non-polar structures in the CSD results in the RMS distribution of Fig. 11d (3% hit rate compared to 11% for polar structures). Peak 2 is absent from the RMS distribution, which provides strong additional support that it contains many PSTG structures. We also find that the 100-entry peak 2 subset discussed above contains 62 cases with predicted space group changes that lead to no change in systematic absences.
→ P1. These pairs are generally made up of one non-polar and one polar space group. We can infer from this that there might be fewer PSTG structures amongst non-polar structures. Running FERROSCOPE on all non-polar structures in the CSD results in the RMS distribution of Fig. 11d (3% hit rate compared to 11% for polar structures). Peak 2 is absent from the RMS distribution, which provides strong additional support that it contains many PSTG structures. We also find that the 100-entry peak 2 subset discussed above contains 62 cases with predicted space group changes that lead to no change in systematic absences.
This discussion does not mean that all structures in peaks 1 and 2 regions are incorrect; there may be valid reasons for the choice of lower symmetry. However, our observations suggest there are still many database entries that need a more rigorous check in the vein of Marsh, Clemente, Brock and others. For the specific purpose of identifying potentially useful molecular ferroelectrics we choose to ignore structures in the peak 2 region. If they represent PSTG cases they will likely be non-polar and not of interest. If they do have polar space groups, the small atomic displacements are likely to lead to low saturation polarisation.
Observations on real systems
While the principal focus of this article is on symmetry methods for identifying potential new ferroelectrics from the CSD, we present here two examples which show how the method helps identify materials that undergo polar to non-polar phase transitions of the type anticipated. Others will be described in future publications.Tris(t-butylammonium)trimetaphosphate is a salt formed from three protonated t-butylammonium cations and one trimetaphosphate anion.64 The CSD structure (refcode IVEXAL) measured at 175 K has a hexagonal cell (space group P63) with cell parameters a = 14.9451(8) Å and c = 7.0849(4) Å. The structure is layered and contains triangles of t-butylammoniums in the ac-plane (Fig. 12a). Trimetaphosphate ions are positioned at z ≈ 0.5, midway between these layers. Each trimetaphosphate anion forms N–H⋯O hydrogen bonds with nine t-butylammoniums: one to each cation in the triangles above and below and three to adjacent triangles in the ab-plane. This arrangement leads to channels along the c-axis where disordered solvent molecules may reside, which were described by SQUEEZE/PLATON in the reported structure. The polarisation arises from the parallel dipoles along the c-axis of trimetaphosphate which has 3m (C3v) point symmetry.
 | ||
| Fig. 12 a) Unit cell and b) relative thermal expansion data of tris(t-butylammonium)trimetaphosphate. c) The two conformations of trimetaphosphate: polar C3v (pink) and higher symmetry D3h (red). d) Surface plot of variable temperature PXRD data of tetraethylammonium tetrachloroferrate(III) on warming and cooling between 106 K and 439 K. Peak intensities are represented with an artificial colour map: low intensity is blue and high intensity is orange. e) Rietveld fit to data recorded at 439 K of the new high temperature cubic phase of tetraethylammonium tetrachloroferrate(III) showing the observed (blue), calculated (red) and difference curves (grey). f) Room temperature and g) high temperature unit cells. | ||
FERROSCOPE predicts a high symmetry phase in space group P63/m. This symmetry is achieved by flattening the 6-membered P3O3 ring of trimetaphosphate onto the new mirror plane. This increases the point symmetry to non-polar m (D3h), Fig. 12c. The t-butylammonium cations undergo only minor distortions.
To investigate this predicted symmetry-raising phase transition, variable temperature powder X-ray diffraction (PXRD) data were collected between 150 and 400 K on warming and cooling. Cell parameters were extracted by performing Rietveld refinements at each temperature using the literature structure. These are plotted in Fig. 12b and show a significant gradient change at 327 K, suggesting a phase transition. The transition shows continuous character: the diffraction peaks move smoothly with temperature through the transition and we observed no hysteresis in the phase transition temperature on cooling.
We believe this observed transition is the one predicted by FERROSCOPE. This predicted single-irrep Γ1− transition has the potential to be continuous which is consistent with the PXRD observations. Also, the c-axis changes more dramatically than the a-axis, in keeping with the predicted distortion of trimetaphosphate. The predicted conformation change of the trimetaphosphate ion could be real or represent dynamic disorder as in the notable ferroelectric diisopropylammonium bromide.86,87 Further structural and dielectric analysis has not been performed due to the hygroscopicity of the crystals. The structure of tris(t-butylammonium)trimetaphosphate hydrate was solved by SXRD (CCDC reference 2453734).
Tetraethylammonium tetrachloroferrate(III) is a salt formed from tetraethylammonium (Et4N+) cations and FeCl4− anions in a 1:1 ratio. Previous studies have revealed it exhibits three polar crystal structures between 110 and 290 K (labelled A–C).102 FERROSCOPE predicts a further symmetry-raising phase transition for the room temperature structure (refcodes TABPIV,103 TABPIV01,104 TABPIV05102) which crystallises in P63mc with cell parameters a = 8.2154(4) Å and c = 13.1872(8) Å.
In the room temperature phase C (Fig. 12f), the FeCl4− tetrahedra are positioned with one three-fold axis parallel to the c-axis. The Et4N+ cations are disordered such that they have a pseudo-tetrahedral shape with a three-fold axis parallel to c. This creates a polarisation along c. For TABPIV01, FERROSCOPE predicts a high-symmetry structure with space group P63/mmc and the same unit cell. This structure represents a hexagonal structure (ABAC layer pattern) isotypical to NiAs, with the Fe of FeCl4− on the Ni 2a sites and N of Et4N+ on the As 2c site. Ferroelectric switching would be facilitated by cooperative rotations of FeCl4− and Et4N+.
Variable temperature PXRD data collected between 106 K and 439 K (Fig. 12d) replicates the previously-reported low temperature phase transitions and reveals a new high temperature phase transition (to a new phase which we label D). At 420 K, the diffraction pattern changes abruptly showing discontinuous character: the number of peaks reduces significantly and none of the peaks are continuous across the transition. This new high-temperature structure has higher symmetry and its powder pattern suggests it is structurally unrelated to the room temperature structure, which indicates that it is not the FERROSCOPE-predicted transition that actually occurs.
Indexing a diffraction pattern recorded at 439 K gave a cubic cell with cell parameter: a = 7.56 Å. Our structural model was based on the CsCl structure; two interpenetrating primitive cubic lattices. FeCl4− anions were placed on the corners of a Pmm primitive cubic cell with three degrees of rotational freedom. A semi-rigid body of Et4N+ was placed at (0.5, 0.5, 0.5) and similarly had three degrees of rotational freedom. Atomic occupancies were set to 1/48 apart from Fe and N due to their location on special positions. Repeated cycles of randomisation and Rietveld refinement were performed and led to a final structure that gave an Rwp of 9.88% (Fig. 12e). The calculated pattern fits the experimental pattern well considering the extreme disorder at this high temperature.
This structure (Fig. 12g) is isostructural with the high temperature structure of published ferroelectric tetramethylammonium (Me4N+) tetrachloroferrate(III).105 This has cell parameter a = 6.81(3) Å and the difference in cell parameter is caused by the larger size of Et4N+ over Me4N+. This non-FERROSCOPE-predicted transition does not rule out tetraethylammonium tetrachloroferrate(III) as a potential ferroelectric.
Conclusions
We have described a program, FERROSCOPE, which searches for higher crystal symmetries in the CSD as a proxy for identifying potential molecular ferroelectrics. It is able to automatically identify 84% of a representative sample of 156 known ferroelectrics from the literature. Analysis of the approximately 150000 polar structures in the CSD (Sep24 release) suggests 17000 higher symmetry structures – around 11% of the total. These structures are automatically superimposed by FERROSCOPE to visualise the suggested transitions so the user can assess their chemical plausibility. The structures identified by FERROSCOPE will include new molecular ferroelectrics that may prove to be key components of next-generation electronic devices. Two test cases have shown that FERROSCOPE is successful in identifying polar CSD structures with non-polar pseudo-symmetry that lead to new experimentally verified phase transitions. FERROSCOPE is also successful in identifying pseudo-symmetry in crystals with incorrectly assigned space groups in the CSD. We automatically identify 97% of the PSTG structures suggested by Brock.50–52 The method shouldn't be used to replace careful expert inspection of structures, but suggests around 2000 PSTG CSD entries.
Data availability
We declare that the data supporting this study are available within the paper and its ESI† file. The code for FERROSCOPE can be found at https://github.com/SamYT-dur/FERROSCOPE. Raw data files are available from the corresponding author. Tris(t-butylammonium)trimetaphosphate hydrate has been submitted to the CSD (CCDC 2453734).Author contributions
S. Y. Thompson – software, data curation, formal analysis, investigation, visualisation, writing – original draft. H. T. Stokes – FINDSYM software. B. J. Campbell – FINDSYM software, writing – review and editing. E. Goldberg – software. J. S. O. Evans – conceptualization, software, investigation, supervision, writing – original draft.Conflicts of interest
There are no conflicts to declare.Acknowledgements
We are grateful to Prof. Ivana Evans for suggestions during the project's conceptualisation and execution and Prof. Carolyn Pratt Brock for useful discussions on PSTG structures. We thank Dr. Jason Cole for providing a CSD Python API implementation of his topology labelling routine. SYT is grateful to Durham University and the EPSRC for a PhD Studentship.References
- Y. Arimoto and H. Ishiwara, MRS Bull., 2004, 29, 823–828 CrossRef CAS.
- J. F. Scott, Science, 2007, 315, 954–959 CrossRef CAS PubMed.
- M. Senn, D. Keen, T. Lucas, J. Hriljac and A. Goodwin, Phys. Rev. Lett., 2016, 116, 207602 CrossRef CAS PubMed.
- A. R. Von Hippel, R. G. Breckenridge, A. P. De Bretteville, J. M. Brownlow, F. G. Chesley, G. Oster, L. Tisza and W. B. Westphal, Report/Massachusetts Institute of Technology, Laboratory for Insulation Research, 1944, p. 94 Search PubMed.
- J. Valasek, Phys. Rev., 1921, 17, 475–481 CrossRef CAS.
- E. Sawaguchi, J. Phys. Soc. Jpn., 1953, 8, 615–629 CrossRef CAS.
- S. Han, Y. Ma, L. Hua, L. Tang, B. Wang, Z. Sun and J. Luo, J. Am. Chem. Soc., 2022, 144, 20315–20322 CrossRef CAS PubMed.
- J. Bae and S. Chang, Funct. Compos. Struct., 2019, 1, 012003 CrossRef CAS.
- W. Xia and Z. Zhang, IET Nanodielectrics, 2018, 1, 17–31 CrossRef.
- R. Dallaev, T. Pisarenko, D. Sobola, F. Orudzhev, S. Ramazanov and T. Trca, Polymer, 2022, 14, 4793 CAS.
- S. Horiuchi, Y. Tokunaga, G. Giovannetti, S. Picozzi, H. Itoh, R. Shimano, R. Kumai and Y. Tokura, Nature, 2010, 463, 789–797 CrossRef CAS PubMed.
- S. Horiuchi, K. Kobayashi, R. Kumai and S. Ishibashi, Nat. Commun., 2017, 8, 14426 CrossRef CAS PubMed.
- Y. Tang, P. Li, W. Zhang, H. Ye, Y. You and R. Xiong, J. Am. Chem. Soc., 2017, 139, 13903–13908 CrossRef CAS PubMed.
- Z. Sun, X. Yi, K. Tao, C. Ji, X. Liu, L. Li, S. Han, A. Zheng, M. Hong and J. Luo, Angew. Chem., Int. Ed., 2018, 57, 9833–9837 CrossRef CAS PubMed.
- Y. Noda, T. Yamada, K. Kobayashi, R. Kumai, S. Horiuchi, F. Kagawa and T. Hasegawa, Adv. Mater., 2015, 27, 6475–6481 CrossRef CAS PubMed.
- W. Liao, D. Zhao, Y. Tang, Y. Zhang, P. Li, P. Shi, X. Chen, Y. You and R. Xiong, Science, 2019, 363, 1206–1210 CrossRef CAS PubMed.
- P. P. Shi, Y. Y. Tang, P. F. Li, W. Q. Liao, Z. X. Wang, Q. Ye and R. G. Xiong, Chem. Soc. Rev., 2016, 45, 3811–3827 RSC.
- A. S. Tayi, A. Kaeser, M. Matsumoto, T. Aida and S. I. Stupp, Nat. Chem., 2015, 7, 281–294 CrossRef CAS PubMed.
- Q. Pan, Z. Gu, R. Zhou, Z. Feng, Y. Xiong, T. Sha, Y. You and R. Xiong, Chem. Soc. Rev., 2024, 53, 5781–5861 RSC.
- S. Horiuchi and Y. Tokura, Nat. Mater., 2008, 7, 357–366 CrossRef CAS PubMed.
- S. Abrahams, Acta Crystallogr., Sect. B: Struct. Sci., 1999, 55, 494–506 CrossRef PubMed.
- S. Abrahams, Acta Crystallogr., Sect. B: Struct. Sci., 2003, 59, 541–556 CrossRef CAS PubMed.
- S. Abrahams, Acta Crystallogr., Sect. B: Struct. Sci., 2007, 63, 257–269 CrossRef CAS PubMed.
- S. Abrahams, Acta Crystallogr., Sect. B: Struct. Sci., 2006, 62, 26–41 CrossRef CAS PubMed.
- S. Abrahams, Acta Crystallogr., Sect. B: Struct. Sci., 2000, 56, 793–804 CrossRef PubMed.
- S. Abrahams, Acta Crystallogr., Sect. B: Struct. Sci., 1990, 46, 311–324 CrossRef.
- S. Abrahams, Acta Crystallogr., Sect. B: Struct. Sci., 1989, 45, 228–232 CrossRef.
- S. Abrahams, Acta Crystallogr., Sect. B: Struct. Sci., 1988, 44, 585–595 CrossRef.
- S. Abrahams, K. Mirsky and R. Nielson, Acta Crystallogr., Sect. B: Struct. Sci., 1996, 52, 806–809 CrossRef.
- S. Abrahams, Acta Crystallogr., Sect. B: Struct. Sci., 2010, 66, 173–183 CrossRef CAS PubMed.
- S. Abrahams, Acta Crystallogr., Sect. B: Struct. Sci., 2008, 64, 426–437 CrossRef CAS PubMed.
- E. Dypvik Sødahl, S. Seyedraoufi, C. H. Görbitz and K. Berland, Cryst. Growth Des., 2023, 23, 8607–8619 CrossRef.
- T. E. Smidt, S. A. Mack, S. E. Reyes-Lillo, A. Jain and J. B. Neaton, Sci. Data, 2020, 7, 72 CrossRef PubMed.
- R. Taylor and P. Wood, Chem. Rev., 2019, 119, 9427–9477 CrossRef CAS PubMed.
- K. Kersten, R. Kaur and A. Matzger, IUCrJ, 2018, 5, 124–129 CrossRef CAS PubMed.
- A. J. Cruz-Cabeza and J. Bernstein, Chem. Rev., 2014, 114, 2170–2191 CrossRef CAS PubMed.
- C. R. Taylor and G. M. Day, Cryst. Growth Des., 2018, 18, 892–904 CrossRef CAS PubMed.
- A. M. Healy, Z. A. Worku, D. Kumar and A. M. Madi, Adv. Drug Delivery Rev., 2017, 117, 25–46 CrossRef CAS PubMed.
- H. D. Clarke, K. K. Arora, H. Bass, P. Kavuru, T. T. Ong, T. Pujari, L. Wojtas and M. J. Zaworotko, Cryst. Growth Des., 2010, 10, 2152–2167 CrossRef CAS.
- M. L. Verdonk, J. C. Cole and R. Taylor, J. Mol. Biol., 1999, 289, 1093–1108 CrossRef CAS PubMed.
- F. X. Talamas, G. Ao-Ieong, K. A. Brameld, E. Chin, J. de Vicente, J. P. Dunn, M. Ghate, A. M. Giannetti, S. F. Harris, S. S. Labadie, V. Leveque, J. Li, A. S. T. Lui, K. L. McCaleb, I. Nájera, R. C. Schoenfeld, B. H. Wang and A. Wong, J. Med. Chem., 2013, 56, 3115–3119 CrossRef CAS PubMed.
- S. Gómez-Coca, E. Cremades, N. Aliaga-Alcalde and E. Ruiz, Inorg. Chem., 2014, 53, 676–678 CrossRef PubMed.
- C. Schober, K. Reuter and H. Oberhofer, J. Phys. Chem. Lett., 2016, 7, 3973–3977 CrossRef CAS PubMed.
- R. Marsh, Acta Crystallogr., Sect. B: Struct. Sci., 2009, 65, 782–783 CrossRef CAS PubMed.
- R. Marsh, Acta Crystallogr., Sect. B: Struct. Sci., 2005, 61, 359 CrossRef PubMed.
- R. Marsh, Acta Crystallogr., Sect. B: Struct. Sci., 1999, 55, 931–936 CrossRef PubMed.
- D. Clemente and A. Marzotto, Acta Crystallogr., Sect. B: Struct. Sci., 2004, 60, 287–292 CrossRef PubMed.
- D. Clemente, Tetrahedron, 2003, 59, 8445–8455 CrossRef CAS.
- D. Clemente and A. Marzotto, Acta Crystallogr., Sect. B: Struct. Sci., 2003, 59, 43–50 CrossRef PubMed.
- C. Brock, Acta Crystallogr., Sect. B: Struct. Sci., Cryst. Eng. Mater., 2022, 78, 576–588 CrossRef CAS PubMed.
- C. Brock, Helv. Chim. Acta, 2023, 106, e202200170 CrossRef.
- C. Brock, Cryst. Growth Des., 2024, 24, 6211–6217 CrossRef CAS.
- A. Spek, J. Appl. Crystallogr., 2003, 36, 7–13 CrossRef CAS.
- A. Spek, Acta Crystallogr., Sect. D: Biol. Crystallogr., 2009, 65, 148–155 CrossRef CAS PubMed.
- C. Capillas, E. Tasci, G. de la Flor, D. Orobengoa, J. Perez-Mato and M. Aroyo, Z. Kristallogr. – Cryst. Mater., 2011, 226, 186–196 CrossRef CAS.
- R. Baggio, Acta Crystallogr., Sect. C: Struct. Chem., 2019, 75, 837–850 CrossRef CAS PubMed.
- R. Baggio, Acta Crystallogr., Sect. C: Struct. Chem., 2020, 76, 258–268 CrossRef CAS PubMed.
- A. Gavezzotti, CrystEngComm, 2008, 10, 389–398 CAS.
- A. Collins, R. Cooper and D. Watkin, J. Appl. Crystallogr., 2006, 39, 842–849 CrossRef CAS.
- C. Brock and R. Taylor, Acta Crystallogr., Sect. B: Struct. Sci., Cryst. Eng. Mater., 2020, 76, 630–642 CrossRef CAS PubMed.
- N. Somov and E. Chuprunov, Crystallogr. Rep., 2009, 54, 727–733 CrossRef CAS.
- T. Rekis, Acta Crystallogr., Sect. B: Struct. Sci., Cryst. Eng. Mater., 2020, 76, 307–315 CrossRef CAS PubMed.
- H. T. Stokes and D. M. Hatch, J. Appl. Crystallogr., 2005, 38, 237–238 CrossRef CAS.
- M. Bozorgvar, A. Tarahhomi and A. van der Lee, Appl. Chem. Today, 2021, 16, 95–106 Search PubMed.
- G. W. Stinton and J. S. O. Evans, J. Appl. Crystallogr., 2007, 40, 87–95 CrossRef CAS PubMed.
- C. A. Swenson, J. Phys. Chem. Ref. Data, 1983, 12, 179–182 CrossRef CAS.
- K. Wang and R. R. Reeber, Philos. Mag. A, 2000, 80, 1629–1643 CAS.
- A. A. Coelho, J. S. O. Evans, I. R. Evans, A. Kern and S. Parsons, Powder Diffr., 2011, 26, S22–S25 CrossRef CAS.
- A. A. Coelho, J. Appl. Crystallogr., 2018, 51, 210–218 CrossRef CAS.
- R. E. Dinnebier, A. Leineweber and J. S. O. Evans, Rietveld refinement: practical powder diffraction pattern analysis using TOPAS, De Gruyter, Berlin, 2018 Search PubMed.
- O. V. Dolomanov, L. J. Bourhis, R. J. Gildea, J. A. K. Howard and H. Puschmann, J. Appl. Crystallogr., 2009, 42, 339–341 CrossRef CAS.
- J. S. O. Evans and S. Y. Thompson, FERROSCOPE, https://github.com/SamYT-dur/FERROSCOPE, (accessed April, 2025) Search PubMed.
- Y. Zhang, W. Zhang, S. H. Li, Q. Ye, H. L. Cai, F. Deng, R. G. Xiong and S. P. D. Huang, J. Am. Chem. Soc., 2012, 134, 11044–11049 CrossRef CAS PubMed.
- C. Widdifield, J. Farrell, J. Cole, J. Howard and P. Hodgkinson, Chem. Sci., 2020, 11, 2987–2992 RSC.
- C. Widdifield, H. Robson and P. Hodgkinson, Chem. Commun., 2016, 52, 6685–6688 RSC.
- H. Maluszynska, P. Czarnecki, S. Lewicki, J. Wasicki and M. Gdaniec, J. Phys.: Condens. Matter, 2001, 13, 11053–11065 CrossRef CAS.
- Y. Kamishina, Y. Akishige and M. Hashimoto, J. Phys. Soc. Jpn., 1991, 60, 2147–2150 CrossRef CAS.
- L. A. K. Staveley, Annu. Rev. Phys. Chem., 1962, 13, 351–368 CrossRef CAS.
- Y. Y. Tang, P. F. Li, W. Q. Liao, P. P. Shi, Y. M. You and R. G. Xiong, J. Am. Chem. Soc., 2018, 140, 8051–8059 CrossRef CAS PubMed.
- Z. H. Wei, Z. T. Jiang, X. X. Zhang, M. L. Li, Y. Y. Tang, X. G. Chen, H. Cai and R. G. Xiang, J. Am. Chem. Soc., 2020, 142, 1995–2000 CrossRef CAS PubMed.
- H. Y. Ye, Y. Y. Tang, P. F. Li, W. Q. Liao, J. X. Gao, X. N. Hua, H. Cai, P. P. Shi, Y. M. You and R. G. Xiong, Science, 2018, 361, 151–155 CrossRef CAS PubMed.
- Y. You, Y. Tang, P. Li, H. Zhang, W. Zhang, Y. Zhang, H. Ye, T. Nakamura and R. Xiong, Nat. Commun., 2017, 8, 14934 CrossRef CAS PubMed.
- S. Ong, W. Richards, A. Jain, G. Hautier, M. Kocher, S. Cholia, D. Gunter, V. Chevrier, K. Persson and G. Ceder, Comput. Mater. Sci., 2013, 68, 314–319 CrossRef CAS.
- R. Todeschini and V. Consonni, in Handbook of Chemoinformatics, 2003, ch. 37, pp. 1004–1033 Search PubMed.
- RDKit: Open-source cheminformatics, https://www.rdkit.org, (accessed December, 2024) Search PubMed.
- D. W. Fu, H. L. Cai, Y. M. Liu, Q. Ye, W. Zhang, Y. Zhang, X. Y. Chen, G. Giovannetti, M. Capone, J. Y. Li and R. G. Xiong, Science, 2013, 339, 425–428 CrossRef CAS PubMed.
- A. Piecha, A. Gagor, R. Jakubas and P. Szklarz, CrystEngComm, 2013, 15, 940–944 RSC.
- D. W. Fu, W. Zhang, H. L. Cai, J. Z. Ge, Y. Zhang and R. G. Xiong, Adv. Mater., 2011, 23, 5658–5662 CrossRef CAS PubMed.
- H. L. Morgan, J. Chem. Doc., 1965, 5, 107–113 CrossRef CAS.
- J. C. Cole, J. W. Yao, G. P. Shields, W. D. S. Motherwell, F. H. Allen and J. A. K. Howard, Acta Crystallogr., Sect. B: Struct. Sci., 2001, 57, 88–94 CrossRef CAS PubMed.
- C. Macrae, I. Sovago, S. Cottrell, P. Galek, P. McCabe, E. Pidcock, M. Platings, G. Shields, J. Stevens, M. Towler and P. Wood, J. Appl. Crystallogr., 2020, 53, 226–235 CrossRef CAS PubMed.
- K. Aizu, Phys. Rev. B: Solid State, 1970, 2, 754–772 CrossRef.
- S. Miller and W. Love, Tables of Irreducible Representations of Space Groups and Co-Representations of Magnetic Space Groups, Pruett, Boulder, 1967 Search PubMed.
- A. Cracnkell, B. Davies, S. Miller and W. Love, Kronecker Product Tables, Plenum, New York, 1979, vol. 1 Search PubMed.
- H. T. Stokes, D. M. Hatch and B. J. Campbell, ISOTROPY Software Suite, https://iso.byu.edu, (accessed December, 2024) Search PubMed.
- J. F. Scott, J. Phys.: Condens. Matter, 2007, 20, 021001 CrossRef.
- L. Henling and R. Marsh, Acta Crystallogr., Sect. C: Struct. Chem., 2014, 70, 834–836 CrossRef CAS PubMed.
- R. Marsh, M. Kapon, S. Hu and F. Herbstein, Acta Crystallogr., Sect. B: Struct. Sci., 2002, 58, 62–77 CrossRef PubMed.
- P. Gilli, V. Bertolasi, V. Ferretti and G. Gilli, J. Am. Chem. Soc., 1994, 116, 909–915 CrossRef CAS.
- V. Ghazaryan, M. Fleck and A. Petrosyan, Proceedings Volume 7998, International Conference on Laser Physics 2010, 2011, p. 79980F Search PubMed.
- W. Sanjuan-Szklarz, M. Woinska, S. Domagala, P. Dominiak, S. Grabowsky, D. Jayatilaka, M. Gutmann and K. Wozniak, IUCrJ, 2020, 7, 920–933 CrossRef CAS PubMed.
- M. Lutz, Y. Huang, M.-E. Moret and R. J. M. Klein Gebbink, Acta Crystallogr., Sect. C: Struct. Chem., 2014, 70, 470–476 CrossRef CAS PubMed.
- D. Evans, A. Hills, D. Hughes and G. Leigh, Acta Crystallogr., Sect. C: Cryst. Struct. Commun., 1990, 46, 1818–1821 CrossRef.
- Z. Warnke, E. Styczen, D. Wyrzykowski, A. Sikorski, J. Klak and J. Mrozinski, Struct. Chem., 2010, 21, 285–289 CrossRef CAS.
- J. Harada, N. Yoneyama, S. Yokokura, Y. Takahashi, A. Miura, N. Kitamura and T. Inabe, J. Am. Chem. Soc., 2018, 140, 346–354 CrossRef CAS PubMed.
Footnote |
| † Electronic supplementary information (ESI) available: Powder CIF file. See DOI: https://doi.org/10.1039/d5ce00445d |
| This journal is © The Royal Society of Chemistry 2025 |