Enhancing the electronic and photocatalytic properties of (SnO2)n/(TiO2)m oxide superlattices for efficient hydrogen production: a first-principles study†
Najwa
Harrati
*,
Bastien
Casier
and
Adlane
Sayede
 *
*
Univ. Artois, CNRS, Centrale Lille, Univ. Lille, UMR 8181, Unité de Catalyse et de Chimie du Solide (UCCS), F-62300 Lens, France. E-mail: adlane.sayede@univ-artois.fr; najwa.harrati@univ-artois.fr
First published on 29th November 2024
Abstract
The effects of biaxial tensile and compressive strain on the structural, electronic, and photocatalytic properties of tetragonal [001] (SnO2)n/(TiO2)m superlattices have been theoretically explored using density functional theory (DFT) calculations. Various stacking periodicities between n SnO2 layers and m TiO2 layers, including (n = m), (n, 1), and (1, m) were studied in the context of water splitting for hydrogen production. The results reveal that the (1, m) stacking periodicity exhibit the highest bulk modulus, Poisson's ratio, and Debye temperature values. Phonon dispersion analysis showed excellent stability for the (SnO2)3/(TiO2)1 superlattice under both tensile and compressive strains ranging from −5% to 5%, while other superlattices remain stable within the range of −3% to 4%. Furthermore, the electronic analysis revealed a decreasing trend in the band gap for all structures as the tensile strain increases. A tunable band gap from 3.34 eV to 2.54 eV under tensile strains for (SnO2)1/(TiO2)3 was found using the HSE06 functional, exhibiting high carrier mobility. Favorable band edge alignments at pH 0, 7, and 14 highlight the potential of these superlattices as efficient photocatalysts. The results demonstrate that applying tensile strain to (SnO2)n/(TiO2)m superlattices with high TiO2 thickness can result in optimal band gap values and favorable band edge alignments with the water redox potentials. This makes these superlattices promising for hydrogen production from water splitting.
1. Introduction
As industrial and societal advancements continue, public attention has increasingly focused on concerns surrounding energy shortages and environmental pollution. One potential solution to tackle this challenge involves the conversion of low-density solar energy into high-density chemical energy through the use of photocatalytic technology, which does not emit greenhouse gases. In this regard, the production of hydrogen from water splitting has been demonstrated as a promising technology for harvesting solar energy, one of the most abundant energy sources available on Earth.1 In general, the performance of photocatalytic processes hinges on three key factors: the characteristics of the used photo-catalytic material, particularly its bandgap energy and band edge positions; the spectrum of light irradiation; and the dynamics of interfacial charge transfer occurring at its surface. In this context, superlattices are becoming increasingly widespread in the photocatalytic field.2–4 They exhibit notable functionalities, including the customization of band gaps, the facilitation of spatial charge separation across various interfaces, the mitigation of charge carriers recombination, and adjustment of absorption spectra towards the visible spectrum.5,6Transition metal oxides have been extensively investigated for their excellent stability and photocatalytic properties.7,8 Among the studied materials, considerable interest has been focused on the binary compounds XO2 (X: Ti and Sn) owing to their chemical and physical characteristics exhibited in the rutile phases (space group no. 136; D144h; P42/mnm). TiO2 is considered the most intensively used and studied photo-catalyst semiconductor, combining several optimistic features, including non-toxic environmental acceptability, low cost, and excellent stability against photo-corrosion.9,10 However, the high recombination of photo-generated charge carriers remains a significant challenge to overall efficiency.11,12 Indeed, SnO2 exhibits superior electron mobility and high electron transfer efficiency,13 thereby preventing rapid electron/hole recombination, but the conduction band minimum (CBM) positioned above the redox potential level of H+/H2 (0 eV) presents a complication that restricts its widespread application as a photo-catalyst for the hydrogen evolution reaction (HER).14 Moreover, these materials have wide direct band gap energies (TiO2, Eg = 3.1–3.3 eV; SnO2, Eg = 3.6 eV) that limit their absorption under UV irradiation, allowing them to use only 3–5% of the solar spectrum. Nowadays, several experimental and theoretical investigations have demonstrated the potential for strain induced alteration or adjustment of the band gap in TiO2 and SnO2 materials.15,16 For example, the effect of biaxial strain applied to the bc plane of SnO2 has been investigated experimentally and theoretically on Al2O3 substrates with the HSE06 approximation by Wei Zhou.17 Their results pointed out that the optical band gap reduces by 0.7 eV with increasing tensile strain. There are limited studies on SnO2/TiO2 superlattice, and those which do exist are focused on the photocatalytic performance for degradation of methyl blue dye under UV irradiation. Recently, experimental study on SnO2/TiO2 heterostructures with anatase TiO2 and kesterite SnO2 phases proved that the energy band gap of TiO2 and SnO2 in the heterojunction have lower energy band gap compared to their individual metal oxides.18 However, theoretical investigations on such superlattices under strain effects are still limited, and thus there is a lot yet to be explored regarding biaxial strain in the ab plane.
In the present study, the effect of biaxial tensile and compressive strains on the photoelectrochemical properties of (SnO2)(n)/(TiO2)(m) superlattices, obtained by stacking n layers of SnO2 with m layers of TiO2 (n and m = 1, 2, 3), was investigated using ab initio density functional theory (DFT) calculations. Our primary focus was to investigate the effects of n/m thickness periodicity along the [001] direction on the dynamics, mechanical stability, lattice geometry, electronic, mechanical and photocatalytic properties of (SnO2)(n)/(TiO2)(m) superlattices. In addition, our secondary objective was to investigate the influence of biaxial tensile and compressive strains ranging from −5% to 5% with a step of 1% on the said properties of these superlattices.
2. Computational details
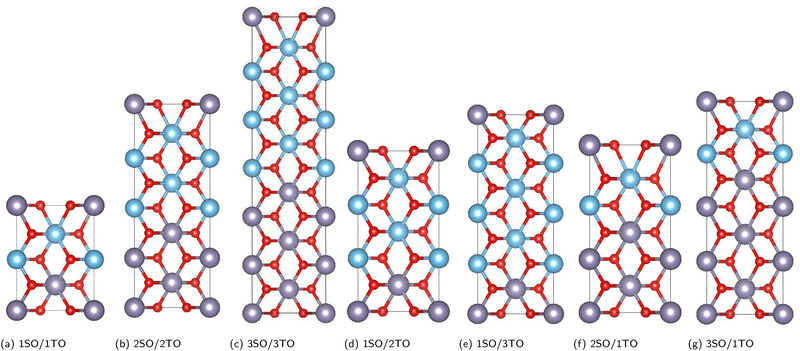
The influence of the biaxial tensile and compressive strains on a set of (SnO2)(n)/(TiO2)(m) [nSO/mTO] superlattices were investigated using DFT calculations.19,20 Various arrangements involving the stacking of n unit cells of SnO2 (SO) with m unit cells of TiO2 (TO) (n, m = 1, 2, 3) were explored, resulting in diverse combinations of nSO/mTO layers.The studied structures are presented in Fig. 1, the biaxial strain was considered from −5% (4.430 Å) to 5% (4.900 Å) and was defined as:
 | (1) |
3. Results and discussion
3.1. Structural properties of the superlattices
Initially, a fully structural relaxation was performed for both rutile phases of SnO2 and TiO2, which have served as building blocks of our superlattices. The lattice parameters obtained for both SnO2 and TiO2 were found to be in good agreement with experimental values, as shown in Table S1 (referred in the ESI†).The optimization of both unstrained and strained superlattice structures was carried out at the same theoretical level. For each system, varying levels of biaxial strain were applied to explore the impact on total energy with changes in the out-of-plane lattice parameter c. The stability of the structures was assessed by analyzing the total energy as a function of volume E(V) across seven superlattices, as shown in Fig. 1. The equilibrium parameter c and volume were ascertained by fitting data to the Birch–Murnaghan third-order equation of state (EOS).32 As an example, Fig. 2 illustrates the energy curves  and E(V) for the 1SO/1TO superlattice under both tensile and compressive strains, highlighting the sensitivity of superlattice stability to tetragonal distortion. Detailed results for additional superlattices are presented in the ESI† (Fig. S1–S3).
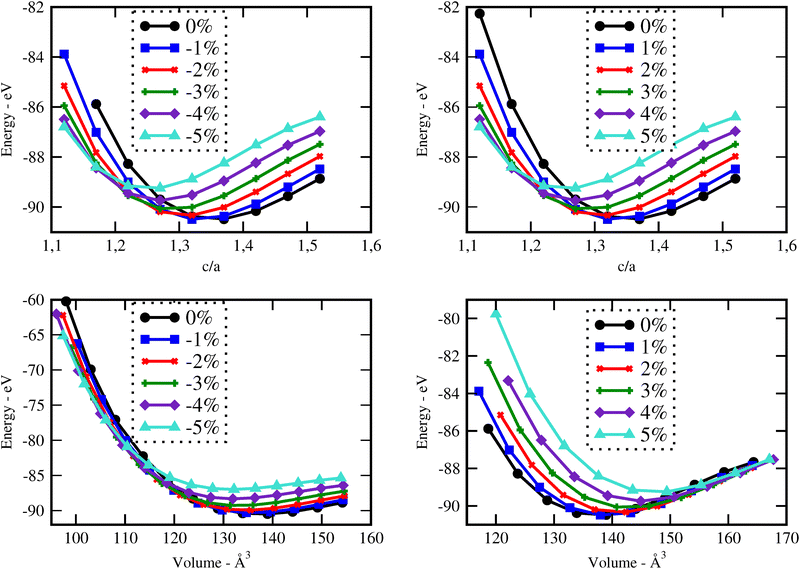 | ||
| Fig. 2 Structure stability of the 1SO/1TO superlattice under compressive (left) and tensile (right) strains. | ||
The calculated lattice parameters and bond angles of unstrained superlattices are presented in Table 1. From this table, it was found that the out of plane lattice constant c0, and its ratio  , increase with increasing SnO2 layers and decrease with increasing TiO2 layers. Furthermore, it is observed that both c0 and
  decrease when the number of layers of both SnO2 and TiO2 increases simultaneously. The
  ratio reflects the tetragonal distortion, the observed increase of this ratio indicates an augmentation of relative displacement between cations and anions. Comparing the bond angles O–Sn–O and O–Ti–O in both (n, 1) and (1,m) superlattices, we find that both angles are larger in (n, 1) systems. This suggests that the distortion of octahedrons in the tetragonal lattice of the (n, 1) superlattices is more significant, which results in a larger
  ratio displacement.
 , and angles are the average values of overall superlattices)
| ε = 0% | Lattice parameters | Angles (°) | ||
|---|---|---|---|---|
| c (Å) | O–Sn–O | O–Ti–O | ||
| 1SO/1TO | 3.1655 | 0.67873 | 88.1401 | 90.1874 |
| 2SO/2TO | 3.1515 | 0.67574 | 88.7057 | 90.7862 |
| 3SO/3TO | 3.1480 | 0.67499 | 88.6243 | 90.3675 |
| 1SO/2TO | 3.0925 | 0.66309 | 87.9621 | 89.9074 |
| 1SO/3TO | 3.0557 | 0.65519 | 87.8890 | 89.8069 |
| 2SO/1TO | 3.2150 | 0.68937 | 88.6952 | 90.6707 |
| 3SO/1TO | 3.2450 | 0.69579 | 88.8401 | 90.7874 |
To investigate the effect of biaxial strain on the structural parameters of unstrained superlattices, the ab plane lattice parameters were varied from −5% to 5%, with a step of 1%. Fig. 3 illustrates the variation of c parameter and volume versus strain for each superlattices. As results, we observe a monotonic decrease in c with increasing strain levels, while the crystal volume increases gradually. At the same time, the average bond lengths d(Sn–O) and d(Ti–O) showed also a reduction under strains, as detailed in Tables S2 and S3 (ESI†). These results suggest that the c axis displays a relatively weak ability to keep the crystal volume constant against biaxial strains, leading to structural and interatomic distances changes. A similar behavior was observed by Wei Zhou and Yanyu Liu when they applied strain on the bc plane of SnO2 bulk.17
 | ||
| Fig. 3 Structure parameters of nSO/mTO superlattices under biaxial strains from −5% to 5%: c parameters (left) and volumes (right). | ||
In Fig. 4, we analysed as well the effect of biaxial strains on the variation of total energy of superlattices using the EOS calculations. Our results show that the superlattices are significantly more susceptible to destabilisation under biaxial compressive strain (i.e., when ε < 0%) compared to their response under tensile strain. Furthermore, most superlattices exhibit their most stable energy states in the absence of strain or at very low strain. An exception to this trend is observed in the 3SO/1TO superlattice, which exhibits remarkable resilience to tensile strains, reaching its optimal energy configuration at a strain of 2%, as detailed in Table S4 (ESI†). This unique behaviour highlights the potential for engineering strain to enhance the stability and performance of specific superlattice configurations.
 | ||
| Fig. 4 The total energy–biaxial strain relationship of nSO/mTO superlattices for different stacking periodicity: (n = m) left, (1, m) middle, and (n, 1) right. | ||
In addition, the total formation energy of the investigated superlattices was computed as described in ref. 33 and 34:
| E = EnSO/mTO − nEbulk(SO) − mEbulk(TO) | (2) |
| Superlattices | Formation energy (eV) |
|---|---|
| 1SO/1TO | 0.2391 |
| 2SO/2TO | 0.3095 |
| 3SO/3TO | 0.3763 |
| 1SO/2TO | 0.1059 |
| 1SO/3TO | 0.0015 |
| 2SO/1TO | 0.4264 |
| 3SO/1TO | 0.6532 |
3.2. Dynamical and mechanical stability of the superlattices
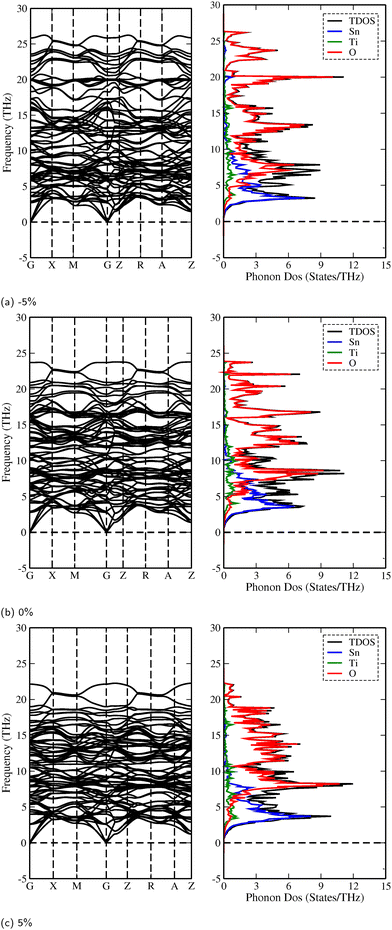
To evaluate the dynamic stability of the superlattices, we calculated phonon dispersion curves along with their corresponding total and partial phonon density of states (PhDOS) at equilibrium volumes. Fig. 5 presents the phonon dispersion curves for the 3SO/1TO superlattice which was subjected to a range of biaxial strains (−5%, 0%, and 5%). Detailed phonon spectra and PhDOS for other strain levels on 3SO/1TO superlattice and other compositions are presented in ESI,† Fig. S4–S10. The absence of negative (or imaginary) frequencies, across strain ranging from −5% to 5%, for the 3SO/1TO superlattice confirms its dynamic stability. For the other compositions, the strains at −5%, −4% and 5% involve the presence of imaginary frequencies, indicating a lattice instability. It is noteworthy that strains from −3% to 4% alter the positions of the optical and acoustic phonon bands, yet without extending into the negative frequency domain. Occasional small negative frequencies (<2 THz) at the point arise from numerical artifacts, rather than physical instabilities.In addition, the PhDOS analysis reveals, for all superlattices, that the vibrational modes at lower frequencies (0 to 8 THz) predominantly originate from the hybridization of Sn and Ti atoms. Conversely, the frequency range from 8 to 25 THz is characterized mainly by the vibrations of O atoms, supplemented by a minor contribution from Ti atoms.
Table 3 presents the highest frequencies observed at the Γ-point in the phonon spectrum for all strained systems. From these data, we observed that tensile strain tends to soften the phonon modes, which can be ascribed to the weakening of atomic bonds (see Tables S2 and S3, ESI†) as the lattice constant increases. Inversely, applying compressive strain involves a shift of phonon modes to higher frequencies, indicative of phonon hardening. It is also noteworthy that both tensile and compressive strains do not influence the contributing states in PhDOS.
| Superlattices | Strain limits (%) | Freq. (THz) |
|---|---|---|
| 1SO/1TO | −3 | 25.55 |
| 4 | 22.27 | |
| 2SO/2TO | −3 | 26.15 |
| 4 | 22.45 | |
| 3SO/3TO | −3 | 26.22 |
| 4 | 23.43 | |
| 1SO/2TO | −3 | 26.16 |
| 4 | 23.12 | |
| 1SO/3TO | −3 | 26.27 |
| 4 | 22.36 | |
| 2SO/1TO | −3 | 25.79 |
| 4 | 22.32 | |
| 3SO/1TO | −5 | 25.71 |
| 5 | 22.09 |
Now, considering the tetragonal symmetry of the superlattices, there are six independent elastic constants (C11, C33, C44, C66, C12, and C13) that characterize the mechanical behavior of these structures. Thus, to assess the mechanical stability of the studied superlattices, we evaluated these elastic constants to determine if they fulfill the Born–Huang stability criteria.35 For this investigation, the unstrained nSO/mTO superlattices served as model systems, and their elastic constants were meticulously calculated. Using the Voigt-Reuss-Hill (VRH) approximation,36,37 we derived the macroscopic mechanical properties including the bulk modulus (B), the shear modulus (G), the Young's modulus (E), the Poisson's ratio (n), and the Debye temperature (θD). The calculated elastic constants are presented in Table S5 (ESI†) and their corresponding mechanical properties are detailed in Table S6 (ESI†). For all examined superlattices, the calculated elastic constants Cij (expressed in GPa) are positive and comply with Born's stability criteria, confirming that the unstrained nSO/mTO superlattices will not mechanically fail when subjected to expected loads and stresses. Moreover, It was observed that the stacking periodicity exerts a more significant influence on the shear elastic constant C44 than on the other elastic constants Cij. This finding underlines the critical role of structural configuration in determining the mechanical properties of these materials.
The bulk modulus (B) quantifies the degree of change in resistance with respect to volume change and indicates its hardness. Our calculations revealed that superlattices containing one (SnO2) layer and three (TiO2) layers (1SO/3TO) possess the highest bulk modulus. In contrast, the inverse configuration (3SO/1TO) exhibits the lowest bulk modulus. The shear modulus (G) is a measure of a materials response to shear stress, reflecting the deformation that occurs when a parallel force is applied to one surface while an opposing surface resists. From the present study, the superlattice comprising one layer of SnO2 and two layers of TiO2 (1SO/2TO) exhibited the greatest shear modulus.
Furthermore, the ductility of nSO/mTO superlattices was assessed using the Pugh criterion and Poisson's ratio (ν) as indicators.38 According to Pugh's criterion, materials with a ratio of bulk modulus (B) to shear modulus (G) greater than 1.75 are likely to manifest ductile behavior, while those with a  ratio less than 1.75 are expected to be brittle. Similarly, materials with a Poisson's ratio greater than 0.26 are generally considered as ductile, whereas those with ν less than 0.26 are typically classified as brittle.39,40 Our calculations revealed a
  ratio greater than 1.75 for superlattices containing more than one TiO2 layer, indicating ductile behavior according to the Pugh criterion (see Fig. 6). Correspondingly, the Poisson's ratio for those superlattices was found to be greater than 0.26, further supporting the prediction of ductile behavior. The agreement between the Pugh criterion and Poisson's ratio can be attributed to the underlying atomic bonding and structural characteristics of the material. In fact, Poisson's ratio provides insights into the nature of atomic bonding. Ionic crystals typically exhibit Poisson's ratios between 0.25 and 0.33, while covalent materials range from 0.10 to 0.25. Our calculated Poisson's ratios, ranging from 0.25 to 0.28, suggest a mixed iono-covalent bonding character. The 1SO/3TO superlattice, which has the highest bulk modulus and
  ratio values, displays a more ionic bonding character than the 3SO/1TO superlattice, which has a more covalent bonding character. The covalent character allows for greater atomic rearrangement and plastic deformation under applied strain, explaining the stability of the 3SO/1TO superlattice under strain ranging from −5% to 5%.
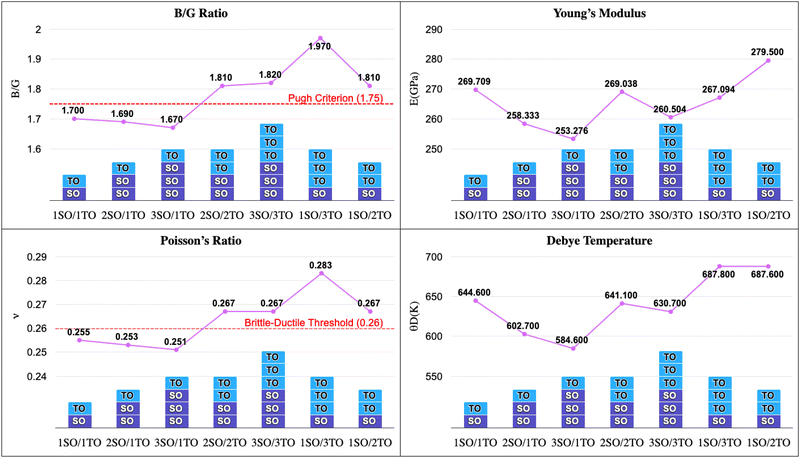 | ||
Fig. 6 Evolution of  ratio, Young's modulus (E), Poisson's ratio (n), and Debye temperature (θD) of unstrained nSO/mTO superlattices for different (n/m) stacking periodicities. ratio, Young's modulus (E), Poisson's ratio (n), and Debye temperature (θD) of unstrained nSO/mTO superlattices for different (n/m) stacking periodicities. | ||
Young's modulus (E) is the ratio between stress and strain, providing a measure of the stiffness of the material. It can be seen from Fig. 6 that 1SO/2TO is the stiffest superlattice, exhibiting the highest value of E. It is also observed that in both (n, 1) and (n = m) configurations, Young's modulus decreases with increased stacking, indicating a reduction in stiffness for these superlattices.
The Debye temperature (θD) can be used as a proxy to quantify structural rigidity. Indeed, a higher θD indicates stronger interatomic bonding and greater structural rigidity, while a lower θD suggests weaker bonding and more anharmonicity in the lattice vibrations.41 By comparing θD of the studied superlattices, we found that the bonding strength in the (1, m) and (n = m) stacking structures is stronger. This suggests that the weaker interatomic bonding contributes to the brittleness in the (n, 1) stacking structures. The 3SO/1TO superlattice presents the lowest θD value and hence a low structural rigidity, confirming our previous findings.
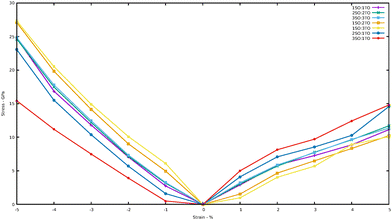
Strain–stress curves under biaxial strain from −5% to 5% are shown in Fig. 7. As expected, the stress increases ‘linearly’ from 1 to 5%. Similarly, for compressive strains from −1% to −5%, the stress increases ‘linearly’ up to a maximum value at −5%. Furthermore, we observed that the resulting stress depends on the composition of the superlattices, particularly on the number of SO layers. The greater the number of SO layers, the higher the stress generated for the same applied strain. This behavior can be directly related to the mechanical properties calculated at 0% (Fig. 6). The decrease in E for nSO/1TO superlattices indicates that these materials are more flexible and deform more easily under strain, leading to higher stress values for nSO/1TO compared to 1SO/nTO. Additionally, the observed decrease in the  , (ν) and (θD) supports this behavior, as the material's tendency to become more brittle with increasing SO layers contributes to the generation of higher stresses when the biaxial strain increases to 5%. While high stresses may limit certain practical applications, these results are particularly interesting for theoretical and applied studies aiming to exploit strain-induced electronic effects in these materials.
3.3. Electronic properties of the superlattices
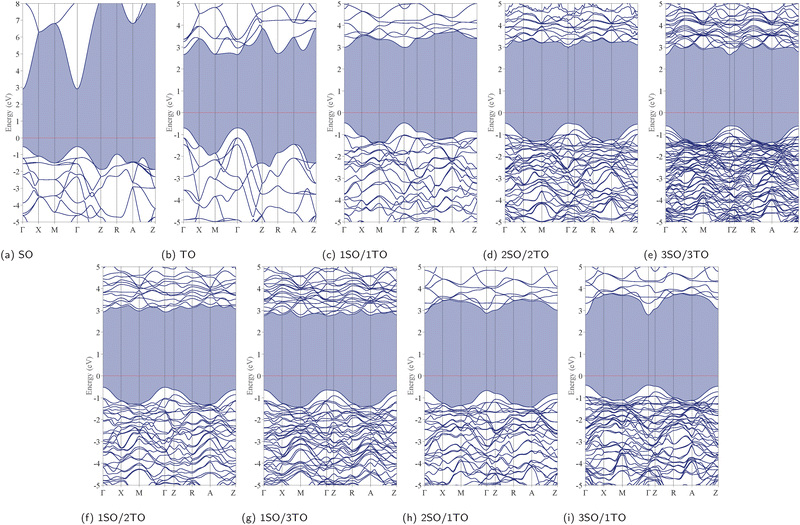
To better understand the impact of stacking configurations (n/m) on the electronic properties of dynamically stable nSO/mTO superlattices, we conducted a comprehensive analysis of their energy band structures and electron density of states (DOS). To do so, We employed the HSE06 functional, renowned for its precision in predicting electronic band structures. In particular, the calculated band gaps for both SnO2 and TiO2 bulks were found to be 3.42 eV and 3.35 eV, respectively. These values closely align with the experimental band gaps of 3.60 eV for SnO242 and 3.10–3.30 eV for TiO2.43,44 It is worth noting that a direct fundamental gap at the Γ-point was confirmed for both materials. The slight deviations observed between our computational results and the experimental data are probably attributed to the inherent limitations of DFT.The band gaps of the unstrained superlattices, as well as bulk SnO2 and TiO2, calculated using PBE, GGA+U, and HSE06 functionals, are presented in Table 4. The three functionals consistently predict similar trends in the variation of band gaps, which exhibit a slight decrease with increasing stacking periodicity. Importantly, the calculated band gap values remained relatively close to those of the parent materials, specifically SnO2 and TiO2, indicating that the stacking periodicity (n/m) has a minimal impact on both the nature and magnitude of the band gap, which continue to lie outside the visible light spectrum. Fig. 8 displays the band structures calculated using the HSE06 functional, which indicate that all superlattices maintain the direct band gap characteristic at the Γ-point.
| System | GGA-PBE (eV) | GGA+U (eV) | HSE06 (eV) | Exp. (eV) |
|---|---|---|---|---|
| SO | 1.121 | 1.204 | 3.423 | 3.60042 |
| TO | 1.834 | 3.211 | 3.353 | 3.100–3.30043,44 |
| 1SO/1TO | 1.820 | 2.850 | 3.455 | |
| 2SO/2TO | 1.765 | 2.142 | 3.438 | |
| 3SO/3TO | 1.668 | 1.912 | 3.253 | |
| 1SO/2TO | 1.817 | 2.363 | 3.448 | |
| 1SO/3TO | 1.807 | 2.307 | 3.335 | |
| 2SO/1TO | 1.849 | 2.903 | 3.532 | |
| 3SO/1TO | 1.545 | 1.712 | 3.208 |
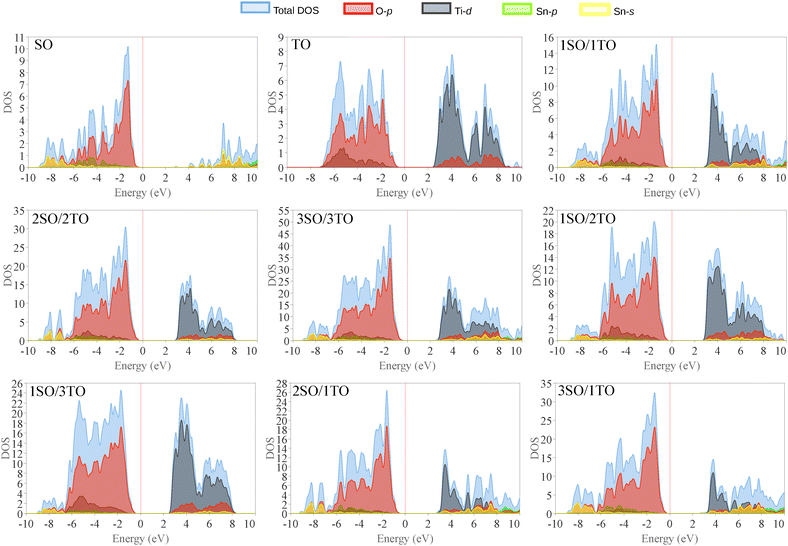
The total and partial DOS (Fig. 9) for both SnO2 and TiO2, as well as for the unstrained nSO/mTO superlattices, indicate that the top of the valence band (VB) in all structures predominantly consists of O(2p) states. In contrast, the conduction band (CB) is primarily composed of Sn(5s), Sn(5p) and/or Ti(3d) states. The presence of O(2p), Sn(5s), Sn(5p), and Ti(3d) states in both the VB and CB suggests a significant degree of hybridization in the metal–oxygen bonds.
To elucidate the relationship between lattice strain and electronic properties of dynamically stable nSO/mTO superlattices, we have calculated band structures, total and partial DOS under biaxial strain, as shown in Fig. S12–S17 (ESI†). The results confirm that the direct bandgap character is preserved for all superlattices under both tensile and compressive strains. Furthermore, analysis of the PDOS curves shows that, neither tensile nor compressive strains affect the nature of the contributing states into valence and conduction bands. Fig. 10 shows the band gap variations under these conditions. The energy levels of the CB minima and VB maxima for these superlattices are summarised in the ESI† (Tables S7–S9). When we examined the band gap evolution of all the studied superlattices, we found that they are significantly affected by biaxial tensile strain, which reduces the band gap values. The 2SO/1TO superlattice exhibited the smallest band gap of 2.33 eV at 4% tensile strain. A comparison of the band structures (Fig. 11) under 0% and 4% tensile strain for this structure shows that while the highest valence subband undergoes minimal change and moves closer to the Fermi level, the lowest conduction subband undergoes more pronounced changes resulting in reduced band gaps. In contrast to the tensile case, compressive strains resulted in a smaller decrease or even an increase in the band gap of the 3SO/1TO superlattice. This finding can be explained by the variation of metal–oxygen bond lengths. Indeed, for all superlattices, except the 3SO/1TO one which has the lowest  ratio, the ‘d(Sn, Ti)–O’ distance along the (110) plane (Fig. S11, ESI†) remains constant with increasing compressive strain. In the case of the 3SO/1TO superlattice, the band gap increases linearly with increasing compressive strain. A similar behavior is observed for the bulk SnO2 and TiO2 systems.
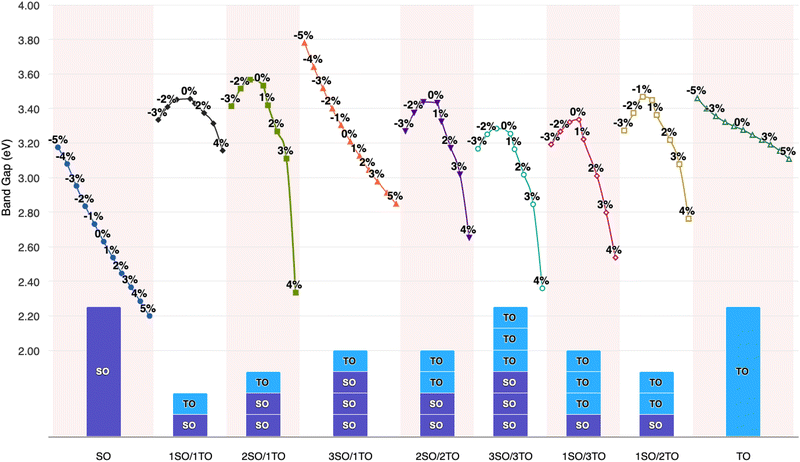 | ||
| Fig. 10 Biaxial strain effect on the band gap of XO2 (X = Sn, Ti) metal oxides and nSO/mTO superlattices. | ||
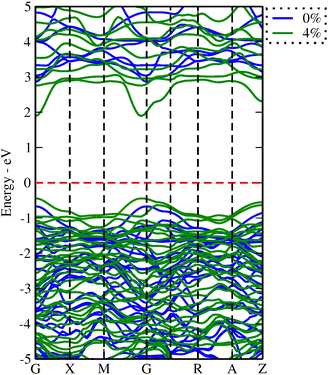 | ||
| Fig. 11 Band structures for the 2SO/1TO under 0% (blue) and 4% (green) tensile strain. The Fermi level is located at 0 electron-volt. | ||
Analysis of the contributions of the Ti-d, Sn-s and O-p orbitals to the DOS of 3SO/1TO (Fig. 12) and other superlattices (Fig. S18–S23, ESI†) showed that the energies of these orbitals in the VB states remain unaffected under both compressive and tensile strains. However, in the CB, under compressive strain these orbitals shift towards the Fermi level for all superlattices, except the 3SO/1TO composition. In this last superlattice, the Ti-d, Sn-s and O-p orbitals move away from the Fermi level, explaining the observed increase in the band gap value shown in Fig. 10. Furthermore, near to VB maxima, the peaks of intensity of partial DOS for the O-2px, O-2py, and O-2pz orbitals exhibit different variation trends. It suggests a distortion in the XO6 (X = Sn, Ti) octahedron structures, that is consistent with our crystal structure analysis.
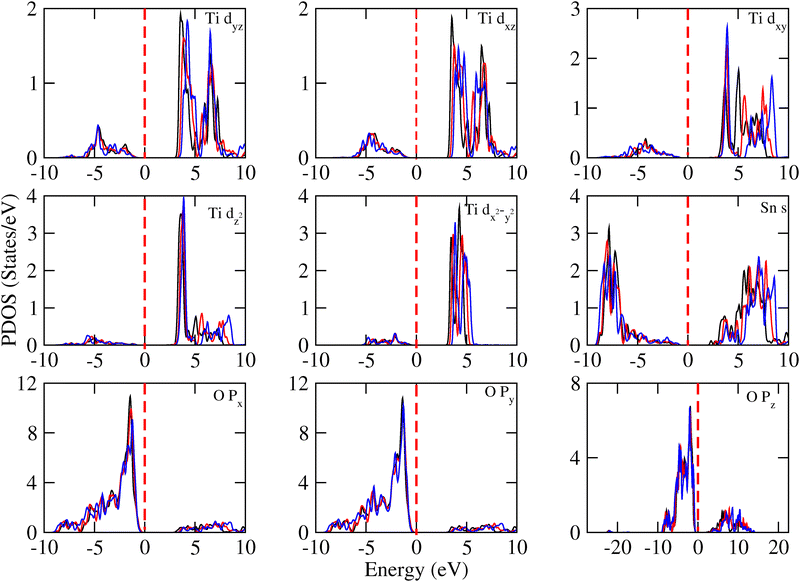 | ||
| Fig. 12 Contributions into DOS of Ti-d, Sn-s and O-p orbitals for the 3SO/1TO superlattice under upper limits −5% (black), 0% (red) and 5% (blue) biaxial strains. | ||
3.4. Electron localization function of superlattices
To gain further insight into the effect of biaxial tensile and compressive strain on the character of the bond, we calculated the electron localization function (ELF) of nSO/mTO superlattices projected on the (110) plane, as plotted in Fig. 13 for 3SO/3TO structure. ELF is a powerful tool that can be used to determine the spatial localization of electrons in crystals.45 It takes values between 0 and 1, showing the type and strength of the bond. A low ELF value indicates a deficit of shared electrons between two atoms, representing an ionic bond. Conversely, a high ELF value signifies abundant electron sharing between two atoms, characteristic of a covalent bond with various bonding strength.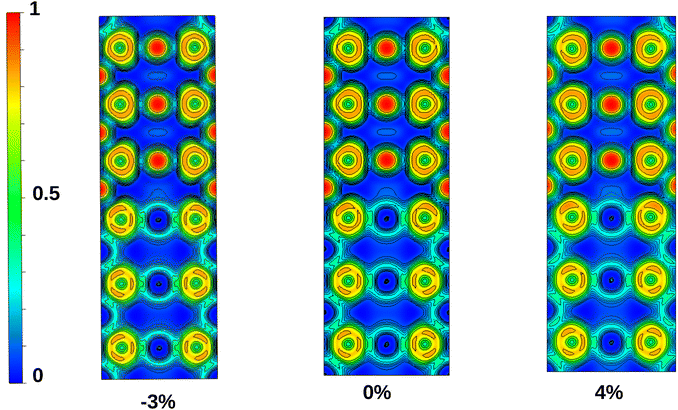 | ||
| Fig. 13 Electron localization function (ELF) graphs of projected 3SO/3TO superlattice on the (110) plane. | ||
It is found that the chemical bonding in nSO/mTO superlattices is predominantly characterized by ionic Sn–O and Ti–O bonds, with a minor covalent component. This covalent character is less pronounced between Ti and O atoms, as indicated by the calculated Poisson's ratios (see Section 3.2). In addition, this covalent character slightly increases under biaxial compressive strain and decreases with increasing tensile strain.
3.5. Effective mass of electrons and holes in the superlattices
The assessment of semiconductor materials for photocatalytic water splitting applications strongly relies on the mobility of photo-excited pair of charges. A theoretical evaluation of this mobility can be drive from the effective mass of created excitons (electrons/holes). In fact, it was proved that the drift velocity of charge carriers is inversely proportional to the effective mass, as defined in the equation below:46 | (3) |
The high mobility of photo-excited pair of charges is observed when they have small effective mass. This reduces the chance of recombination between the electrons and holes. The charge carriers can easier reach the material surface where occurs the reaction. To obtain the effective masses of particules in the different hetero-junctions, we fitted in the Brillouin zone their VB and CB extrema by a parabolic function and we applied before the following equation:
 | (4) |
In the Table 5 we present the calculated effective electron and hole masses of bulk SnO2, TiO2 and nSO/mTO superlattices under various strain conditions. The values are obtained by averaging the second derivative in both the Γ to Z and Γ to M directions, providing a more accurate estimate of the effective masses. Available experimental values for the bulk oxides are also included for comparison.47,48 Our calculated effective electron masses are in good agreement with the experimental results, with a larger mass in TiO2 than in SnO2. To our knowledge, no experimental data have been reported for the effective hole masses in either oxide. However, our calculated values show large effective hole masses in good agreement with previous theoretical results.46,49,50
| Strain (%) | D | |||
|---|---|---|---|---|
| SO | −1.306 | 0.273 | 4.783 | |
| 0.28747 | ||||
| TO | −1.826 | 1.215 | 1.502 | |
| 2.00048 | ||||
| 1SO/1TO | −3 | −1.377 | 7.367 | 0.186 |
| 0 | −1.449 | 5.013 | 0.289 | |
| 4 | −1.565 | 1.543 | 1.014 | |
| 2SO/2TO | −3 | −1.366 | 1.074 | 1.271 |
| 0 | −1.545 | 1.033 | 1.495 | |
| 4 | −1.908 | 0.931 | 2.049 | |
| 3SO/3TO | −3 | −1.375 | 0.868 | 1.584 |
| 0 | −1.646 | 0.573 | 2.872 | |
| 4 | −1.751 | 0.502 | 3.488 | |
| 1SO/2TO | −3 | −1.373 | 1.664 | 0.825 |
| 0 | −1.548 | 3.659 | 0.423 | |
| 4 | −2.003 | 1.468 | 1.364 | |
| 1SO/3TO | −3 | −1.440 | 1.626 | 0.885 |
| 0 | −1.750 | 1.249 | 1.401 | |
| 4 | −2.014 | 0.305 | 6.603 | |
| 2SO/1TO | −3 | −1.347 | 1.036 | 1.300 |
| 0 | −1.454 | 0.539 | 2.697 | |
| 4 | −1.541 | 0.413 | 3.731 | |
| 3SO/1TO | −5 | −1.486 | 0.436 | 3.408 |
| 0 | −1.529 | 0.377 | 4.055 | |
| 5 | −1.528 | 0.305 | 5.009 |
The (n/m) stacking periodicity in superlattices has been shown to affect the effective masses of charge carriers; there is a significant decrease in the effective masses of electrons compared to those of holes, with the latter showing a slight increase in effective mass with increasing layers. To illustrate, the effective mass of electrons in the unstrained 3SO/3TO superlattice is 0.573 m0, which is eight times smaller than that observed in the 1SO/1TO superlattice. The application of biaxial tensile strain leads to a decrease in the effective mass of electrons and an increase in the effective mass of holes. Conversely, the opposite trend is observed under compressive biaxial strain. It is expected that superlattices with 1SO/3TO and 3SO/1TO periodicity under 4% and 5% tensile strain, respectively, will enhance the mobility of photogenerated carriers compared to the single SnO2 and TiO2 parent phases.
To qualitatively assess the charge separation rate, we used the relative ratio  . A high value of this ratio indicates a greater tendency into material to separate charges, implying a lower recombination rates that enhances the photocatalytic activity.51 For all superlattices, the effective mass ratio D decreases under compressive strain and increases under tensile strain, suggesting that the transfer rate of holes and electrons is faster under tensile strain than under compressive strain. This leads to higher photocatalytic activity under tensile strain compared to compressive strain.
3.6. Photocatalytic properties of the superlattices
Reducing the band gaps is not enough to improve the photocatalytic activity of nSO/mTO superlattices. The band edges also need to be better aligned with the water potentials. For efficient photocatalytic water splitting, it is necessary that the top of the VB energy must be more positive than the oxidation potential of O2/H2O (1.23 eV). Inversely, the bottom of the CB energy must be more negative than the reduction potential of H+/H2 (0 eV).The alignment of the position of band edges can be achieved by the electronegativity52 of each atom composing the structure, using these equations:
 | (5) |
| EpH=0CBM = EpH=0VBM − Eg. | (6) |
These alignments can be as well adjusted with the specific pH using this last equation:
| EpHCBM,VBM = EpH=0CBM,VBM − 0.05911 × pH. | (7) |
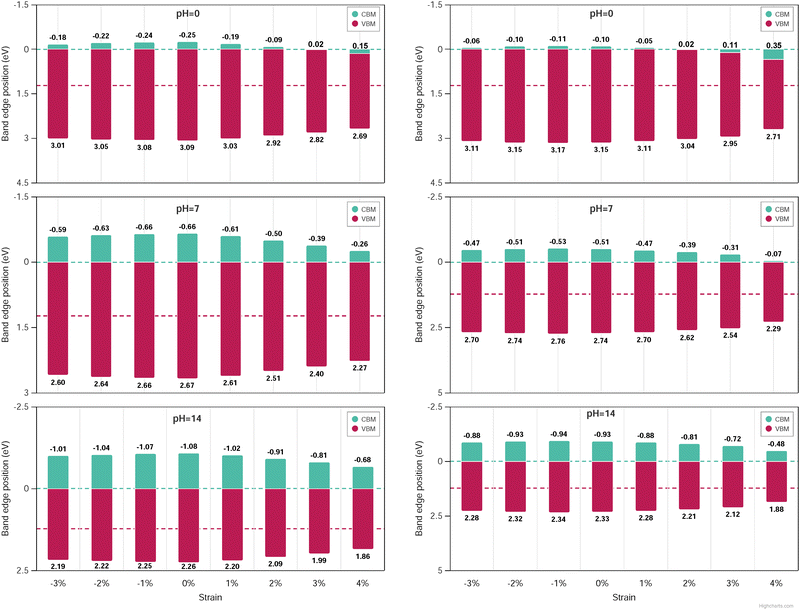
The band edge alignment at pH equal 0, 7 and 14 was calculated under the biaxial applied strain by rescaling the above equations according to the nSO/mTO superlattices (see the equations in ESI†). Here, only the VBM and CBM positions of 2SO/2TO, 3SO/3TO, 1SO/2TO, 1SO/3TO and 2SO/1TO which have band gaps less than or equal to 2.7 eV, have been displayed. The band-edge alignments for 1SO/3TO and 3SO/3TO superlattices when pH equal 0, 7 and 14 are plotted in Fig. 14, while remaining results are summarized in Fig. S24–S26 (ESI†).
For all superlattices at pH = 0, the VBM edges are consistently higher than the standard oxidation potential of O2/H2O and decrease under biaxial strain. Conversely, the CBM edges are slightly higher than the redox potentials of H+/H2 and even fall below this potential under biaxial strain, which is not desirable for catalytic applications. The band edges can be tuned by increasing the pH to 7 or 14, as show in Fig. 14. Indeed, for the mechanically stable 1SO/3TO and 3SO/3TO superlattices, which exhibit an optimal band gap value at 4% biaxial tensile strain, the VBM and CBM edges are well aligned with the water redox potentials, making them promising for photocatalytic applications.
4. Conclusions
In this study, we have systematically investigated the effects of biaxial strain on the structural, electronic, and photocatalytic properties of (SnO2)(n)/(TiO2)(m) superlattices using DFT calculations. Our findings demonstrate that these superlattices exhibit excellent mechanical stability according to the Born's criteria and reveal that stacking periodicity (1, m) presents the highest bulk modulus, Poisson's ratio and Debye temperature values. Phonon dispersion analysis shows that the 3SO/1TO superlattice maintains dynamic stability under both tensile and compressive strains ranging from −5% to 5%, while other superlattices remain stable within the range of −3% to 4%. For all the considered superlattices, the band gap is effectively tuned by tensile strain. For instance, the tunability of the band gap with strain is particularly noteworthy, with a range from 3.34 eV to 2.54 eV under tensile strains for the 1SO/3TO superlattice, which also exhibits high carrier mobility. Our analysis further highlights the potential of these superlattices as efficient photocatalysts for water splitting, as indicated by favorable band edge alignments at different pH levels.In summary, the incorporation of strain engineering in (SnO2)(n)/(TiO2)(m) superlattices offers a promising avenue for optimizing their properties for photocatalytic applications, specifically in the realm of hydrogen production from water splitting.
Author contributions
NH and AS conceived the study, carried out the modeling, calculations and analyzed the data, writing the first drift. AS and BC contributed on editing and reviewing the manuscript.Data availability
Data for this article have been included as part of the ESI† and are available at https://doi.org/10.5281/zenodo.13350149.Conflicts of interest
There are no conflicts to declare.Acknowledgements
We gratefully acknowledge the computational resources provided by GENCI and Lille University, which were essential for the completion of this research.Notes and references
- Q. Xiang, B. Cheng and J. Yu, Angew. Chem., Int. Ed., 2015, 54, 11350–11366 CrossRef CAS PubMed.
- J. Han, J. Guo, H. Liu, Y. Han, J. Wang, X. Ma, B. Yan, B. He and W. Lu, J. Phys. Chem. C, 2024, 128(3), 1116–1121 CrossRef CAS.
- G. R. Portugal, R. M. Ronchi, S. F. Santos and J. T. Arantes, Surf. Interfaces, 2023, 36, 102486 CrossRef CAS.
- M. Ashwin Kishore, K. Larsson and P. Ravindran, ACS Omega, 2020, 5, 23762–23768 CrossRef CAS PubMed.
- G. Wang, J. Chang, W. Tang, W. Xie and Y. S. Ang, J. Phys. D: Appl. Phys., 2022, 55, 293002 CrossRef CAS.
- D. Voiry, H. S. Shin, K. P. Loh and M. Chhowalla, Nat. Rev. Chem., 2018, 2, 0105 CrossRef CAS.
- N. Hassan, A. Jalil, N. Khusnun, A. Ahmad, T. Abdullah, R. Kasmani, N. Norazahar, M. Kamaroddin and D. Vo, Environ. Chem. Lett., 2022, 1–23 Search PubMed.
- F. Mikaeili, T. Gilmore and P.-I. Gouma, Catalysts, 2022, 12, 1303 CrossRef CAS.
- A. Fujishima and K. Honda, Nature, 1972, 238, 37–38 CrossRef CAS PubMed.
- A. Janotti, J. Varley, P. Rinke, N. Umezawa, G. Kresse and C. Van de Walle, Phys. Rev. B: Condens. Matter Mater. Phys., 2010, 81, 085212 CrossRef.
- A. K. Chandiran, M. Abdi-Jalebi, M. K. Nazeeruddin and M. Grazel, ACS Nano, 2014, 8, 2261–2268 CrossRef CAS PubMed.
- P. Tiwana, P. Docampo, M. B. Johnston, H. J. Snaith and L. M. Herz, ACS Nano, 2011, 5, 5158–5166 CrossRef CAS.
- C. Fonstad and R. Rediker, J. Appl. Phys., 1971, 42, 2911–2918 CrossRef CAS.
- V. Stevanović, S. Lany, D. S. Ginley, W. Tumas and A. Zunger, Phys. Chem. Chem. Phys., 2014, 16, 3706–3714 RSC.
- W.-J. Yin, S. Chen, J.-H. Yang, X.-G. Gong, Y. Yan and S.-H. Wei, Appl. Phys. Lett., 2010, 96(22), 221901 CrossRef.
- Z. Kerrami, A. Sibari, O. Mounkachi, A. Benyoussef and M. Benaissa, Int. J. Hydrogen Energy, 2020, 45, 11035–11039 CrossRef CAS.
- W. Zhou, Y. Liu, Y. Yang and P. Wu, J. Phys. Chem. C, 2014, 118, 6448–6453 CrossRef CAS.
- W. Serbout, F. Bensouici, O. Meglali, S. Iaiche, M. Bououdina, S. Bellucci and M. Humayun, Environ. Sci. Pollut. Res., 2023, 30, 85792–85802 CrossRef CAS PubMed.
- P. Hohenberg and W. Kohn, Phys. Rev., 1964, 136, B864 CrossRef.
- W. Kohn and L. J. Sham, Phys. Rev., 1965, 140, A1133 CrossRef.
- G. Kresse and J. Hafner, J. Phys.: Condens. Matter, 1994, 6, 8245 CrossRef CAS.
- G. Kresse and J. Furthmüller, Phys. Rev. B: Condens. Matter Mater. Phys., 1996, 54, 11169 CrossRef CAS.
- G. Kresse and J. Furthmüller, Comput. Mater. Sci., 1996, 6, 15–50 CrossRef CAS.
- J. P. Perdew, K. Burke and M. Ernzerhof, Phys. Rev. Lett., 1996, 77, 3865 CrossRef CAS.
- H. J. Monkhorst and J. D. Pack, Phys. Rev. B, 1976, 13, 5188 CrossRef.
- J. Paier, M. Marsman, K. Hummer, G. Kresse, I. C. Gerber and J. G. Ángyán, J. Chem. Phys., 2006, 124(15), 154709 CrossRef CAS.
- A. Togo and I. Tanaka, Scr. Mater., 2015, 108, 1–5 CrossRef CAS.
- V. I. Anisimov, F. Aryasetiawan and A. Lichtenstein, J. Phys.: Condens. Matter, 1997, 9, 767 CrossRef CAS.
- S. L. Dudarev, G. A. Botton, S. Y. Savrasov, C. Humphreys and A. P. Sutton, Phys. Rev. B: Condens. Matter Mater. Phys., 1998, 57, 1505 CrossRef CAS.
- V. Wang, N. Xu, J.-C. Liu, G. Tang and W.-T. Geng, Comput. Phys. Commun., 2021, 267, 108033 CrossRef CAS.
- K. Momma and F. Izumi, atelier de diffraction sur poudre Seventh Canadian Powder Diffraction Workshop, 2006, p. 106 Search PubMed.
- F. Birch, Phys. Rev., 1947, 71, 809 CrossRef CAS.
- G. R. Portugal, G. G. Barbosa and J. T. Arantes, Langmuir, 2021, 37, 4493–4503 CrossRef CAS.
- S. Zhang, H. Xiao, S. Peng, G. Yang, Z. Liu, X. Zu, S. Li, D. Singh, L. Martin and L. Qiao, Phys. Rev. Appl., 2018, 10, 044004 CrossRef CAS.
- R. Hill, Proc. Phys. Soc., London, Sect. A, 1952, 65, 349 CrossRef.
- D. Chung and W. Buessem, J. Appl. Phys., 1968, 39, 2777–2782 CrossRef CAS.
- E. E. Whiting, J. Quant. Spectrosc. Radiat. Transfer, 1968, 8, 1379–1384 CrossRef.
- S. Pugh, J. Sci., 1954, 45, 10–1080 Search PubMed.
- I. N. Frantsevich, Reference book, 1982 Search PubMed.
- M. Fine, L. Brown and H. Marcus, Scr. Metall., 1984, 18, 951–956 CrossRef CAS.
- M. Jiang, J. Zheng, H. Xiao, Z. Liu and X. Zu, Sci. Rep., 2017, 7, 9344 CrossRef CAS.
- J. Haines and J. Léger, Phys. Rev. B: Condens. Matter Mater. Phys., 1997, 55, 11144 CrossRef CAS.
- J. Pascual, J. Camassel and H. Mathieu, Phys. Rev. B, 1978, 18, 5606 CrossRef CAS.
- Y. Tezuka, S. Shin, T. Ishii, T. Ejima, S. Suzuki and S. Sato, J. Phys. Soc. Jpn., 1994, 63, 347–357 CrossRef CAS.
- A. D. Becke and K. E. Edgecombe, J. Chem. Phys., 1990, 92, 5397–5403 CrossRef CAS.
- J. Zhang, P. Zhou, J. Liu and J. Yu, Phys. Chem. Chem. Phys., 2014, 16, 20382–20386 RSC.
- K. J. Button, C. G. Fonstad and W. Dreybrodt, Phys. Rev. B, 1971, 4, 4539 CrossRef.
- R. G. Breckenridge and W. R. Hosler, Phys. Rev., 1953, 91, 793 CrossRef CAS.
- V. Celik, Phys. B, 2021, 619, 413236 CrossRef CAS.
- A. Schleife, J. Varley, F. Fuchs, C. Rödl, F. Bechstedt, P. Rinke, A. Janotti and C. Van de Walle, Phys. Rev. B: Condens. Matter Mater. Phys., 2011, 83, 035116 CrossRef.
- W. Yu, D. Xu and T. Peng, J. Mater. Chem. A, 2015, 3, 19936–19947 RSC.
- R. G. Pearson, Inorg. Chem., 1988, 27, 734–740 CrossRef CAS.
Footnote |
| † Electronic supplementary information (ESI) available. See DOI: https://doi.org/10.1039/d4cp03363a |
| This journal is © the Owner Societies 2025 |

