
 Open Access Article
 This Open Access Article is licensed under a
 Creative Commons Attribution 3.0 Unported Licence
Laser induced oxidation Raman spectroscopy as an analysis tool for iridium-based oxygen evolution catalysts†
Sebastian
Speer
 ab,
Sven
Jovanovic
*a,
Alexandre
Merlen
c,
Francesco
Bartoli
a,
Kiran
Kiran
a,
Niklas
Wolf
ab,
André
Karl
a,
Eva
Jodat
a and
Rüdiger-A.
Eichel
abd
ab,
Sven
Jovanovic
*a,
Alexandre
Merlen
c,
Francesco
Bartoli
a,
Kiran
Kiran
a,
Niklas
Wolf
ab,
André
Karl
a,
Eva
Jodat
a and
Rüdiger-A.
Eichel
abd
aForschungszentrum Jülich, Institute of Energy Technologies – Fundamental Electrochemistry (IET-1), Jülich, Germany. E-mail: s.jovanovic@fz-juelich.de
bRWTH Aachen University, Institute of Physical Chemistry, Aachen, Germany
cUniversité de Toulon, MAPIEM, Toulon, France
dRWTH Aachen University, Faculty of Mechanical Engineering, Aachen, Germany
First published on 13th January 2025
Abstract
The study of degradation behavior of electrocatalysts in an industrial context calls for rapid and efficient analysis methods. Optical methods like Raman spectroscopy fulfil these requirements and are thus predestined for this purpose. However, the iridium utilized in proton exchange membrane electrolysis (PEMEL) is Raman inactive in its metallic state. This work demonstrates the high oxidation sensitivity of iridium and its utilization in analysis of catalyst materials. Laser induced oxidation Raman spectroscopy (LIORS) is established as a novel method for qualitative, chemical and structural analysis of iridium catalysts. Differences in particle sizes of iridium powders drastically change oxidation sensitivity. Oxidation of the iridium powders to IrO2 occurred at a laser power density of 0.47 ± 0.06 mW μm−2 for the 850 μm powder and at 0.12 ± 0.06 mW μm−2 and 0.019 ± 0.015 mW μm−2 for the 50 μm and 0.7–0.9 μm powders respectively. LIORS was utilized to assess possible deterioration of an iridium electrocatalyst due to operation under electrolysis. The operating electrocatalyst exhibited higher oxidation sensitivity, suggesting smaller iridium particle size due to catalyst dissolution. Peak shifts of the IrO2 signal were utilized to assess differences in transformation temperatures. The operated electrocatalyst transformed to IrO2 at lower temperature (8 cm−1 redshift) relative to the pristine catalyst (10 cm−1 redshift), demonstrating that pre-oxidation of the iridium to amorphous IrOx during electrolysis diminishes the energy barrier needed for IrO2 formation. Thus, LIORS can be utilized as a straightforward screening method for the analysis of iridium electrocatalysts in the industrial application of PEMEL.
Introduction
Today's urgent need for transitioning to a carbon neutral economy is countervailed by the lack of economic feasibility of state-of-the-art energy technologies. One of the most promising energy carriers for the transition is hydrogen, so improvement in hydrogen production technologies is vital.1–3 PEMEL is seen as one of the primary options for producing hydrogen commercially. PEM electrolyzers enable the production of high purity hydrogen for use in fuel cells, at low temperatures and high current densities.4 While the ability to operate at high current densities increases economic feasibility significantly, there is still room for improvement of cost effectiveness. Some of the challenges of PEMEL are the high costs and the degradation of materials utilized in the electrolyzer. Especially iridium, which is a common material used as the oxygen evolution reaction (OER) electrocatalyst, is a major driver of high capital expenditure.5,6 Therefore, the investigation of OER catalyst degradation is critical for improving the electrode production process and electrolyzer operation in order to prolong the electrode lifespan.Fast and straightforward analysis methods are required, and thus optical methods are often preferred for use in industry-oriented applications. Raman spectroscopy in particular yields insight into various material properties like composition, crystal size and form and mechanical stress. It is implementable in low-complexity measurement devices or more sophisticated forms like Raman microscopes, allowing for detailed space dependent analyses of the sample.7–9 However, Raman spectroscopy shows limited viability when analyzing amorphous or metallic samples, yielding spectra with low information or no signal at all. While the active electrocatalyst for the OER is iridium oxide, industrial membrane electrode assemblies (MEAs) for PEMEL often utilize metallic iridium.4 Upon application of an oxidative potential, the active IrOx catalyst is then formed on the iridium surface.10,11 For Raman studies of the catalyst layer the metallic iridium precursor is challenging, as it is not Raman active.
While laser induced change of the analyte is undesired most of the time in Raman experiments, the in situ transformation can instead be utilized to introduce Raman active species into samples which are not Raman active themselves or show only broad signals which are hard to interpret. This allows an indirect analysis of the original material, as the transformation product now yields defined Raman signals which can be used for interpretation. The analyte exhibiting low information content in its spectra is thereby converted to a species exhibiting higher information content. Similar procedures were applied for titanium oxides, iron oxides, vanadium oxide,12 magnetite,13 bismuth,14,15 titanomagnetites,16 chromium,17 graphene18 and uranium oxide.19 Depending on the material, laser irradiation can cause crystallization as well as oxidation. Witke et al. examined the laser induced transformation of anodically grown amorphous vanadium oxide films. Depending on the synthesis parameters for the amorphous oxide, crystallization to either V2O5 or V2O9 occurred upon laser irradiation. Thus, Raman spectra of the transformed materials can be utilized to probe for information about oxidation state of the original amorphous material.12 Energy input into the sample plays a significant role in the transformation process, so the laser wavelength, as well as laser power and laser spot size – i.e. the irradiation density – are significant factors. In the case of titanomagnetites, the titanium content affects the laser power for which the transformation occurs, where the power threshold for the oxidation decreases with higher titanium content. This trend correlates with changes in the distribution of Fe2+ and Fe3+ ions in tetrahedral and octahedral sites. The study shows that laser power can be a conclusive parameter for the analysis of material composition.16 Lastly, morphology of the sample, like particle size and surface texture influence laser induced phase transitions as well.15 While the aforementioned studies clearly demonstrate the utility of laser induced transformation in Raman experiments, no application-oriented use case has been published yet.
In this work, laser induced oxidation Raman spectroscopy is utilized in an iridium OER electrocatalyst of pre- and post-operation PEMEL membrane electrode assemblies to yield insight into the influence of electrolysis-operation on the electrocatalyst material. By performing Raman measurements at different laser powers and observing the laser induced formation of iridium dioxide, differences in oxidation sensitivity were probed. As reference, iridium powders with varying particle sizes were analyzed in a similar fashion. We report successful implementation of LIORS as a time sensitive and straightforward method to analyze the influence of electrolyzer operation on the OER electrocatalyst in an industrial context. A less elaborate version of LIORS was utilized in our group to analyze the chemical nature of formed structures inside a postmortem MEA.20 To our knowledge, this is the first implementation of this method in an application-oriented use case. As it enables qualitative assessment of materials properties like particle size, morphology and oxidation, it is complementary to microscopic techniques like scanning and transmission electron microscopy, as well as methods for particle size analysis like DLS and SLS. Furthermore, rapid assessment of particle size and morphology provided by LIORS can be complementary to methods yielding structural and chemical information like XRD, XPS and EPR.
Experimental
Materials
Ir powders with max. particle sizes of 850 μm and 50 μm with 99.99% and 99.9% purity respectively were sourced from Goodfellow (Huntingdon, United Kingdom). Iridium black with a purity of 100% was acquired from Fuel Cell Store (Bryan TX, USA). The hydrodynamic diameter of the iridium black particles was determined to be 0.7–0.9 μm via DLS. All iridium powders were used as obtained. The investigated membrane electrode assemblies (MEAs) consist of a web-reinforced perfluorosulfonic acid (PFSA) membrane with an iridium-based anode and a platinum-based cathode. The MEA samples were stored in a climate chamber at 28% relative humidity and 25 °C until further use.DLS
Size distribution of iridium black particles was determined by dynamic light scattering (DLS). Various experimental parameters were tested and the ones resulting in the lowest particle sizes were utilized for DLS measurements. Especially the use of the ultrasonic probe resulted in significantly diminished particle sizes, suggesting the prevention of agglomeration. Iridium black was suspended in 6 ml of 2-propanol with the help of an ultrasonic probe (24 × 5 s, Q700 sonicator, Qsonica, Newtown CT, USA) and a sonic bath (20 minutes). 1 ml of the suspension was then diluted with 2 ml 2-propanol transferred into polystyrene disposable cuvettes. Finally, they were placed inside the instrument (Litesizer DLS 500, Anton Paar, Ostfildern-Scharnhausen, Germany). The measurements were performed with automatic angle selection using the Kalliope software and 2-propanol was selected as a solvent. The wavelength used was 658 nm, and the temperature was maintained at 25 °C.Raman
Raman experiments were performed on a WITec (Ulm, Germany) Alpha 300R Raman microscope. A 532 nm laser, a Zeiss EC Epiplan-Neofluar HD Dic 50×/0.8 objective and a 300 g mm−1 grating were utilized. Spectra were measured with 10 accumulations and an integration time of 5 s per accumulation. The laser powers are measured using the WITec True Power device and corrected using factors accounting for power losses through the whole beam path. Thus, the stated laser power densities and doses are the actual energy input into the sample. For each measurement position, power series with increasing and subsequently decreasing laser power were performed. Depending on the sample, the intervals in which the power increases were adjusted. For samples that were estimated to be more stable towards oxidation, larger intervals were used for the lower power ranges. Intervals were reduced moving towards the estimated power range in which oxidation takes place. The laser spot size was determined from microscope images of the laser spot on the pristine MEA sample (Fig S1, ESI†) in Fiji21 and averaged over three measurements. Laser power and laser dose are normalized to the laser spot size of 37.13 ± 13.01 μm2.XRD
To assess the crystallographic structure of the pristine and cycled MEA, X-ray diffraction was carried out using an Empyrean diffractometer from Panalytical (Almelo, Netherlands). A Cu Kα radiation source (λ = 0.1540 nm, 40 mA) operated at 40 kV in Bragg–Brentano-geometry and pixel3D detector was utilized. XRD spectra were recorded in reflection mode in steps of 0.0130, 60 s counting time per step, and with 2θ values ranging from 10 to 140°. Three repetitions of measurement were done for each sample. The samples were placed on a SiO2 substrate and Kapton foil was used to secure the sample. The obtained XRD patterns were analyzed and referenced using crystallography open database (COD) (Ir: COD #96-900-8471, IrO2: COD # 96-154-8818).Results
Influence of iridium particle size
Raman spectra of IrO2 exhibit the four phonon modes of the crystal lattice, namely the A1g, B1g, B2g and Eg modes. A1g, B2g and Eg modes are dominant in the spectrum, as the B1g modes intensity is smaller by a factor of 10 or more compared to the other modes. The exact peak shift and signal broadening can vary depending on used substrate and synthesis. A1g and B2g modes often appear as one signal as they tend to overlap due to these variances in shift and signal broadening.22–24 This work also discusses samples that were operated in PEMEL, which leads to formation of rather amorphous mixed oxides.25 While IrO2 has a defined stoichiometry and long-range order, IrOx is a mixture of different oxidation states of iridium. The IrOx discussed in the literature is either electrodeposited (EIROF)26,27 or anodically grown (AIROF)25,28 in an aqueous environment, which leads to implementation of hydride and hydroxide species into the material. Raman spectra of IrOx show a broad band in the same wavenumber range of IrO2 consisting of a variety of individual signals.29 These signals were assigned to various kinds of Ir–O vibrations with different Ir oxidation states based on theoretical calculations.27,28 Depending on the composition of IrOx the exact shape of the band can therefore differ.The declared particle sizes for the powders utilized in this work refer to the maximum particle size stated by the supplier. SEM images of the three powders (Fig. S3, ESI†) exhibit distributions of overall shape, size and surface morphologies. The 850 μm powder consists of rough irregular shaped particles, larger ones in the range of 200–600 μm, few smaller particles with sizes below 100 μm as well as finer dust with sizes below 10 μm. The 50 μm powders particles exhibit similar shapes, but a narrower size distribution between 1 and 50 μm and increased amounts of the finest particles. Surface morphologies of the 850 and 50 μm powder particles are porous and resemble a ligament-like structure. The ligaments found on the surface of the 50 μm particles are generally smaller than the ones of the 850 μm powder. The Ir black powder on the other hand is made up of interconnected platelets with sizes of around 1 μm. The platelets themselves exhibit a rough surface which is observable at higher magnifications. For the Ir black powder it is challenging to identify distinct particles.
Representative laser power series spectra for iridium powders with a max particle size of 850 μm are depicted in Fig. 1a. The full data are depicted in the ESI† (Fig. S5, S7, S9, S16 and S18). The laser doses are computed considering the sum of the laser energy absorbed by the sample during the laser power series up to that point. In Fig. 1a, no IrO2 signal is observable for lower laser powers. IrO2 bands start to appear in the range of 0.47 ± 0.06 mW μm−2. These signals persist when decreasing power again, even below 0.47 mW μm−2 in which they were not visible before the laser induced oxidation. The Raman data confirm that the iridium powder is oxidized by laser irradiation upon a certain threshold laser power density, which is supported by the persistence of the IrO2 signal.
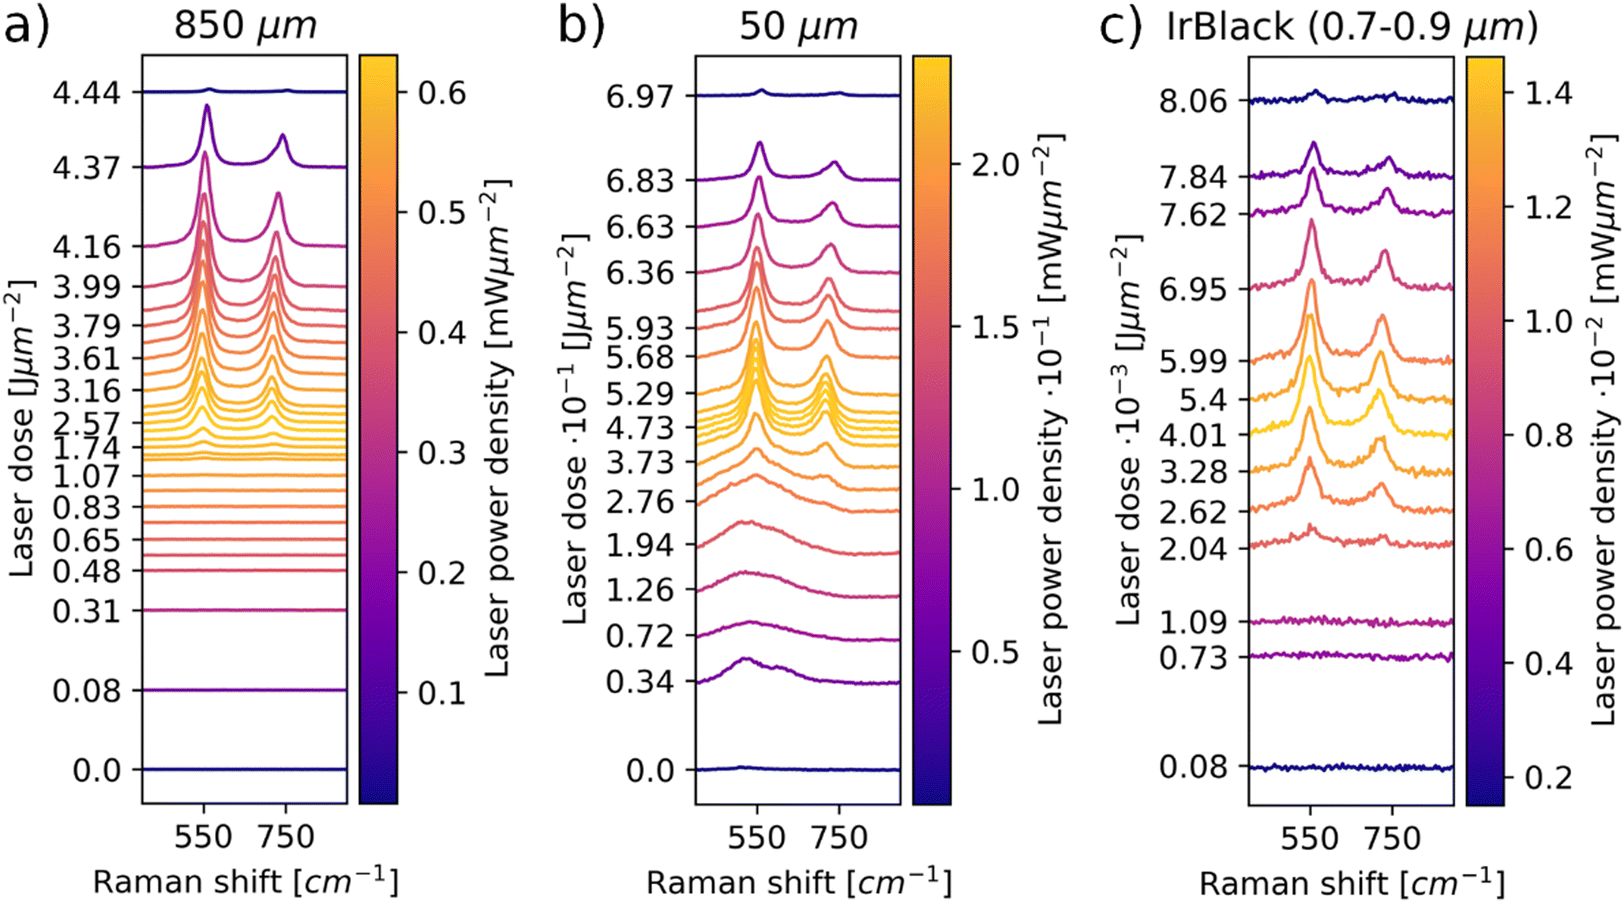 | ||
| Fig. 1 Laser power series of iridium powders with particle size of 850 μm (a), 50 μm (b) and 0.7–0.9 μm (c). Amorphous Raman bands are observable in the low laser power spectra of the 50 μm powder. Bands of crystalline IrO2 (Eg @ 550 cm−1, A1g + B2g @ 720 cm−1) are observable at high laser powers, indicating an oxidation of the iridium metal. Sensitivity to laser oxidation increases with decreasing particle size. | ||
Moreover, a shift of the IrO2 bands to higher wavenumbers and separation of the A1g and B2g bands is visible for decreasing powers. The observed peak shifts can be explained by thermal changes in the IrO2 lattice. In order to visualize this effect more clearly for the examined system, a spot on the 850 μm powder was irradiated with 0.74 mW μm−2 for 200 s to form IrO2. A laser power series was performed subsequently on the same position with a power density range of 0.07–0.59 mW μm−2. The results are depicted in Fig. 2. The increase in laser power leads to a reversible shift of the signals to lower wavenumbers. Upon subsequent decrease in laser powers, the signals shift back to higher wavenumbers, as already observed in Fig. 1a. In Raman spectra of solid materials, a redshift is observed at increasing temperatures, which can be attributed to thermal expansion of the lattice and changes in phonon occupation numbers.30–32 The observed redshift for increasing power suggests an increase in local temperature, while the blueshift upon subsequent decrease in power indicates a decrease in local temperature. Thus, the observed laser induced oxidation is a thermally activated process.
 | ||
| Fig. 2 (a) Laser power series of in situ formed IrO2. Redshift of all IrO2 Raman bands and merging of the A1g and B2g bands is observable upon increase of laser power. (b) Weighted position (see the ESI†) of the Eg band vs. laser power density. The green plot depicts the Raman shifts while increasing laser power, the red plot displays the same for diminishing powers. It is evident that peak shifts are reversible upon subsequent decrease of laser power, showing a temperature dependence of the lattice vibrations. | ||
The power series experiments for the max. 50 μm Ir powder are depicted in Fig. 1b. In the lower power range, broad bands are observed in the spectra. These bands exhibit similarity to those observed for the amorphous iridium oxides, indicating that the max. 50 μm powder is already oxidized before the experiment.25–29 The 50 μm powder oxidizes in a range of 0.12 ± 0.06 mW μm−2, which is a significantly lower power range than the 850 μm powder. The Eg band shifts in a similar wavenumber range as for the 850 μm powders during the power series (Fig. S5–S10, ESI†). Less energy input is required before oxidation occurs, and the peak shifts reveal that the required oxidation temperatures are reached at lower laser powers for the finer powder.
For the iridium black powder, which is a high-surface-area iridium metal powder for the use as catalyst (Fig. 1c), this trend is even more pronounced. Similar to the 850 μm powder, no oxide signal is present in the spectra at low laser powers. IrO2 bands start to occur in the range of 0.019 ± 0.015 mW μm−2, in which the same shifts in wavenumber occur as for the larger particles. It is evident that the iridium black powder is highly sensitive towards oxidation, as the required activation temperature and therefore the beginning of the oxidation processes is reached at very low laser powers. Based on the examination of the three iridium powders with LIORS, it can be stated that lower particle sizes result in higher oxidation sensitivity of iridium powders. As the peak shifts suggest, this is likely correlated primarily to the heat capacity of an iridium particle. Smaller particles consist of less material that can take up heat, therefore a lower mass of the iridium particles results in decreased heat dissipation away from the irradiated surface. Thus, the transformation temperature at the laser spot is reached at lower powers for smaller particles due to their lower heat capacity. Further correlations between the laser power and particle size are discussed in the ESI.†
Pre- and post-operation MEA samples
As seen in the X-ray diffractogram (XRD) in Fig. 3, the bulk of the material remains iridium metal after electrolyzer operation, but the broad reflexes of IrO2 increased slightly. The broad nature of the IrO2 reflexes demonstrate that the iridium oxide is amorphous. Laser power series were performed on pre- and post-operation PEMEL anodes. The resulting spectra are depicted in Fig. 4. Broader bands are visible in the spectra of both the pristine and operated sample even before significant IrO2 peaks are observable. The occurrence of these bands suggests the presence of amorphous IrOx, supporting the XRD data. IrOx bands are more pronounced in the spectra of the operated sample, which is caused by in situ oxidation of the metallic iridium during electrolyzer operation.10,11 SEM images of the operated sample show an enlargement of the structural features seen in the SEM images for the pristine sample (Fig. S15, ESI†). This is likely due to the buildup of an oxide layer. In Fig. 4a and b, both the pristine and the operated MEA sample roughly oxidize at comparable laser power onset as iridium black in Fig. 1c. Moreover, the temperature-related peak shift is observable in the same wavenumber range as in the iridium powder experiments, demonstrating again that comparable activation temperatures are reached during oxidation. This observation is complemented by SEM images of the iridium black powder and the MEA (Fig. S3 and S15, ESI†). As the iridium black sample is applied to the SEM sample holder as a loose powder, the image exhibits more depth of field compared to the MEA surface. However, the rough surface morphology of the MEA samples and the iridium black powder is of a similar nature, explaining the comparable oxidation behavior.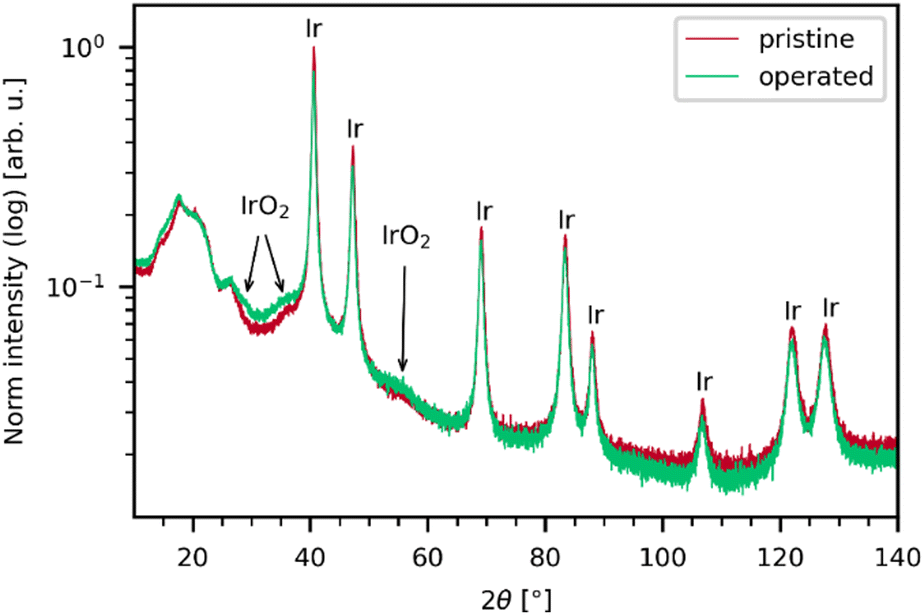 | ||
| Fig. 3 XRD of the pristine and operated sample normalized to the area of the Ir(111) reflex at 40°. Both samples primarily show iridium reflexes and only weak, broad IrO2 reflexes. The broadness of the IrO2 shows that rather an amorphous IrOx is present in the samples instead of crystalline IrO2. IrO2 reflexes are slightly more intense after electrolyzer operation. Thus, while the bulk of the material is iridium for both samples, the amount of IrOx increased after operation. | ||
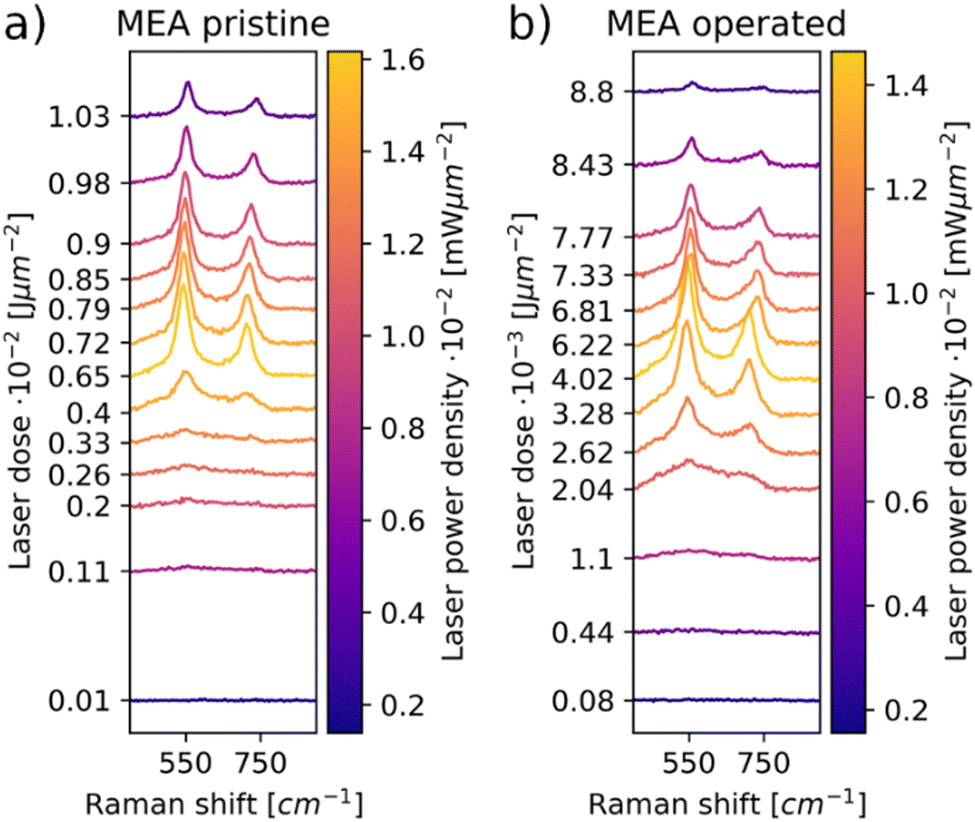 | ||
| Fig. 4 Laser power series performed on the anode of the pristine (a) and operated MEA (b) samples. Amorphous IrOx signal is observable at the lower laser powers, indicating some degree of pre-oxidation. This pre-oxidation is more pronounced in the spectra of the operated sample. | ||
In order to highlight the differences between pristine and operated MEA iridium catalyst morphology, a statistical analysis of Raman oxidation behavior was performed. Fig. 5 depicts the peak intensities of the Eg band versus the laser power for the pristine and operated MEA anode. The measurement parameters are kept the same for both samples and the samples are similar except from the operation in electrolysis. Furthermore, three spots were measured for each sample for sufficient statistical significance. Thus, the absolute intensities determined via this method reflect a higher IrO2 concentration or increased crystallinity and are a conclusive parameter for comparison even without normalization. In Fig. 5, the operated sample shows higher signal intensities of the IrO2 Eg band at lower laser powers compared to the pristine sample. As concluded from the reference experiments, a lower oxidation onset laser power is correlated with a lower particle size. Iridium dissolution is a well-known process included in most of the suggested catalytic cycles for the OER.33,34 Previous studies have found, that anode electrocatalysts tend to corrode and migrate into the membrane during electrolysis.35,36 These findings support the observations, as the catalyst dissolution would result in smaller particle sizes. The prior electrochemical oxidation of the catalyst due to the operation in electrolysis could also favor laser induced transformation, as a thin amorphous iridium oxide layer forms during electrolysis.
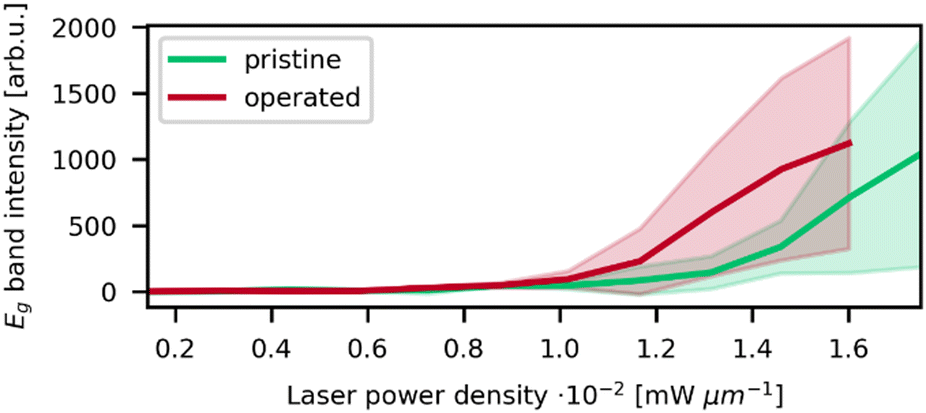 | ||
| Fig. 5 Intensity of the Eg band vs. laser power density from the laser power series of the pristine and operated anodes. Standard deviation of the intensity is depicted as the filled area around the plot. An oxidation onset at lower laser power density is observable for the operated sample. | ||
As demonstrated before, the laser powers at oxidation onset are mostly influenced by the heat capacity of the material, as it represents the energy input into the sample before the transformation temperature is reached. The band shift at oxidation onset yields insight about the temperature at which the transformation starts. Temperature correlates with the activation energy for the transformation, which is predominantly influenced by the chemical composition of the educt. In order to study these dependencies, spectra in which the first IrO2 signal was observable were selected from the laser power series. The Eg band position was deconvoluted using Gaussian functions. Depending on the presence of amorphous signal, an additional background fitting model was applied. To account for other influences on the Raman shift, linear regression was utilized to interpolate the Eg band position to 0.0 mW μm−2 from the plots in Fig. S6, S8, S10, S13 and S15 (ESI†). Linear regression was chosen as an approximation, as the dependence of the shift on the laser power is close to linear (Fig. 2b and Fig. S4, S6, S8, S17 and S19, ESI†). The difference between Eg shift at oxidation onset and the interpolated Eg shift at 0.0 mW μm−2 is computed. Thus, the y-intercept of the linear plot is utilized to compensate for the general difference in shift that each measurement spot could exhibit. Therefore, only the temperature dependent change of the shift is considered. The values obtained by this method are plotted against the onset laser power density in Fig. 6. Both parameters are averaged over the three experiments that were performed for each sample.
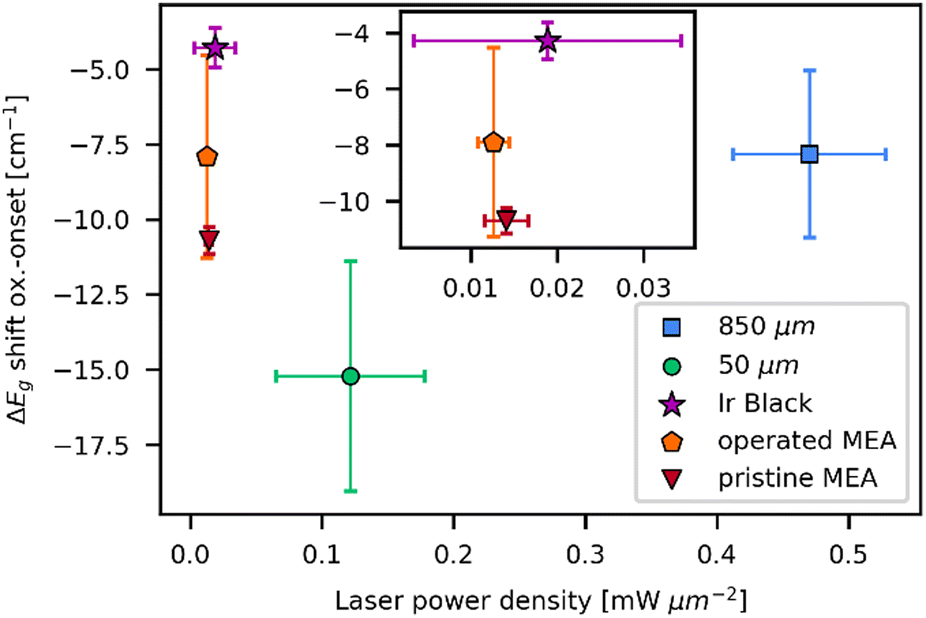 | ||
| Fig. 6 Eg band shift relative to the Eg band shift at 0.0 mW μm−2vs. laser power densities on oxidation onset with respective standard deviations for all examined samples. Spectra in which the first IrO2 signal was observable were selected and Eg band shift was obtained from deconvolution of the spectra. Deconvolution was used due to the weakness of the Eg band and overlapping with other signals for most of the measurements at oxidation onset. The Eg shift at 0.0 mW μm−2 was determined by interpolation from the data in Fig. S6, S8, S10, S17, and S19 (ESI†). | ||
In addition to the dependence of oxidation laser power on the particle size, the reference and MEA Ir samples can be distinguished by Eg band shifts during oxidation onset. The 50 μm powder exhibits the largest redshift of 15 cm−1 upon oxidation onset, followed by the MEA samples (10 cm−1 for pristine MEA, 8 cm−1 for operated MEA). Similar redshifts of 8 cm−1 are observed for the 850 μm powder and the lowest redshifts at 4 cm−1 occur for measurements on the iridium black powder. Comparing the three examined powders, the 50 μm powder significantly differs from the other two particle sizes. The increased redshift suggests that a higher temperature is needed for the transformation process. In the Raman spectra of the 50 μm powder, intense amorphous bands are observable at lower laser power. These bands were absent or significantly less intense for the laser power series of the other two powder samples. As stated by the manufacturer, the purity of the 50 μm powder is 99.9%, while the purity of the 850 μm powder is 99.99%. The iridium black powder is rated with a purity of 100%. The declared purities correlate with the observed differences in redshift. A higher amount of impurity results in a higher activation energy for the transformation process. These findings would be counterintuitive if the impurity is amorphous IrOx, as the shape and shift of the observed signals for the 50 μm powder indicate. Already oxidized iridium species are expected to be more prone to the formation of IrO2. The amorphous signal observed for the 50 μm sample, while exhibiting similar Raman shift and shape as amorphous IrOx, is exceptionally intense compared to the other samples. This indicates that differences in impurities may affect the transformation process.
Comparing the pre- and post-operation MEA, the operated sample exhibits lower Eg band shift upon oxidation onset. The trend is not completely clear in terms of standard deviation but may be more prominent for longer operated MEAs. Also, as seen in Fig. S20 (ESI†) it seems that high standard deviations are mainly caused by single outliers, so a higher number of measurements per sample could manifest the trend more clearly. The increased presence of already oxidized iridium species for the operated MEA favors the formation of IrO2 by laser irradiation. Instead of oxidation of iridium metal, crystallization of the amorphous IrOx to IrO2 occurs, explaining the difference in energy needed for the transformation process.
Conclusions
In conclusion, we demonstrate that iridium OER catalysts are subject to significant material transformation upon laser irradiation which can be easily tracked via Raman spectroscopy in a novel approach we term “laser induced oxidation Raman spectroscopy” (LIORS). The investigated catalysts exhibit significant differences in laser power required for material transformation as a function of particle size and composition. Not only catalysts in powder form can be analyzed with this approach, but also further processed material in MEAs pre- and post-operation can be investigated. Here, the investigated MEAs showed similar behavior to iridium black due to similar particle sizes. Oxidation onset occurred at lower laser powers for the operated sample compared to the pristine MEA, indicating diminishing particle size possibly due to iridium dissolution or electrochemical surface roughening. Thermometric analysis of the Raman data reveals an additional impact of chemical composition. The operated sample formed IrO2 at lower temperatures, as partial oxidation of the catalyst diminishes the activation barrier for the transformation to IrO2. In this case a crystallization of the amorphous oxide rather than oxidation of iridium metal occurs. As the performance loss of the electrolysis cell correlates with the electrocatalyst oxidation sensitivity, it is conceivable that a LIORS procedure specifically optimized for the analysis of iridium-based materials can be effectively utilized for morphological and chemical analysis of iridium electrocatalysts. In industry, this approach could provide a straightforward degradation analysis of MEAs and an in-line compatible quality control tool for electrolyzer production. Furthermore, a sensible combination of in operando Raman analysis of the iridium catalyst during electrolysis and LIORS of the post-operation samples could provide detailed insights into the OER mechanism and catalyst degradation. Finally, it must be noted, that the laser powers that caused transformation of the electrocatalysts were very low compared to the usually employed power levels in Raman spectroscopy. The iridium catalyst's high oxidation sensitivity must be considered in Raman experiments in order to prevent distortion of measurement results.Author contributions
Each author contributed to this work as follows. Sebastian Speer performed the Raman experiments and handled sample preparation with assistance of Sven Jovanovic and Alexandre Merlen. DLS experiments were performed by Francesco Bartoli. XRD measurements were performed by Kiran Kiran. Electrolysis experiments were performed by Niklas Wolf. Data analysis and interpretation were performed by Sebastian Speer in collaboration with Sven Jovanovic, Alexandre Merlen, André Karl, Eva Jodat and Rüdiger-A. Eichel. The paper was written by Sebastian Speer in collaboration with all authors. All authors have read and agreed to this paper.Data availability
Raman and XRD data are available for download at the Jülich data repository using the the following link: https://doi.org/10.26165/JUELICH-DATA/XSX3GA.Conflicts of interest
There are no conflicts to declare.Acknowledgements
The authors kindly acknowledge funding by the Federal Ministry of Education and Research (BMBF) within the DERIEL (Funding code: 03HY122C) and SEGIWA (Funding code: 03HY121B) Projects.Notes and references
- S. Chu, Y. Cui and N. Liu, Nat. Mater., 2017, 16(1), 16–22 CrossRef.
- V. R. Stamenkovic, D. Strmcnik, P. P. Lopes and N. M. Markovic, Nat. Mater., 2017, 16(1), 57–69 CrossRef.
- J. D. Holladay, J. Hu, D. L. King and Y. Wang, Catal. Today, 2009, 139(4), 244–260 CrossRef.
- K. Ayers, N. Danilovic, R. Ouimet, M. Carmo, B. Pivovar and M. Bornstein, Annu. Rev. Chem. Biomol. Eng., 2019, 10(1), 219–239 CrossRef PubMed.
- D. Galyamin, Á. Tolosana-Moranchel, M. Retuerto and S. Rojas, JACS Au, 2023, 3(9), 2336–2355 CrossRef PubMed.
- S. Krishnan, V. Koning, M. Theodorus de Groot, A. de Groot, P. G. Mendoza, M. Junginger and G. J. Kramer, Int. J. Hydrogen Energy, 2023, 48(83), 32313–32330 CrossRef.
- S. Jovanovic, R. Krause, A. Lüken, J. Ackermann, S. Merz, P. Jakes, R.-A. Eichel and J. Granwehr, J. Electrochem. Soc., 2020, 167, 086505 CrossRef.
- S. Jovanovic, P. Jakes, S. Merz, R.-A. Eichel and J. Granwehr, Electrochem. Sci. Adv., 2021, 2(4), e2100068 CrossRef.
- E. Smith and G. Dent, Modern Raman Spectroscopy: A Practical Approach, 2005.
- A. Damjanovic, A. Dey and J. O. M. Bockris, J. Electrochem. Soc., 1966, 113(7), 739 CrossRef.
- A. Damjanovic and M. K. Y. Wong, J. Electrochem. Soc., 1967, 114(6), 592 CrossRef.
- K. Witke, D. Klaffke, A. Skopp and J. P. Schreckenbach, J. Raman Spectrosc., 1998, 29(5), 411–415 CrossRef.
- O. N. Shebanova and P. Lazor, J. Raman Spectrosc., 2003, 34(11), 845–852 CrossRef.
- K. Trentelman, J. Raman Spectrosc., 2009, 40(5), 585–589 CrossRef.
- J. A. Steele and R. A. Lewis, Opt. Mater. Express, 2014, 4, 10 Search PubMed.
- M. Bauer, P. Davydovskaya, M. Janko, M. Kaliwoda, N. Petersen, S. Gilder and R. W. Stark, J. Raman Spectrosc., 2011, 42(6), 1413–1418 CrossRef.
- A. V. Baranov, K. V. Bogdanov, A. V. Fedorov, M. V. Yarchuk, A. I. Ivanov, V. P. Veiko and K. Berwick, J. Raman Spectrosc., 2011, 42(9), 1780–1783 CrossRef.
- F. Herziger, R. Mirzayev, E. Poliani and J. Maultzsch, Phys. Status Solidi B, 2015, 252(11), 2451–2455 CrossRef.
- J. M. Elorrieta, L. J. Bonales, M. Naji, D. Manara, V. G. Baonza and J. Cobos, J. Raman Spectrosc., 2018, 49(5), 878–884 CrossRef.
- C. Heume; V. Karyofylli; A. Javed; K. Dzieciol; S. Basak; J.-P. Poc; Y. Tasdemir; Y. Rutsch; L. Rein; N. Wolf; S. Speer; S. Jovanovic; L. Treutlein; J. Borowec; F. Hausen; J. Granwehr; H. Kungl; E. Jodat; A. Karl and R.-A. Eichel; Cross-plane iridium-based filaments sap efficiency in Proton Exchange Membrane Electrolyzers, 28 October 2024, PREPRINT (Version 1) available at Research Square https://doi.org/10.21203/rs.3.rs-5337119/v1.
- J. Schindelin, I. Arganda-Carreras, E. Frise, V. Kaynig, M. Longair, T. Pietzsch, S. Preibisch, C. Rueden, S. Saalfeld, B. Schmid, J.-Y. Tinevez, D. J. White, V. Hartenstein, K. Eliceiri, P. Tomancak and A. Cardona, Nat. Methods, 2012, 9(7), 676–682 CrossRef PubMed.
- Y. S. Huang, S. S. Lin, C. R. Huang, M. C. Lee, T. E. Dann and F. Z. Chien, Solid State Commun., 1989, 70(5), 517–522 CrossRef.
- P. C. Liao, C. S. Chen, W. S. Ho, Y. S. Huang and K. K. Tiong, Thin Solid Films, 1997, 301(1–2), 7–11 CrossRef.
- S. Thanawala, D. G. Georgiev, R. J. Baird and G. Auner, Thin Solid Films, 2007, 515(18), 7059–7065 CrossRef.
- S. Cherevko, S. Geiger, O. Kasian, A. Mingers and K. J. J. Mayrhofer, J. Electroanal. Chem., 2016, 774, 102–110 CrossRef.
- Y. B. Mo, I. C. Stefan, W. B. Cai, J. Dong, P. Carey and D. A. Scherson, J. Phys. Chem. B, 2002, 106(14), 3681–3686 CrossRef CAS.
- Z. Pavlovic, C. Ranjan, M. van Gastel and R. Schlogl, Chem. Commun., 2017, 53(92), 12414–12417 RSC.
- Z. Pavlovic, C. Rajan, Q. Gao, M. van Gastel and R. Schlogl, ACS Catal., 2016, 6(12), 8098–8105 CrossRef CAS.
- K. H. Saeed, M. Förster, J. F. Li, L. J. Hardwick and A. J. Cowan, Chem. Commun., 2020, 56(7), 1129–1132 RSC.
- S. Xie, E. Iglesia and A. T. Bell, J. Phys. Chem. B, 2001, 105(22), 5144–5152 CrossRef CAS.
- J. Chrzanowski and J. Irwin, Solid State Commun., 1989, 70(1), 11–14 CrossRef CAS.
- M. B. Pomfret, J. C. Owrutsky and R. A. Walker, J. Phys. Chem. B, 2006, 110(35), 17305–17308 CrossRef CAS PubMed.
- R. Kötz, H. Neff and S. Stucki, J. Electrochem. Soc., 1984, 131(1), 72 CrossRef.
- T. Naito, T. Shinagawa, T. Nishimoto and K. Takanabe, Inorg. Chem. Front., 2021, 8(11), 2900–2917 RSC.
- S. A. Grigoriev, K. A. Dzhus, D. G. Bessarabov and P. Millet, Int. J. Hydrogen Energy, 2014, 39(35), 20440–20446 CrossRef CAS.
- C. Spöri, J. T. H. Kwan, A. Bonakdarpour, D. P. Wilkinson and P. Strasser, Angew. Chem., Int. Ed., 2017, 56(22), 5994–6021 CrossRef.
Footnote |
| † Electronic supplementary information (ESI) available. See DOI: https://doi.org/10.1039/d4cp03592e |
| This journal is © the Owner Societies 2025 |