
Improved thermoelectric efficiency of Sb2Si2Te6 through yttrium-induced nanocompositing†
Kivanc
Saglik‡
 ab,
Xian Yi
Tan‡
ab,
Jinfeng
Dong‡
a,
Ady
Suwardi
c,
Xizu
Wang
b,
Jianwei
Xu
d,
Qiang
Zhu
bd,
Hongfei
Liu
b,
Jing
Cao
*b and
Qingyu
Yan
*a
ab,
Xian Yi
Tan‡
ab,
Jinfeng
Dong‡
a,
Ady
Suwardi
c,
Xizu
Wang
b,
Jianwei
Xu
d,
Qiang
Zhu
bd,
Hongfei
Liu
b,
Jing
Cao
*b and
Qingyu
Yan
*a
aSchool of Materials Science and Engineering, Nanyang Technological University, 50 Nanyang Ave, Block N4.1, 639798, Singapore. E-mail: alexyan@ntu.edu.sg
bInstitute of Materials Research and Engineering (IMRE), Agency for Science, Technology, and Research (A*STAR), 2 Fusionopolis Way, 138634, Singapore. E-mail: cao_jing@imre.a-star.edu.sg
cDepartment of Electrical Engineering, The Chinese University of Hong Kong (CUHK), Central Ave, Hong Kong 999077
dInstitute of Sustainability for Chemicals, Energy, and Environment (ISCE2), Agency for Science, Technology, and Research (A*STAR), 1 Pesek Road, Jurong Island, 627833, Singapore
First published on 9th December 2024
Abstract
Sb2Si2Te6 is a promising 2D material for medium-temperature thermoelectric applications, with the thermoelectric figure of merit zT approaching 1 at 823 K. However, its widespread use has been limited by relatively low power factor values. In this study, we successfully enhanced the performance of Sb2Si2Te6 by introducing Yttrium nanocomposites. This modification fine-tuned the carrier concentration and electrical conductivity, and increased the power factor up to 946 μW K−1 at 570 K. Jonker plot analysis revealed that increased carrier concentration did not affect the intrinsic electronic properties. SEM and TEM analyses revealed that Y nano-compositing introduced secondary phases, reducing the lattice thermal conductivity to values close to simulated ones using the Debye–Callaway model. Sb1.98Y0.02Si2Te6 exhibited the highest zT of 1.49 at 773 K due to the ultralow lattice thermal conductivity of 0.29 W m−1 K−1 and a moderate power factor of 858 μW K−1 at the same temperature. The single parabolic band (SPB) model suggests that with further optimization of the Fermi level and additional reduction in lattice thermal conductivity, the zT value could potentially increase to 1.55. These results demonstrate the potential of Y nanocompositing for enhancing Sb2Si2Te6 as an efficient medium-temperature thermoelectric material.
Introduction
With the rising energy demand, transitioning to renewable energy sources has become essential. However, approximately 60% of the energy is lost as waste heat to the surroundings. Thermoelectric materials offer a promising solution by directly converting this waste heat into useful electricity.1 The performance of thermoelectric materials is quantified by a dimensionless figure of merit, zT, which is expressed as zT = (S2σ/κ)T, where S, σ, κ, and T represent the Seebeck coefficient, electrical conductivity, thermal conductivity, and temperature, respectively.2 Ideally, thermoelectric materials should possess a high Seebeck coefficient and electrical conductivity alongside exceptionally low thermal conductivity, as evident from the zT equation.3 However, achieving these seemingly conflicting properties simultaneously presents a significant challenge due to the inherent interdependence of these thermoelectric transport properties.Consequently, strategies to optimize the thermoelectric figure of merit focus on two primary approaches: enhancing the power factor (S2σ) or minimizing the lattice thermal conductivity, the only term in the zT equation independent of carrier concentration.1 The power factor can be improved through various techniques, including increasing band degeneracy,4–6 optimizing carrier concentration,7 and implementing band engineering strategies.8,9 Conversely, strategies to reduce the lattice thermal conductivity involve the introduction of nanoprecipitates,10–12 defect engineering,13–15 high entropy engineering,16 the creation of all-scale hierarchical microstructures,17–19 or the utilization of materials with complex crystal structures.20–23 State-of-the-art thermoelectric materials generally contain tellurium due to their heavy nature yielding low thermal conductivity. Governed by their bandgap, thermoelectric materials can be utilized in different temperature applications, such as in low, medium, and high temperatures. Some superior thermoelectric materials containing Te could be classified as GeTe24,25 and PbTe17,26 for high temperature, MnTe2 and AgSbTe227,28 for medium temperature, and Bi2Te329,30 or Sb2Te323 based materials for room temperature applications. This enables thermoelectric materials to be utilized in a wide range of fields, such as space exploration,1 vehicles,13 wearables,31,32 and more.
Recently, the A2B2Q6 family (A: Sb, Bi, Sc, Cr; B: Si, Ge; Q: Te, Se) has emerged as a promising candidate for medium-temperature applications due to their layered structure.33,34 These materials exhibit the potential to decouple the inherently interdependent thermoelectric transport properties due to their anisotropic electronic and phonon transport characteristics.34,35
Within A2B2Q6 family, Sb2Si2Te6 (SST) outperforms Bi2Si2Te6,36 Sc2Si2Te634 and Cr2Ge2Te633 due to its lower thermal conductivity and moderate Seebeck coefficient. The low thermal conductivity is attributed to the low sound speed, large Grüneisen parameters, and point defect scattering caused by nanoprecipitates.8,30,35 These nano-precipitates reduce the lattice thermal conductivity and facilitate hole transport.36 Additionally, van der Waals forces between SST layers contribute to its low thermal conductivity. Computational studies support these findings by revealing short phonon lifetimes in SST monolayers.37
The moderate Seebeck coefficient 120 μV K−1 in p-type SST stems from its doubly degenerate valence band maximum (VBM)38 and strong band dispersion,34,35 resulting in higher carrier mobility. Despite its promising properties, the peak zT of p-type pristine SST remains at 1.08, prompting researchers to explore doping strategies with elements like Ca, Mg, into Sb, and Ge into Si sites.7,39,40 Bi2Si2Te6, a structural analogue of SST, exhibits inferior performance. However, the alloy containing BiSbSi2Te6 achieves a peak zT of 1.15 at 773 K.36,41 Interestingly, doping Bi0.4Sb1.6Te3 with SST nanoparticles elevates its zT to 1.35 by prompting phonon scattering and increasing carrier concentration.30 However, a significant challenge associated with SST is its instability at elevated temperatures, leading to irreversible decomposition. Doping studies inadvertently accelerate this process,7,39 but incorporating Si2Te3 nanostructures within the SST matrix offers a groundbreaking solution. This disrupts electron transport while preserving hole transport and enhances phonon scattering, yielding a peak zT of 1.6.8 Additionally, yttrium serves as an effective dopant to tune the carrier concentration and optimize thermoelectric performance of many thermoelectric materials, such as Mg3Sb2,42–44 GeTe,45 and Hf0.6Zr0.4NiSn0.98Sb0.02.46
In this work, instead of increasing carrier concentration via doping with 2+ elements, we introduced isovalent Y-nanocomposites (3+) to strategically reduce the carrier concentration of Sb2−xYxSi2Te6, (0 ≤ x ≤ 0.03). Hall effect measurements revealed a reduction in both the carrier concentration and Hall mobility of samples. Furthermore, the effective mass decreased due to increased scattering. An optimum value of Seebeck coefficient47 has been achieved, thereby the power factor of the best-performing sample (Sb1.98Y0.02Si2Te6) has increased to 946 μW K−1. However, weighted mobilities remain unchanged, suggesting that the carrier scattering mechanism was unaffected. Jonker plot analysis confirmed that the samples’ intrinsic electronic transport quality σE0 was also preserved. Y-nanocompositing also led to a notable reduction in the lattice thermal conductivity to 0.29 W m−1 K−1 due to additional defects. Using the simplified Debye–Callaway model, we deduced that increased point defect scattering effectively reduced the lattice thermal conductivity, approaching the amorphous limit of 0.27 W m−1 K−1. The possible defects are determined to be YxOy, Y, Si2Te3 and Sb2Te3 as revealed by SEM and TEM studies. It is widely recognized that when lone pairs from positively charged species like Sb3+ are present, thermal conductivity decreases significantly.20,48 In our study, we managed to achieve an even lower thermal conductivity by reducing the number of lone pairs. Due to the simultaneous reduction in electrical conductivity and thermal conductivity, the weighted mobilities of all samples decreased. However, the lattice thermal conductivities experienced a sharp decrease and, the quality factor was significantly enhanced with a corresponding decrease in the Fermi level. Single parabolic band (SPB) model analysis reveals that this synergistic interaction between reduced thermal conductivity and optimized carrier concentration leads to a peak zT value of 1.49 for Sb1.98Y0.02Si2Te6. Moreover, the Y-nanocompositing strategy introduced in this work opens a pathway for further zT improvement by further alloying with Y.
Experimental
Nominal compositions of Sb2−xYxSi2Te6 (x = 0.0, 0.01, 0.02, and 0.03) were prepared by precisely weighing stoichiometric amounts of pure Sb, Si, and Te granules alongside Y powder. The elemental constituents were loaded into high-energy ball milling jars within an N2-filled glovebox, and subsequently subjected to ball milling (SPEX 8000D) for 1.5 hours. Following milling, the resultant powders were transferred into quartz ampoules and hermetically sealed under vacuum. The quartz ampoules containing the powders were then gradually heated to 823 K over 5 hours, maintained at this temperature for 48 hours, and naturally cooled under ambient conditions. The resulting ingots were densified via Spark Plasma Sintering (SPS, Ed-PassIVJ, 6T-3P-30, Japan) at 773 K, applying a uniaxial pressure of 60 MPa for 5 minutes. Recognizing the anisotropic nature of SST, samples were cut into in-plane and cross-plane orientations.The thermal and electrical transport properties were evaluated along the direction parallel to the pressing direction, which is cross-plane. Electrical conductivity (σ) and Seebeck coefficient (S) were measured for bar-shaped samples (11 × 2 × 2 mm3) using a ZEM-3 system (ULVAC-RIKO, Japan). Thermal diffusivity (D) was determined using the Laser Flash Analysis technique with a NETZSCH instrument. Thermal conductivity was calculated using the following equation:
| κ = D × Cp × ρ |
Due to the potential decomposition of SST into Sb2Te3 and Si2Te3 at high temperatures, and the known phase transition in Si2Te3, temperature-dependent specific heat capacity (Cp) values were obtained from the literature,8 instead of using the Dulong–Petit approximation. The electronic contribution to thermal conductivity (κe) was calculated using the Wiedemann–Franz relation:
| κe = L·σ·T, |
To identify the crystalline phases present in the sample, X-ray diffraction (XRD) analysis was performed using a Bruker D8 Advance diffractometer with CuKα radiation. The scan parameters included a step size of 0.02° and a 2θ range of 10° to 80°. Rietveld refinement of the Sb2−xYxSi2Te6 samples was performed using the Fullprof software. The nominal compositions were analyzed using X-ray fluorescence (XRF) with a Bruker M4-Tornado, equipped with a Rh X-ray tube operating at 50 kV and 200 μA. Microstructural and elemental characterization was performed using a field-emission scanning electron microscope (FESEM, JEOL JSM 7600F) containing an energy-dispersive X-ray spectrometer (EDS) detector. Sb1.98Y0.02Si2Te6 was analyzed by XPS using a Kratos AXIS Supra+ instrument with an Al-Kα X-ray source. The NIST database was utilized for matching XPS peaks with the literature.
Results and discussion
Structural characterization
The powder X-ray diffractograms depicted in Fig. 1a present the structural characterization of Sb2−xYxSi2Te6 (x = 0.00, 0.01, 0.02, and 0.03). The cif. file and intensity vs. 2θ values for the Sb2Si2Te6 (CDCC #1947640) were obtained from the literature.8 Sb2Si2Te6 crystallizes in a trigonal symmetry with a space group of R![[3 with combining macron]](https://www.rsc.org/images/entities/char_0033_0304.gif) . All samples were successfully indexed to pure Sb2Si2Te6, indicating the absence of decomposition products such as Sb2Te3 and Si2Te3. Notably, XRD analysis did not detect any peaks associated with Yttrium, implying either its dissolution within the SST matrix or its concentration being below the detection limit of XRD. Fig. 1b clearly depicts a significant shift in the 2θ positions of the maximum intensity peak of SST following Y-nanocompositing. This shift is attributed to the larger ionic radius of Y3+, which likely induces structural expansion upon Sb substitution. Further substantiating this observation are the lattice parameters calculated through Rietveld Refinement, as shown in Fig. 1c. Notably, all lattice parameters, and consequently the cell volume, exhibit an increase with Y amount. The lattice parameters and the cell volume start to saturate for Sb1.98Y0.02Si2Te6, indicating that the solubility limit of Y in Sb2Si2Te6 is about to be reached. In order to further elaborate on the solubility limit, Rietveld refinement was performed on an additional composition, Sb1.96Y0.04Si2Te6, as shown in Fig. S5 (ESI†). It has been revealed that the lattice parameters of this composition are lower than the compositions with lower Y content. This means that the lattice parameters of Sb2−xYxSi2Te6 first increase with Y doping until it reaches a saturation point. After the saturation point, the excessive Y could lead to secondary phases or strain in the sample which reduces the lattice parameters. As a result, it has been revealed that the solubility limit has been achieved in Sb1.97Y0.03Si2Te6. Graphical representations of Rietveld refinement and analysis parameters are reported in Fig. S4 and Table S3 (ESI†), respectively.
. All samples were successfully indexed to pure Sb2Si2Te6, indicating the absence of decomposition products such as Sb2Te3 and Si2Te3. Notably, XRD analysis did not detect any peaks associated with Yttrium, implying either its dissolution within the SST matrix or its concentration being below the detection limit of XRD. Fig. 1b clearly depicts a significant shift in the 2θ positions of the maximum intensity peak of SST following Y-nanocompositing. This shift is attributed to the larger ionic radius of Y3+, which likely induces structural expansion upon Sb substitution. Further substantiating this observation are the lattice parameters calculated through Rietveld Refinement, as shown in Fig. 1c. Notably, all lattice parameters, and consequently the cell volume, exhibit an increase with Y amount. The lattice parameters and the cell volume start to saturate for Sb1.98Y0.02Si2Te6, indicating that the solubility limit of Y in Sb2Si2Te6 is about to be reached. In order to further elaborate on the solubility limit, Rietveld refinement was performed on an additional composition, Sb1.96Y0.04Si2Te6, as shown in Fig. S5 (ESI†). It has been revealed that the lattice parameters of this composition are lower than the compositions with lower Y content. This means that the lattice parameters of Sb2−xYxSi2Te6 first increase with Y doping until it reaches a saturation point. After the saturation point, the excessive Y could lead to secondary phases or strain in the sample which reduces the lattice parameters. As a result, it has been revealed that the solubility limit has been achieved in Sb1.97Y0.03Si2Te6. Graphical representations of Rietveld refinement and analysis parameters are reported in Fig. S4 and Table S3 (ESI†), respectively.
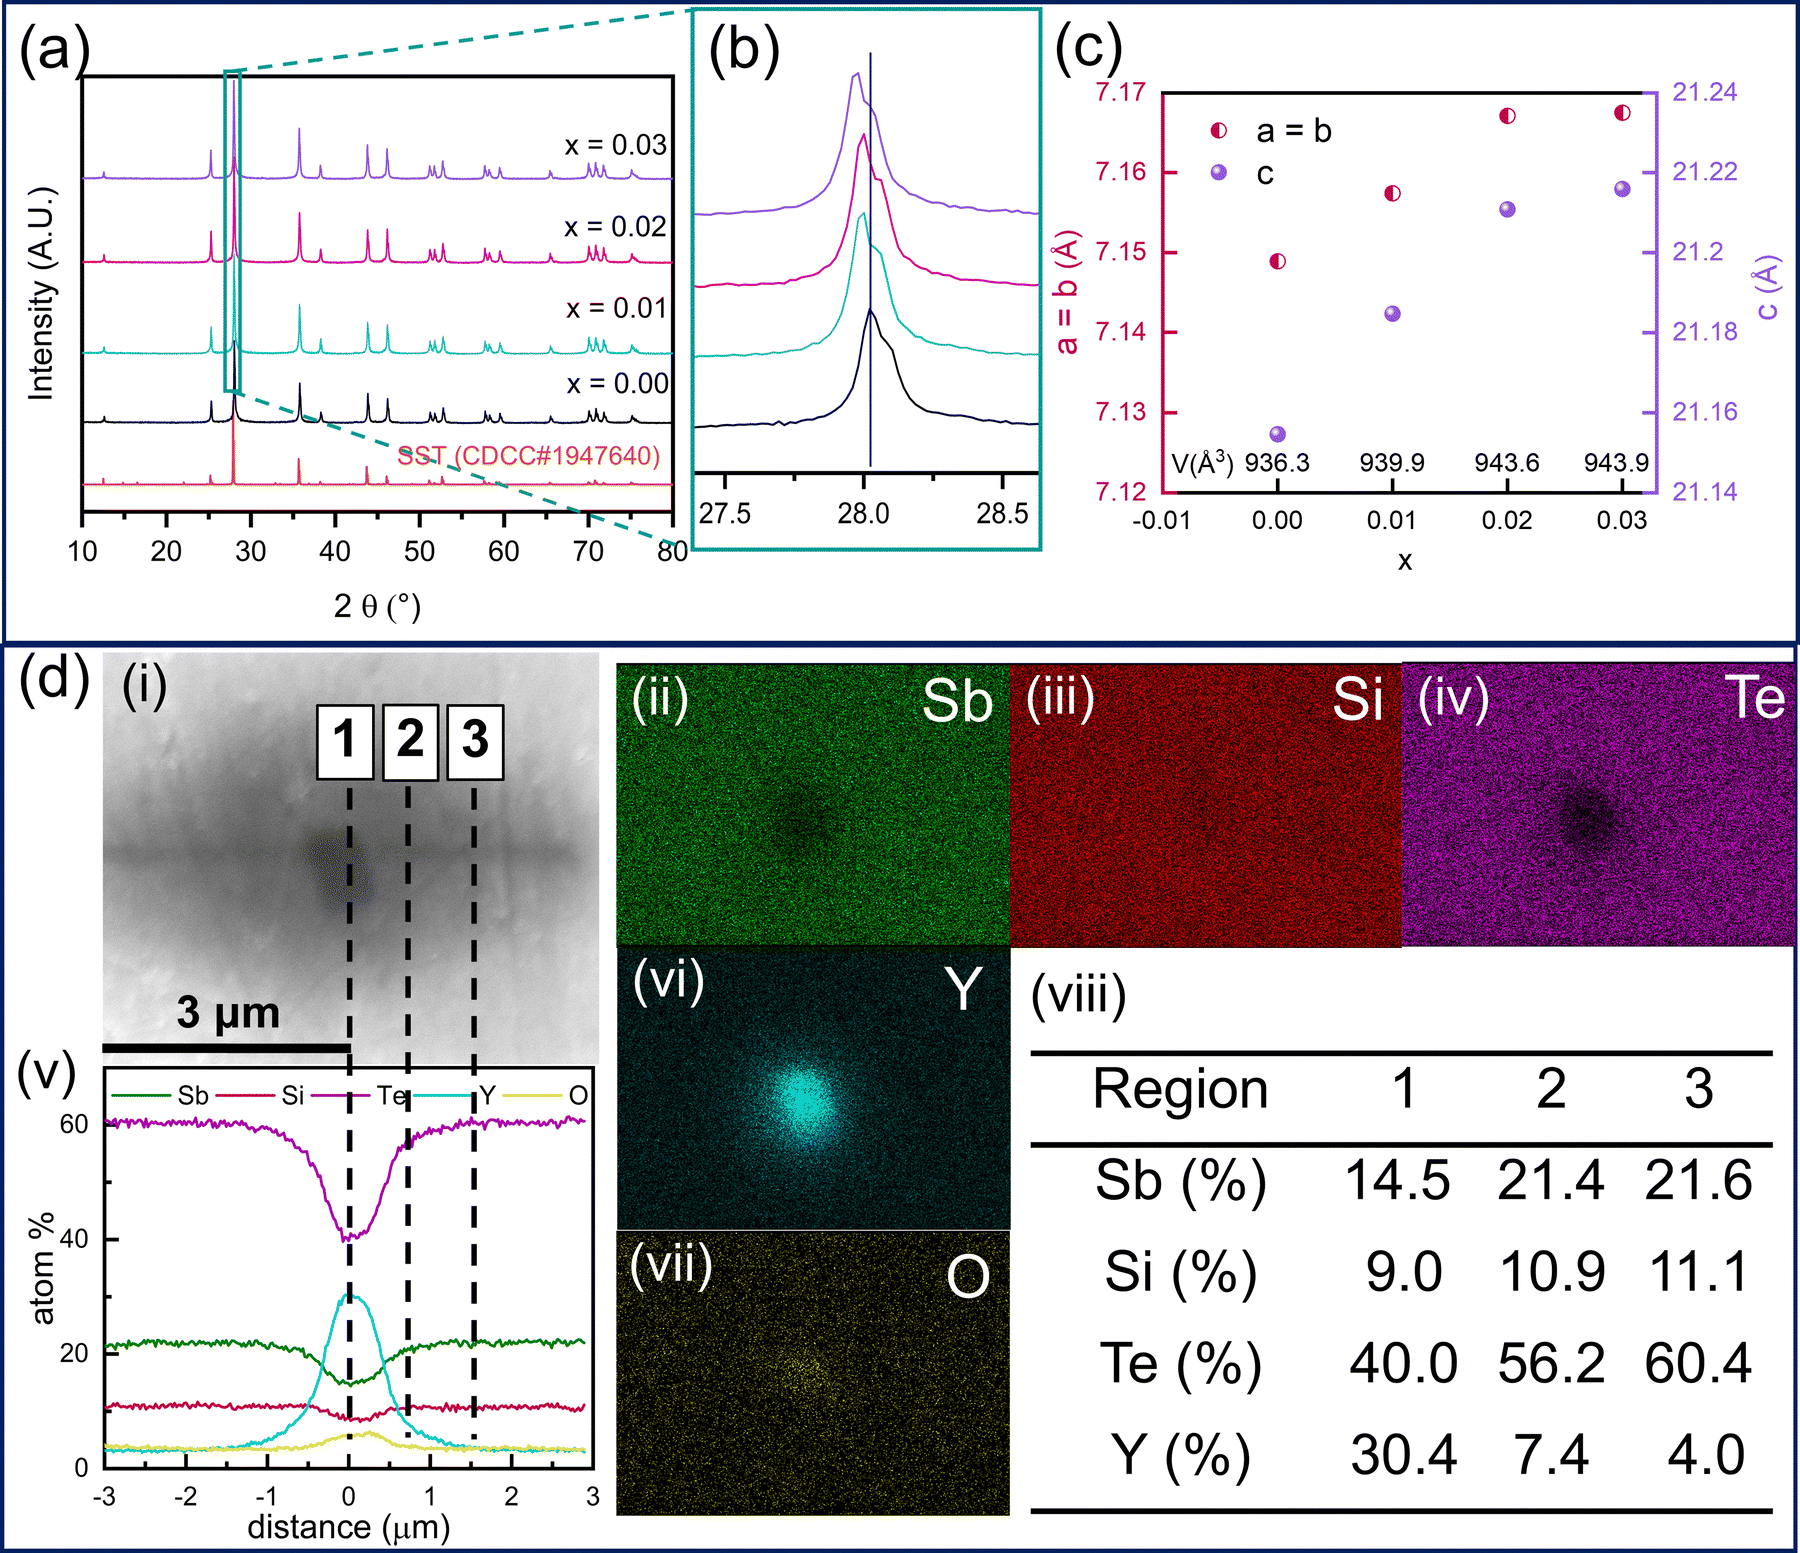 | ||
| Fig. 1 Powder X-ray diffractograms of Sb2−xYxSi2Te6; (a) spanning from 2θ = 10–80°, (b) zoomed-in diffractogram spanning from 2θ = 27.5–29.5°, (c) lattice parameters of Sb2−xYxSi2Te6, (d) (i) FESEM image of Sb1.98Y0.02Si2Te6 and its elemental mapping images showing the distribution of (ii) Sb, (iii) Si, (iv) Te, (vi) Y and (vii) O. (v) Line scan of Sb1.98Y0.02Si2Te6 showing the compositional change throughout the sample. (viii) Detailed quantification results revealing the atomic percent of each element. | ||
Microstructural characterization of Sb2−xYxSi2Te6 samples was conducted using scanning electron microscopy (SEM) (Fig. 1d(i), Fig. S1 and S2, ESI†). Elemental mapping images in Fig. 1d(ii)–(iv), (vi) and (vii) reveal the presence of YxOy precipitates in Sb1.98Y0.02Si2Te6. These findings are further proven by the line scan analysis reported in Fig. 1d(v). The black precipitate shown in Fig. 1 has a Y concentration of 30.4%, which decreases to 4.0% with increasing distance from the center. Additionally, this finding reveals the diffusion of Y into the matrix. The XRD analysis of the same surface reveals the Y2O3 phase, as reported in Fig. S3 (ESI†). On the other hand, the SEM images in Fig. S2 (ESI†) reveal a distinct contrast between regions (1) and (2). Energy dispersive X-ray spectroscopy (EDS) analyses confirmed region (2) as comprising Sb2Te3 precipitates, while regions (1), (4) and (6) represent Sb2Si2Te6. These observations are corroborated by elemental maps, which show Sb agglomerates in the regions (2) and (6) and a lack of Si. Conversely, Te distribution was observed to be homogenous throughout the sample, consistent with both the SST matrix and Sb2Te3 containing Te. Notably, Te precipitates are observed in the region (3), in addition to Sb2Te3 precipitates revealed in the region (5). Significantly, Y precipitates are also observed in Sb1.98Y0.02Si2Te6 as shown in the region (7) in Fig. 1d(vi). The detailed quantification of each region is reported in Fig. 1d(viii). On the other hand, the undoped Sb2Si2Te6 contains only Sb and Si precipitates, as revealed by the elemental maps in Fig. S1 (ESI†). Localized precipitates of Y and YxOy rather than a homogenous distribution of Y over the matrix reveal the Y nanocompositing through Sb2Si2Te6. As a result, Y-nanocompositing results in an increased density of microprecipitates, which explains the drastic drop in lattice thermal conductivity.
High-resolution transmission electron microscopy (HRTEM) analysis was performed on Sb1.98Y0.02Si2Te6 (Fig. 2). Fig. 2a reveals bright precipitates identified as Y-based through elemental mapping (Fig. 2a(i)–(iv)). The surrounding darker matrix corresponds to the SST phase. Elemental mapping confirms the presence of Y in the bright regions, while Sb, Si and Te exhibit homogenous distribution within the darker regions. The HRTEM observation of Y precipitates in Sb1.98Y0.02Si2Te6 further confirms that the solubility limit of Y in Sb2Si2Te6 has been reached,49–51 consistent with the results from Rietveld refinement. The phonon scattering by the Y-precipitates likely reduces the lattice thermal conductivity. The zoomed-in images in Fig. 2b–d showcase the Y-based precipitates with clear grain boundaries (Fig. 2d). Grain boundaries are known to be preferential locations for dislocations. Consequently, the presence of grain boundaries within the Y-precipitates could further decrease the lattice thermal conductivity of Sb1.98Y0.02Si2Te6.
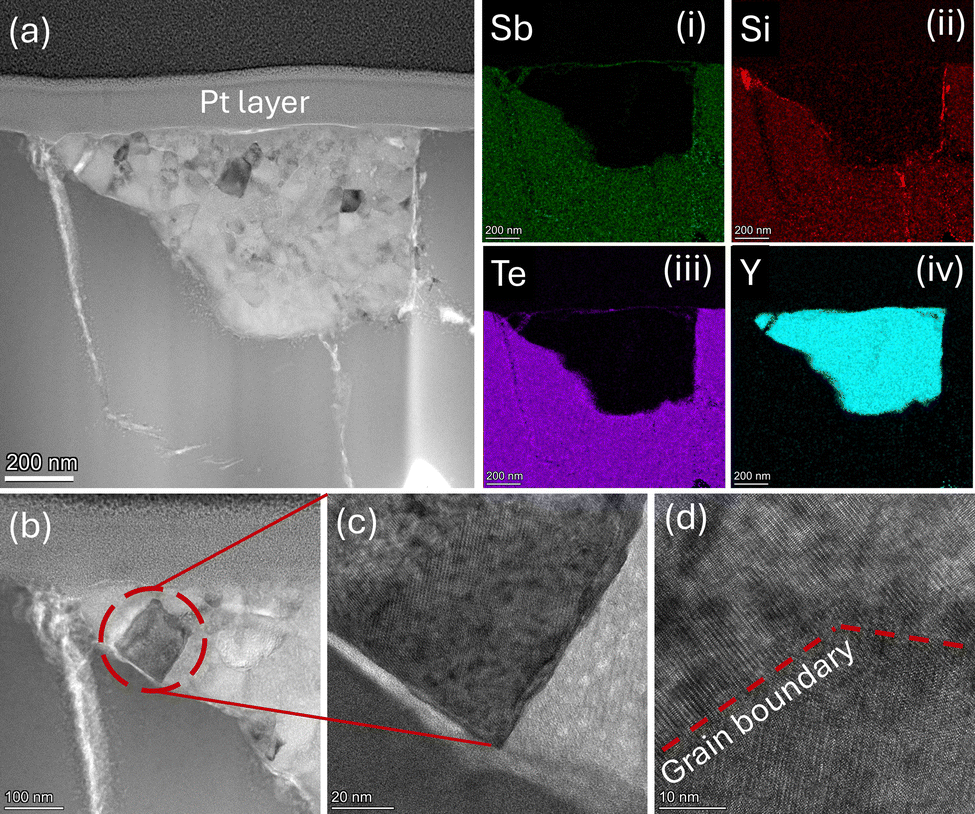 | ||
| Fig. 2 (a) HRTEM image of Sb1.98Y0.02Si2Te6, and elemental mapping images showing the distribution of (i) Sb, (ii) Si, (iii) Te and (iv) Y. (b), (c) and (d) show the zoomed-in HRTEM images of the Y precipitate. | ||
In addition, the nominal compositions of Sb2−xYxSi2Te6 were tested by XRF and EDS. As reported in Table S2 (ESI†), Yttrium concentration in the actual composition aligns with the nominal compositions.
X-ray photoelectron spectroscopy (XPS) was performed on Sb1.98Y0.02Si2Te6 to gain deeper insights into the partial decomposition of Sb2Si2Te6 and the formation of Y-related crystalline phases. As reported in Fig. S6 (ESI†), Sb peaks match with those of Sb3+ and Sb2Te3.52 Similarly, Te peaks reported in Fig. S6(d) (ESI†) match with those of TeO253 and Sb2Te3.52 As a result, these findings confirm the presence of Sb2Te3 precipitates, as observed in the SEM images reported in Fig. S2 (ESI†). On the other hand, TeO2 and Sb2Te3 are decomposition products of Sb2Si2Te6, supporting that doping elements favor partial decomposition of Sb2Si2Te6.39 The decomposition reactions are outlined below:39,54
| Sb2Si2Te6(s) → Si2Te3(s) + Sb2Te3(s) | (1) |
| Si2Te3 + 4H2O(g) → 2SiO2(s) + 3H2Te(g) + H2(g) | (2) |
| H2Te(g) → H2(g) + Te(s) | (3) |
| Te(s) + O2(g) → TeO2(s) | (4) |
Another decomposition product, SiO2, was observed in the XPS spectra of Si, reported in Fig. S6(b) (ESI†). However, the binding energy shifts indicate that SiO2 forms an interface with Y2O3, whose peaks are reported in Fig. S6(c) (ESI†). A high signal-to-noise ratio is observed in the XPS spectra of Y due to the low concentration of Y in the Sb2Si2Te6 matrix. The SiO2/Y2O355,56 interface is further supported by the elemental mapping images shown in Fig. 1d(iii) and (vi). In these images, the Y-agglomerated region contains only Si and O, with no detectable Te or Sb.
Thermoelectric transport properties
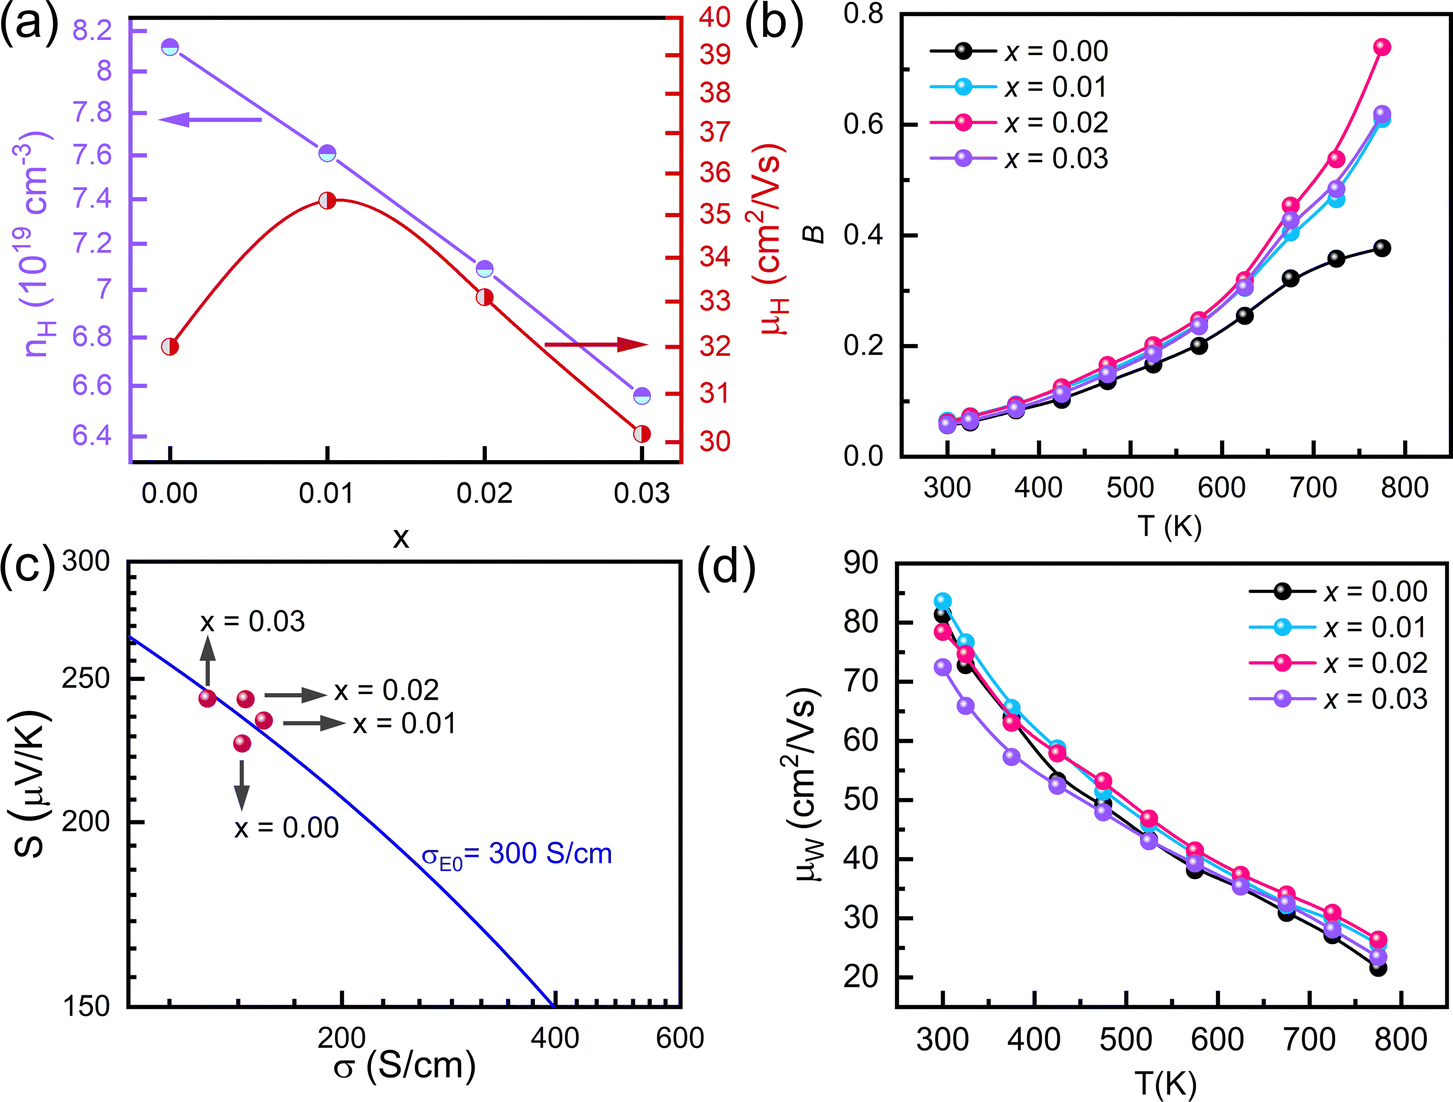
The electrical transport properties and zT values of Sb2−xYxSi2Te6 samples in the direction parallel to the pressing direction (cross-plane) are reported in Fig. 3. Fig. 3a shows that the electrical conductivity of all samples decreases with increasing temperature, a characteristic behavior of degenerate semiconductors due to decreased carrier mobility at high temperatures. Interestingly, the electrical conductivity of Sb1.99Y0.01Si2Te6 is nearly identical to that of the pristine SST. In contrast, the room temperature electrical conductivity increases for samples with higher Y content, converging towards similar values for all samples at the maximum measurement temperature (773 K). The negative slope of electrical conductivity with respect to the temperature indicates that the acoustic phonon scattering (σ ∝ T−1.5)57 dominates throughout the measurement temperature. As a result, Y-nano compositing does not alter the scattering mechanism of Sb2Si2Te6. | ||
| Fig. 3 Electronic transport properties of Sb2−xYxSi2Te6 (x = 0.00–0.03) with respect to temperature: (a) electrical conductivity, (b) Seebeck coefficient, and (c) power factor. | ||
The Seebeck coefficient of SST-Y nanocomposites in Fig. 3b exhibits a trend similar to the electrical conductivity, reflecting the decrease in carrier concentration. The room temperature Seebeck coefficient of Sb1.99Y0.01Si2Te6 is comparable to that of Sb2Si2Te6. However, the Seebeck coefficient of Sb1.98Y0.02Si2Te6 and Sb1.97Y0.03Si2Te6 decreases with increasing yttrium concentration, indicating a reduction in carrier concentration. In addition, it is well known that the Seebeck coefficient changes either with carrier concentration, or alterations in the scattering mechanism. The unchanged slope of electrical conductivity indicates that the scattering mechanism is the same, so the increase in the Seebeck coefficient originates from decreased carrier concentration. This observation is further confirmed by Hall Effect measurements in Table 1, which reveal a drastic decrease at higher Y concentrations. For p-type materials like SST, a decrease in carrier concentration is associated with an increase in the Fermi level. This trend is corroborated by the Single parabolic band (SPB) model results in Fig. 6b, which depict a lowering of the Fermi level with Y nanocompositing. The decrease in carrier concentration may result from the formation of Y2Te3, which is an n-type material.58 However, the Y amount used in these samples is lower than the detection limits of SEM, limiting the observation of Y2Te3 precipitates in the samples. The Seebeck coefficient reaches optimal values (210 μV K−1) at temperatures exceeding 550 K, considering the reported lattice thermal conductivity of SST samples (0.9 W m−1 K−1).59 This finding suggests that the carrier concentration in SST is already optimized, and further improvement through carrier concentration optimization might be limited.
| n H (1019 cm−3) | S (μV K−1) |
|
σ (S cm−1) | μ W (cm2 V−1 s−1) | μ H (cm2 V−1 s−1) | |
|---|---|---|---|---|---|---|
| x = 0.00 | 8.12 | 128.3 | 1.36 | 415.9 | 81.3 | 32.0 |
| x = 0.01 | 7.61 | 127.6 | 1.29 | 430.2 | 83.6 | 35.3 |
| x = 0.02 | 7.09 | 133.8 | 1.32 | 375.4 | 78.4 | 33.1 |
| x = 0.03 | 6.56 | 141.6 | 1.36 | 316.7 | 72.4 | 30.2 |

Capitalizing on the decent electrical conductivity and moderate Seebeck coefficient, the power factor (Fig. 3c) of Sb1.99Y0.01Si2Te6 and Sb1.98Y0.02Si2Te surpasses that of the pristine SST, potentially due to enhanced weighted mobilities (μW). Conversely, the power factor of Sb1.97Y0.03Si2Te6 decreases due to a substantial reduction in carrier concentration at high Y content. Weighted mobility offers a more comprehensive evaluation of a material's thermoelectric potential compared to the power factor alone. Therefore, we calculated and reported the weighted mobilities in Fig. 4d. Weighted mobility of all samples decreases with increasing temperature, because charges are more scattered when they have higher energy at high temperatures. The weighted mobilities of samples do not reveal a significant change with nanocompositing, this means that the Y did not induce charge scattering. To elucidate the trends in electrical conductivity and Seebeck coefficient, we conducted room temperature measurements of carrier concentration and Hall mobility (μH) using the Hall Effect. Fig. 4a illustrates that the carrier concentration of Sb2−xYxSi2Te6 samples decreases with increasing yttrium amount. The reduction in carrier concentration also correlates with a decrease in Hall mobilities, as depicted in Fig. 4a. It should be noted that the Hall mobility of Sb1.99Y0.01Si2Te6 is larger than that of the pristine Sb2Si2Te6. However, the Hall mobilities of samples decrease with further Y introduction (x > 0.02). This may suggest changes in the band structure. As reported in Fig. 6b, the Fermi level decreases with increased Y introduction. For the Sb1.99Y0.01Si2Te6, slightly reduced Fermi level may expose bands with light effective mass. As a result, the effective mass lowers and the mobility increases. With the Fermi level further going down, the mobility drops because of the reduced carrier concentration. In addition, the simultaneous reduction in lattice thermal conductivity (explained later) indicates that Sb2Te3 precipitates increase the phonon scattering. Similarly, these precipitates could increase the scattering of charge carriers, and lead to a slight decrease in their mobilities. The decrease in electrical conductivity with Y amount aligns with this finding.
 | ||
| Fig. 4 (a) The carrier concentration and hall mobility with respect to carrier concentration, (b) quality factor values, (c) Jonker plot analysis, and (d) weighted mobility of Sb2−xYxSi2Te6 (x = 0.00, 0.01, 0.02, and 0.03). | ||
Understanding weighted mobility allows for the evaluation of the density of states effective mass ( ) through the relationship
  .60 The comparable weighted mobility values among Y added samples imply that Y does not significantly alter the
  and band structure. This result is further supported by the similar
  values reported in Table 1. Consequently, the observed zT enhancement can be primarily attributed to optimized carrier concentration. Since the
  significantly influences the Seebeck coefficient, we calculated and tabulated the
  values for all samples in Table 1. The
  of Sb1.99Y0.01Si2Te6 is lower than that of the pristine sample, but the effective mass increases with further Y introduction. These findings align with the changes in weighted mobility, regarding that the bands with higher effective mass induce carriers with lower mobility.
Given the interconnected nature of electrical properties via carrier concentration, analyzing the quality factor proves to be a promising strategy for uncovering the overall enhancement in thermoelectric performance. Accordingly, we have conducted a quality factor (B) analysis and presented the results in Fig. 4b. The quality factor  60 values, calculated across the measurement temperatures, exhibit a trend that mirrors the observed increase in zT. This behavior aligns with the established relationship between B, μW, and κL (B ∝ μW/κL)61. Despite a slight decrease in weighted mobility, the substantial reduction in lattice thermal conductivity ultimately leads to a higher B value throughout the measurement temperature range. This suggests that the improvement in zT primarily stems from the optimized carrier concentration achieved through Y-nanocompositing, allowing the material to capitalize on its intrinsic potential for thermoelectric performance.
To isolate the impact of carrier concentration on the improvement in electrical transport properties, Jonker plot analysis was performed on all samples, as shown in Fig. 4c. The analysis reveals electronic transport coefficients (σE0) hovering around 300 S cm−1 for all samples. The insignificant change in σE0 after Y nanocompositing suggests that the intrinsic electronic transport properties of Sb2Si2Te6 remain largely unaffected. This implies that the observed enhancement in electrical transport likely originates from the optimized carrier concentration achieved through nanocompositing with Y.
The thermal transport properties of cross-plane Sb2−xYxSi2Te6 samples are reported in Fig. 5a–c. The electronic portion of thermal conductivity (κe) was calculated using the Wiedemann–Franz law as: κe = σ·L·T where L is the Lorenz factor calculated using the SPB model. The detailed explanation is provided in the ESI.† The phonon contribution of thermal conductivity (κL) was calculated using the following equation:
| κ = κe + κL. |
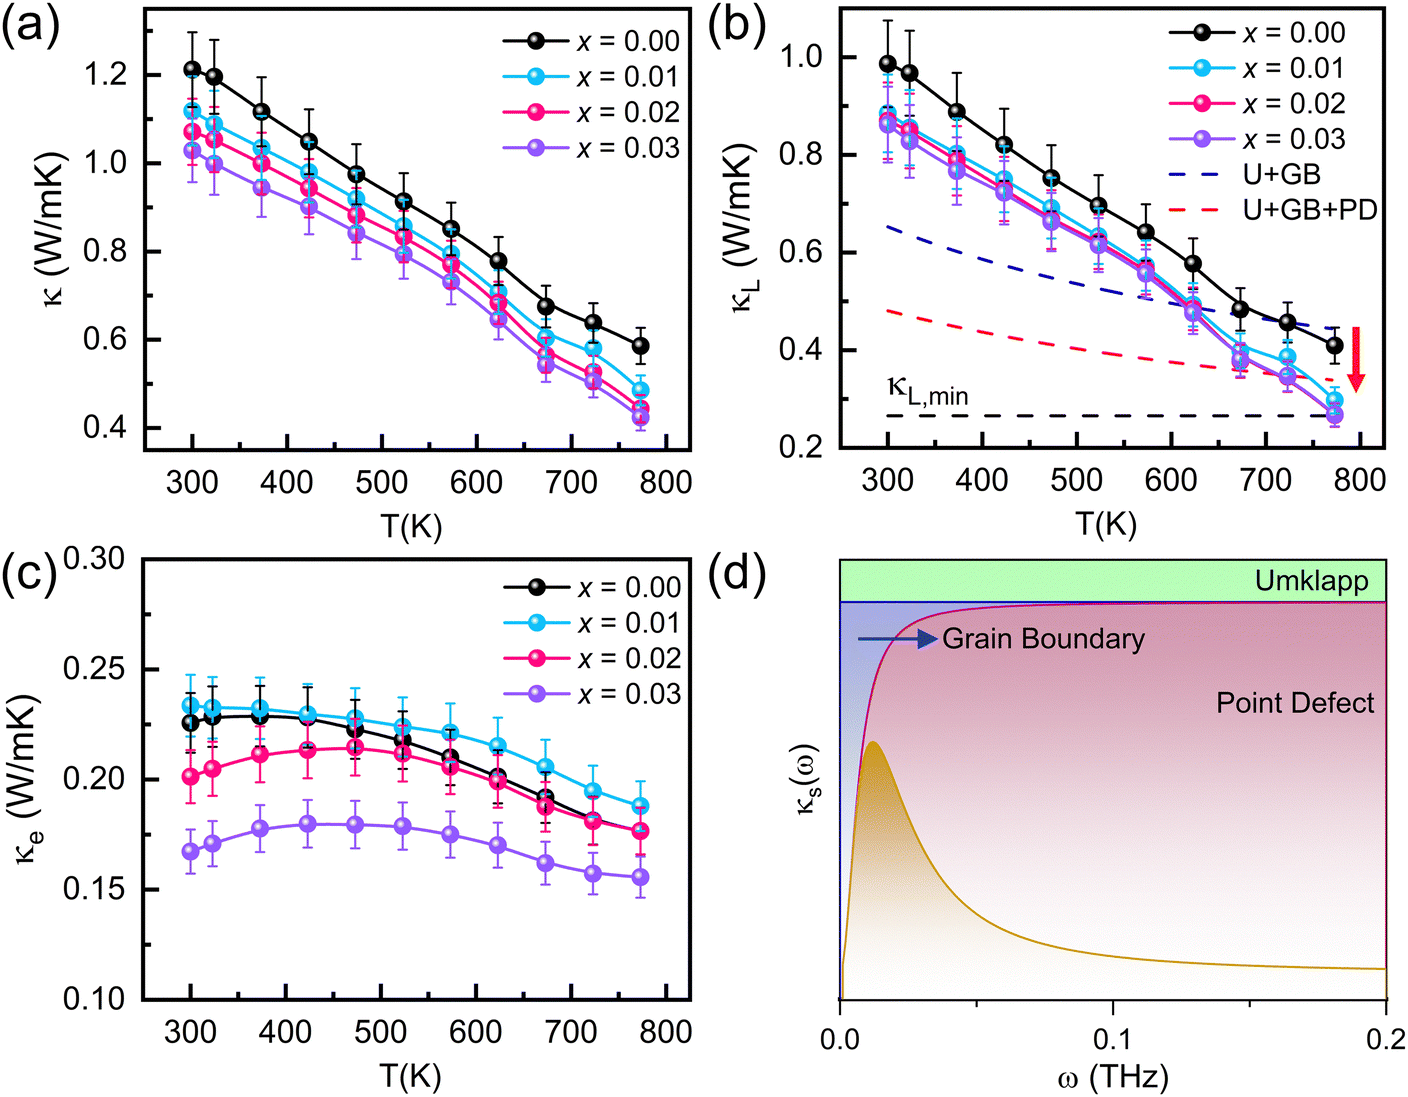 | ||
| Fig. 5 (a) Thermal conductivity, (b) lattice thermal conductivity, (c) electronic thermal conductivity, and (d) Debye–Cahill modeling of lattice thermal conductivity of Sb2−xYxSi2Te6 (x = 0.0, 0.01, 0.02, and 0.03). | ||
The thermal conductivities of all samples decrease with temperature. The absence of an upturn in the thermal conductivity indicates that the bandgap is large enough, so minority carriers do not contribute to the thermal conductivity. The slight change in the slope of thermal conductivity is ascribed to the phase change from α to β-Si2Te3.8 This finding suggests that Sb2Si2Te6 decomposes into Si2Te3 and Sb2Te3. While Sb2Te3 precipitates could be observed in FESEM images (Fig. S1 (ESI†)), Si2Te3 reacts with the humidity in the air and produces Te.62 Since all compounds contain tellurium, its detection through SEM is highly challenging. Notably, the total thermal conductivities were found to decrease with increasing Y content. Similarly, the lattice thermal conductivities (Fig. 5b) decrease with Y addition. However, the decrease in the lattice thermal conductivity reaches a saturation value at Sb1.97Y0.03Si2Te6, and is not affected by further doping. Sb2Te3 precipitates, reported in Fig. 1c, potentially enhance the phonon scattering in Sb2−xYxSi2Te6, to decrease the lattice thermal conductivity. To delve deeper into the reasons behind this decrease, we employed the Debye–Callaway model (Fig. 5c). The blue dashed line indicates the contributions from Umklapp (U) and grain boundary (GB) scatterings, whereas the red dashed line represents point defect (PD) scattering in addition to U and GB. While pristine Sb2Si2Te6 exhibits Umklapp and grain boundary scattering, SST-Y nanocomposites show additional point defect scatterings, as supported by the presence of Sb2Te3 precipitates revealed by SEM analysis. These point defects scatter low to mid-frequency phonons, elucidating the decrease in lattice thermal conductivity and the peak performance observed at higher temperatures. In addition, the electronic thermal conductivities (Fig. 5c) of Sb2−xYxSi2Te6 decrease with Y because of lower electrical conductivities. However, Fig. 5b and c reveal that the main contribution to the thermal conductivity of Sb2Si2Te6 comes from the phonons. Although there is a significant reduction in the thermal conductivities, there is still room for further reduction by applying appropriate strategies, such as hierarchical nanostructures or dense dislocations. Fig. 5d shows how the cumulative reduction in lattice thermal conductivity varies with frequency. At low temperatures, the reduction in κL is mainly due to grain boundary scattering, while at high temperatures, point defect scattering is the primary cause. Consequently, phonon transport is effectively suppressed by the combined influence of both grain boundary and point defect scattering.
Thermoelectric materials exhibit peak performance at specific Fermi levels (η), highlighting the crucial role of compositional engineering. To analyze strategies for achieving optimal performance, we plotted zT as a function of the Fermi level using the quality factor in Fig. 6b. The combined effect of Y nanocompositing, which optimizes the Fermi level, and the reduction in lattice thermal conductivity, elevates the B value of Sb1.98Y0.02Si2Te6 from 0.33 to 0.75. While this composition appears close to the optimal performance based on the B analysis, further improvement might be achievable through additional strategies that elevate the Fermi level. Y-nanocompositing strategies hold promise for increasing the zT of Sb2Si2Te6 to potentially reach 1.55. This value could be surpassed by implementing strategies to further reduce the lattice thermal conductivity.
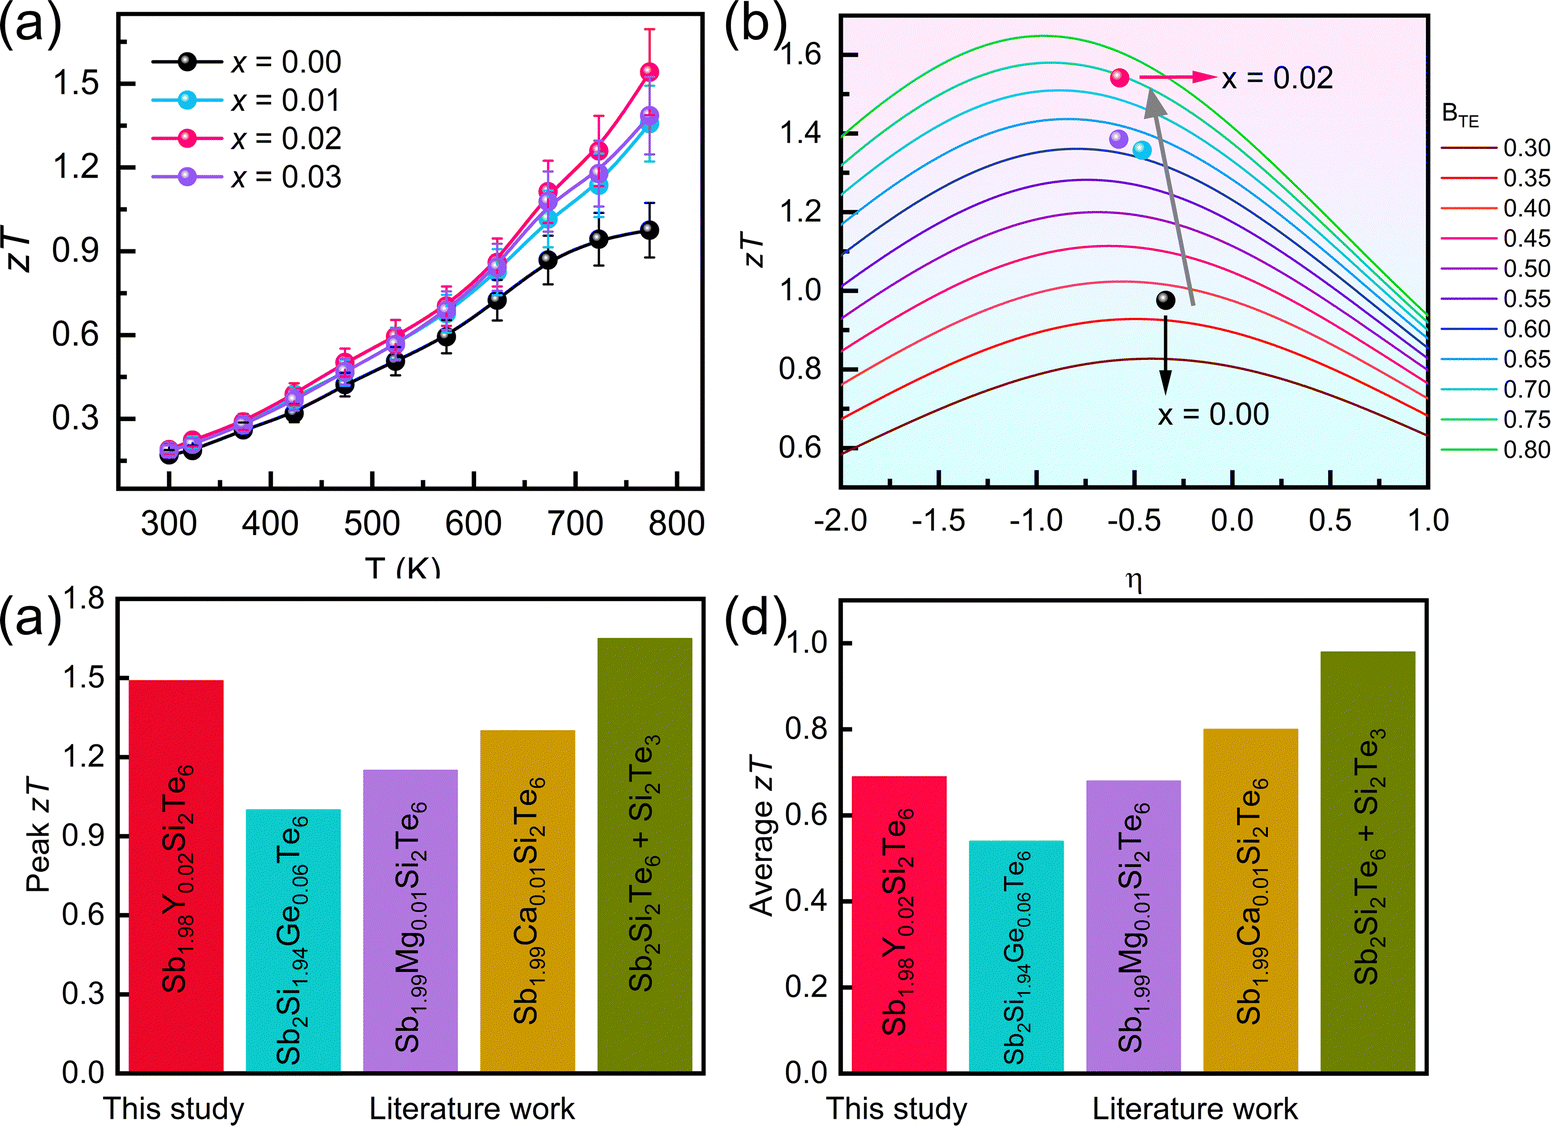 | ||
| Fig. 6 (a) Thermoelectric figure of merit zT, (b) quality factor analysis showing the increase of zT values, (c) peak zT values, (d) average zT values of Sb2Si2Te6-related materials studied in the literature (Sb1.98Y0.02Si2Te6 (this study), Sb2Si1.94Ge0.06Te6,39 and Sb1.99Mg0.01Si2Te6,40 Sb1.99Ca0.01Si2Te67). | ||
The performance of thermoelectric materials can be optimized only at certain Fermi levels, hence compositional changes play a significant role in the maximum performance. In order to analyze strategies to achieve the peak performance, we plotted zT vs Fermi level in terms of the quality factor, as shown in Fig. 6b. The simultaneous optimization in the Fermi level through nanocompositing with Y and the reduction in the lattice thermal conductivity increase the B from 0.33 to 0.75 in Sb1.98Y0.02Si2Te6. Although the performance of SST seems to be optimized near this composition (x = 0.02), further improvements are possible through increasing the Fermi level. Nanocompositing with Y holds promise to increase the zT of Sb2Si2Te6 up to 1.55.
Finally, Fig. 6c reveals that the peak zT of Sb1.98Y0.02Si2Te6 outperforms the reported peak zT values of doping studies on Sb2Si2Te6. However, the zT value achieved by nanostructured Sb2Si2Te6 remains highest overall. Fig. 6d shows that average zT values of Sb1.98Y0.02Si2Te6 are comparable to other studies in the literature.
Conclusion
In conclusion, this study demonstrates that introducing isovalent Y-nanocomposites into Sb2−xYxSi2Te6 (0.0 ≤ x ≤ 0.03) effectively reduce the carrier concentration while preserving the intrinsic electronic transport properties. The resulting optimization in the Seebeck coefficient led to a significant power factor improvement, reaching 946 μW K−1 for the best-performing sample, Sb1.98Y0.02Si2Te6. Additionally, Y-nano-compositing reduced lattice thermal conductivity to 0.29 W m−1 K−1, approaching simulated values, due to increased defect scattering. Defects such as YxOy, Y, Si2Te3 and Sb2Te3 were identified as key contributors to this reduction. The interplay between reduced thermal conductivity and optimized carrier concentration resulted in a peak zT value of 1.49, showcasing the effectiveness of Y-nanocompositing into Sb2Si2Te6. This approach opens promising avenues for further zT enhancements. The zT of Sb2−xYxSi2Te6 could be further enhanced by doping other elements to tune the Fermi level or increase the weighted mobility through band engineering. Another useful strategy could be to reduce the lattice thermal conductivity at low temperatures, converting the material to an alternative for low temperature applications. For future studies, Sb1.98Y0.02Si2Te6, a medium temperature material, could be coupled with Bi0.5Sb1.5Te3, a low temperature material, to construct a segmented single leg thermoelectric device. In summary, this research highlights that reducing the carrier concentration and introducing defects via Y-nanocompositing is an effective strategy to enhance the thermoelectric performance of Sb2Si2Te6.Author contributions
Kivanc Saglik: sample preparation, characterization and writing the manuscript. Xian Yi Tan: helped with characterization and analysis, especially the SPB model. Jinfeng Dong: helped with analysis, especially the Debye–Callaway model. Ady Suwardi: helped with modeling. Xizu Wang: provided advice on the manuscript. Jianwei Xu: helped with thermoelectric property analysis. Qiang Zhu: helped with thermal transport analysis. Hongfei Liu: helped with structural characterization. Jing Cao: provided timely advice on experiments. Qingyu Yan: supervised and guided the work and provided timely advice on the experiments.Data availability
The data supporting this article have been included as part of the ESI.†Conflicts of interest
The authors state that there are no conflicts to declare.Acknowledgements
Q. Yan acknowledges the financial support from the Ministry of Education (MOE) Academic Research Fund (AcRF) Tier 1 (RG128/21 and RG78/23), and MOE Tier 2 (MOE-T2EP50223-0003). J. Cao acknowledges the financial support from e-ASIA project R22I1IR053 and LCER Phase 2 Programme U2411D4011. K. Saglik acknowledges the support from A*STAR's SINGA scholarship. The authors acknowledge Dr Zhang Mingsheng for his help with the XPS analysis. The authors would like to acknowledge the facility for analysis, characterization, testing and simulation (FACTS), Nanyang Technological University (NTU), Singapore.References
- Q. Yan and M. G. Kanatzidis, Nat. Mater., 2022, 21, 503–513 CrossRef CAS PubMed.
- N. Jia, X. Y. Tan, J. Xu, Q. Yan and M. G. Kanatzidis, Acc. Mater. Res., 2022, 3, 237–246 CrossRef CAS.
- G. Tan, L.-D. Zhao and M. G. Kanatzidis, Chem. Rev., 2016, 116, 12123–12149 CrossRef CAS PubMed.
- J. Dong, Y. Jiang, Y. Sun, J. Liu, J. Pei, W. Li, X. Y. Tan, L. Hu, N. Jia and B. Xu, J. Am. Chem. Soc., 2023, 145, 1988–1996 CrossRef CAS PubMed.
- W. G. Zeier, A. Zevalkink, Z. M. Gibbs, G. Hautier, M. G. Kanatzidis and G. J. Snyder, Angew. Chem., Int. Ed., 2016, 55, 6826–6841 CrossRef CAS PubMed.
- V. Pecunia, S. R. P. Silva, J. D. Phillips, E. Artegiani, A. Romeo, H. Shim, J. Park, J. H. Kim, J. S. Yun and G. C. Welch, J. Phys.: Mater., 2023, 6, 042501 CAS.
- T. Xu, A. Yakubu Haruna, Z. Ma, W. Li, J. Li, L. Yubo, D. Zhang and J. Yang, Chem. Mater., 2021, 33, 8097–8105 CrossRef CAS.
- Y. Luo, S. Cai, S. Hao, F. Pielnhofer, I. Hadar, Z.-Z. Luo, J. Xu, C. Wolverton, V. P. Dravid, A. Pfitzner, Q. Yan and M. G. Kanatzidis, Joule, 2020, 4, 159–175 CrossRef CAS.
- N. Jia, J. Cao, X. Y. Tan, J. Dong, H. Liu, C. K. I. Tan, J. Xu, Q. Yan, X. J. Loh and A. Suwardi, Mater. Today Phys., 2021, 21, 100519 CrossRef CAS.
- J. Dong, A. Suwardi, X. Y. Tan, N. Jia, K. Saglik, R. Ji, X. Wang, Q. Zhu, J. Xu and Q. Yan, Mater. Today, 2023, 137–157 CrossRef CAS.
- Z.-Z. Luo, S. Cai, S. Hao, T. P. Bailey, Y. Luo, W. Luo, Y. Yu, C. Uher, C. Wolverton and V. P. Dravid, Energy Environ. Sci., 2022, 15, 368–375 RSC.
- Z. Ma, Y. Luo, J. Dong, Y. Liu, D. Zhang, W. Li, C. Li, Y. Wei, Q. Jiang and X. Li, Adv. Mater., 2024, 2407982 CrossRef CAS PubMed.
- Y. Zheng, T. J. Slade, L. Hu, X. Y. Tan, Y. Luo, Z.-Z. Luo, J. Xu, Q. Yan and M. G. Kanatzidis, Chem. Soc. Rev., 2021, 50, 9022–9054 RSC.
- Y. Luo, S. Hao, S. Cai, T. J. Slade, Z. Z. Luo, V. P. Dravid, C. Wolverton, Q. Yan and M. G. Kanatzidis, J. Am. Chem. Soc., 2020, 142, 15187–15198 CrossRef CAS PubMed.
- V. Lourdhusamy, J.-L. Chen, I. Paulraj, L.-C. Hsu, Y.-Y. Li, T.-S. Yang, K. V. Prabu and C.-J. Liu, J. Alloys Compd., 2022, 920, 165949 CrossRef CAS.
- J. Dong, J. Gao and Q. Yan, Mater. Lab., 2023, 230001 Search PubMed.
- B. Xiang, J. Liu, J. Yan, M. Xia, Q. Zhang, L. Chen, J. Li, X. Y. Tan, Q. Yan and Y. Wu, J. Mater. Chem. A, 2019, 7, 18458–18467 RSC.
- K. Biswas, J. He, I. D. Blum, C.-I. Wu, T. P. Hogan, D. N. Seidman, V. P. Dravid and M. G. Kanatzidis, Nature, 2012, 489, 414–418 CrossRef CAS PubMed.
- Y. Jiang, J. Dong, H.-L. Zhuang, J. Yu, B. Su, H. Li, J. Pei, F.-H. Sun, M. Zhou and H. Hu, Nat. Commun., 2022, 13, 6087 CrossRef CAS PubMed.
- K. Saglik, J. Dong, D. Zhang, T. Z. Hsu, S. S. F. Duran, J. Cao, Q. Zhu, R. Ji, W. S. Kai and T. S. Lang, J. Solid State Chem., 2024, 124642 CrossRef CAS.
- E. S. Toberer, A. Zevalkink and G. J. Snyder, J. Mater. Chem., 2011, 21, 15843–15852 RSC.
- Z. Chen, X. Zhang and Y. Pei, Adv. Mater., 2018, 30, 1705617 CrossRef PubMed.
- S. Mukherjee, N. Rana, S. Goswami, S. Das, P. Singha, S. Chatterjee, S. Bandyopadhyay and A. Banerjee, J. Phys.: Condens. Matter, 2024, 36, 365701 CrossRef CAS PubMed.
- J. Cao, S. W. Chien, X. Y. Tan, C. K. I. Tan, Q. Zhu, J. Wu, X. Wang, Y. Zhao, L. Yang and Q. Yan, ChemNanoMat, 2021, 7, 476–482 CrossRef CAS.
- A. Suwardi, J. Cao, Y. Zhao, J. Wu, S. W. Chien, X. Y. Tan, L. Hu, X. Wang, W. Wang and D. Li, Mater. Today Phys., 2020, 14, 100239 CrossRef.
- D. Wu, L.-D. Zhao, X. Tong, W. Li, L. Wu, Q. Tan, Y. Pei, L. Huang, J.-F. Li and Y. Zhu, Energy Environ. Sci., 2015, 8, 2056–2068 RSC.
- J. Cao, J. Dong, K. Saglik, D. Zhang, S. F. D. Solco, I. J. W. J. You, H. Liu, Q. Zhu, J. Xu and J. Wu, Nano Energy, 2023, 107, 108118 CrossRef CAS.
- Z. Gong, K. Saglik, J. Wu, A. Suwardi and J. Cao, Nanoscale, 2023, 15, 18283–18290 RSC.
- J. Cao, X. Y. Tan, N. Jia, J. Zheng, S. W. Chien, H. K. Ng, C. K. I. Tan, H. Liu, Q. Zhu and S. Wang, Nano Energy, 2022, 96, 107147 CrossRef CAS.
- X. Y. Tan, J. Dong, J. Liu, D. Zhang, S. F. D. Solco, K. Sağlık, N. Jia, I. J. W. J. You, S. W. Chien and X. Wang, Adv. Sci., 2024, 2400870 CrossRef CAS PubMed.
- S. Xu, Y. Liu, H. Lee and W. Li, Exploration, 2024, 4 DOI:10.1002/EXP.20230146.
- Y. Chen, Z. Gao, F. Zhang, Z. Wen and X. Sun, Exploration, 2022, 2 DOI:10.1002/EXP.20210112.
- D. Yang, W. Yao, Q. Chen, K. Peng, P. Jiang, X. Lu, C. Uher, T. Yang, G. Wang and X. Zhou, Chem. Mater., 2016, 28, 1611–1615 CrossRef CAS.
- W. Dou, K. Spooner, S. Kavanagh, M. Zhou and D. O. Scanlon, J. Am. Chem. Soc., 2024, 146, 17679–17690 CrossRef CAS PubMed.
- Y. Zhang, C. Niu, H. He, Y. Wu, M. Rong, K. Yu and H. Ren, J. Appl. Phys., 2021, 130, 025102 CrossRef CAS.
- H. Jang, S. Abbey, B. Frimpong, C. V. Nguyen, P. Ziolkowski, G. Oppitz, M. Kim, J. Y. Song, H. S. Shin and Y. S. Jung, ACS Appl. Mater. Interfaces, 2022, 14, 1270–1279 CrossRef CAS PubMed.
- W. Shi, N. Ge, X. Wang and Z. Wang, J. Phys. Chem. C, 2021, 125, 16413–16419 CrossRef CAS.
- Z. Huang and L.-D. Zhao, Trends Chem., 2020, 2, 89–91 CrossRef CAS.
- W. Wang, X. Lu, L. Sun, J. Luo, Q. Shi, N. Ta, P. Jiang and X. Bao, J. Mater. Chem. A, 2022, 10, 20489 RSC.
- C. Li, Y. Luo, W. Li, L. Yang, W. Ma, Z. Ma, C. Sun, B. Yang, Y. Wei and X. Li, Scr. Mater., 2024, 247, 116090 CrossRef CAS.
- C. Chen, D. Shen, C. Xia, Z. Zhang, W. Wang, Q. Zhang and Y. Chen, Chem. Eng. J., 2022, 441, 135968 CrossRef CAS.
- S. Song, J. Mao, M. Bordelon, R. He, Y. Wang, J. Shuai, J. Sun, X. Lei, Z. Ren and S. Chen, Mater. Today Phys., 2019, 8, 25–33 CrossRef.
- X. Shi, T. Zhao, X. Zhang, C. Sun, Z. Chen, S. Lin, W. Li, H. Gu and Y. Pei, Adv. Mater., 2019, 31, 1903387 CrossRef PubMed.
- Y. Wang, X. Zhang, Y. Liu, Y. Wang, H. Liu and J. Zhang, J. Materiomics, 2020, 6, 216–223 CrossRef.
- W. Gao, Z. Liu, W. Zhang, N. Sato, Q. Guo and T. Mori, Appl. Phys. Lett., 2021, 118, 033901 CrossRef CAS.
- T. Zhu, K. Xiao, C. Yu, J. Shen, S. Yang, A. Zhou, X. Zhao and J. He, J. Appl. Phys., 2010, 108, 044903 CrossRef.
- G. J. Snyder and E. S. Toberer, Nat. Mater., 2008, 7, 105–114 Search PubMed.
- L. Hu, Y.-W. Fang, F. Qin, X. Cao, X. Zhao, Y. Luo, D. V. M. Repaka, W. Luo, A. Suwardi and T. Soldi, Nat. Commun., 2021, 12, 4793 CrossRef CAS PubMed.
- G. Komisarchik, Y. Gelbstein and D. Fuks, Intermetallics, 2017, 89, 16–21 CrossRef CAS.
- Y. Pei, J. Lensch-Falk, E. S. Toberer, D. L. Medlin and G. J. Snyder, Adv. Funct. Mater., 2011, 21, 241–249 CrossRef CAS.
- L. Fu, K. H. Lee, S.-I. Kim, J.-H. Lim, W. Choi, Y. Cheng, M.-W. Oh, Y.-M. Kim and S. W. Kim, Acta Mater., 2021, 215, 117058 CrossRef CAS.
- A. Raj, A. Kumar, R. Kumar, R. Kumar and R. Chandra, J. Mater. Sci.: Mater. Electron., 2024, 35, 468 CrossRef CAS.
- T. Sun, S. Buchner and N. Byer, J. Vac. Sci. Technol., 1980, 17, 1067–1073 CrossRef CAS.
- P. O'Hare, G. Hope and C. M. Beck II, J. Chem. Thermodyn., 1993, 25, 919–928 CrossRef.
- A. Mesarwi and A. Ignatiev, Surf. Sci., 1991, 244, 15–21 CrossRef CAS.
- H. Behner, J. Wecker, T. Matthée and K. Samwer, Surf. Interface Anal., 1992, 18, 685–690 CrossRef CAS.
- J. Shuai, J. Mao, S. Song, Q. Zhu, J. Sun, Y. Wang, R. He, J. Zhou, G. Chen and D. J. Singh, Energy Environ. Sci., 2017, 10, 799–807 RSC.
- M. Y. Toriyama, D. Cheikh, S. K. Bux, G. J. Snyder and P. Gorai, ACS Appl. Mater. Interfaces, 2022, 14, 43517–43526 CrossRef CAS PubMed.
- M. Hong, W. Lyu, Y. Wang, J. Zou and Z.-G. Chen, J. Am. Chem. Soc., 2020, 142, 2672–2681 CrossRef CAS PubMed.
- G. J. Snyder, A. H. Snyder, M. Wood, R. Gurunathan, B. H. Snyder and C. Niu, Adv. Mater., 2020, 32, 2001537 CrossRef CAS PubMed.
- S. D. Kang and G. J. Snyder, arXiv, 2017, preprint, arXiv:1710.06896.
- J. Chen, Silicon-Based Nanostructures: Growth and Characterizations of Si2Te3 Nanowires and Nanoplates, The University of Memphis, 2021 Search PubMed.
Footnotes |
| † Electronic supplementary information (ESI) available. See DOI: https://doi.org/10.1039/d4cp04219k |
| ‡ Contributed equally. |
| This journal is © the Owner Societies 2025 |