
 Open Access Article
 This Open Access Article is licensed under a
 Creative Commons Attribution 3.0 Unported Licence
Temperature and concentration dependence of the ionic charge transfer between solid and liquid Li+ electrolytes – the systems LLZO:Ta/LiPF6–EC–DMC, LATP/LiPF6–EC–DMC and LLZO:Ta/LiBOB–DME–THF†
Tobias Wekkinga,
Martin Finsterbusch b and
Carsten Korte*a
b and
Carsten Korte*a
aInstitute of Energy Technologies: Electrochemical Process Engineering (IET-4), Forschungszentrum Jülich GmbH, 52425 Jülich, Germany. E-mail: c.korte@fz-juelich.de; Fax: +49 2461 616695; Tel: +49 2461 619035
bInstitute of Energy Materials and Devices: Materials Synthesis and Processing (IMD-2), Forschungszentrum Jülich GmbH, 52425 Jülich, Germany
First published on 10th February 2025
Abstract
The kinetics of the electrochemically driven lithium ion (Li+) transfer from a liquid Li+ electrolyte to a solid (ceramic) Li+ electrolyte is investigated. A DC polarisation is applied to measure the current density i vs. the drop in the electrochemical potential Δ![[small mu, Greek, circumflex]](https://www.rsc.org/images/entities/i_char_e0b3.gif) Li+ of Li+ ions at the interface. LLZO:Ta and LATP were chosen in this study as the two most promising oxide-ceramic electrolytes and combined with LiPF6 in EC/DMC (1
Li+ of Li+ ions at the interface. LLZO:Ta and LATP were chosen in this study as the two most promising oxide-ceramic electrolytes and combined with LiPF6 in EC/DMC (1![[thin space (1/6-em)]](https://www.rsc.org/images/entities/char_2009.gif) :1) and LiBOB in THF/DME (1:1) as the most relevant liquid electrolytes. To determine the rate-limiting step of the Li+ transfer across the interface, the results were modelled using a combination of a constant ohmic resistance and a current-dependent, thermally activated Butler–Volmer-like ion transfer process. At low Li+ concentrations in the liquid electrolyte, the Butler–Volmer-like transfer process is rate limiting, while at high Li+ concentrations, the low-conductive surface layer on the solid electrolyte is rate limiting. The areal resistance of the low-conductivity surface layer is in the order of 600 Ω cm2 (25 °C) for LLZO:Ta, and thus about three times higher compared to that for LATP. The activation energy of the ionic transport in the low-conductivity surface layer is about twice that of the solid electrolytes LLZO:Ta and LATP. The exchange current density of the Butler–Volmer-like transfer process is in the order of 100–300 μA cm−2 (25 °C, 1 mol l−1 Li+). There is a symmetric transition state (α ≈ 1/2).
:1) and LiBOB in THF/DME (1:1) as the most relevant liquid electrolytes. To determine the rate-limiting step of the Li+ transfer across the interface, the results were modelled using a combination of a constant ohmic resistance and a current-dependent, thermally activated Butler–Volmer-like ion transfer process. At low Li+ concentrations in the liquid electrolyte, the Butler–Volmer-like transfer process is rate limiting, while at high Li+ concentrations, the low-conductive surface layer on the solid electrolyte is rate limiting. The areal resistance of the low-conductivity surface layer is in the order of 600 Ω cm2 (25 °C) for LLZO:Ta, and thus about three times higher compared to that for LATP. The activation energy of the ionic transport in the low-conductivity surface layer is about twice that of the solid electrolytes LLZO:Ta and LATP. The exchange current density of the Butler–Volmer-like transfer process is in the order of 100–300 μA cm−2 (25 °C, 1 mol l−1 Li+). There is a symmetric transition state (α ≈ 1/2).
1 Introduction
It is discussed to utilise solid lithium electrolytes as membranes for post-Li-ion battery systems like Li–S or Li–O2 cells. A solid electrolyte membrane can be helpful to prevent short-circuits caused by Li dendrite growth or shuttling of soluble polysulfide species by separating the anodic and the cathodic region.1–3 Moreover, the separation of the anodic and the cathodic region allows the use of different types of liquid electrolytes for each side, tailored for the specific electrochemical conditions, e.g., using an alkali-metal cathode in an aprotic electrolyte but an aqueous electrolyte on the cathode side.4–6Another important field of application for lithium solid-state electrolytes is future all-solid-state rechargeable battery systems (ASSBs). Currently, ASSBs struggle with serious problems regarding internal resistance, as the conductivity of solid lithium electrolytes is still low compared to that of liquid electrolytes, and also strain in the solid–solid interfaces due to the change in molar volume of the electrodes during charging and discharging. The introduction of a thin liquid electrolyte film between the solid electrolyte and the electrodes is discussed as a possible remedy. However, for all possible applications, the interface between a solid electrolyte membrane and a liquid electrolyte gives rise to additional electrical potential drops in the cell. Both make an in-depth understanding of the electrochemical charge transfer kinetics of solid–liquid electrolyte interfaces essential.
2 Electrochemical kinetics of solid–liquid electrolyte interfaces
Various electrochemical processes have to be considered when an ion is crossing the interface between a solid (SE) and a liquid electrolyte (LE). In a SE, only one ionic species is mobile. In a LE, usually both cations and anions can contribute to the total charge transport. Diffusional transport in the vicinity and along the SE|LE interface, solvation/desolvation processes, occupation of a free lattice site in the SE or the presence of a covering layer on the SE surface due to degradation reactions may be considered.Focussing on Li+-conducting SEs and LEs, there is only a limited number of experimental studies in the literature dealing with the ionic charge transfer at these specific interfaces. In a series of publications by Abe et al., Sagane et al. and Yamada et al., the SE|LE interface between the defective perovskite-type Li0.35La0.55TiO3 (LLT), a Li+-conducting OHARA® glass (Li–Al–Ti-phosphate) and various LEs based on LiClO4 and LiCF3SO3 (LiTfO) dissolved in dimethylsulfoxide (DMSO), ethylene carbonate/dimethyl carbonate (EC/DMC), propylene carbonate (PC) and fluoroethylene carbonate (FEC) were investigated.7–11 They conclude from the activation energy, evaluated by analysing the temperature dependence of the interface resistance, that the ionic charge transfer at the solid–liquid interface is an activated process and its rate is mainly determined by the solvation energy of the Li+ cations. The solvation energy depends on the donor number of the solvent.‡ The interface resistance was determined by performing 4-probe impedance measurements (AC) using a symmetric cell with three compartments (LE|SE|LE) and analysing the spectra regarding the bulk resistance, grain boundary resistance in the SE and resistance of the solid–liquid interface (the process with the lowest characteristic frequency).
Mehrotra et al. reported an experimental study on the SE|LE interface between an Ohara® Li+-conducting glass ceramic (LICGC) and various LEs based on LiPF6 dissolved in ethylene carbonate/diethyl carbonate (EC/DEC), PC and DMSO.13 They performed 2-electrode DC measurements using a symmetric cell with three compartments (LE|SE|LE) and a cell only with the LE to subtract the contribution of the current-loaded lithium electrodes. The measured interface resistance/polarisation is also assigned to a thermally activated ion transfer process. The Butler–Volmer-equation is used to describe the current density across the interface.
The SE|LE interface between a Li+-conducting LixPOyNz glass (LiPON), sodium superionic conductor (NASICON)-type Li1.29Al0.29Ge1.71(PO4)3 (LAGP) and a LE based on Li(CF3SO2)2N (LiTFSI) dissolved in 1,3-dioxolane/1,2-dimethoxyethane (DOL/DME) was investigated in experimental studies performed by Busche et al. and Weiss et al.14–16 Using 4-probe impedance measurements, an increasing interface resistance with time is observed. They conclude that there is formation of a growing interface layer with a poor ionic conductivity between the SE and LE. In these studies, this layer is denoted as a “solid–liquid electrolyte interphase” (SLEI). It consists of decomposition products from degradation reactions between the SE and the LE, respectively; depending on the synthesis and pre-treatment of the SE, it consists of degradation reactions of the SE with air and humidity.17 The presence of residual water may also play an important role for the formation of a degradation layer, as water forms highly reactive HF in a reaction with the anion of the conducting salt LiPF6:18
| LiPF6 + H2O → LiF + POF3 + 2HF |
(i) a thermally activated ion transfer process taking place in the electrified interface between the SE and LE;
(ii) formation of a surface layer with a low ionic conductivity on the SE, due to degradation reactions with the LE or during the synthesis of the SE.
In a preceding study, we introduced a simple model including both phenomena.19 In this study, a symmetric DC-polarisation cell, LE|SE|LE, with multiple potential probes for each phase was tested. The preliminary measurements on the SE|LE interface of a single system, LLZO:Ta and LiPF6 dissolved in EC/DMC, showed that at low Li+ concentrations in the LE, the Butler–Volmer-like ion transfer kinetics is rate limiting, and at high concentrations, the constant resistance of a surface layer is rate limiting. In this subsequent study we have extended the investigations performing DC-polarisation measurements using the same setup. SEs with different tendencies to form a surface layer due to degradation reactions are combined with LEs using organic solvents with different donor numbers. Temperature-dependent measurements will allow the determination of the activation energy of both phenomena, low-conductivity surface layer and Butler–Volmer-like ionic charge transfer.
3 Formal considerations
3.1 Ion transport across a SE|LE interface
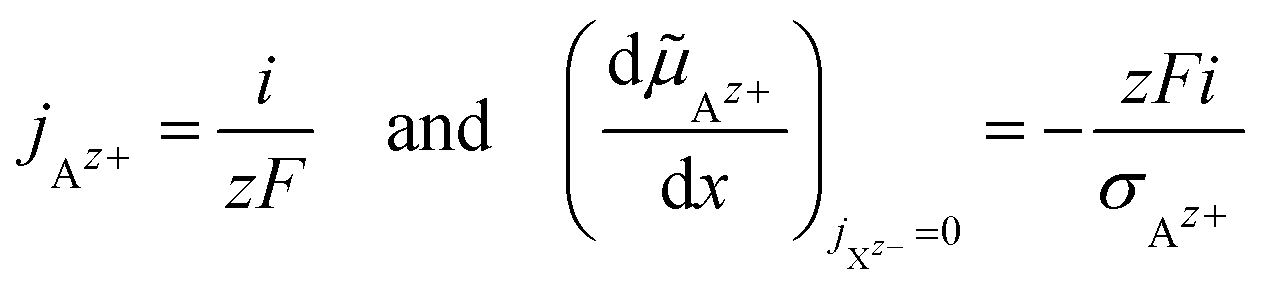
A sequence of electrochemical processes have to be considered to describe the ionic charge transport from a LE to a SE or vice versa. Principally, it is comparable to a conventional metal electrode, but there will be no redox process. There is an adsorption of the cations on the SE surface, accompanied with their de-/solvation, possibly surface diffusion and finally the occupation of a vacant cation site situated on the surface; see Fig. 1. These processes will take place in an interface region with strong electric potential gradient due to the potential difference Δϕct between SE and LE.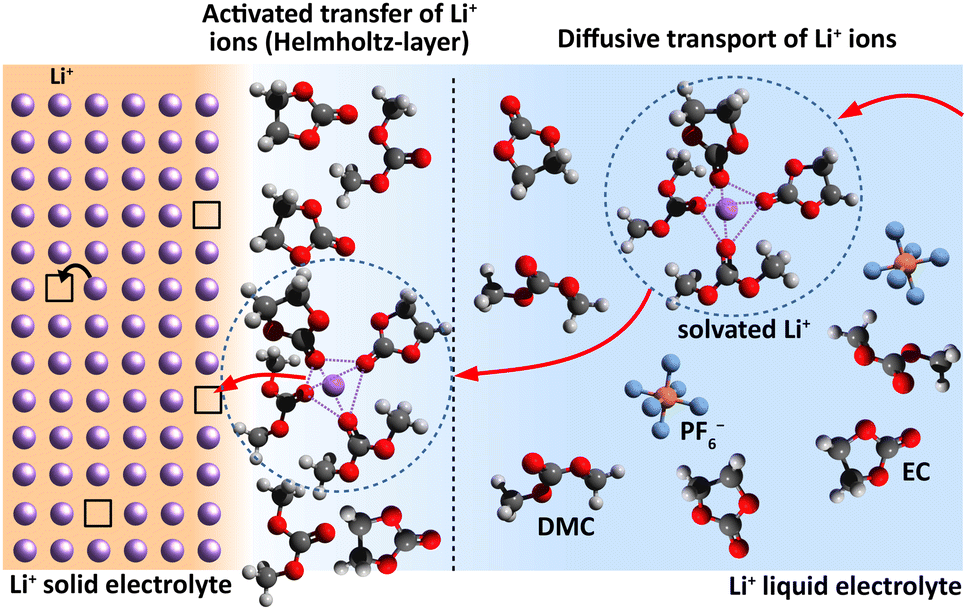 | ||
| Fig. 1 Interface region between a Li+-conducting SE (left) and LE (right). Schematic sketch reproduced from Schleutker et al. with permission from the Royal Society of Chemistry.19 | ||
Thermally activated processes for the ionic transfer across the boundary within an electrified interface region give rise to mass transport-control in analogy to the Butler–Volmer kinetics (i.e., overpotential η). In a simple approach, the presence of a surface layer with constant ionic conductivity can be considered as a serial connection to a constant resistor.
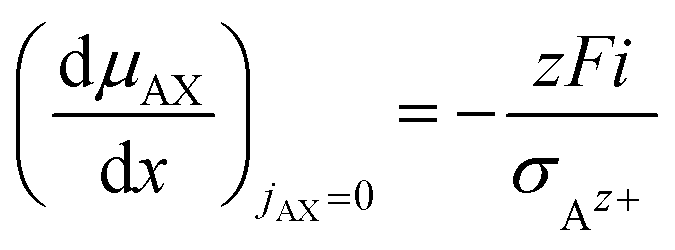
A DC polarisation by driving a cationic partial current through the LE and blocking the anionic partial current will result in concentration gradients of the conductive salt close to the SE|LE interface. For large current densities and low concentrations in the LE, this gives rise to a mass transport-control in analogy to the diffusion overpotential of an electrode.
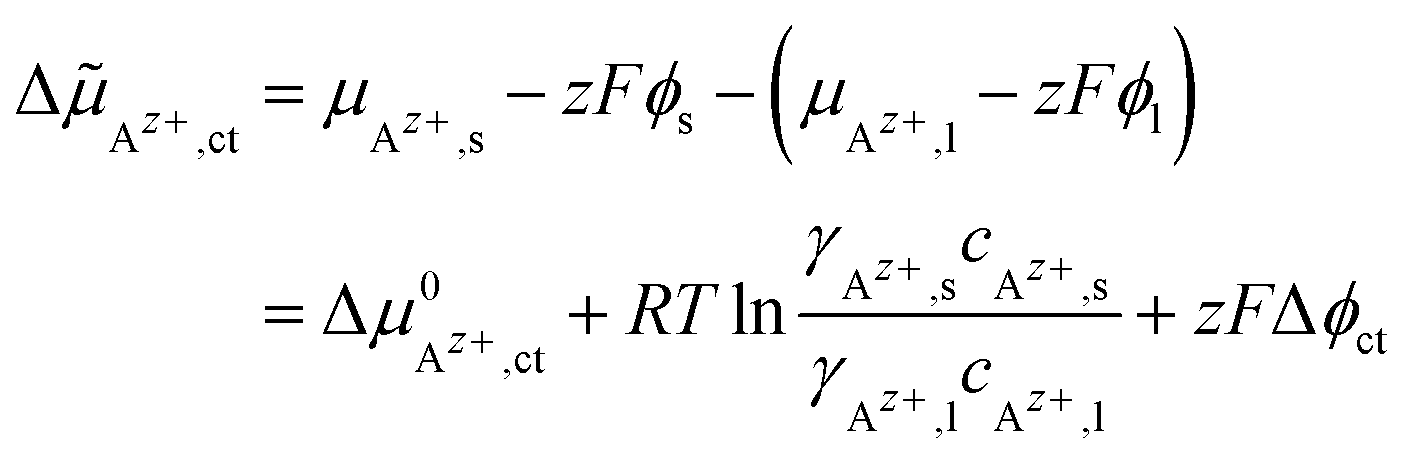
![[small mu, Greek, tilde]](https://www.rsc.org/images/entities/i_char_e0e0.gif) Az+,ct of the cations in both phases is the driving force for ionic charge transport (index “ct”) across the interface:
Az+,ct of the cations in both phases is the driving force for ionic charge transport (index “ct”) across the interface:
 | (1) |
 , the Galvani potential difference across the interface as Δϕct = ϕs − ϕl and the Faraday constant as F. The concentrations of Az+ ions in the SE and LE are denoted with cAz+,s and cAz+,l and the activity coefficients with γAz+,s and γAz+,l. Thus, different chemical potentials μAz+,s and μAz+,l of Az+ ions in the LE and SE result in a Galvani potential difference Δϕct across the interface, also in the absence of an external driving force (ΔAz+,ct = 0).
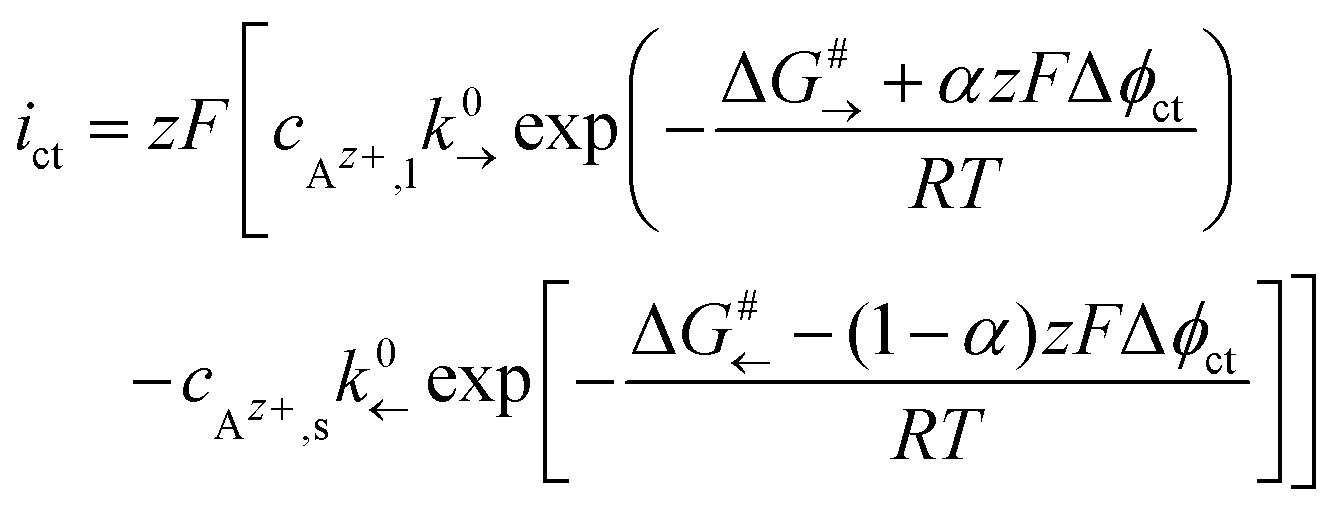
A Helmholtz-like layer in the LE is formed by accumulation of oppositely charged ions and re-orientation of polar solvent molecules, i.e., the electrical potential drop Δϕct is localised in a nm-sized interface region with a width d. The thermally activated ionic charge transfer process within this region can be treated in analogy to the Butler–Volmer model. The current density ict can be written in terms of the activation energy ΔG#→ for the ionic transfer from the LE to the SE and ΔG#← for the reverse process; see Fig. 2:
 | (2) |
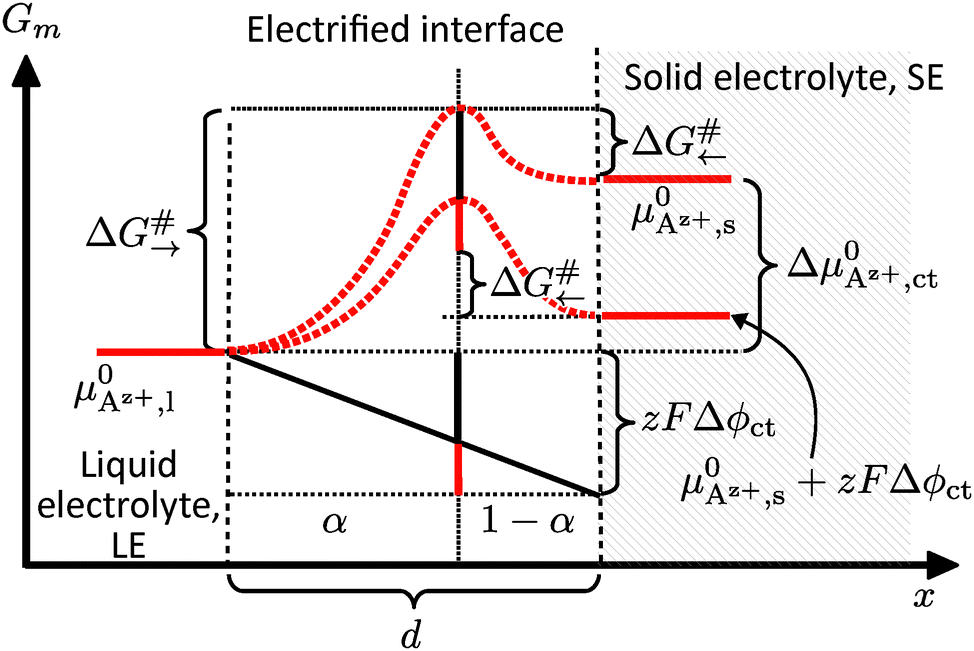 | ||
| Fig. 2 Interface region between a SE (right) and a LE (left). The free (molar) enthalpy Gm of the system is plotted against the reaction coordinate/position x relative to the interface. The drop in the electrochemical potential ΔAz+,ct occurs within a distance d. | ||
An effective activation energy ΔG# can be linked to the activation energies ΔG#→ and ΔG#← by considering the geometry factor α and the difference between the standard potentials  of Az+ ions in the SE and LE:
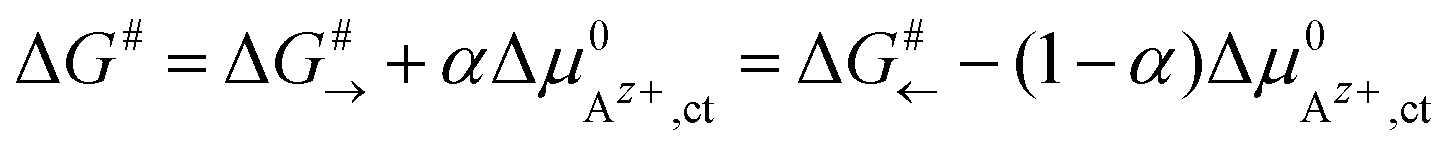 | (3) |
Az+,ct of Az+ ions in eqn (1) can be joined to the current density ict by solving eqn (1) for Δϕct and substitution in eqn (2). Essential conditions for the thermodynamic equilibrium are ΔAz+,ct = 0 and ict = 0. This implies the identity k0→/k0← = γAz+,l/γAz+,s. Thus, the relation linking the current density ict with the electrochemical potential difference ΔAz+,ct of Az+ ions across the LE/SE interface can be written in its final form as:
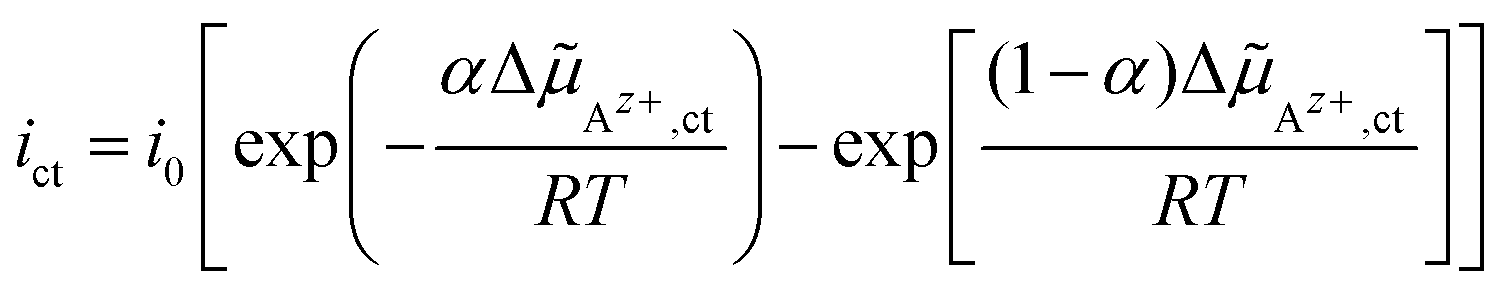 | (4) |
An exchange current density i0 in analogy to the Butler–Volmer equation is given as:
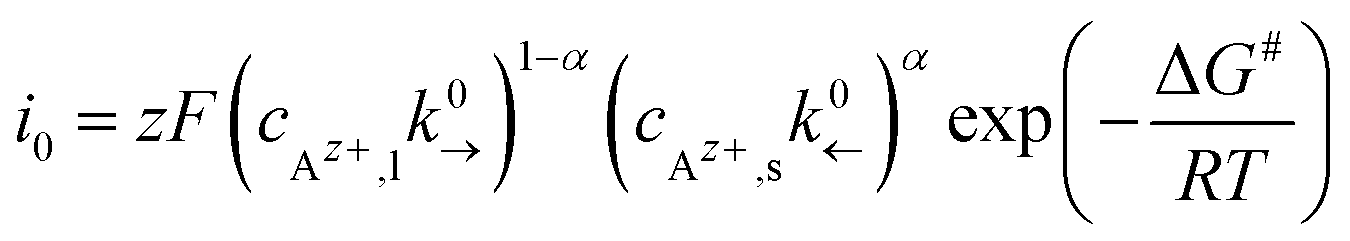 | (5) |
 , can be defined:
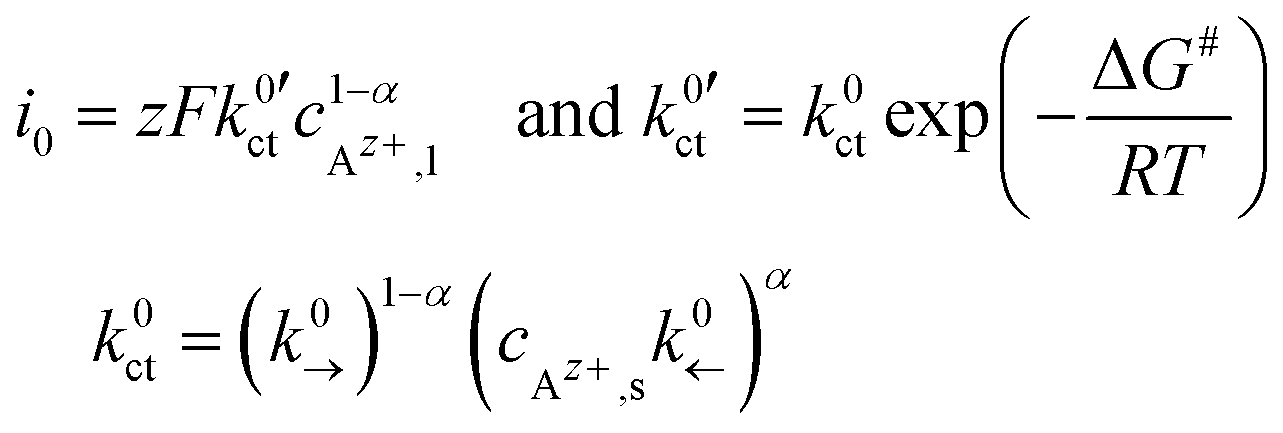 | (6) |
Az+,slei of Az+ ions across the layer (index “slei”):
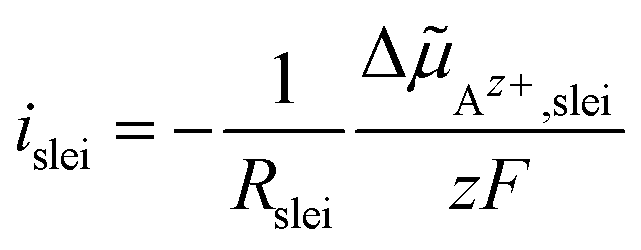 | (7) |
Az+,if of Az+ ions across the interface (index “if”) is the sum of the drop ΔAz+,ct due to the Butler–Volmer-like charge transfer process and due to the additional interface layer, ΔAz+,slei; see Fig. 3:|
ΔAz+,if = ΔAz+,ct + ΔAz+,slei
| (8) |
| i = ict = islei | (9) |
Az+,if of Az+ ions between the SE and LE, i.e., i = f(ΔAz+,if,α,i0,Rslei), eqn (4) and (7)–(9) can be combined. The resulting equation system is non-linear and cannot be solved in an explicit way. Using numerical methods, it is possible to plot this function exemplarily; see Fig. 4.
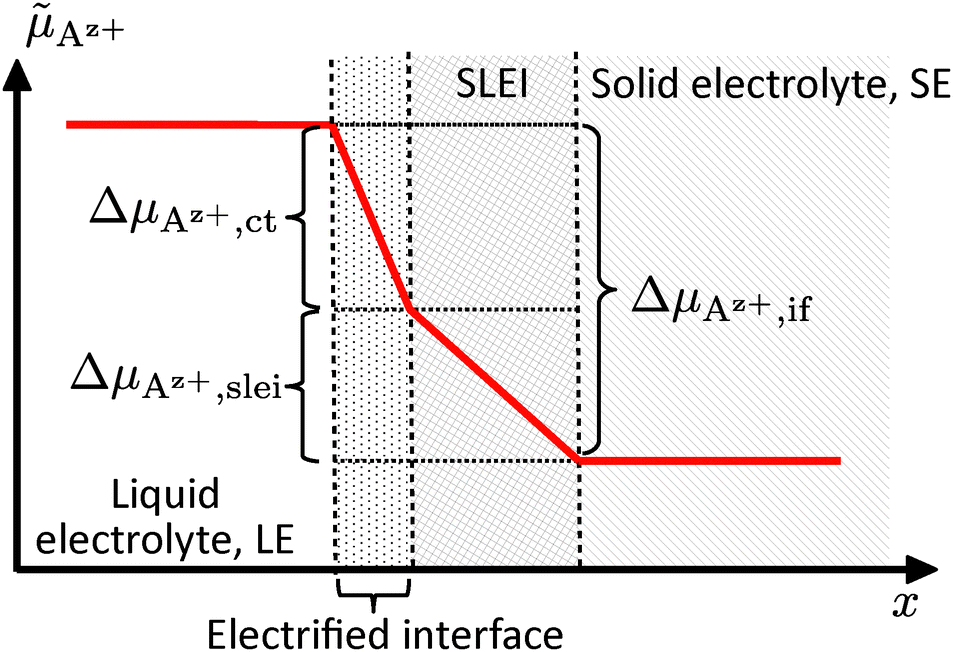 | ||
| Fig. 3 Interface region between a SE (right) and a LE (left) with an electrified interface and a low-conductivity interface layer (SLEI). The course of the electrochemical potential Az+ is plotted against the position x relative to the interface. | ||
 | ||
| Fig. 4 Plot of the current density i vs. the electrochemical potential drop ΔAz+,if, considering a Butler–Volmer-like transfer process and a low-conductivity interface layer (black line), along with limiting current density if only a low-conductivity interface layer (red line) or only a Butler–Volmer-like transfer process (blue line) is present. | ||
If the electrochemical potential drop ΔAz+,if of Az+ ions across the SE|LE interface is small, the non-linear Butler–Volmer-like behaviour is prevalent, resulting in a strong curvature when plotting i vs. ΔAz+,if. If the electrochemical potential drop is increasing, an asymptotic behaviour should be observed due to the interface layer acting as a constant resistance. The total polarisation resistance RP of the SE|LE interface is proportional to the (reciprocal) slope at i = 0, i.e., ΔAz+,if = 0. It can be calculated via an implicit differentiation of ΔAz+,if with respect to the current density i. This yields the sum of the areal resistance Rslei of the interface layer and a term including the exchange current density i0 representing the Butler–Volmer-like process:
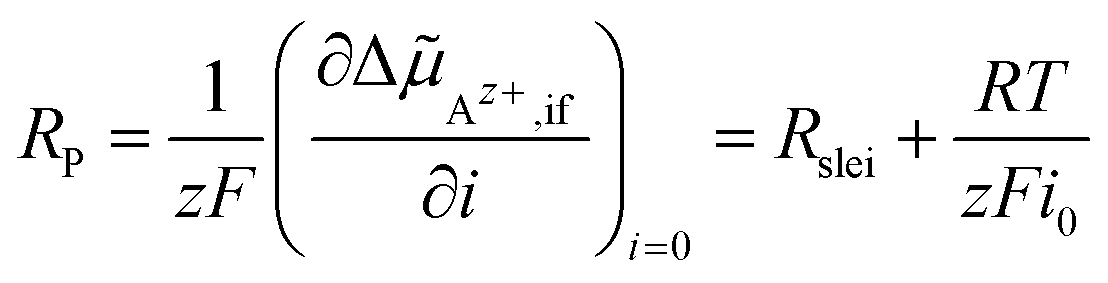 | (10) |
3.2 DC polarisation of an electrochemical cell
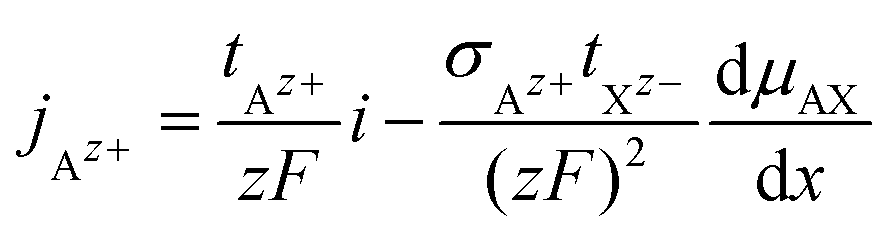
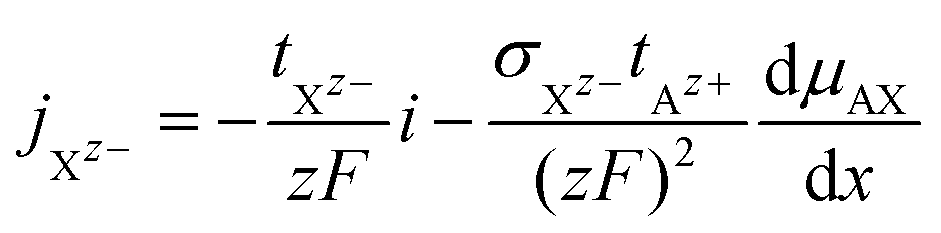
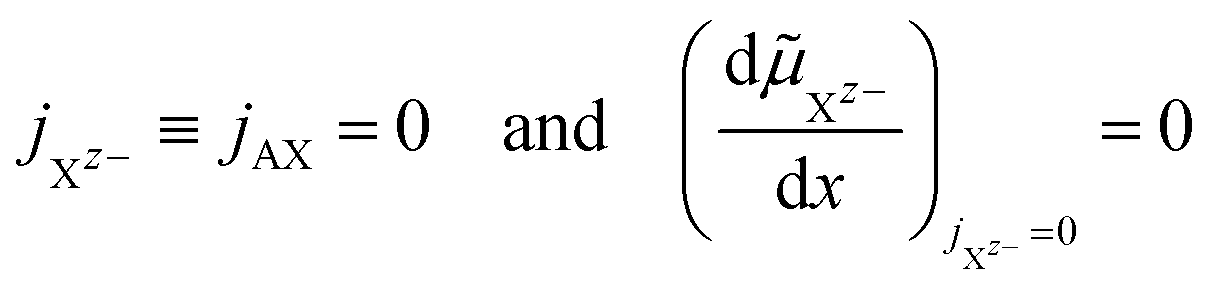
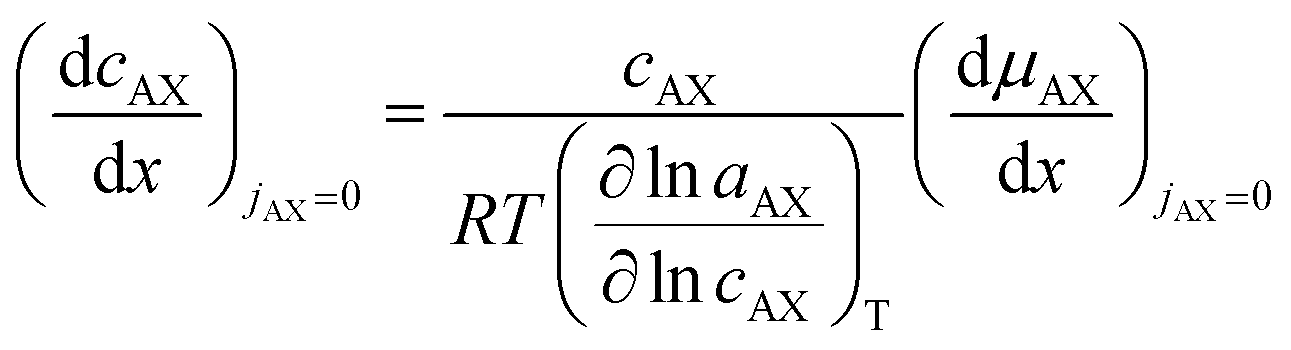
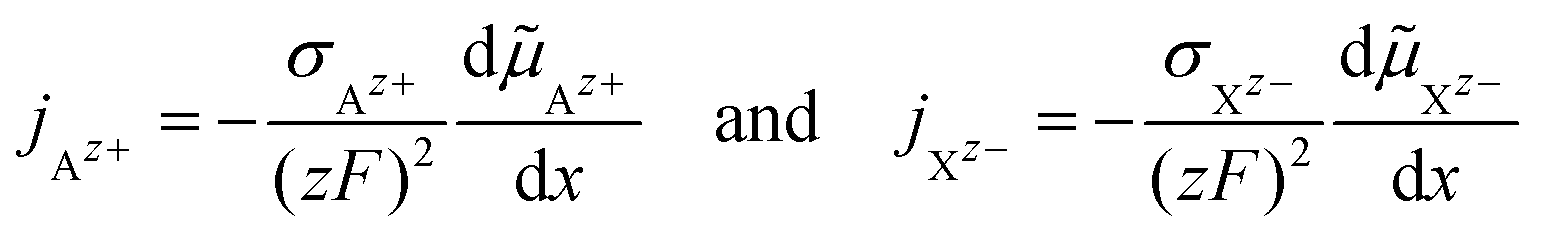
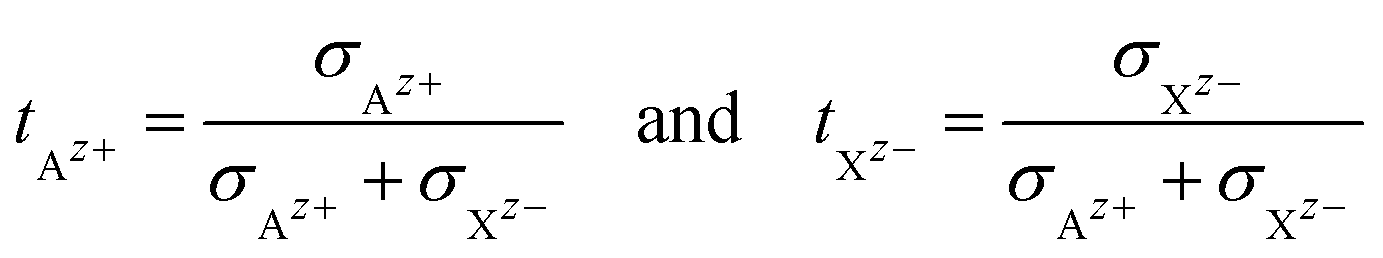
The cationic and anionic transport in the LE is driven by the electrochemical potential gradients of Az+ and Xz− ions.§ In the case of the SE only the cations are mobile. By applying a DC current to a LE, consisting of an ionic compound AX dissolved in a solvent, the electric field forces cations and anions in opposite directions. Sources and sinks of the ionic fluxes in an electrochemical cell are the interfaces of the LE to conventional electrodes or to a SE. The measured total current density i is the sum of cation and anion flux:| i = zFjAz+ − zFjXz− | (12) |
 | (14) |
 | (15) |
 | (17) |
 | (18) |
 | (19) |
lnaAX/∂lncAX)T:
 | (20) |
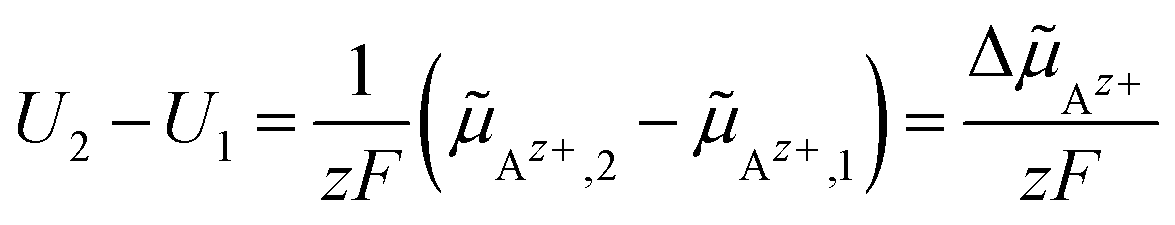
Az+ between two spatial positions 1 and 2 in an electrochemical cell, is measured using electrodes made of (or covered with) the metal A (potential probes). The electric potential difference U2 − U1 between two probes at positions 1 and 2 yields to:
 | (21) |
Az+ of Az+ in the bulk of the electrolytes should exhibit a linear course; see eqn (19). Thus, the drop ΔAz+,if in the electrochemical potential of Az+ at the SE|LE interfaces should be accessible by linear extrapolation.
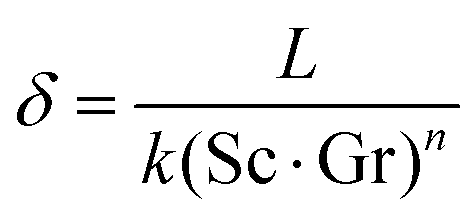
However, any concentration differences of AX in the LE will cause (micro-)convection due to the concentration dependence of its density ρ; see Fig. 5. This will counteract the build-up of appreciable concentration differences in the bulk. Only in the vicinity of electrodes or of a solid electrolyte interface, convection is suppressed due to adhesion and the viscosity of the LE. Within this Nernst diffusion layer, a concentration gradient can build-up. Its width δ can be estimated according to Levich, Ibl et al. and Agar as:20–23
 | (22) |
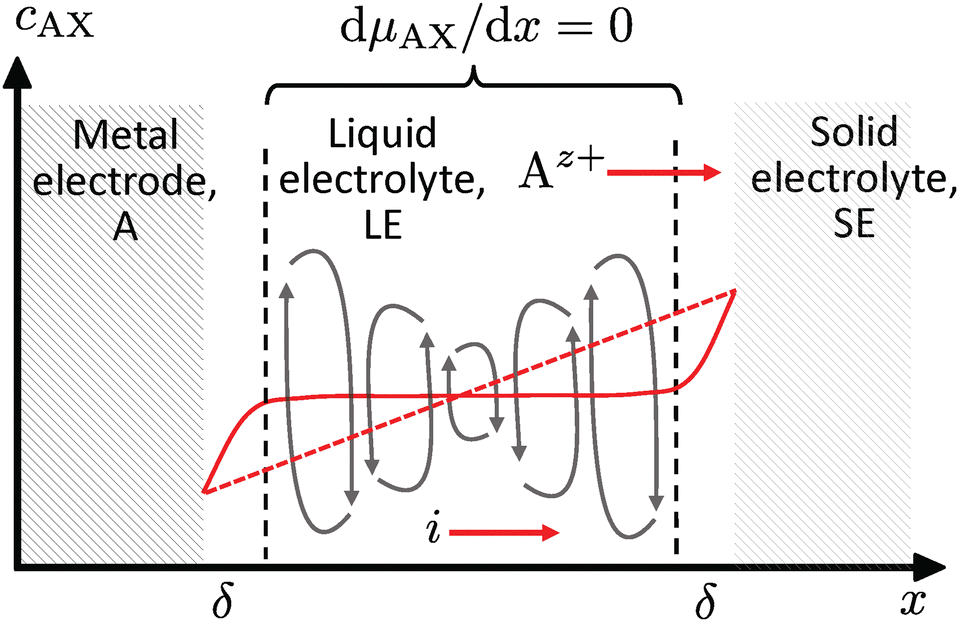 | ||
| Fig. 5 Ideal course of the concentration cAX in the absence of convection (dashed red line), if an electric current i is passing through the cell and the flux of anions is blocked. The LE is in contact with a metal electrode and a SE. In the presence of convection, the concentration gradient is levelled-out in the bulk (solid red line). There are only gradients in the Nernst diffusion layers δ. | ||
4 Experimental setup
4.1 Solid Li+ electrolytes (SE)
Ta-substituted lithium lanthanum zirconate (LLZO:Ta, Li6.6La3Zr1.6Ta0.4O12) and lithium aluminium titanium phosphate (LATP, Li1.5Al0.5Ti1.5(PO4)3) were used as SEs. LLZO:Ta is known to have an increased tendency to form a degradation layer on the surfaces in contact with air and with common LEs used in (secondary) battery applications, compared to LATP. The compounds have a garnet-type (Ia![[3 with combining macron]](https://www.rsc.org/images/entities/char_0033_0304.gif) d, a = 12.939 Å) and a NASICON-type structure (Rc, a = 8.491 Å, c = 8.495 Å).
d, a = 12.939 Å) and a NASICON-type structure (Rc, a = 8.491 Å, c = 8.495 Å).
After sintering, the cylindrical samples of LLZO:Ta and LATP were polished using SiC abrasive grinding papers up to a grade of 1200 grit to remove possible contamination and impurities on the surfaces. The final length of the samples measures 23 mm and the diameter 11.7 mm.
4.2 Liquid Li+ electrolytes (LE)
According to the concept of V. Gutmann, alkyl-ether-type solvents are known to exhibit higher donor numbers compared to alkyl-carbonate-based ones. Thus, in this study a 1:1 w/w mixture of ethylene carbonate (EC, Sigma-Aldrich, 99%) and dimethyl carbonate (DMC, Sigma-Aldrich, 99%) was used as an alkyl-carbonate-based solvent and a 1:1 w/w mixture of tetrahydrofuran (THF, Alfa Aesar, 99.8%, unstabilised) and 1,2-dimethoxyethane (DME, Honeywell, 99.9%) as an alkyl-ether-based solvent. Lithium hexafluorophosphate (LiPF6, Sigma-Aldrich, 99.99%) and lithium bis-oxalatoborate (LiBOB, LiB(C2O4)2, Chemetall, 99.9%) were used as conductive salts.
The LiPF6/EC/DMC (1:1 w/w) liquid electrolyte solutions and the LiBOB/THF/DME (1:1 w/w) liquid electrolyte (LE) solutions were prepared with concentrations in the range of 10−4 mol l−1 to 1 mol l−1. For the alkyl-ether-based solvent, LiBOB was chosen as the conductive salt. It turned out that LiPF6 causes degradation reactions with the ether-based solvent system THF/DME, leading to a darkening of the electrolyte solution and an increasing viscosity. This may indicate the occurrence of polymerisation processes.
4.3 DC cell with multiple potential probes
A symmetrical cell with eight electrodes was constructed to perform spatially resolved electrochemical measurements; see Fig. 6. It consists of three electrolyte compartments, arranged in the order LE/SE/LE. The polyether ether ketone (PEEK) housing of the SE has a diameter suitable to fit the LLZO:Ta and LATP samples. The housings for the LEs are made out of borosilicate glass with the same diameter as the SE (11.7 mm ∅). There are two electrochemically lithiated platinum wires (Heraeus, 99.99%, 0.3 mm diameter) in each LE compartment (p1, p2, p5 and p6). The lithiation of these wires to obtain potential probes was done by using electrolyte solutions with 1 M LiPF6 and a current of 10 mA for 120 s. The two potential probes to contact the SE are implemented by using lithium wires, directly pressed to the surface on the side of the pellet (p3 and p4).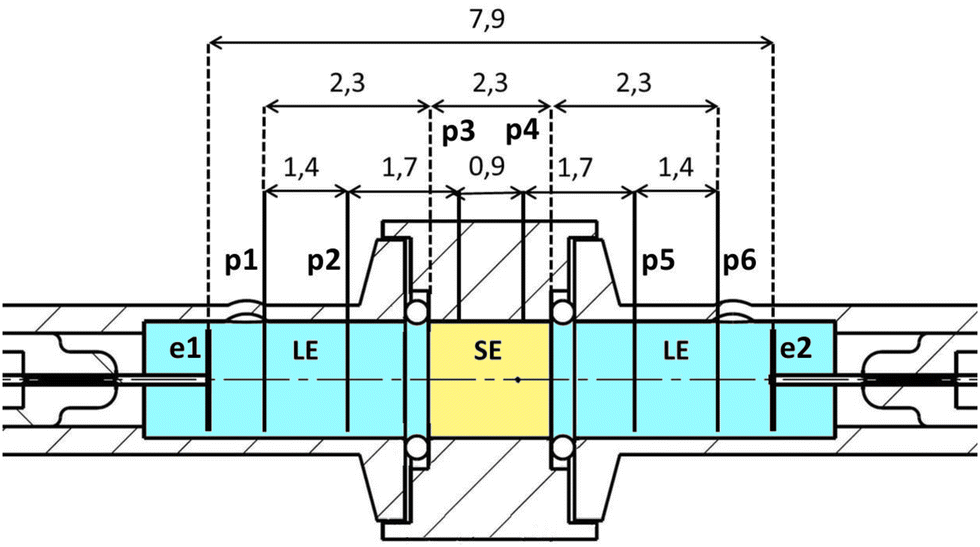 | ||
| Fig. 6 Cross-section of the eight-electrode-polarisation cell to investigate the interfaces between a liquid electrolyte (LE, blue) and a solid electrolyte (SE, yellow). The dimensions of the relevant parts are given in cm. | ||
Lithium foil with a thickness of 0.38 mm was punched into discs with a diameter of 8 mm (Sigma-Aldrich, 99.9%). The obtained Li metal discs were used as current-loaded working and counter electrodes (e1 and e2) and were in contact with Pt-wires (Heraeus, 99.99%, 0.5 mm diameter). The six probes p1 to p6 allow the determination of the local electrochemical potential Li+ in the SE and LE by linear extra- and interpolation of its course within the bulk of the electrolytes; see eqn (21).
4.4 Polarisation experiments on different SE|LE interfaces and at various Li+ concentrations
All experiments were carried out under an argon atmosphere at room temperature in a glovebox (≈0.1 ppm H2O/O2). The following combinations of SEs and LEs were investigated:(i) LLZO:Ta|EC/DMC + LiPF6
(ii) LLZO:Ta|DME/THF + LiBOB
(iii) LATP|EC/DMC + LiPF6
Galvanostatic measurements were performed by applying various DC currents with a stepsize of 10 μA up to a maximum value of ±1 mA (Zahner Zennium). The maximum current was limited by a maximum polarisation voltage of 4 V between the electrodes e1 and e2 of the cell to avoid decomposition of the LE. The steady-state potential differences between the potential probes p1 to p6 were recorded. The cell was relaxed at open circuit voltage (OCV) between the different current steps. The surface of the SE was cleaned by polishing before changing the electrolyte for another Li+ concentration.
5 Results
5.1 Steady-state course of the electrochemical potential differences
Typical spatial profiles of the electrochemical potentialLi+ at various current densities i are depicted in Fig. 7. The positions of the potential probes p1 to p6 are marked as dots, and the courses of the electrochemical potential Li+ within the LE and SE are linearly inter-/extrapolated. The measured voltage difference between every pair of potential probes is corrected by the zero current value to avoid any drifting effects of the system. As only potential differences can be measured, the value of probe p1 is arbitrarily set to zero. To determine the electrochemical potential drops ΔLi+,if at the LE|SE-interfaces, the extrapolated courses of the electrochemical potential are used.
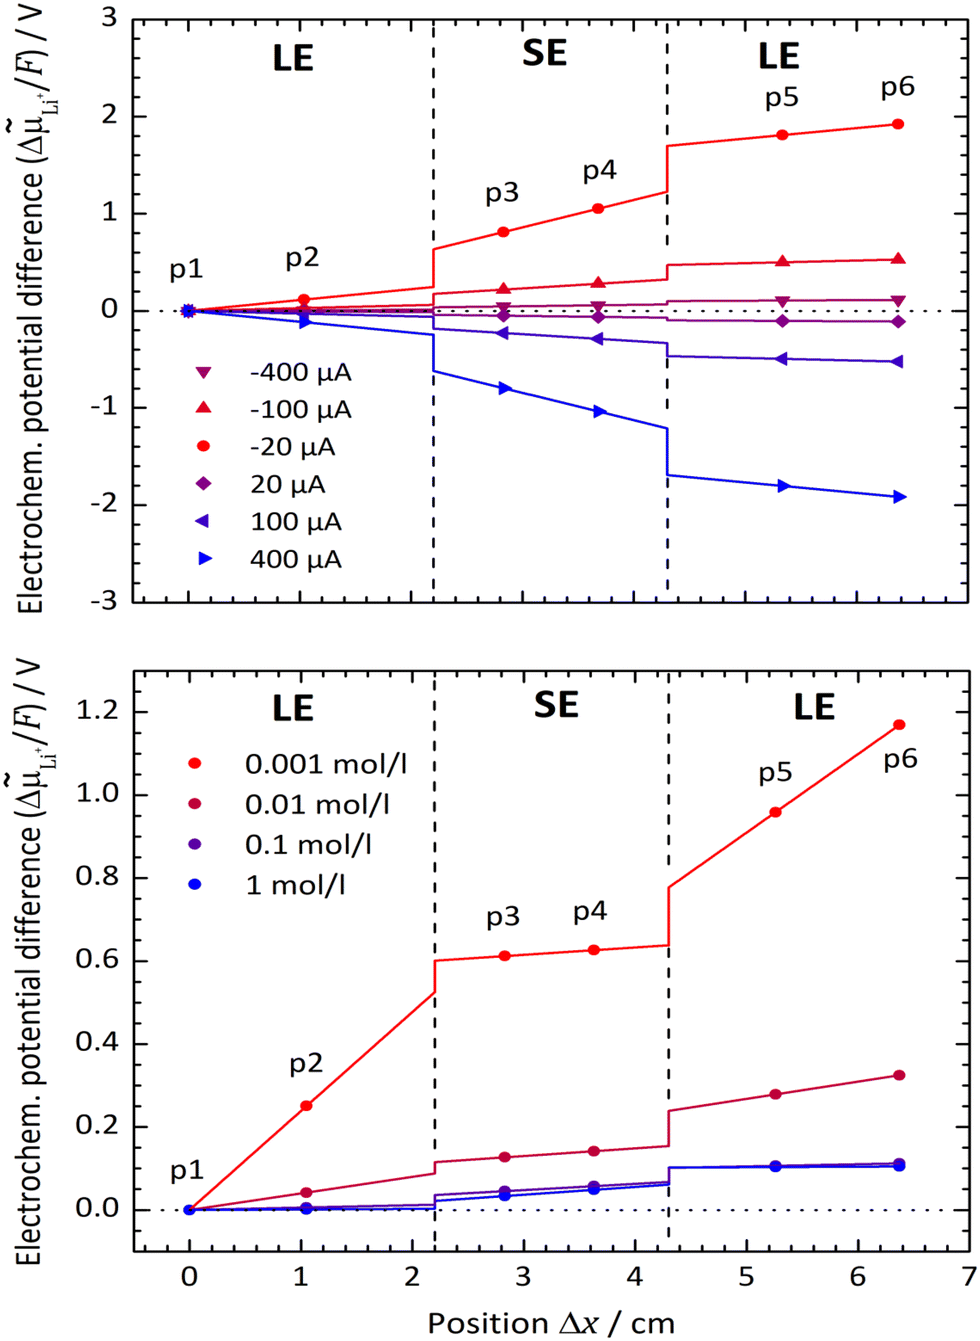 | ||
| Fig. 7 Course of the electrochemical potential Li+ in the system LLZO:Ta|EC/DMC + LiPF6 for a Li+ concentration in the LE of 0.1 mol l−1 at various cell currents (top) and for a current density i of 20 μA cm−2 at various Li+ concentrations in the LE (bottom). The experimental temperature is adjusted to 25 °C. | ||
In Fig. 7 (top), the system LLZO:Ta|EC/DMC + LiPF6 at a Li+ concentration of 0.1 mol l−1 in the LE and at a temperature of 25 °C is chosen exemplarily. The higher the current density i, the steeper are the potential gradients ΔLi+/Δx in the LE and SE, as well as the potential drops ΔLi+,if at the interfaces. At this relative high concentration, both interfaces behave similarly and independently of current direction, i.e., Li+ transfer from LE to SE and vice versa.
This behaviour principally changes when the concentration of the LE is decreased to low values, as shown in Fig. 7 (bottom), where the spatial profiles for different concentrations at a fixed current density of 20 μA cm−2 are plotted. For concentrations lower than 0.1 mol l−1, the charge transfer from the LE to SE needs to overcome a much higher potential step than vice versa.
5.2 Polarisation curves of the LE|SE interface
Typical polarisation curves of the SE|LE interface at different Li+ concentrations in the LE are exemplarily shown in Fig. 8 for the system LATP|EC/DMC + LiPF6 at a temperature of 25 °C, plotting the current density i vs. the electrochemical potential drop ΔLi+,if. The curves show a quasi-linear behaviour for potential drops ΔLi+,if/F below ±50 mV. The slopes decrease with increasing concentrations. At low concentrations and higher potential drops, the curve becomes asymmetric and the current density i seems to reach a limiting value for negative potential drops.
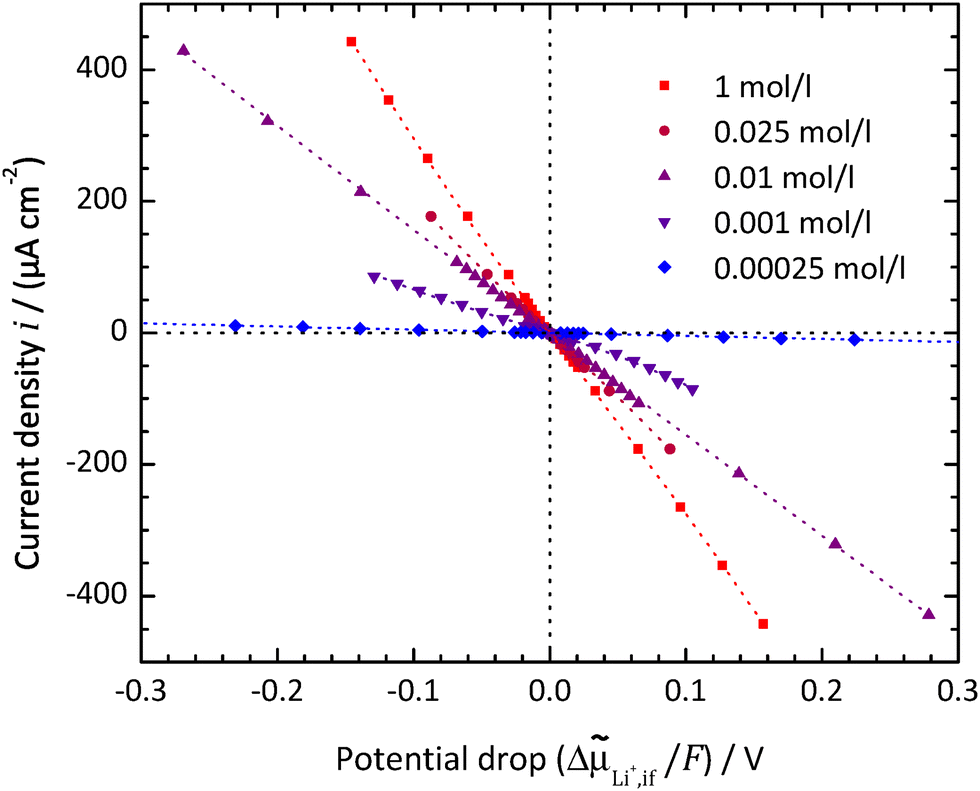 | ||
| Fig. 8 LATP|EC/DMC + LiPF6: current density i vs. electrochemical potential drop ΔLi+,if at the SE|LE interface for different Li+ concentrations in the LE. The dashed curves are fitted using an implicit expression for the current density i = f(ΔAz+,if,α,i0,Rslei) by combining eqn (4) and (7)–(9). | ||
5.3 Polarisation resistance of the LE|SE interface
The polarisation resistance RP is calculated from the reciprocal slope of the polarisation curve, as depicted exemplarily for LATP|EC/DMC + LiPF6 in Fig. 8, according to eqn (10) at i = 0. The obtained polarisation resistance RP of the investigated systems, LLZO:Ta|EC/DMC + LiPF6, LLZO:Ta|DME/THF + LiBOB and LATP|EC/DMC + LiPF6, as a function of the Li+ concentrations in the LE is depicted in Fig. 9 in double-logarithmic plots, exemplarily for a temperature of 25 °C (298 K) for each system. The polarisation resistance RP vs. Li+ concentration for additional temperatures of 15 °C (288 K), 20 °C (293 K), 30 °C (303 K) and 35 °C (308 K) is depicted in Fig. S1–S3 in the ESI.†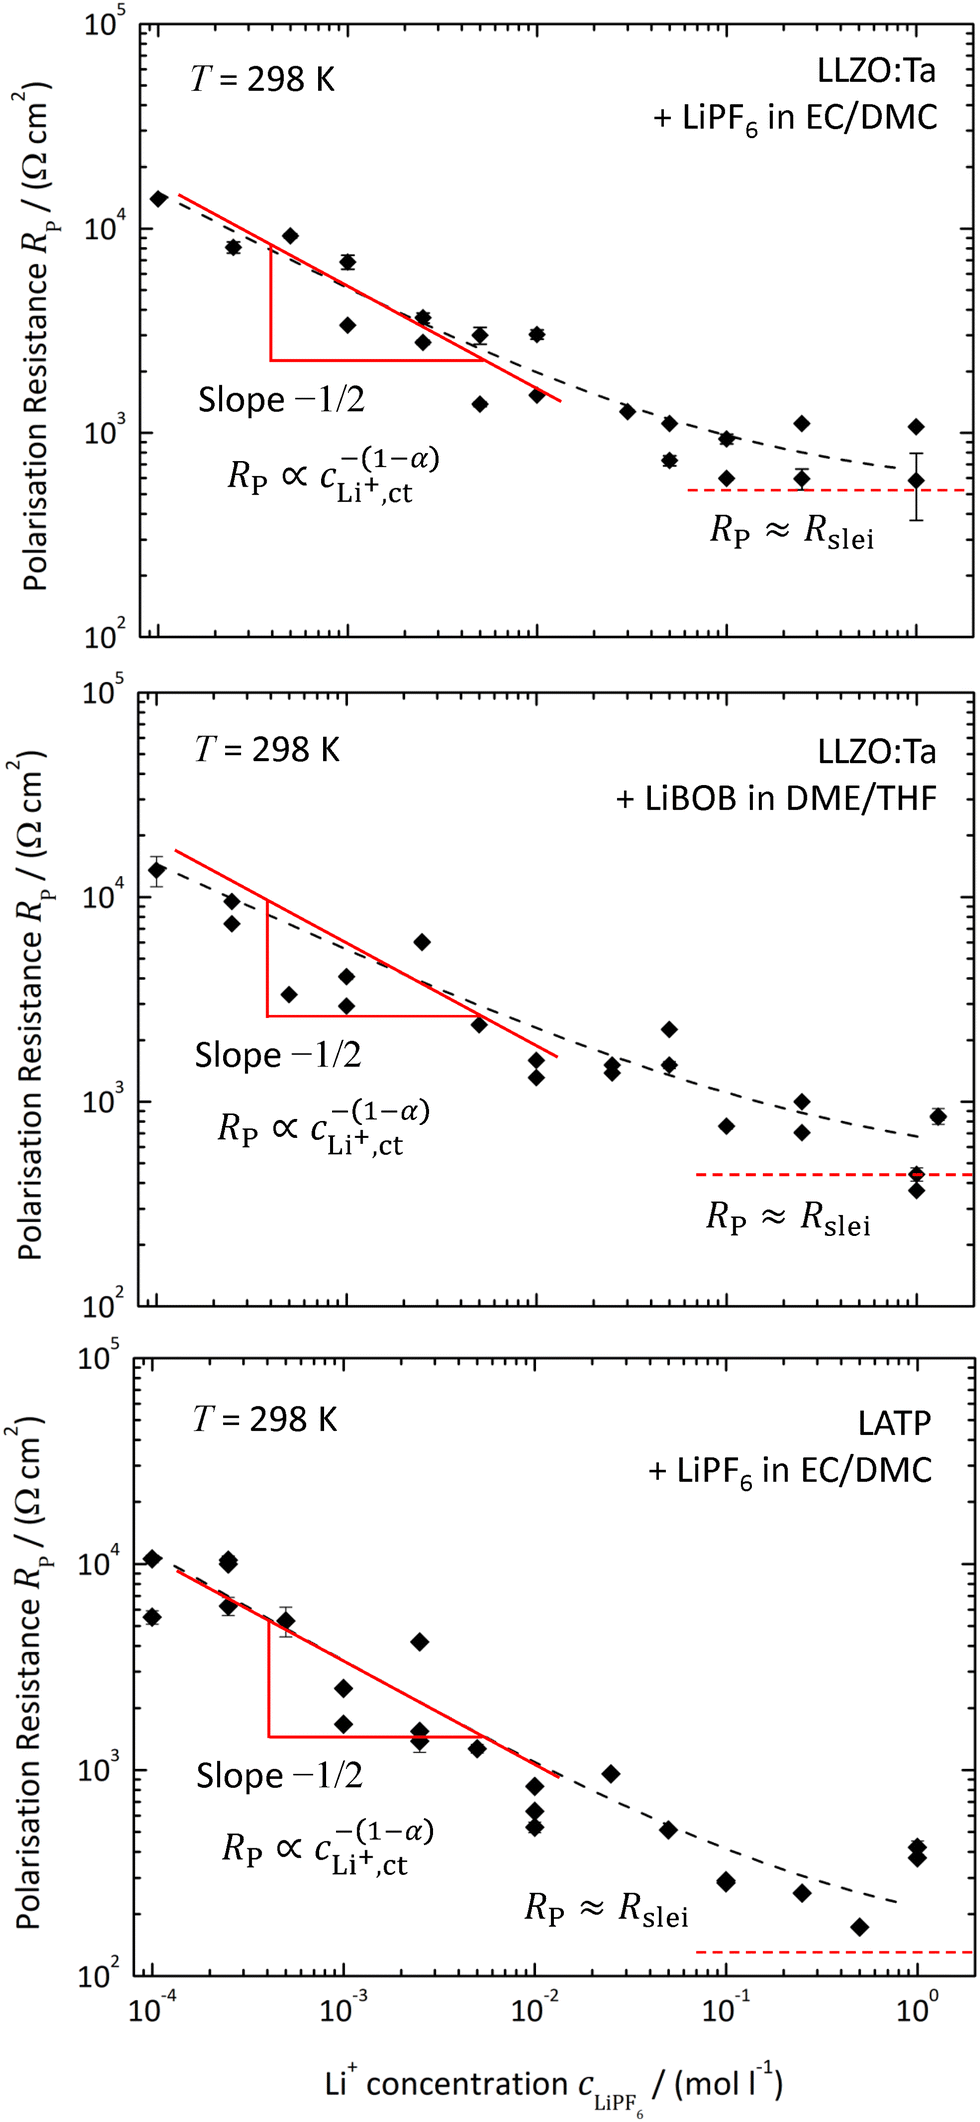 | ||
| Fig. 9 Polarisation resistance RP vs. Li+ concentration in the LE with a double-logarithmic scaling for the investigated systems, LLZO:Ta|EC/DMC + LiPF6 (top), LLZO:Ta|DME/THF + LiBOB (middle) and LATP|EC/DMC + LiPF6 (bottom), at a temperature of 25 °C (298 K). | ||
6 Discussion
6.1 Polarisation curves of the LE|SE interfaces
The plots of the current density i vs. potential drop ΔLi+,if/F at the SE|LE interface show highly elongated S-shaped curves; see Fig. 8 for the system LATP|EC/DMC + LiPF6 or in the preceding publication by Schleutker et al. for the system LLZO:Ta|EC/DMC + LiPF6.19 This principally confirms the assumption that a constant resistance is superposed onto Butler–Volmer-type kinetics, resulting in an exponential behaviour for small potential drops and an asymptotic approach to a linear behaviour for larger potential drops.
For Li+ concentrations in the LE above 0.1 mol l−1, it is possible to fit the data, considering eqn (4), (8) and (9) and iterative solving of the implicit functional expression. As the curves are quite symmetric, a geometry factor of about 1/2 is obtained. However, at Li+ concentrations of 0.01 mol l−1 and below, diffusion limitations are present nearly over the whole potential range, resulting in a strong asymmetry. At Li+ concentrations above 0.01 mol l−1, diffusion limitations are still present for high potential drops, resulting in slight but systematic deviations. This results in strong dependencies between the areal resistance of the interface layer Rslei and the Butler–Volmer-like rate constant  , also when restricted only to small potential drops for fitting. Thus, this approach does not deliver reliable results for the ionic charge transfer parameters.
6.2 Polarisation resistance of the LE|SE interfaces
According to the considerations above, only at very low potential drops (current densities) can the influence of diffusion limitations be neglected. Thus, the polarisation resistance RP of the investigated systems as a function of the Li+ concentration in the LE can be safely calculated from the slopes of the polarisation curves at zero current; see Fig. 9 for a temperature of 25 °C.The system LLZO:Ta|EC/DMC + LiPF6 was also studied in a preceding paper.19 The old data of RP vs. cLi+ at 298 K fit well to the new data, regarding value and scattering (see Fig. S9 in the ESI†). According to the scattering of the data points, an experimental error span of about ±140% can be estimated. This is larger than the error bars calculated from the experimental errors, e.g., of voltage readings, geometric distances or original weight of conductive salt. It may be caused by variation in the surface treatment of the SE between each experimental run or an insufficient idle time for the steady-state.
Assuming Butler–Volmer-type ionic transfer kinetics and a surface layer with a constant resistance, the polarisation resistance RP should depend on the Li+ concentration according to eqn (10). The power law dependence, RP ∝ c−(1−α)LiX, can be nicely seen for all investigated systems below a Li+ concentration of 0.01 mol l−1 as a constant slope in the double-logarithmic scaling. A constant plateau, RP = Rslei, representing the limiting resistance of a low-conductivity surface layer, can be clearly seen for the system LLZO:Ta|EC/DMC + LiPF6. In the case of the other systems, LLZO:Ta|DME/THF + LiBOB and LATP|EC/DMC + LiPF6, a bending towards high Li+ concentrations is obvious. This behaviour is another confirmation for the assumed model.
The data in Fig. 9 for a temperature of 25 °C can be fitted by using eqn (6) and (10):
 | (23) |
 , are summarised in Table 1 for each system. The exchange current density i0 is calculated for a Li+ concentration of 1 mol l−1 according to eqn (6).
 at 25 °C (298 K), obtained by fitting eqn (23) to the polarisation resistance RP vs. Li+ concentration curves in Fig. 9. The exchange current density i0 is calculated for a Li+ concentration of 1 mol l−1
| SE|LE | Rslei/(Ω cm2) |
|
α | i0/(μA cm−2) |
|---|---|---|---|---|
| LLZO:Ta|EC/DMC + LiPF6 | 504 ± 251 | (1.78 ± 0.97) × 10−9 | 0.50 ± 0.06 | 172 ± 93 |
| LLZO:Ta|DME/THF + LiBOB | 429 ± 221 | (1.08 ± 0.64) × 10−9 | 0.56 ± 0.08 | 104 ± 62 |
| LATP|EC/DMC + LiPF6 | 135 ± 208 | (3.25 ± 2.43) × 10−9 | 0.46 ± 0.09 | 313 ± 235 |
The areal resistance of an LE|SE interface layer Rslei at 25 °C is in the range of 100–500 Ω cm2; the values of the LLZO:Ta-based systems are significantly higher compared to the LATP-based system. The geometry factor of all investigated systems is very close to 1/2. This indicates that there is a symmetric transition state for the (rate-limiting) ion transfer step at the SE/LE interface. The exchange current density i0 is in the range of 100–300 μA cm−2. Thus, the measured values of i0 for the investigated SE|LE interfaces are close to the values measured for typical cathode materials and comparably small compared to those of typical anode materials used in commercial Li ion batteries. In the literature, values of 600–800 μA cm−2 can be found for graphite anodes and of 200–600 μA cm−2 for NMC (Li1/3Ni1/3Mn1/3CoO2) cathodes.24 Thus, the introduction of additional SE|LE interfaces in a battery cell must not be neglected. A solid electrolyte membrane will add two additional and electrochemically comparable “slow” interfaces. This will significantly lower the reachable total current density and thus the (peak) power of the device.
6.3 Temperature dependence and activation energies
The polarisation curves of the systems LLZO:Ta|EC/DMC + LiPF6, LLZO:Ta|DME/THF + LiBOB and LATP|EC/DMC + LiPF6 were measured in the range between 15 and 35 °C; the polarisation resistance RP vs. Li+ concentration plots for all measured temperatures are depicted in Fig. S1–S3 in the ESI.† The temperature-dependent results for the areal resistance of the LE|SE interface layer Rslei and the Butler–Volmer-like rate constant were obtained by fitting the data, again using eqn (6) and (10), i.e. eqn (23). The geometry factor α is fixed to a value of 1/2 to reduce mutual parameter dependencies, as in some cases the scattering of the temperature-dependent data is relatively high. The results for the fitting parameters, i.e., the areal resistance of the LE|SE interface layer Rslei and the Butler–Volmer-like rate constant
  , are summarised for each system in Tables S4–S6 in the ESI.†
The plots of the areal resistance of the LE|SE interface layer Rslei and of the Butler–Volmer-like rate constant  against the reciprocal temperature 1/T, obtained as fitting parameters, are depicted in Fig. 10. The activation energy Ea,slei of the conduction process in the LE|SE interface layer Rslei can be obtained by plotting ln(T/Rslei) vs. 1/T and performing a linear regression, i.e., assuming Arrhenius behaviour. The activation energy of the Butler–Volmer-like ionic transfer process, Ea,ct can be obtained from a plot of
  . The results are summarised in Table 2.
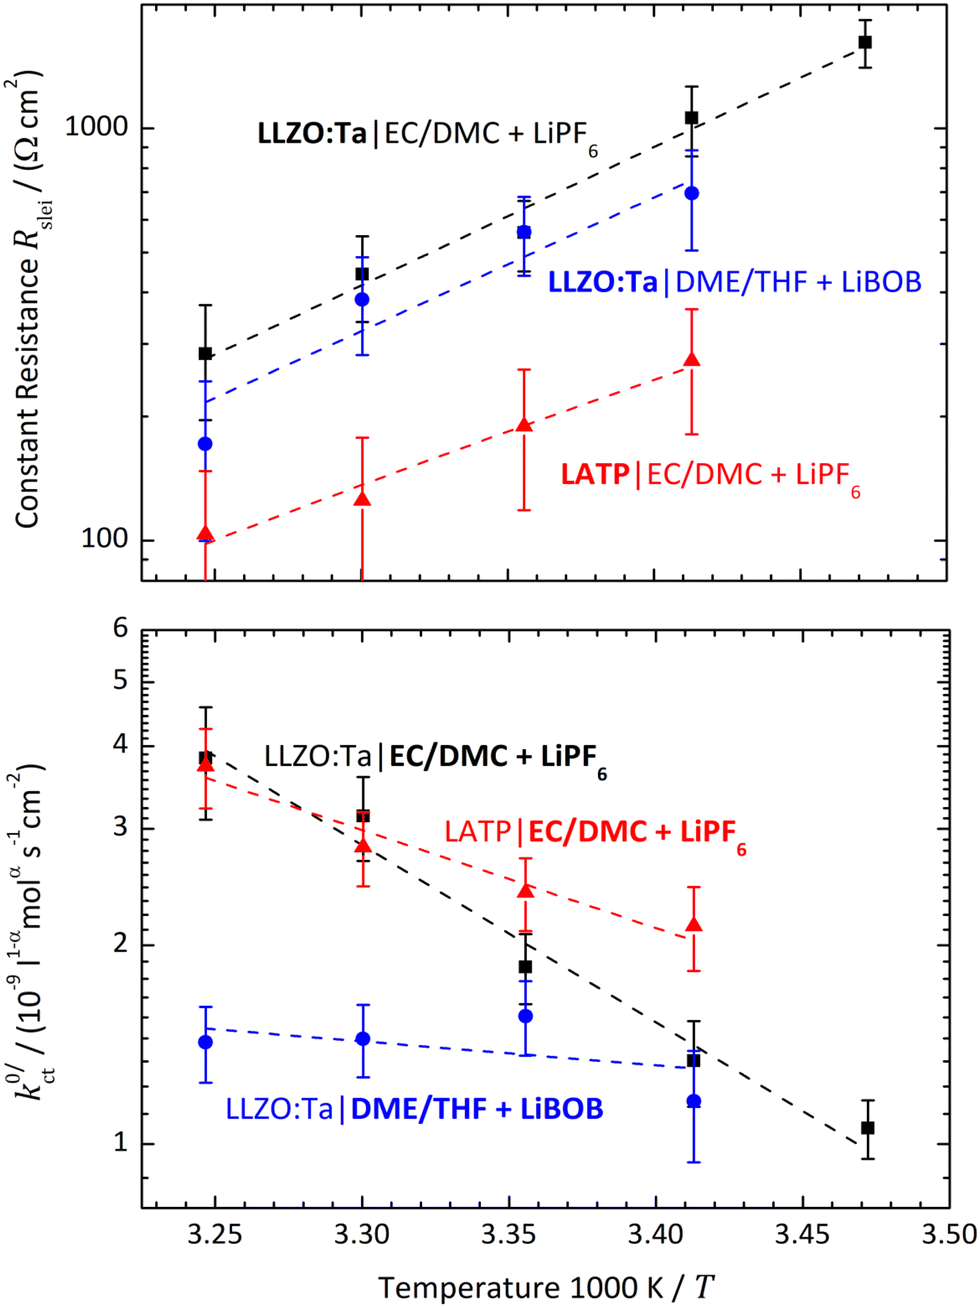 | ||
Fig. 10 Areal resistance of the LE|SE interface layer Rslei (top) and the Butler–Volmer-like rate constant  (bottom) with a logarithmic scaling for the systems LLZO:Ta|EC/DMC + LiPF6 (black symbols), LLZO:Ta|DME/THF + LiBOB (blue symbols) and LATP|EC/DMC + LiPF6 (red symbols) as a function of reciprocal temperature 1/T. (bottom) with a logarithmic scaling for the systems LLZO:Ta|EC/DMC + LiPF6 (black symbols), LLZO:Ta|DME/THF + LiBOB (blue symbols) and LATP|EC/DMC + LiPF6 (red symbols) as a function of reciprocal temperature 1/T. | ||
 of the conduction process in the LE|SE interface layer and of the Butler–Volmer-like ionic transfer process, obtained by fitting the data in Fig. 10 using the Arrhenius law
| SE|LE | Ea,slei/(kJ mol−1) | (Rslei)*/Ω | Ea,ct/(kJ mol−1) |
|
|---|---|---|---|---|
| LLZO:Ta|EC/DMC + LiPF6 | 67 ± 4 | (4.34 ± 7.79) × 10−12 | 51 ± 4 | 1.46 ± 2.59 |
| LLZO:Ta|DME/THF + LiBOB | 71 ± 15 | (6.4 ± 38.3) × 10−13 | 8 ± 9 | (3.7 ± 12.7) × 10−8 |
| LATP|EC/DMC + LiPF6 | 52 ± 5 | (4.22 ± 7.25) × 10−10 | 27 ± 4 | (1.56 ± 2.69) × 10−4 |
The chemical composition of the SLEI layer formed in the SE|LE interface is discussed by Weiss et al.17 According to this review, the SLEI consists of decomposition products of the LE and SE. Depending on the use of, e.g., carbonate- or ether-based solvents, and LiPF6 or LiCF3SO3 as conductive salts, layers containing inorganic (LiF, Li2O, Li2CO3, LixSOy, LixPOyFz), organic (carbonyl species, alcoholates) and polymeric compounds were found. SEs with the NASICON structure generally result in low interface resistances, and garnet- or perovskite-type SEs in high interface resistances. When stored in air, it is known that LLZO has a strong tendency to form a surface layer consisting of LiOH and Li2CO3.25,26 LATP is regarded as intrinsically stable under ambient conditions.27 This is in accordance with the observations in this study.
The measured activation energies Ea,slei for the LLZO:Ta- and LATP-based systems are both clearly higher compared to the activation energies Ea for ionic transport in the bulk of the SEs. In the case of LLZO:Ta, a value of 36 kJ mol−1 (0.37 eV) and in case of LATP, a value of 35 kJ mol−1 (0.36 eV) were measured in this study; see Fig. S7 and Table S8 in the ESI.† The corresponding activation energy of a solid electrolyte interface (SEI) layer formed on graphite in a Li ion secondary battery, using a LE consisting of EC/DMC + LiPF6, was determined by Solchenbach et al. as 55 kJ mol−1 (0.57 eV) at 25 °C.28 Thus, the measured values are in a comparable range to those of the LATP-based systems.
| Fluoroalkyl-carbonates | < | Alkyl-carbonates | < | Alkyl-ether | ≪ | Sulfoxides |
| ∼9 | 15–17 | 20–21 | ∼30 |
This implies a stronger solvation of the Li+ cations by alkyl-ether-based solvents compared to alkyl-carbonate-based solvents and thus a higher activation barrier at the interface. Abe et al., Sagane et al. and Yamada et al. have investigated systems using Li+ electrolytes based on propylene carbonate (PC), EC/DMC, dimethylsulfoxide (DMSO) and fluoroethylene carbonate (FEC). The values found for the activation energy of the interfacial resistance were increasing in the expected order, FEC < EC/DMC ≈ PC < DMSO; see Table 3. The system using only DMC has a comparable low activation energy.
Actually, when plotting the Butler–Volmer-like rate constant  determined in this study vs. the reciprocal temperature 1/T, the observed trends do not fit to the considerations regarding the DN and solvation enthalpy; see Fig. 10 (bottom). Over a wide temperature range, the measured rate constants
  for the systems based on EC/DMC + LiPF6, i.e., alkyl carbonates, are larger than the value measured for the system based on DME/THF + LiBOB, i.e., an alkyl ether. The difference is decreasing with decreasing temperature. However, the activation energy Ea,ct of the ion transfer process for the system based on DME/THF + LiBOB, about 8 kJ mol−1 (0.08 eV), is much smaller compared to the values measured for the one based on EC/DMC + LiPF6, 52 and 27 kJ mol−1 (0.54 and 0.28 eV). This does not correlate with the higher DN of alkyl-ether-based solvents. The lower activation energy is expected for the alkyl-carbonate-based electrolytes.
In the studies by Abe et al., Sagane et al. and Yamada et al., the system using an FEC-based solvent exhibits the highest interfacial resistance in the investigated temperature range, despite the fact it has the lowest activation energy. This can also be observed in this study for the system based on DME/THF + LiBOB. When comparing the  and Rslei measured in this study, the system with the lowest activation energy, i.e., LATP|EC/DMC + LiPF6 in the case of Ea,slei and LLZO:Ta|DME/THF + LiBOB in the case of Ea,ct, also exhibits the lowest pre-exponential factor, resulting in the lowest values for Rslei and
  . There is obviously a large difference in the range of the pre-exponential factors. In the case of Rslei, they vary in a range of three magnitudes, and in the case of
  they vary by even 8 orders of magnitude. This implies that considering only the solvation enthalpy may be an oversimplification, as the pre-exponential factor is not taken into account and thus neither are the entropic parts related to the transition state. This study is limited to only two solvent systems. Any further assignments to features that may influence the transition entropy, like denticity, size, open chain or cyclic structure of the solvent molecules, may be rather speculative. The pre-exponential of an Arrhenius-type rate law depends on the partition functions of the educts and the transition state (Eyring theory). For a deeper discussion, more experimental data and theoretical studies are necessary, e.g., employing ab initio molecular dynamics.
In the studies published by Abe et al., Sagane et al. and Yamada et al., a simultaneous presence of a low-conductivity surface layer is not taken into consideration. This impedes a comparison of the measured values to those in this study. However, the PC- and EC/DMC-based systems also exhibit activation energies in the range of 50 to 60 kJ mol−1 (0.52 to 0.62 eV). Alkyl-ether-based systems were not investigated; see Table 3.
7 Conclusions
The electrochemical potential drops at the interfaces between three different systems consisting of Li+-conducting solid (SE) and liquid electrolytes (LE) were measured as a function of the current density. An electrochemical cell consisting of three electrolyte compartments LE|SE|LE and eight potential probes was used. The solid electrolytes LLZO:Ta and LATP were combined with the liquid electrolytes LiPF6 in EC/DMC and LiBOB in DME/THF.The course of the calculated polarisation resistance vs. the Li+ concentration in the LE indicates that there are two contributions to the kinetics of the ionic transport across the SE|LE interface. At low Li+ concentrations in the LE, Butler–Volmer-like kinetics is rate limiting, resulting in a power-law dependence of the polarisation resistance vs. Li+ concentration. At high Li+ concentrations, a constant value of the polarisation resistance is reached. This indicates the presence of a low-conductivity surface layer formed by degradation reactions, limiting the ion transport. Thus, the simultaneous presence of both phenomena reported in the literature can be shown.
The exchange current density of the Butler–Volmer-like kinetics is significantly smaller compared to the values of typical anode and cathode materials, in the order of 200–300 μA cm−2. Thus, the introduction of a SE membrane in a battery cell must not be neglected regarding power density. Furthermore, as the Butler–Volmer-like ion transfer cannot be avoided, it is even more important to avoid the formation of low-conductivity surface layers, resulting in a surface resistance of several hundred Ω cm2. This may be achieved by using intrinsically stable SEs (e.g., NASICON-type materials) or via a final surface cleaning step in an inert gas atmosphere, if the SE is mainly affected by reactions with the ambient atmosphere during preparation.
The activation energies of both contributions, ion transport in the low-conductivity surface layer and a Butler–Volmer-like ion transfer, were measured. The activation energy of the first process, in the case of the LATP-based system, is in the same order as observed for SEI layers formed on graphite cathodes in lithium batteries. In the case of the LLZO:Ta-based systems, it is significantly higher. This is not surprising, as LLZO:Ta generally has a higher tendency to form a degradation layer with air and humidity.
According to the literature, the activation energy of the second process should mainly depend on the solvation energy of the Li+ ions and thus on the donor number of the solvent used in the LE. This cannot be confirmed in this study when comparing systems with alkyl-ether- or alkyl-carbonate-based solvents. However, the alkyl-ether-based system has a much higher rate constant than the alkyl-carbonate-based one, due to a much higher pre-exponential factor. Focussing only on the solvation energy may be an oversimplification and disregards entropic effects.
Data availability
The data analysed in this article are either available in the published article or have been included as part of the ESI.†Conflicts of interest
There are no conflicts to declare.Acknowledgements
We thank Philipp Hecker (IMD-2) for the synthesis of the LLZO:Ta and LATP. MF gratefully acknowledges the funding by the ministry of education and Research (BMBF) with the projects FestBatt2-Oxid (FKZ: 13XP0434A) and FestBatt2-Hybrid (13XP0428A).Notes and references
- Q. Wang, J. Jin, X. Wu, G. Ma, J. Yang and Z. Wen, Phys. Chem. Chem. Phys., 2014, 16, 21225–21229 RSC.
- L. Wang, Y. Zhao, M. L. Thomas, A. Dutta and H. R. Byon, ChemElectroChem, 2016, 3, 152–157 CrossRef CAS.
- R. P. Rao and S. Adams, J. Mater. Sci., 2016, 51, 5556–5564 CrossRef.
- A. Manthiram and L. Li, Adv. Energy Mater., 2015, 5, 1401302 CrossRef.
- B. J. Bergner, M. R. Busche, R. Pinedo, B. B. Berkes, D. Schröder and J. Janek, ACS Appl. Mater. Interfaces, 2016, 8, 7756–7765 CrossRef CAS PubMed.
- D. Safanama and S. Adams, J. Power Sources, 2017, 340, 294–301 CrossRef CAS.
- T. Abe, F. Sagane, M. Ohtsuka, Y. Iriyama and Z. Ogumi, J. Electrochem. Soc., 2005, 152, A2151–A2154 CrossRef.
- F. Sagane, T. Abe, Y. Iriyama and Z. Ogumi, J. Power Sources, 2005, 146, 749–752 CrossRef CAS.
- Y. Yamada, F. Sagane, Y. Iriyama, T. Abe and Z. Ogumi, J. Phys. Chem. C, 2009, 113, 14528–14532 CrossRef CAS.
- F. Sagane, T. Abe and Z. Ogumi, J. Phys. Chem. C, 2009, 113, 20135–20138 CrossRef CAS.
- F. Sagane, K. Miyazaki, T. Fukutsuka, Y. Iriyama, T. Abe and Z. Ogumi, Chem. Lett., 2010, 39, 826–827 CrossRef CAS.
- V. Gutmann, Coord. Chem. Rev., 1976, 18, 225–255 CrossRef CAS.
- A. Mehrotra, P. N. Ross and V. Srinivasan, J. Electrochem. Soc., 2014, 161, A1681–A1690 CrossRef CAS.
- M. R. Busche, T. Drossel, T. Leichtweiss, D. A. Weber, M. Falk, M. Schneider, M.-L. Reich, H. Sommer, P. Adelhelm and J. Janek, Nat. Chem., 2016, 8, 426–434 CrossRef CAS PubMed.
- M. Weiss, B.-K. Seidlhofer, M. Geiß, C. Geis, M. R. Busche, M. Becker, N. M. Vargas-Barbosa, L. Silvi, W. G. Zeier, D. Schröder and J. Janek, ACS Appl. Mater. Interfaces, 2019, 11, 9539–9547 CrossRef CAS PubMed.
- M. R. Busche, M. Weiss, T. Leichtweiss, C. Fiedler, T. Drossel, M. Geiss, A. Kronenberger, D. A. Weber and J. Janek, Adv. Mater. Interfaces, 2020, 7, 2000380 CrossRef CAS.
- M. Weiss, F. J. Simon, M. R. Busche, T. Nakamura, D. Schröder, F. H. Richter and J. Janek, Electrochem. Energy Rev., 2020, 3, 221–238 CrossRef.
- H. Yang, G. V. Zhuang and P. N. Ross, J. Power Sources, 2006, 161, 573–579 CrossRef CAS.
- M. Schleutker, J. Bahner, C.-L. Tsai and C. Korte, Phys. Chem. Chem. Phys., 2017, 19, 26596–26605 RSC.
- J. N. Agar, Discuss. Faraday Soc., 1947, 1, 26–37 RSC.
- N. Ibl, K. Buob and G. Trümpler, Helv. Chim. Acta, 1954, 37, 2251–2264 CrossRef CAS.
- V. G. Levich, Physicochemical hydrodynamics, Prentice Hall, Englewood Cliffs, 1962 Search PubMed.
- N. Ibl, Chem. Ing. Tech., 1963, 35, 353–361 CrossRef CAS.
- J. Schmalstieg, C. Rahe, M. Ecker and D. U. Sauer, J. Electrochem. Soc., 2018, 165, A3799–A3810 CrossRef CAS.
- A. Sharafi, S. Yu, M. Naguib, M. Lee, C. Ma, H. M. Meyer, J. Nanda, M. Chi, D. J. Siegel and J. Sakamoto, J. Mater. Chem. A, 2017, 5, 13475–13487 RSC.
- N. Zhang, G. Ren, L. Li, Z. Wang, P. Yu, X. Li, J. Zhou, H. Zhang, L. Zhang, Z. Liu and X. Liu, Nat. Commun., 2024, 15, 2777 CrossRef CAS PubMed.
- K. J. Kim, M. Balaish, M. Wadaguchi, L. Kong and J. L. M. Rupp, Adv. Energy Mater., 2021, 11, 2002689 CrossRef CAS.
- S. Solchenbach, X. Huang, D. Pritzl, J. Landesfeind and H. A. Gasteiger, J. Electrochem. Soc., 2021, 168, 110503 CrossRef CAS.
- J. D. Forero-Saboya, E. Marchante, R. B. Araujo, D. Monti, P. Johansson and A. Ponrouch, J. Phys. Chem. C, 2019, 123, 29524–29532 CrossRef CAS PubMed.
- P. Xiao, X. Yun, Y. Chen, X. Guo, P. Gao, G. Zhou and C. Zheng, Chem. Soc. Rev., 2023, 52, 5255–5316 RSC.
Footnotes | |||
| † Electronic supplementary information (ESI) available. See DOI: https://doi.org/10.1039/d4cp04738a | |||
| ‡ The donor number (DN) according V. Gutmann is a (quantitative) measure of the Lewis basicity of a solvent (or complex ligand). It is given as the (calorimetric) measured reaction enthalpy, in kcal mol−1, of the Lewis base with the strong Lewis acid antimony pentafluoride SbF5.12 | |||
§ The fluxes of cations jAz+ and anions jXz− can be treated using linear transport theory (linear irreversible thermodynamics):
![[e with combining right harpoon above (vector)]](https://www.rsc.org/images/entities/i_char_0065_20d1.gif) x of the x-axis. x of the x-axis. | |||
¶ The sum of the electrochemical potentials of cations Az+ and anions Xz− is equal to the chemical potential μAX of the component AX:
| |||
|| The transference numbers of Az+ and Xz− are defined as:
|
| This journal is © the Owner Societies 2025 |