
 Open Access Article
 This Open Access Article is licensed under a Creative Commons Attribution-Non Commercial 3.0 Unported Licence
A comprehensive study of the differential cross sections for water–rare gas collisions: experimental and theoretical perspectives
Ricardo Manuel García-Vázquez *a,
Zhong-Fa Sun*b,
Chung-Hsin Yangc,
Lisán David Cabrera-Gonzálezd,
Otoniel Denis-Alpizare,
Philippe Halvicka,
David H. Parker*bf and
Thierry Stoecklin*a
*a,
Zhong-Fa Sun*b,
Chung-Hsin Yangc,
Lisán David Cabrera-Gonzálezd,
Otoniel Denis-Alpizare,
Philippe Halvicka,
David H. Parker*bf and
Thierry Stoecklin*a
aUniv. Bordeaux, CNRS, Bordeaux INP, ISM, UMR 5255, F-33400 Talence, France. E-mail: rgarciavazqu@u-bordeaux.fr; thierry.stoecklin@u-bordeaux.fr
bAnhui Province Key Laboratory for Control and Applications of Optoelectronic Information Materials, Department of Physics, Anhui Normal University, Wuhu, Anhui 241002, China. E-mail: zfsun@ahnu.edu.cn
cInstitute of Atomic and Molecular Sciences, Academia Sinica, Taipei 10617, Taiwan
dDepartment of Chemistry, The University of Manchester, Oxford Road, Manchester, M13 9PL, UK
eDepartamento de Física, Facultad de Ciencias, Universidad de Chile, Av. Las Palmeras 3425, Ñuñoa, Santiago, Chile
fDepartment of Molecular and Laser Physics, Institute for Molecules and Materials, Radboud University, Heyendaalseweg 135, 6525 AJ Nijmegen, The Netherlands. E-mail: parker@science.ru.nl
First published on 18th March 2025
Abstract
Experimental measurements and theoretical quantum calculations of the inelastic differential cross sections for the collisions of H2O with Ne, Ar and Xe atoms are respectively compared at the 364, 390 and 351 cm−1 collision energies. The four rotational excitation transitions 000 → 111, 101 → 212, 101 → 110 and 101 → 221 are studied for the three systems. The experimental setup consists of a crossed molecular beam machine with velocity map imaging complemented with state-selective laser ionization detection. The theoretical approach is based on close-coupling calculations of rare gas scattering by rigid H2O, using two recently developed potential energy surfaces for Ne + H2O and Ar + H2O systems as well as a new potential energy surface developed in this work for the Xe + H2O system. Measured and calculated differential cross sections are in good agreement. The integral cross section is increasing in proportion to the mass of the rare gas atom. This can be attributed to the rise of the rare gas polarizability along with the rise of the dissociation energy and reduced mass of the Rg–H2O complex. The fast oscillations observed in the calculated differential cross sections attest that the collision dynamics is mainly driven by the repulsive part of the interaction potential, as could be expected since the collision energies are much larger than the dissociation energies.
1 Introduction
Differential cross sections (DCSs) give the most detailed information about a collisional process and this is the reason why so many comparisons between theoretical and experimental DCSs are performed. They are a sensitive test for the accuracy of the interaction energy model. Such comparison can be quite fruitful as demonstrated for example by the study recently performed by Xiahou et al. for the F+ H2 reactive collision.1 The evaluation of DCS for inelastic collisions of atoms with symmetric2 or asymmetric top molecules3 has recently been the subject of renewed interest, largely due to the advent of ion imaging techniques. Water has been the subject of such studies due to its presence in various environments and its significant role in atmospheric physics and astrochemistry. DCSs for elastic scattering of H2O with the rare gases, H2, and H2O were first acquired by Bickes et al.4 In their pioneering work, the observed diffractive oscillations and rainbow maximum were employed to fit the parameters of the assumed Lennard-Jones model potential such as the well depth and the location of potential minimum. Later on Slankas et al.5 performed a similar experiment for H2O colliding with He and demonstrated that both the attractive and repulsive part of the potential were less anisotropic than expected. A more detailed measurement of the elastic differential cross sections for H2O + He at two different collision energies was carried out by Brudermann et al. using time-of-flight analysis of the scattered He atoms. They also compared the measured rotationally inelastic cross sections with quantum calculations.6 However those measurements obtained by angle-dependent energy-loss spectra did not allow state selectivity.Rotationally resolved state-to-state integral cross sections for collisions of ortho and para-H2O with Ar were also investigated by the Nesbitt group.7 In their work, the measured integral cross sections was found to display an exponential-decay dependence with the magnitude of the rotational energy transfer, approximately following an energy gap law. They also observed a clear propensity for rotational excitation of H2O around the a and c principal axes. Glory structures in the total cross sections for H2O–rare gas collisional systems were then identified by Cappelletti and coworkers.8,9
Recently, the rotationally inelastic collision process for H2O + He at 429 cm−1 collision energy was studied through the velocity map imaging technique in combination with resonant enhanced multiphoton ionization detection by Yang and coworkers.10,11 The state-to-state DCSs were extracted experimentally for the first time from the measured images and found to be in good agreement with full close-coupling quantum calculations based on an ab initio potential. New measurements were subsequently performed for this system using the same imaging techniques12 at collision energies ranging from 381 to 763 cm−1 by step of approximately 100 cm−1. In addition to He as a collision partner, an imaging study of H2O in collision with H2 was also conducted by Yang et al.13 The H2O–H2 and H2O–He DCSs were found to differ strongly for both normal-H2 and para-H2 beams. Forward scattering was found to be favoured for all rotational states of H2, indicating that the H2O–H2 potential well is deeper. The standard procedure of estimating rates for para-H2 collisions using those obtained for He in astrochemistry should then be applied with caution.
Here we compare rotational state-to-state resolved DCS for the collisions of H2O in the rovibrational ground-state with Ne, Ar and Xe at respectively 364, 390 and 351 cm−1. The same four 000 → 111, 101 → 212, 101 → 110 and 101 → 221 rotational excitation transitions are studied for the three systems using a combined experimental and theoretical approach. The selection of these three chemically similar collision partners of water aims to investigate the impact of an increase in the relative mass and the potential well depth of the potential energy surface (PES). The experimental setup employed is a crossed-beam apparatus, complemented with velocity-map imaging detection. Single final rotational states of ortho and para-H2O molecules before and after collisions are detected by a 2 + 1 resonance enhanced multi-photon ionization (REMPI) process and the state-to-state DCSs measured using the velocity-map imaging (VMI) method.
Two recently developed and tested PESs are used to perform the close-coupling calculations for the Ne + H2O14 and Ar + H2O15 scatterings while a new PES is developed in this work for the Xe + H2O scattering. The last PES is tested by calculating the bound states of the Xe + H2O system as well as its transition frequencies, which are compared with experiments and with previous calculations.
The manuscript is organised in two main sections dedicated to the presentation of the methods and the results. Each of the aforementioned principal sections is subdivided into two sections, one pertaining to the experiment and the other to the theory. A concluding section is also eventually included, in which a few final remarks are presented.
2 Methods
2.1 Experimental methods
The water molecule–rare gas atom rotationally inelastic collision experiments were carried out on a home-built crossed beam VMI apparatus (see Fig. 1). Full details of the apparatus10,12,13,16 and the nascent water laser ionization detection method11 have been described respectively in the previous publications, thus only a brief description is given in this section. In short, the experiments employed two differentially pumped molecular beams in two separated source chambers, a VMI setup inside a collision chamber and a laser beam for ionization detection. | ||
| Fig. 1 Schematic diagram of the crossed-beam VMI apparatus. Pulsed molecular beams of 2.5% H2O/Ar and neat rare gas (Ne, Ar, Xe) are skimmed and crossed at 90°. The collision-induced rotationally excited H2O is state-selectively ionized via (2 + 1) REMPI by laser radiation in the 248 nm region produced by a pulsed tunable dye laser beam doubled in a KDP crystal. The mass-selected H2O+ ions are velocity-mapped by a VMI setup and projected onto a two-dimensional detector, then recorded by a CCD camera. | ||
The primary beam was achieved by flowing pure Ar gas (∼1 bar) into a H2O bubbler (demineralized water at room temperature) and then through a commercial hairpin-type pulsed valve (Jordan Inc.), resulting in a H2O molecular beam with a concentration of H2O being ∼2.5%. Due to adiabatic expansion, the H2O beam was rotationally cooled to ∼12 K, where more than 97% of para-H2O and 90% of ortho-H2O are populated in the lowest 000 and 101 rotational levels in the ground vibrational state, respectively. The secondary beam (Ne, Ar, Xe) was produced at ∼1 bar stagnation pressure by a second Jordan valve located in the other source chamber. Both pulsed valves had a nozzle diameter of 0.5 mm and were operated at 10 Hz, generating pulses with a duration of around 100 μs. The primary and secondary beam were collimated respectively by a skimmer of 2.5 mm diameter positioned 30 mm downstream from its corresponding valve nozzle, and crossed each other with a collision angle of 90° at the reaction center of the VMI stack, which was 90 mm downstream from both valves. The VMI setup was positioned in the center of the collision chamber with the ion optics and time-of-flight tube perpendicular to the collision plane defined by the two molecular beams. The mean collision energies in the center of mass frame of the Ne + H2O, Ar + H2O and Xe + H2O collision system, 364, 390 and 351 cm−1, were determined from the velocity mapped beam spot positions of two beams (for the secondary beam velocity determination a trace amount of H2O was seeded in the pure rare gas (Rg) beam) and again confirmed by the variation in radius of the scattering image as a function of the rotationally excited H2O internal energy after collision.
After collision, the rotationally excited nascent H2O molecules were state selectively ionized by (2 + 1) resonance enhanced multiphoton ionization (REMPI) using laser radiation ∼248 nm, that was generated by a tunable dye laser system (Lambda Physik Scanmate) pumped by the third harmonic of a pulsed Nd:YAG laser (Contiuum Powerlite 9010). Both molecular beams and the detection laser beam were coplanar. The laser beam with a typical power of 2–3 mJ per pulse was focused by a 20 cm focal lens to the center of the collision region. H2O+ ions were velocity mapped by the VMI setup and then projected onto a position sensitive imaging detector consisting of dual MCP and a phosphor screen, with mass selectivity obtained by applying a pulse voltage on the MCP at the appropriate moment. The velocity mapped ion images appearing on the phosphor screen were subsequently recorded by a CCD camera. Typically, 20![[thin space (1/6-em)]](https://www.rsc.org/images/entities/char_2009.gif) 000 laser shots were averaged for each image, under interleaved conditions with and without the Rg beam in temporal overlap with the H2O beam; the second condition achieved through delaying the Rg beam by 1 ms with respect to the H2O beam was used for background subtraction.
000 laser shots were averaged for each image, under interleaved conditions with and without the Rg beam in temporal overlap with the H2O beam; the second condition achieved through delaying the Rg beam by 1 ms with respect to the H2O beam was used for background subtraction.
The state-to-state DCSs were extracted from the density-to-flux corrected velocity mapped images of nascent H2O+ that were experimentally measured. A detailed description of image corrections and the extraction of DCSs has been presented in previous publications.10,12,13,16–19 During our experiments, we have checked the influence in the images of the direction of the linear polarization electric field vector of the detection laser. We did not find observably difference in the images. We therefore ignore collision-induced alignment effects in our H2O scattering image analysis procedure.
2.2 Theoretical methods
The ab initio calculations were performed using MOLPRO 201520 at the explicitly correlated coupled-cluster level of theory, including single, double, and perturbative triple excitations (CCSD(T)-F12). For the hydrogen and oxygen atoms, the aug-cc-pVQZ basis set was employed, whereas for the xenon atom, the pseudopotential aug-cc-pVQZ-PP basis set was utilised. A set of bond functions, comprising 3s, 3p, 2d, 2f and 1g orbitals,21 was located at the midpoint of the internuclear distance, R, to complement the polar-diffuse basis set.
The H2O molecule is assumed to be rigid and the relative position of the xenon is defined by the spherical coordinates R, θ, φ with the origin fixed at the H2O center of mass. The grid includes 28 radial points in the [2.8, 30.0] Å interval, 13 values of θ in the [0°, 180°] interval in steps of 15°, as well as 7 values of φ between 0° and 90° in steps of 15° giving a total of 2548 ab initio points. The OH distance and the bending angle were fixed to their vibrationally averaged values, rOH = 0.9753 Å and γHOH = 104.41°.22 Following the same methodology used in some of our previous works,15 the grid of ab initio energies was divided into two parts, the short range (SR) for R < 10 Å and the long range (LR) for R ≥ 10 Å. The SR and LR grids were expanded in the Green angular basis set:23
 | (1) |
 | (2) |
 | (3) |
 | (4) |
![[k with combining macron]](https://www.rsc.org/images/entities/i_char_006b_0304.gif) is the absolute value of k, p is a symmetrization factor32 such that p = 0 for = 0 and p = 0, 1 for > 0,
is the absolute value of k, p is a symmetrization factor32 such that p = 0 for = 0 and p = 0, 1 for > 0,  is a normalization factor while k and m are the projection of the H2O rotational angular momentum
 ![[j with combining right harpoon above (vector)]](https://www.rsc.org/images/entities/i_char_006a_20d1.gif) respectively along the molecule-fixed z-axis and the SF z-axis. The τ index labels the 2j + 1 asymmetric top levels inside a given j multiplet. We indifferently use the alternative notation jkakc where ka and kc refer to the projection over the a and c molecular axes and τ = ka − kc. The expansion coefficients ajτ, as well as the eigenenergies (εj,τ) are as usual obtained from the diagonalization of the rigid-rotor asymmetric top Hamiltonian:
respectively along the molecule-fixed z-axis and the SF z-axis. The τ index labels the 2j + 1 asymmetric top levels inside a given j multiplet. We indifferently use the alternative notation jkakc where ka and kc refer to the projection over the a and c molecular axes and τ = ka − kc. The expansion coefficients ajτ, as well as the eigenenergies (εj,τ) are as usual obtained from the diagonalization of the rigid-rotor asymmetric top Hamiltonian:| Hrot = Axjx2 + Ayjy2 + Azjz2, | (5) |
The angular wavefunction describing the relative movement of the impinging atom in the SF frame is a spherical harmonic  where
where ![[R with combining circumflex]](https://www.rsc.org/images/entities/i_char_0052_0302.gif) = (φ,θ) while l, ml are respectively the quantum numbers associated with the relative angular momentum
= (φ,θ) while l, ml are respectively the quantum numbers associated with the relative angular momentum ![[l with combining right harpoon above (vector)]](https://www.rsc.org/images/entities/i_char_006c_20d1.gif) and its projection along the SF z-axis. The quantum numbers associated with the total angular momentum (
and its projection along the SF z-axis. The quantum numbers associated with the total angular momentum (![[J with combining right harpoon above (vector)]](https://www.rsc.org/images/entities/i_char_004a_20d1.gif) = + ) and its projection along the SF z-axis are denoted J and M. The angular basis set of the collisional system is obtained by coupling the
= + ) and its projection along the SF z-axis are denoted J and M. The angular basis set of the collisional system is obtained by coupling the  and |jτm, p〉 functions using the Wigner Eckart theorem:
 | (6) |
The DCS for the inelastic collision between the Rg and H2O are calculated using the formula:
 | (7) |
 . The scattering amplitude f(j′m′τ′ ← jmτ|), for the case of an atom colliding with a rigid asymmetric molecule, is defined as:
 | (8) |
 is the transition matrix obtained from the close-coupling calculations and M = m, ml′ = m − m′ due to the properties of the 3 − j symbols.
For the three systems investigated, the H2O rotational basis set used to perform the close-coupling calculations included ten values of j, namely 0 ≤ j ≤ 9. The calculations were furthermore performed separately for the para and ortho forms, using the log-derivative propagator34,35 with R ∈ [3,20]a0 interval for Ne, R ∈ [3,40]a0 interval for Ar and R ∈ [5.5,50]a0 interval for Xe, with a step size of 0.1a0. The convergence was checked as a function of the step size and of the maximum propagation distance. The relative convergence of the total inelastic cross section as a function of J was taken to be better than 10−6, leading to maximum values 108, 146, and 161 of J for the collisions with Ne, Ar and Xe, respectively. While these maximum values of J satisfy to the high relative convergence criterion imposed to the total inelastic cross sections, particular state-to-state transitions may require a lower number of partial waves to be converged at the same relative criterion. The values of partial waves needed to achieve the 10−6 relative convergence criteria, for the four transitions of interest and for each of the three systems are reported in Table 1.
| Transitions | Jmax | ||
|---|---|---|---|
| Ne–H2O | Ar–H2O | Xe–H2O | |
| 000 → 111 | 91 | 114 | 130 |
| 101 → 110 | 107 | 145 | 160 |
| 101 → 212 | 82 | 103 | 112 |
| 101 → 221 | 57 | 71 | 83 |
2.3 Bound states calculation of the Xe–H2O system
The bound states were calculated using the same variational approach that we have previously utilized and detailed in recent works.14,15,26,36 Briefly, the wave function of the system is expanded in the angular basis set used for the scattering calculations (eqn (6)) in order to obtain the radial equations. The latter are then solved variationally by utilizing a 200-points Chebyshev Discrete Variable Representation (DVR) in the [5.5,50]a0 interval. The bound states are labeled using the notation nK(jkakc)e/f where n is the van der Waals stretch mode and K is the projection of on the body-fixed z-axis. K takes the integer values 0, 1, 2,… denoted by the Greek letters Σ, Π, Δ, …. The notation jkakc refers to the rotational states of the H2O molecule and the spectroscopic parity is represented by the symbols e/f.
3 Results
3.1 Xe–H2O PES
The root mean square deviation (RMSD) is used to check the quality of the fit. We divided our ab initio grid into three subsets associated respectively with negative energies, positive energies below 1000 cm−1 and positive energies in the [1000, 10000] cm−1 interval. The RMSD values in these three intervals are respectively 4.32 × 10⁻³ cm−1, 1.55 × 10⁻² cm−1 and 0.13 cm−1 demonstrating the good accuracy of the fit.
Contour plots of the PES in Cartesian coordinates (x, z) for φ = 0° and (y, z) for φ = 90° are presented in the right and left panels of Fig. 2 respectively. The global minimum and the three saddle points are identified by red points and crosses, respectively. The geometries and energies of these three critical points are compared with those reported in previous studies in Table 2. The geometries are seen to be in very good agreement, while our well depth is larger as our ab initio calculations include more correlation contributions.
 | ||
| Fig. 2 Contour plots for the H2O–Xe PES. The right panel shows the x−z contour plot for φ = 0° (y = 0 plane) while the left panel shows the y−z contour plot for φ = 90° (x = 0 plane). | ||
| This work | Ref. 37 | Ref. 38 | |
|---|---|---|---|
| Global minimum | |||
| R | 4.02 | 4.00 | 4.00 |
| θ | 119.50° | 120.00° | 120.00° |
| φ | 0.00° | 0.00° | 0.00° |
| V | −195.44 | −192.50 | −191.70 |
| First-order saddle point 1 | |||
| R | 3.98 | 3.95 | 3.95 |
| θ | 180.00° | 180.00° | 180.00° |
| φ | 0.00° | 0.00° | 0.00° |
| V | −169.34 | −169.20 | −169.10 |
| First-order saddle point 2 | |||
| R | 3.83 | 3.85 | 3.85 |
| θ | 0.00° | 0.00° | 0.00° |
| φ | 0.00° | 0.00° | 0.00° |
| V | −168.25 | −161.3 | −161.5 |
| Second-order saddle point 2 | |||
| R | 3.96 | 3.95 | 4.00 |
| θ | 99.50° | 95.00° | 100.00° |
| φ | 90.00° | 90.00° | 90.00° |
| V | −134.06 | −130.30 | −130.10 |
3.2 Xe–H2O bound states
The bound states of the system were calculated for the two spin modifications (ortho/para) of the water molecule and for six values of its rotational angular momentum (0 ≤ j ≤ 5). In order to check the accuracy of our new Xe–H2O PES, we compare in Table 3 the bound states energies with those reported in Table 2 of ref. 37. As the number of bound states is quite numerous, we limit the comparison to the first and final bound states of each of the four symmetry blocks (combination of ortho/para and parity inversion e/f). We give both our calculated values as well as the differences with the results of ref. 37. As can be seen in Table 3, our energies are systematically deeper than those calculated by Wang and Yang37 by about 3 cm−1 (between ∼2.8 cm−1 to ∼3.9 cm−1) as a result of the deeper well depth of our PES by about 3 cm−1. A comparison of the transitions frequencies calculated by us and those reported in ref. 37 with the experimental values available in ref. 38 is also presented in Table 4 inside the Σ(000)e and Σ(101)e symmetry blocks for the most abundant isotope (132Xe–H2 16O). Our results are in excellent agreement with those of previous theoretical and experimental studies.37,38 The present frequencies are in slightly better agreement with experiment than those calculated by Wang and Yang37 as the largest relative error is 1.4%, for the Σ(101)e J′–J′′ = 4-3 transition while it is 1.9% for the all the Σ(000)e transitions reported in ref. 37.| Assignment | J = 0 | TW–WY | J = 1 | TW–WY | J = 2 | TW–WY | J = 3 | TW–WY | J = 4 | TW–WY |
|---|---|---|---|---|---|---|---|---|---|---|
| Xe–pH2O | ||||||||||
| Σ(000)e | −143.361 | −3.424 | −143.226 | −3.423 | −142.957 | −3.421 | −142.553 | −3.419 | −142.014 | −3.415 |
| Δ(202)e | −49.879 | −3.936 | −49.506 | −3.938 | −49.009 | −3.942 | ||||
| Π(111)f | −105.893 | −3.493 | −105.625 | −3.493 | −105.221 | −3.491 | −104.682 | −3.487 | ||
| Δ(202)f | −18.680 | −3.340 | −18.305 | −3.382 | −17.804 | −3.419 | ||||
| Xe–oH2O | ||||||||||
| Σ(101)e | −126.895 | −3.559 | −126.763 | −3.558 | −126.499 | −3.557 | −126.103 | −3.555 | −125.575 | −3.552 |
| 3Σ(101)e | −40.787 | −3.188 | −41.043 | −3.443 | −40.812 | −3.429 | −40.466 | −3.412 | −40.005 | −3.393 |
| Π(101)f | −115.059 | −3.019 | −114.791 | −3.015 | −114.389 | −3.010 | −113.854 | −3.003 | ||
| 2Σ(110)f | −27.310 | −2.81 | −27.191 | −2.808 | −26.954 | −2.806 | −26.599 | −2.802 | −26.126 | −2.798 |
| Level | J′–J′′ | Expt | TW | WY | Diff. (%) TW | Diff. (%) WY |
|---|---|---|---|---|---|---|
| Σ(000)e | 1-0 | 0.1365 | 0.1348 | 0.1339 | 1.3 | 1.9 |
| 2-1 | 0.2729 | 0.2695 | 0.2677 | 1.2 | 1.9 | |
| 3-2 | 0.4093 | 0.4042 | 0.4015 | 1.2 | 1.9 | |
| 4-3 | 0.5456 | 0.5388 | 0.5352 | 1.2 | 1.9 | |
| Σ(101)e | 1-0 | 0.1338 | 0.1320 | 0.1314 | 1.3 | 1.8 |
| 2-1 | 0.2676 | 0.2640 | 0.2627 | 1.3 | 1.8 | |
| 3-2 | 0.4013 | 0.3959 | 0.3940 | 1.3 | 1.8 | |
| 4-3 | 0.5351 | 0.5278 | 0.5253 | 1.4 | 1.8 | |
3.3 Integral cross sections
Before commenting on the scattering results it is interesting to recall the physical interpretation introduced by Chapman et al.7 to classify the asymmetric top states of the water molecule. For a given value of j, the three cases ka = j, ka = kc, and kc = j correspond respectively to a rotation around the a, b, and c axes. The motion around the c axis refers to a rotation in the molecular plane while the b axis is the C2 symmetry axis, and the a axis is perpendicular to b and c axis and parallel to the H–H axis. The 000 → 111 transition is the only one among those measured experimentally for which the water molecule rotates around its C2 symmetry axis in both its initial and final states but with Δj = 1. In the 101 → 212 case the water molecule rotates in its molecular plane in both its initial and final states again with Δj = 1. Conversely, the water molecule rotation axis is not conserved during the collision for both the 101 → 110 and 101 → 221 transitions. The rotation initially occurs in the molecular plane around the c axis while in the final state it takes place outside of this plane around the a axis. Furthermore, the former is elastic in j while the latter is inelastic with Δj = 1.We represent in Fig. 3 the state-selected integral cross sections (ICS) calculated for the four rotational excitation transitions studied in the present work and at the experimental collision energies. This figure gives two valuable informations. First, if we compare the ICS of the ortho transitions we see that they decrease monotonically when the energy of the final state increases for the three systems as expected. Conversely, the rotational excitation cross section from the fundamental to the lowest excited para level is seen to be larger than its ortho counterpart. This is rather counter intuitive as the para transition is inelastic in j (Δj = j′ − j = 1) while the ortho one is elastic (Δj = 0). Furthermore, the difference of energy between the 000 and 111 para states is larger than the one between the 101 and 110 ortho states. The physical picture of this result given by the discussion of Chapman et al.7 is quite appealing. As a matter of fact, the para transition preserves the water axis of rotation (C2 axis) while the ortho transition does not, therefore suggesting that transitions which preserve the water axis of rotation are favored at this collision energy. This 'propensity rule' also explains why the 101 → 212 cross sections are greater than those of the 101 → 221 transition. Furthermore these two transitions which are inelastic in j give cross sections which are lower than those associated with the 101 → 110 transition which is elastic in j.
 | ||
| Fig. 3 Theoretical integral cross sections (ICS) for the three systems and the four transitions studied. Blue bars represent the ICS for the Ne + H2O collision, red bars for Ar + H2O and green bars the Xe + H2O ones. | ||
We also clearly see, in Fig. 3, that the cross sections increase monotonically when moving from Ne to Ar and from Ar to Xe. In the Ne–Ar–Xe series, the mass, the size, and the polarizability of the atom increase. The dominant long-range electronic interactions between the Rg and H2O are the dipole–induced dipole and the dispersion, both dependent on the Rg polarizability. The short-range repulsive interaction potential is dependent on the size of the Rg atom. As a consequence, both the potential well depth and the equilibrium bond length increase as shown by Table 5. To elucidate the trend observed in the cross sections, a classical interpretation of the phenomena is explored. It is anticipated that a deeper potential well, a more attractive long-range potential and a short-range repulsive wall located at larger inter-monomer distance are all expected to increase the maximal impact parameter, and then the cross section. However the collision energies are quite larger than the depth of the potential wells (see Table 5) which is expected to reduce the effect of the attractive part of the potentials. The effect of the repulsive short-range potential is expected to play a role only for small values of the impact parameter and then to yield a small contribution to the cross section. The mass is also expected to play a role in the increase of the cross section, as shown by the classical dynamics equation
| Lmax = μvbmax, | (9) |
| Rg | De | Re | Ec | Ratio Ec/De |
|---|---|---|---|---|
| Ne | 65.3 | 3.20 | 364 | 5.6 |
| Ar | 139.4 | 3.67 | 390 | 2.8 |
| Xe | 195.4 | 4.02 | 351 | 1.8 |
| Rg | Transition | σ1 | σ2 | Jmax for σ2 | Rel. error |
|---|---|---|---|---|---|
| Ar | 000 → 111 | 73.6 | 73.6 | 107 | 1.4(−5) |
| 101 → 212 | 43.0 | 43.0 | 126 | 4.1(−5) | |
| 101 → 110 | 44.2 | 44.2 | 97 | 1.3(−5) | |
| 101 → 221 | 11.0 | 11.0 | 67 | 1.9(−5) | |
| Xe | 000 → 111 | 92.6 | 92.6 | 114 | 8.3(−5) |
| 101 → 212 | 70.7 | 70.7 | 135 | 1.4(−4) | |
| 101 → 110 | 58.7 | 58.7 | 103 | 2.7(−5) | |
| 101 → 221 | 30.9 | 30.7 | 71 | 8.6(−3) | |
The classical interpretation of the results can yield further valuable insights. Indeed, by examining the values of the total angular momentum which provide the maximum contribution to the ICS we can extract the impact parameter for which the contribution to the ICS is maximal. Those values of J associated with the transitions (000 → 111,101 → 110,101 → 212,101 → 221) correspond respectively to (33,32,33,20) in the case of Ne, (47,72,49,31) for Ar, and (67,88,70,48) for Xe. By applying the classical formula eqn (9), the b values leading to the maximum contribution to the ICS are estimated to be (1.7,1.6,1.7,0.8) Å for Ne–H2O, (2.2,3.7,2.4,1.3) Å for Ar–H2O, and (3.2,4.4,3.4,2.1) Å for Xe–H2O. This suggest that at the kinetical energy of interest, for almost all the transition studied, the repulsive part of the PES contribute most to the ICS. For the transition 101 → 110 in Ar–H2O and Xe–H2O, even when the b values that give the maximum contribution to the ICSs correspond to the region of the potential well, a secondary maximum structure of the ICS as a function of the J was found for smaller values of J, for which the b values also correspond to the repulsive part of the PESs, reflecting the prominent role of the short range interactions in the dynamic of the systems at the energies of interest.
New theoretical ICSs calculations, performed for the same collision energies but for transitions from the fundamental para (000) and ortho (101) levels of H2O to some selected final states, not studied experimentally, are presented in Fig. 4. The final states were chosen to compare the three principal alignment cases discussed by Chapman et al.7 In their work, the authors observed strong alignment effects of the products when studying the excitation of H2O by collision with Ar at a collision energy of 480 cm−1. For Both of the two ortho/para spin symmetries, they noticed that, for a given final j value, the largest ICSs are obtained for the Δj = Δka or Δj = Δkc transitions while those associated with Δka = Δkc give significantly smaller ICSs. As can be seen in Fig. 4, the transitions calculated for these three different systems follow the same propensity rules as the Δka = Δkc ICS are seen to be one order of magnitude smaller than those of the two other cases. It can therefore be conclude that the propensity rule discussed by Chapman et al.7 for the excitation of H2O by Ar is also valid for other H2O + Rg systems.
 | ||
| Fig. 4 Theoretical integral cross sections (ICS) for the excitation of the fundamental para level (left plot) and ortho level of H2O by collision with rare gases. Blue bars represent the ICS for the Ne + H2O collision, red bars for Ar + H2O and green bars the Xe + H2O ones. The selected final states correspond to three different alignment cases: Δj = Δka (rotation along the a molecular axis), Δka = Δkc (Rotation along the b molecular axis) and Δj = Δkc (Rotation along the c molecular axis). | ||
3.4 Differential cross sections
In the present work, we report rotationally resolved state-to-state differential cross sections of H2O colliding with rare gas atoms in the centre-of-mass frame which have been acquired for the first time. A series of background-subtracted raw velocity mapped H2O+ images measured for the H2O + Ne, H2O + Ar, H2O + Xe systems at the respective collision energy of 364, 390 and 351 cm−1 is presented in Fig. 5, along with the corresponding Newton diagrams. With respect to the relevant velocity vectors indicated by the red dashed lines in the diagrams, the directions of the scattered products can be described as forward, sideway and backward scattering in the center-of-mass frame. In these false-color images, it is apparent that the intensity is higher in the forward and sideway scattering direction in most cases. Meanwhile all the images clearly display asymmetric angular distributions with respective to their relative velocity axes, shown as the red dashed arrows superimposed on the raw images in the figure, due to the measurement of laboratory product density instead of flux. Using the IMSIM19 simulation program, “apparatus function” was first simulated with the input of an assumed isotropic DCS together with all the experimental parameters, such as geometry and spatial conditions of incident molecular beams and laser beam, temporal and velocity distribution of molecular beams and so on. Then the state-to-state differential cross sections were obtained using the experimental angular distributions of the background-subtracted raw images divided by the corresponding apparatus function and finally normalized for comparison with calculations. | ||
| Fig. 5 Background subtracted images of inelastically scattered H2O in the indicated rotational transitions for collisions of H2O with Xe (top row), Ar (middle row) and Ne (bottom row). The corresponding Newton diagrams for the three colliding systems are shown on the left side of this figure. vH2O represents the velocity of H2O in the primary molecular beam (black arrow in horizontal direction); vXe, vAr and vNe represents the velocity of the Xenon, Argon and Neon in the secondary beam (black arrow in vertical direction), respectively. The black dashed arrows indicate the center of mass velocity vCM and the red dashed arrows indicate the relative velocity vrel for three colliding systems. Same red dashed arrows are superimposed on the corresponding H2O images for better visualization. The blue circles indicate the size (not scaled exactly) of the Newton sphere for inelastic scattering and the directions described as forward, sideway and backward scattering in the center-of-mass frame (0°, 90°, and 180° in the DCS plotted in the Figure). | ||
Theoretically, the DCSs were calculated for the collisions of H2O with Ne, Ar and Xe for the transitions that were experimentally measured. The collision energies were respectively 364 cm−1, 390 cm−1, and 351 cm−1. Given the numerous oscillations inherent to the theoretical DCS, we also computed convoluted DCS with experimental angular spread. We use a Gaussian function

For the collision with Ne three of the four transitions DCS presented in Fig. 6 are predicted, by the theoretical calculation, to be strongly forward, while the 101 → 221 transition is the only one with an important backward contribution. At small deflection angles, the agreement between theory and experiment is not good, due most probably to the subtraction procedure of the background signal from the unscattered beam. For the rest of the angular interval, the agreement becomes quite satisfactory. The theoretical calculations are in excellent agreement with the experimental observations of the monotonic increase of the 101 → 221 DCS above 20°.
 | ||
| Fig. 6 State-to-state differential cross sections (DCS) for four different rotational transitions of the water molecule induced by the collision with the Ne atom. The 000 → 111, 101 → 110, 101 → 212, and 101 → 221 transitions are presented in top-left, top-right, bottom-left, and bottom-right panels respectively. Black lines correspond to the theoretical results, yellow lines to the experimental results, and blue lines are the convoluted theoretical results using a Gaussian function. | ||
The DCSs for the collision with Ar are presented in Fig. 7. The general agreement between theory and experiment is also good for this system. The theoretical results reproduce the main shapes observed in the experiments, with the 101 → 110 being almost perfectly described, even better if we compare the convoluted cross sections. Again, appreciable discrepancies between theory and experiment are for the same reasons observed only for small deflection angles, with the exception of the 101 → 221 transition, for which the theoretical backscattering is overestimated for angles larger than 120°. This constitutes one of two noteworthy distinctions in behaviour between the Ne + H2O and Ar + H2O DCS. The first one is the bump around 35° which can be observed in the Ar + H2O DCS and is correctly predicted by the calculations, while the second is the decrease of the backscattering in the Ar + H2O DCS for the larger angles, which is not reproduced by the calculations.
 | ||
| Fig. 7 Same as Fig. 6 but for the H2O + Ar collision. | ||
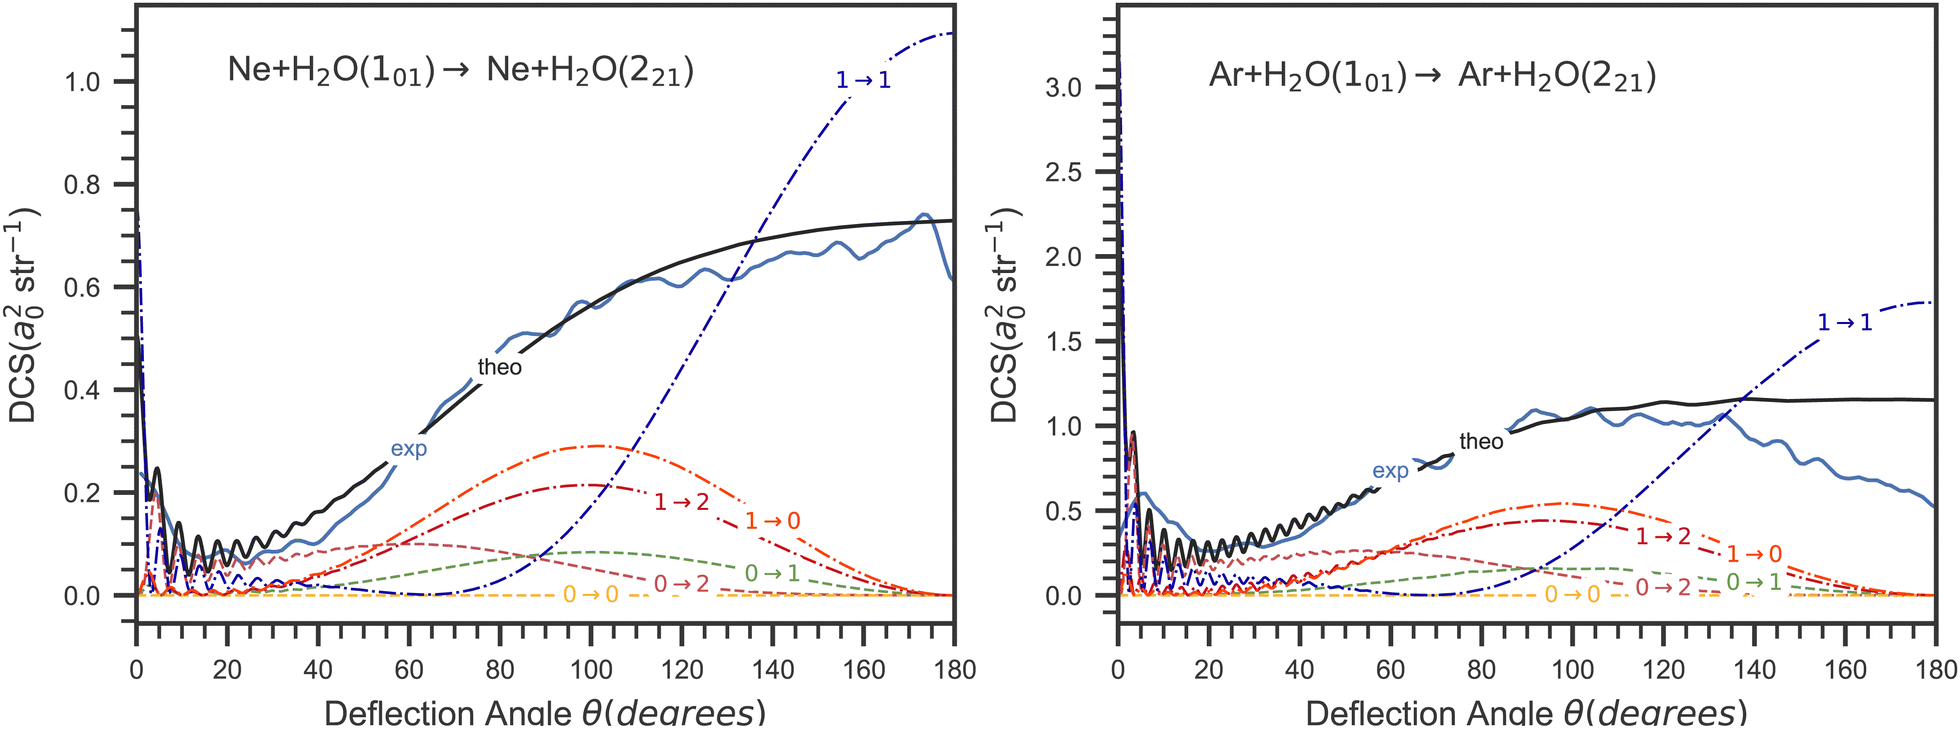
In order to further analyse this difference between these two systems, we report in Fig. 9 the contributions to the DCS associated with all the possible initial (m) and final (m′) values of the SF z-axis projection of the water angular momentum (see eqn (7)). As can be seen in this figure, the main contribution to backward scattering is for both systems due to the m = 1 → m′ = 1 component for this transition. In other words, the largest backward contribution to the DCS is due to collisions conserving the water SF jz quantum number. This also means that  (see eqn (8)) and that the SF z-axis is along the final intermolecular axis which is also the final relative velocity vector and the final body-fixed z-axis. In other words, the SF z-axis which is defined by the direction of the initial incoming relative velocity is in coincidence with the final body-fixed z-axis and is conserved during the collision. This suggest that the angular potential expansion coefficients υl,m=0(R) (Fig. 8) are giving the largest contributions to this particular state to state DCS in the backward angular range. We can conclude that the υl,m=0(R) components of the potential leading to backward scattering for the 101 → 221 transition in the Ar + H2O collision are probably not accurate enough.
 | ||
| Fig. 8 Partial wave expansion coefficients of the PES (υl,m) as a function of R for Ne + H2O (left panel), Ar + H2O (middle panel) and Xe + H2O (right panel). The partial wave numbers are indicated in each curve, and only the four first partial waves are presented. | ||
 | ||
| Fig. 9 Comparison of the mi → mf state selected contributions to the 101 → 221 DCS transition of water by collision with Ne (left panel) and Ar (right panel). The initial mi and final mf values of the z SF projection of the water rotational angular momentum are reported on each curve (Dashed lines) associated with a partial mi → mf contribution. The experimental and summed theoretical DCS are also represented using solid black and red lines, respectively. | ||
The theoretical and experimental results for Xe, presented in Fig. 10, demonstrate excellent qualitative and quantitative alignment. The three peaks observed observed in the 101 → 110 DCS experiment are qualitatively reproduced by the theoretical calculations. A minor discrepancy is observed between the theoretical and experimental third peaks, with the former being shifted to the right. The number of oscillations of the DCS is the highest observed among the three systems. The increase in the number of oscillations is associated with the increase of the system's reduced mass, which requires higher values of J for the DCS to converge. Furthermore, the collision energies are quite larger than the dissociation energies, thus reducing contributions of the potential well region to the dynamics. It is rather the short range region of the PES that is in control of the dynamics at these energies.
 | ||
| Fig. 10 Same as Fig. 6 but for the H2O + Xe collision. | ||
All the calculated DCSs reported in this work show fast oscillations for small angles of diffusion. We can interpret these oscillations with a simple picture. The hard sphere model predicts narrow Fraunhofer forward diffraction peaks of the DCS resulting from interference between the incident wave and the outgoing scattered wave. An equivalent quantum interpretation of these rapid oscillations suggests that they are the result of interference between the numerous partial waves that contribute to the inelastic DCSs. The calculated Δθ spacing between the diffraction oscillations is roughly estimated to be 4.2°, 2.8° and 2.4° respectively for the collisions of H2O with Ne, Ar and Xe. Using the hard sphere scattering formula  where
where  and R0 is the size of the collision complex at closest approach, we obtain for these three systems respectively R0 = 2.98, 3.79 and 4.13 Å which is in qualitative agreement with the equilibrium separations of H2O and the rare gas.
Super imposed on this fast oscillations the DCSs exhibit broad rotational rainbow maximum which are most visible in the 101 → 110 DCS for Ar + H2O in Fig. 7 and Xe + H2O in Fig. 10. The semi-classical picture of rainbow scattering is that they stem from interferences of trajectories with different impact parameters leading to the same deflection angle and rotational angular momentum transfer Δj = j′ − j.
Conclusions
We presented a combined experimental and theoretical study of the DCSs for the inelastic collisions of water with three rare gases atoms: Ne, Ar and Xe. The experimental study was carried out in a crossed molecular beam and VMI setup with state-selective laser ionization detection. Water molecules are cooled by adiabatic expansion before collision, and each of the two species, ortho and para-H2O, are mostly in their respective ground states, namely 000 and 101. VMI detection of the water molecules by means of (2 + 1) REMPI allowed to measure the rotationally excited states of H2O products as a function of the scattering angle, resulting in the state-to-state DCS measured experimentally.On the theoretical side, a new PES was built for the Xe + H2O system and the bound states of this system calculated. The calculated transition frequencies of the Xe + H2O complex using this PES are in excellent agreement with experimental data and show slight improvement over previous calculations. We use for the two remaining systems (Ne + H2O and Ar + H2O) two PESs that we recently developed and tested.
The calculated ICS increases with the mass of the rare gas atom. This is due to the increase of the rare gas polarizability along with the increase of both the dissociation energy and the reduced mass of the Rg + H2O complex. A strong alignment effect is observed for the ICS. The results for the three Rg cases are consistent with the propensity rule observed by Chapman-19997 for H2O + Ar collisions at 480 cm−1. This finding indicates that this propensity rule may be a general principle that governs the rotational excitation of H2O by collisions with rare gases at relatively high collision energies.
The calculated and measured DCSs for the three systems are in good agreement, except for small deflection angles of most DCSs and for the backward scattering in the transition 101 → 221 of the collision with Ar. The former is likely attributable to the subtraction procedure of the background signal from the unscattered beam while the latter might be due to inaccuracies in the repulsive part of the PES.
The narrow Fraunhofer forward diffraction peaks of the DCS are observed theoretically for the three systems. Furthermore, the sizes of the collision complexes at closest approach predicted by the hard sphere model are in qualitative agreement with the equilibrium separation between H2O and the rare gas as given by the PESs. Super imposed on this fast oscillations the DCSs exhibit broad rotational rainbow maxima which are most visible in the 101 → 110 DCS for Ar + H2O and Xe + H2O.
In the case of the Ar + H2O collisions, the theoretical 101 → 221 DCS backscattering is overestimated for angles larger than 120°. This may be due to inaccuracies of either the experimental measurement in this angular region or in the repulsive part of the PES developed for this system. In order to answer this question and to test other collision energy ranges, new measurements and calculations are required. This will enable the testing of other regions of the PESs.
Data availability
Data for this article, including data files and jupyter notebooks used to generate the plots are available at the https://figshare.com/ repository at https://doi.org/10.6084/m9.figshare.28078265.Conflicts of interest
There are no conflicts to declare.Acknowledgements
This work was supported by the French Agence Nationale de la Recherche (ANR-Waterstars), Contract No. ANR-20-CE31-0011, the National Natural Science Foundation of China (Grant No. 22103003) and the Anhui Provincial Natural Science Foundation (Grant No. 2208085Y02). We acknowledge the support from the ECOS-SUD-ANID project number C22E02 (Programa de Cooperación Científica ECOS-ANID ECOS220023). Computer time for this study was provided by the Mésocentre de Calcul Intensif Aquitaine, which is the computing facility of Université de Bordeaux et Université de Pau et des Pays de l'Adour.References
- C. Xiahou, J. N. L. Connor, D. De Fazio and D. Sokolovski, Phys. Chem. Chem. Phys., 2024, 26, 3647–3666 CAS.
- O. Tkáč, A. K. Saha, J. Loreau, D. H. Parker, A. van der Avoird and A. J. Orr-Ewing, J. Phys. Chem. A, 2015, 119, 5979–5987 Search PubMed.
- G. Sarma, A. K. Saha, C. K. Bishwakarma, R. Scheidsbach, C.-H. Yang, D. Parker, L. Wiesenfeld, U. Buck, L. Mavridis and S. Marinakis, Phys. Chem. Chem. Phys., 2017, 19, 4678–4687 CAS.
- R. W. Bickes, G. Duquette, C. J. V. D. Meijdenberg, A. M. Rulis, G. Scoles and K. M. Smith, J. Phys. B: At., Mol. Opt. Phys., 1975, 8, 3034–3043 CAS.
- J. T. Slankas, M. Keil and A. Kuppermann, J. Chem. Phys., 1979, 70, 1482–1491 CAS.
- J. Brudermann, C. Steinbach, U. Buck, K. Patkowski and R. Moszynski, J. Chem. Phys., 2002, 117, 11166–11174 CAS.
- W. B. Chapman, A. Kulcke, B. W. Blackmon and D. J. Nesbitt, J. Chem. Phys., 1999, 110, 8543–8554 CrossRef CAS.
- V. Aquilanti, E. Cornicchi, M. Moix Teixidor, N. Saendig, F. Pirani and D. Cappelletti, Angew. Chem., Int. Ed., 2005, 44, 2356–2360 CrossRef CAS PubMed.
- F. Pirani, L. F. Roncaratti, L. Belpassi, F. Tarantelli and D. Cappelletti, J. Chem. Phys., 2011, 135, 194301 CrossRef PubMed.
- C.-H. Yang, G. Sarma, J. J. ter Meulen, D. H. Parker, U. Buck and L. Wiesenfeld, J. Phys. Chem. A, 2010, 114, 9886–9892 CrossRef CAS PubMed.
- C.-H. Yang, J. J. ter Meulen, D. H. Parker and C. M. Western, Phys. Chem. Chem. Phys., 2010, 12, 13983–13991 RSC.
- G. Sarma, A. K. Saha, C. K. Bishwakarma, R. Scheidsbach, C.-H. Yang, D. H. Parker, L. Wiesenfeld, U. Buck, L. Mavridis and S. Marinakis, Phys. Chem. Chem. Phys., 2017, 19, 4678 RSC.
- C.-H. Yang, G. Sarma, D. H. Parker, J. J. ter Meulen and L. Wiesenfeld, J. Chem. Phys., 2011, 134, 204308 CrossRef PubMed.
- R. M. García-Vázquez, O. Denis-Alpizar and T. Stoecklin, J. Phys. Chem. A, 2023, 127, 4838–4847 CrossRef PubMed.
- R. M. García-Vázquez, L. D. Cabrera-González, O. Denis-Alpizar and T. Stoecklin, ChemPhysChem, 2024, 25, e202300752 CrossRef PubMed.
- C.-H. Yang, G. Sarma, J. J. ter Meulen, D. H. Parker, G. C. McBane, L. Wiesenfeld, A. Faure, Y. Scribano and N. Feautrier, J. Chem. Phys., 2010, 133, 131103 CrossRef PubMed.
- K. T. Lorenz, M. S. Westley and D. W. Chandler, Phys. Chem. Chem. Phys., 2000, 2, 481 RSC.
- Z.-F. Sun, C. K. Bishwakarma, L. Song, A. van der Avoird, M. C. van Hemert, A. G. Suits, G. C. McBane and D. H. Parker, Phys. Chem. Chem. Phys., 2019, 21, 9200–9211 RSC.
- G. C. McBane, Imsim: A program for simulating images from crossed-beam scattering experiments with laser photoionization and 2D velocity mapping detection, version 3.0, 2018, https://faculty.gvsu.edu/mcbaneg/ Search PubMed.
- H.-J. Werner, P. J. Knowles, G. Knizia, F. R. Manby and M. Schütz, Wiley Interdiscip. Rev.: Comput. Mol. Sci., 2012, 2, 242–253 CAS.
- S. M. Cybulski and R. Toczyłowski, J. Chem. Phys., 1999, 111, 10520 CrossRef CAS.
- L. Wiesenfeld, Y. Scribano and A. Faure, Phys. Chem. Chem. Phys., 2011, 13, 8230–8235 Search PubMed.
- S. Green, J. Chem. Phys., 1976, 64, 3463–3473 CAS.
- P. Soldán and J. M. Hutson, J. Chem. Phys., 2000, 112, 4415–4416 CrossRef.
- L. D. Cabrera-González, O. Denis-Alpizar, D. Páez-Hernández and T. Stoecklin, Mon. Not. R. Astron. Soc., 2022, 514, 4426–4432 CrossRef.
- T. Stoecklin, L. D. Cabrera-González, O. Denis-Alpizar and D. Páez-Hernández, J. Chem. Phys., 2021, 154, 144307 CrossRef CAS PubMed.
- D. Hou, Y.-T. Ma, X.-L. Zhang and H. Li, J. Chem. Phys., 2016, 144, 014301 CrossRef PubMed.
- L. Liu, D. Yang, H. Guo and D. Xie, J. Phys. Chem. A, 2023, 127, 195–202 CrossRef CAS PubMed.
- D. Hou, Y.-T. Ma, X.-L. Zhang and H. Li, J. Mol. Spectrosc., 2016, 330, 217–227 CrossRef CAS.
- T. Stoecklin, O. Denis-Alpizar, A. Clergerie, P. Halvick, A. Faure and Y. Scribano, J. Phys. Chem. A, 2019, 123, 5704–5712 CrossRef CAS PubMed.
- R. M. García-Vázquez, A. Bergeat, O. Denis-Alpizar, A. Faure, T. Stoecklin and S. B. Morales, Faraday Discuss., 2024, 251, 205–224 RSC.
- R. N. Zare, Angular Momentum, Wiley, New York, 1988 Search PubMed.
- M. W. Chase Jr., NIST-JANAF Thermochemical Tables, J. Phys. Chem. Ref. Data, Monograph 9, Washington, DC, 1998, 4th edn, pp. 1–1951 Search PubMed.
- D. E. Manolopoulos, PhD thesis, University of Cambridge, 1988.
- D. E. Manolopoulos, J. Chem. Phys., 1986, 85, 6425–6429 CrossRef CAS.
- R. M. García-Vázquez, L. D. Cabrera-González, O. D. Alpizar and T. Stoecklin, ChemPhysChem, 2024, 25, e202400353 CrossRef PubMed.
- L. Wang and M. Yang, J. Chem. Phys., 2008, 129, 174305 CrossRef PubMed.
- Q. Wen and W. Jäger, J. Phys. Chem. A, 2006, 110, 7560–7567 CrossRef CAS PubMed.
| This journal is © the Owner Societies 2025 |