Viscosity prediction of CO2-saturated imidazolium-based ionic liquids using the ε*-modified Sanchez–Lacombe equation of state and free volume theory with a new correction term†
Received
26th March 2025
, Accepted 17th May 2025
First published on 19th May 2025
Abstract
Ionic liquids (ILs) have gained attention as solvents for carbon dioxide (CO2) separation and as catalysts for CO2 fixation. Viscosity is a fundamental transport property of ILs because it plays a significant role in their process efficiency. In this study, a viscosity prediction model for CO2-saturated ILs was developed by combining the ε*-modified Sanchez–Lacombe equation of state (ε*-mod SL-EoS) and free volume theory (FVT) with a new correction term, βx′, where β and x′ are the correction factor and molar ratio of CO2 to IL, respectively. The viscosities were predicted by incorporating the mixture density, calculated using the ε*-mod SL-EoS, into the FVT, and the parameters for ε*-mod SL-EoS and FVT were calculated by correlating the high-pressure densities and viscosities of the ILs. Although the initial deviations, which are due to the affinity between ILs and CO2, were considerable for the five imidazolium-based ILs studied in this work, they were improved by introducing βx′. β could be calculated using the solubility parameters of the ILs and CO2, without requiring correlation. The average absolute relative deviations were 6.05–35.3% in the range of x′ < 1.0, sufficiently predicting the viscosity of the IL + CO2 mixtures.
1. Introduction
The development and application of carbon capture utilization and storage (CCUS) technology are expected to achieve carbon neutrality through the establishment of a carbon recycling industry. In this context, ionic liquids (ILs) have attracted attention not only as efficient solvents for CO2 separation and capture but also as catalysts for CO2 fixation.1–4 In developing such CCUS technology, knowledge of fundamental physical properties is essential. Many researchers have extensively studied properties such as density,5 viscosity,6 and gas solubility7 from both experimental and theoretical perspectives.
Among the fundamental physical properties, viscosity is a particularly important transport property because it significantly affects CO2 diffusion and heat-transfer rates. CO2 has been utilized in various processes to reduce the viscosity of IL solutions, and its effectiveness has been demonstrated.8,9 For example, in CCUS-related research, the viscosity of ILs under CO2 dissolution has often been investigated as an important physical property when selecting IL species for use in membrane separation or absorbents.10–15 In addition, in CO2-fixation reactions, improved reaction yields have been observed under high-pressure conditions,16 and both the increased amount of dissolved CO2 and the reduced solution viscosity have been considered to be contributing factors.17 Owing to the numerous IL types, measuring the viscosities of all IL + CO2 mixtures is difficult; therefore, a prediction model for viscosity must be developed.
Although many viscosity models have been reported for pure ILs,6,11,18,19 those for IL + CO2 mixtures are even rarer in the literature. Models based on free volume theory (FVT)20 and friction theory (FT)21 have been applied to predict the viscosity of IL + CO2 mixtures as a theoretical model development approach. For each case, combining suitable equations of state is necessary to estimate the force or distance between the molecules; this is a repulsive/attractive force in FT and the density in FVT. For example, Shen et al.22 combined FVT and FT with ePC-SAFT (electrolyte perturbed-chain statistical associating fluid theory)23 and concluded that the average relative deviations (ARDs) for the correlation of the viscosities of an IL + CO2 mixture were 15.8–32.3% for FVT and 4.14–20.0% for FT, respectively. On the other hand, Lopes et al.24 proposed applying an empirical model to the viscosity of IL + CO2 mixtures, and they achieved ARDs of 4.4–13% for viscosity correlation. Although these models can correlate the viscosities of IL + CO2 mixtures with sufficiently high accuracy, they require experimental data for parameter determination. Specifically, the model proposed by Shen et al.22 requires the determination of binary adjustable parameters, whereas the model developed by Lopes et al.24 involves fitting polynomial coefficients. Both approaches require a correlation with experimental measurements.
In this study, FVT was used to calculate viscosity, η. Doolittle20 used the occupied volume, V0; free volume, Vf; and substantial constants A and B to express viscosity as follows:
| |
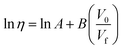 | (1) |
Using the specific volume (
V) and
Vf, the free volume ratio,
f, can be expressed as follows:
| |
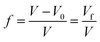 | (3) |
If
V0 is large,
V0 ≫
Vf is assumed. Therefore, from
eqn (1)–(3), the viscosity can be expressed using
eqn (4), inserting constants
A and
B as well as
f.
| |
 | (4) |
The ε*-modified Sanchez–Lacombe equation of state (ε*-mod SL-EoS)25–27 was selected in this study to calculate the free volume ratio. Various methods exist for determining the free volume, including molecular dynamics28–31 simulations and experimental approaches.32–35 However, one of the practical and theoretically well-founded methods is the use of an appropriate equation of state. ε*-mod SL-EoS25 is one of the lattice fluid type equations of state and can be expressed as follows:
| |
 | (5) |
| |
 | (6) |
| |
 | (7) |
| |
 | (8) |
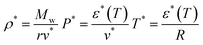
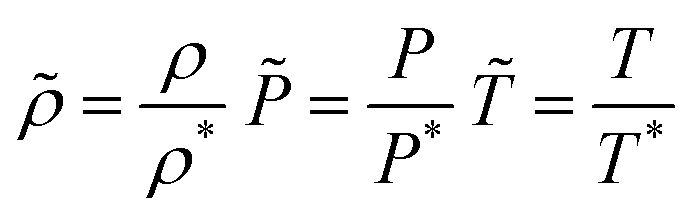
where
T*,
P*,
ρ*,
v* and
ε* are the characteristic parameters for temperature, pressure, density, volume, and interaction energy, respectively. Similarly,
T,
P,
ρ,
r,
ε0, and
α are the temperature, pressure, density, the number of lattice sites occupied by one molecule, the asymptotic value of the interaction energy, and the temperature-dependent parameter, respectively;
Mw and
R are the molar mass and gas constant, respectively. The lattice fluid theory was originally applicable to high-density solutions such as polymer solutions. However, ILs exhibit polymer-like high-density characteristics owing to Coulombic interactions. Therefore, theories such as the SL-EoS and the
ε*-mod SL-EoS have been applied to ILs. As a representative example, our research has demonstrated that this equation could accurately correlate and predict the densities of various pure ILs over a wide temperature range and at pressures up to 200 MPa.
25,36–38 For IL + CO
2 mixtures, the
ε*-mod SL-EoS successfully predicted the swelling ratio of ILs caused by dissolving CO
2.
39 These results indicate that the
ε*-mod SL-EoS is capable of accurately representing not only the pure component density of ILs but also the density of IL + CO
2 mixtures. Lattice-fluid theory is related to FVT, allowing
f to be expressed as 1 −
![[small rho, Greek, tilde]](https://www.rsc.org/images/entities/i_char_e0e4.gif)
, where
represents the reduced density in the lattice-fluid theory.
40 From the perspective of correlation accuracy for density, other candidate equations of state, such as ePC-SAFT, exist.
41,42
However, the equations of state based on these lattice fluid theories can be directly incorporated into the free volume ratio in FVT. These approaches are expected to facilitate the development of viscosity prediction models for IL + CO2 mixtures.
In this study, an FVT model incorporating the ε*-mod SL-EOS was developed to predict the viscosities of IL + CO2 mixtures. The model was applied to the viscosities of five imidazolium-based IL + CO2 mixtures, for which viscosity measurements under CO2-saturated conditions have been reported (Table 1). The aim was to predict the viscosity of IL + CO2 mixtures without correlating it with the experimental viscosity data by applying the ε*-mod SL-EOS, which is expected to accurately represent the free volume. This approach was expected to avoid the use of binary adjustable parameters or enable their estimation from other physical constants, thus eliminating the need for correlation with the experimental viscosity data.
Table 1 Viscosity of IL + CO2 mixtures under CO2 saturated conditions
| Name |
Temperature [K] |
Pressure [MPa] |
Ref. |
| [emim][Tf2N] |
298.15–343.15 |
0.1–29 |
43 |
| 323.15 |
1–9 |
44 |
| [hmim][Tf2N] |
298.15–343.15 |
0.1–29 |
43 |
| 278.15–303.15 |
0.1 |
45 |
| [dmim][Tf2N] |
298.15–343.15 |
2–13 |
43 |
| [emim][FAP] |
303.15–343.15 |
1–10 |
44 |
| [hmim][FAP] |
303.15–343.15 |
1–10 |
44 |
2. Model
2.1 Overall concept for viscosity calculation by FVT with ε*-mod SL-EoS
In this study, the viscosities were calculated using the procedure shown in Fig. 1. The reduced density of ILs, IL, was calculated using ε*-mod SL-EoS, and the free volume ratio for the pure IL, fIL, was replaced by 1 − IL. In the case of IL + CO2 mixtures, the reduced density of the mixtures (mix) was used. Then, A and B were determined by correlating them with the viscosity of the pure ILs. Because A and B were observed to be temperature dependent, the temperature dependence was expressed as A(T) and B(T). The viscosities of the mixtures were calculated using eqn (9).| |
 | (9) |
 |
| | Fig. 1 Flow diagram of the viscosity calculations in this study. | |
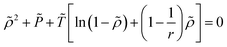
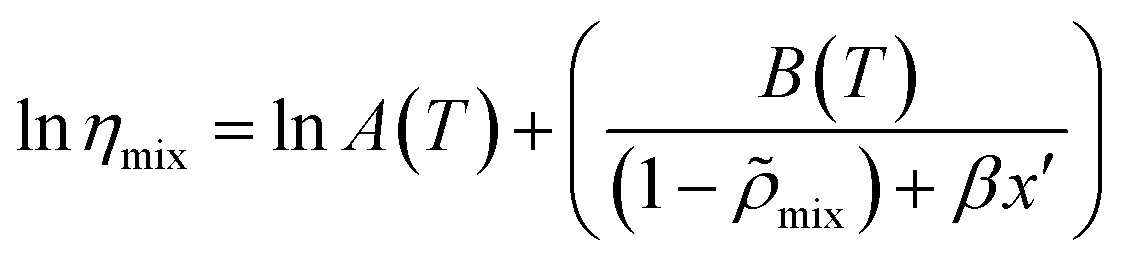
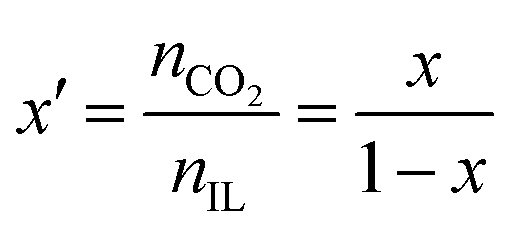
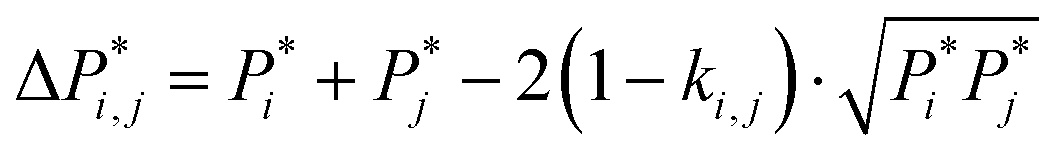
In addition, the correction factor, β, was introduced for the FVT in this study. Because cation–anion interactions have significant effects on viscosity,46,47 viscosity changes in IL + CO2 mixtures cannot be fully explained only by changes in the free volume. To accurately express the viscosity, the correction term, βx′, was introduced into the free volume term using β and the molar ratio of CO2 to IL, x′, as shown in eqn (10). The molar ratio of CO2 to IL has been used to describe the reaction between chemically absorbent ILs and CO248–50 as well as the relationship between the Raman spectra and CO2 solubility.51 In this study, x′ is used to represent the effect of CO2 on one mole of IL, where x′ and the modified free volume ratio are expressed as follows:
| |
 | (10) |
| | |
fmix = (1 − mix) + βx′
| (11) |
where
nCO2 and
nIL are the moles of CO
2 and the IL, respectively. The CO
2 solubility,
x, was calculated using
ε*-mod SL-EoS and
x′ was a simple unit conversion of
x.
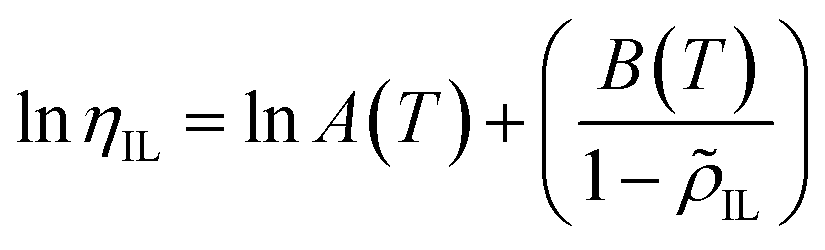
2.2 Pure IL systems
Four pure component parameters (ε0, v*, α, r), eqn (5)–(8) are required to calculate the ε*-mod SL-EoS. These parameters were determined by correlating them with the densities of pure ILs reported in the literature and minimizing the average relative deviation (ARD), as defined in eqn (12).| |
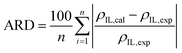 | (12) |
where ρIL,cal and ρIL,exp are the calculated and experimental densities of pure ILs, respectively; and n is the number of data points. Using the determined four pure component parameters, IL was calculated, and then ηIL was calculated using eqn (13). The temperature dependences of A(T) and B(T) were accounted for, as expressed in eqn (14), and the parameters a1, a2, b1, and b2 were determined by correlating them with the viscosities of the ILs reported in the literature. The ARD defined in eqn (15) was used as the objective function for the correlation.| |
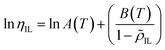 | (13) |
| | |
A(T) = a1Ta2 B(T) = b1Tb2
| (14) |
| |
 | (15) |
where ηIL,cal and ηIL,exp are the calculated and experimental viscosities of the pure ILs, respectively.
2.3 IL + CO2 binary systems
For the IL + CO2 mixture calculation using the ε*-mod SL-EoS, the following mixing rules were applied:| |
 | (16) |
| |
 | (17) |
| | |
ki,j = kj,i = kc + kTT
| (18) |
where ki,j is the interaction parameter between substances i and j, expressed as a linear equation with temperature dependence using intercept kc and slope kT, as shown in eqn (18); and φi and φj represent the volume fractions of components i and j, respectively. For the phase equilibrium calculations, the ILs were assumed to be insoluble in the CO2 vapor phase. The interaction parameters were determined by correlating them with the CO2 solubility reported in the literature, minimizing the ARD in the following equation:| |
 | (19) |
where xCO2,cal and xCO2,exp are the calculated and experimental solubilities of CO2 in the IL, respectively. Other parameters ( , rmix,
  , and mix) were calculated based on their definitions.25 The reduced density in the mixtures, mix, was calculated during the process of calculating xCO2,calc.
3. Results and discussion
3.1 Pure-component parameters for the ε*-mod SL-EoS determined by correlation with pure IL density
Fig. 2 shows the correlation results for the density of pure [emim][Tf2N],52 and those for other pure ILs53–63 are presented in Fig. S1–S4 (ESI†). The parameters in the ε*-mod SL-EoS (eqn (5)–(8)) and their ARD values calculated using eqn (12) are summarized in Table 2. The ARD values for the densities of the five pure ILs ranged from 0.048% to 0.20%. Using the ε*-mod SL-EoS enabled accurate correlation of the pure IL densities over a wide range of temperatures and pressures.
 |
| | Fig. 2 Correlation results for the density of [emim][Tf2N].52 Symbols: ○, 283 K; Δ, 293 K; □, 313 K; ▽, 323 K; ◊, 333 K; ◁, 353 K; ▷, 373 K. Lines: ε*-mod SL-EoS. | |
Table 2 Pure-component parameters for ε*-mod SL-EoS and ARDs
| Name |
Mw [g mol−1] |
ε0 [J mol−1] |
v* [cm3 mol−1] |
1/α [−] |
r [−] |
ARD [%] |
Ref. |
| Parameters obtained from ref. 25. |
| [emim][Tf2N] |
391.3 |
9982.8 |
1.205 |
762.6 |
159.7 |
0.095 |
52 and 64 |
| [hmim][Tf2N] |
447.4 |
11![[thin space (1/6-em)]](https://www.rsc.org/images/entities/char_2009.gif) 989 989 |
0.9604 |
1070 |
241.6 |
0.20 |
53–55 |
| [dmim][Tf2N] |
503.5 |
10165 |
1.019 |
873.4 |
272.5 |
0.070 |
56 |
| [emim][FAP] |
556.2 |
5872 |
6.929 |
99.79 |
42.41 |
0.048 |
57–62 |
| [hmim][FAP] |
612.3 |
5520 |
9.452 |
38.17 |
57.75 |
0.053 |
57, 62 and 63 |
| CO2 |
44.01 |
3060 |
3.512 |
7.762 |
79.34 |
— |
25a |
3.2 FVT parameters determined by correlation with pure IL viscosity
Fig. 3 shows the correlation results for the viscosity of pure [emim][Tf2N],65 and the viscosities of other pure ILs44,57,58,60,66–69 are shown in Fig. S5–S8 (ESI†). The parameters a1, a2, b1, and b2 in eqn (14) and the ARD values obtained using eqn (15) are listed in Table 3: the ARD values of the viscosities of the five pure ILs ranged from 1.6% to 5.1%. The viscosities of the pure ILs were successfully correlated across a wide pressure range using the FVT + ε*-mod SL-EoS model.
 |
| | Fig. 3 Correlation results for viscosity of [emim][Tf2N].65 Symbols: ○, 273.15 K; Δ, 298.15 K; □, 323.15 K; ▽, 348.15 K. Lines: FVT + ε*-mod SL-EoS. | |
Table 3 Parameters a1, a2, b1, and b2 for FVT + ε*-mod SL-EoS (eqn (13) and (14)) and ARDs
| Name |
a1 |
a2 |
b1 |
b2 |
ARD [%] |
Ref. |
| [emim][Tf2N] |
2.290 × 10⁻¹⁷ |
6.144 |
9.176 × 10⁴ |
−1.910 |
2.9 |
65 and 70 |
| [hmim][Tf2N] |
4.736 × 10⁻¹⁰ |
2.983 |
6.494 × 10³ |
−1.378 |
5.1 |
58, 60, 66 and 67 |
| [dmim][Tf2N] |
9.896 × 10⁴ |
−2.687 |
2.175 × 10² |
−0.7838 |
2.3 |
68 |
| [emim][FAP] |
2.003 × 10⁷ |
−2.693 |
1.863 × 10⁴ |
−1.964 |
1.6 |
44, 57, 58, 60 and 69 |
| [hmim][FAP] |
5.149 × 10⁶ |
−2.436 |
2.189 × 10⁵ |
−2.400 |
3.0 |
44, 58, 63 and 69 |
3.3 Densities of IL + CO2 mixtures and interaction parameters of ε*-mod SL-EoS determined by correlation with CO2 solubility
Fig. 4 shows the correlation results for CO2 solubility in [emim][Tf2N],44,71,72 and those for other ILs57,73–82 are presented in Fig. S9–S12 (ESI†). Table 4 lists the interaction parameters, kc and kT, in eqn (18) and their ARD values using eqn (19). The ARD values for CO2 solubility in the five ILs ranged from 1.5% to 5.4%, which indicates a sufficiently accurate correlation when considering the uncertainties and variations in the literature values.
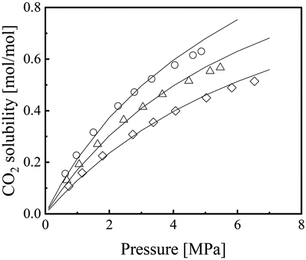 |
| | Fig. 4 Correlation results for CO2 solubility in [emim][Tf2N].72 Symbols: ○, 298.15 K; Δ, 313.15 K; ◊, 333.15 K.72 Lines: ε*-mod SL-EoS. | |
Table 4 Interaction parameters of IL + CO2 for ε*-mod SL-EoS with ARDs calculated using eqn (20)
Fig. 5 shows the mixed density, ρmix, of the [emim][Tf2N] + CO2 mixture72 predicted by eqn (5)–(8).
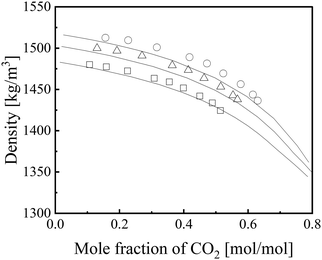 |
| | Fig. 5 Prediction results for density of [emim][Tf2N] + CO2.72 Symbols: ○, 298.15 K; Δ, 313.15 K; □, 333.15 K. Lines: ε*-mod SL-EoS. | |
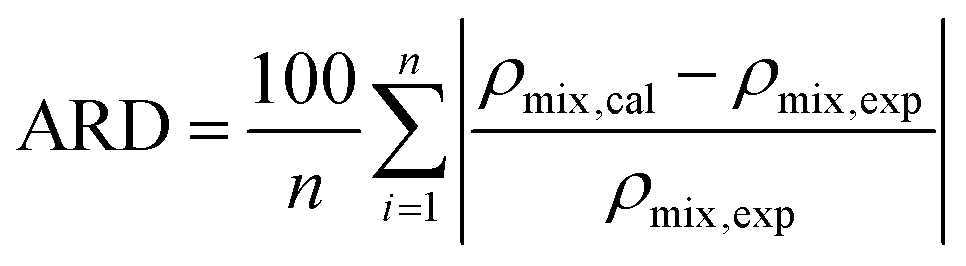
For the other IL + CO2 mixture systems, the densities were not compared owing to a lack of literature data. The ARD for ρmix (eqn 20) was 0.59%, demonstrating that the proposed method enables accurate prediction of the mixture density when considering their reported uncertainty (0.7%).72
| |
 | (20) |
3.4 Viscosity of IL + CO2 mixtures
Fig. 6 shows the viscosities, ηmix, of the [emim][Tf2N] + CO2 mixture;43,44 those for other IL + CO2 mixtures43–45 are presented in Fig. S13–S16 of the ESI.† The viscosity of [bmim][PF6] + CO2 has also been reported,83 but discrepancies in the viscosity trends of this system have been pointed out in another study.84 For this reason, it was excluded from the scope of this investigation. As shown in the prediction using β = 0 in Table 5, the ARD values for each system using eqn (21) were considerable for all IL + CO2 mixtures. One reason for this deviation is that the decrease in density observed for the IL + CO2 mixtures, as described in Section 3.3, is smaller than the decrease in viscosity. According to eqn (9), the density changes directly influence the viscosity, indicating that the trends coincide. However, the viscosity decreased sharply, whereas the density decreased gradually, with increasing CO2 mole fraction in the system. The model was generally sufficient to describe the behavior of IL + CO2 mixtures. However, expressing their viscosity only in terms of the density change, that is, the change in the free volume ratio owing to CO2 saturation, is still challenging. Therefore, the model must be modified to account for the observed viscosity reduction.| |
 | (21) |
 |
| | Fig. 6 Prediction and correlation results for the viscosity of the [emim][Tf2N] + CO2 mixture. Symbols:  , 298.15 K;43 Δ, 323.15 K;43 , 298.15 K;43 Δ, 323.15 K;43  , 343.15 K;43 ▲, 323.15 K.44 Dashed lines: prediction with FVT + ε*-mod SL-EoS (β = 0). Solid lines: correlation with FVT + ε*-mod SL-EoS (β ≠ 0). , 343.15 K;43 ▲, 323.15 K.44 Dashed lines: prediction with FVT + ε*-mod SL-EoS (β = 0). Solid lines: correlation with FVT + ε*-mod SL-EoS (β ≠ 0). | |
Table 5 ARDs of the prediction and correlation results of the viscosities of the IL + CO2 mixtures
| Name |
Prediction (β = 0) |
Correlation (β ≠ 0) |
Ref. |
| ARD [%] |
β |
ARD [%] |
| Molar ratio, x′, less than 0.1. |
| [emim][Tf2N] |
180 |
0.04023 |
15.6 |
43 and 44 |
| [hmim][Tf2N] |
188 |
0.02899 |
17.2 |
43 and 45 |
| [dmim][Tf2N] |
412 |
0.02499 |
10.3 |
43 |
| [emim][FAP] |
173 |
0.1080 |
14.7a |
44 |
| [hmim][FAP] |
136 |
0.1096 |
12.4a |
44 |
| Overall |
215 |
|
14.3 |
|
3.4.1 Correction factor determined by correlation with IL + CO2 viscosity. The correction factor, β, was determined by correlating the viscosity of the IL + CO2 mixtures, ηmix, to minimize the ARD defined in eqn (21). Discontinuities were observed in the experimental data for the [emim][FAP] + CO2 and [hmim][FAP] + CO2 mixtures.In high-solubility regions, such as [bmim][PF6] + CO2 mixtures, the aggregation structure of ILs might be disrupted.85 Therefore, the correlation was limited to the region where the molar ratio of CO2 to the IL, x′, was less than 1.0. These correlation results are also shown in Table 5 along with the determined β values and ARD values. The overall deviation was improved from 215% to 14.3% by introducing the correlation using β. The solid lines in Fig. 6 and Fig. S13–S16 (ESI†) represent the viscosities of the IL + CO2 mixtures, ηmix, calculated after introducing the correction term, βx′.
Previously, Shen et al.22 applied models combining ePC-SAFT with either FVT or FT to the literature-reported viscosities of the [hmim][Tf2N] + CO2 system.43 The reported ARD was 32.31% for the FVT + ePC-SAFT model and 10.22% for the FT + ePC-SAFT model. By comparison, the FVT + ε*-mod SL-EoS model proposed in the present study yielded an ARD of 17.0%, demonstrating better accuracy than the FVT + ePC-SAFT model, although slightly lower than that of the FT + ePC-SAFT model. Similarly, Lopes et al.24 used a polynomial-type equation to correlate the literature values of the viscosities of IL + CO2 systems for [hmim][Tf2N]43 and [dmim][Tf2N],43 achieving correlation accuracies of 25.0% and 18.9%, respectively. Comparing these with the values obtained in this study (i.e., 17.0% and 10.3%, respectively), our model demonstrated superior performance. For the [emim][Tf2N] + CO2 mixtures, the introduction of βx′ reduced the ARD to 15.6%. The parity plot (Fig. 7) shows that the model demonstrated good correlation, particularly in the regions where the viscosity exceeded 10 mPa s. However, a larger deviation was observed in the low-viscosity regions below 10 mPa s. Based on the β value, no clear trend was observed with respect to the cation side-chain length, but the difference in anion species was significant. Specifically, ILs containing the [FAP] anion require a larger correction than those comprising [Tf2N] anions, indicating that the contribution of the [FAP] anion to their viscosity cannot be fully explained by the free volume alone.
 |
| | Fig. 7 Parity plot for the viscosity of the IL + CO2 mixture. Symbols:  , [emim][Tf2N] + CO2 mixture;43 , [emim][Tf2N] + CO2 mixture;43  , [hmim][Tf2N] + CO2 mixture;43 ◊, [dmim][Tf2N] + CO2 mixture;43 ▽, [emim][FAP] + CO2 mixture;44 , [hmim][Tf2N] + CO2 mixture;43 ◊, [dmim][Tf2N] + CO2 mixture;43 ▽, [emim][FAP] + CO2 mixture;44  , [hmim][FAP] + CO2 mixture.44 Dashed lines: overall ARDs (14.3%; see Table 5) of the FVT + ε*-mod SL-EoS model. , [hmim][FAP] + CO2 mixture.44 Dashed lines: overall ARDs (14.3%; see Table 5) of the FVT + ε*-mod SL-EoS model. | |
Fig. 8 shows a schematic depicting the physical meaning of the free volume (i.e., the distance between molecules) and the correction factor for the viscosity reduction caused by CO2 dissolution. CO2 dissolution in ILs has been proposed to be caused by the voids within the IL, as reported in several studies.28–30,86 On the other hand, the expansion of the IL volume owing to CO2 dissolution, that is, the expansion of the free volume, is not large but rather limited to slight structural changes.87–91
 |
| | Fig. 8 The mechanism of viscosity reduction caused by CO2 dissolution. | |
This indicates that the viscosity decrease accompanying CO2 dissolution in ILs is not merely due to an increase in the free volume but also partially results from newly formed interactions between CO2 and the ions of the IL (particularly its anion), which weakens the attractive forces between the cation and anion of the IL. The reduction in ionic interactions has been demonstrated through molecular dynamics calculations.90,91 Therefore, the βx′ term introduced in this study can be considered to account for the interaction changes that are not fully captured by the FVT-based model.
3.4.2 Correction factor predicted by solubility parameters. To predict β, the solubility parameters of CO2 and the ILs were used. Substances with similar solubility parameters tend to dissolve well and exhibit good affinity, and the influence of the difference in solubility parameters between ILs and CO2 on CO2 solubility has been reported.92,93 Meanwhile, several approaches use the differences in solubility parameters between solvents and solutes to predict correction factors in phase equilibrium modelling.94–97 Referring to these studies, the following formulation was established:| |
 | (22) |
The details of the calculation method for determining solubility parameters are provided in the ESI,† and previous paper.98 β is predicted by taking the reciprocal of the difference between δIL and δCO2 as molecules with higher affinity were assumed to have larger correction factors.Fig. 9 shows the contributions of 1 − mix (dashed lines) and βx′ (solid lines) to the viscosity of [emim][Tf2N] + CO2 and [emim][FAP] + CO2 mixtures. The results for the other mixtures are shown in Fig. S17–S19 (ESI†). The contribution of βx′ was larger in FAP-based IL + CO2 mixtures than in [Tf2N]-based mixtures. This is attributed to the fluorine content in the [FAP] anion, which induces a strong dipole interaction with CO2 molecules, enhancing their affinity.91 In other words, the tendency of the β values of the ILs consisting of the [FAP] anion to be larger and thus require a greater correction (Table 5) was successfully represented by eqn (22). Therefore, the correction term, βx′, which is one of the factors contributing to the viscosity reduction shown in Fig. 9, represents the contribution of the weakened cation–anion interactions in the IL owing to CO2 dissolution. Fig. S20–S24 (ESI†) present the viscosities of the predicted β values obtained using this method, and Fig. 10 shows the parity plot. For all IL + CO2 mixtures, the model yielded good predictions in regions where the viscosity exceeded 10 mPa s. However, in the low-viscosity regions below 10 mPa s, the calculated values were lower than the experimental values.
 |
| | Fig. 9 Contribution of 1 − mix (dashed lines) and βx′ (solid lines). (A) [emim][Tf2N] + CO2 mixture (lines: blue, 298.15 K; black, 323.15 K; red, 343.15 K). (B): [emim][FAP] + CO2 mixture (lines: blue, 303.15 K; black, 323.15 K; and red, 343.15 K). | |
 |
| | Fig. 10 Parity plot for the viscosity of the IL + CO2 mixture (β is the value predicted by eqn (22)). Symbols: ○, [emim][Tf2N] + CO2 mixture;43 Δ, [hmim][Tf2N] + CO2 mixture;43 ◊, [dmim][Tf2N] + CO2 mixture;43 ▽, [emim][FAP] + CO2 mixture;44 □, [hmim][FAP] + CO2 mixture.44 Dashed lines: overall ARDs (15.5% at x′ < 1.0; see Table 6) of the FVT + ε*-mod SL-EoS. Dashed-dotted lines: overall ARDs (48.8% for the entire solubility range; see Table 6) of the FVT + ε*-mod SL-EoS. | |
This indicates that in low-viscosity regions with a high molar ratio of CO2, the model based on FVT with correction by solubility parameters may have limitations in representing the viscosity of the IL + CO2 mixtures. A more detailed evaluation is given in Table 6 and Fig. S20–S24 (ESI†), which shows that the model predicts relatively well for x′ < 1.0. This finding indicates that the correction based on solubility parameters was excessive in the high CO2 molar ratio region.
Table 6 ARDs of the prediction results using β predicted by eqn (22) using solubility parameters
| Name |
ARD [%] |
Ref. |
| x′ < 1.0 |
All |
| [emim][Tf2N] |
6.13 |
36.3 |
43 and 44 |
| [hmim][Tf2N] |
13.4 |
46.3 |
43 and 45 |
| [dmim][Tf2N] |
35.3 |
72.9 |
43 |
| [emim][FAP] |
22.2 |
56.0 |
44 |
| [hmim][FAP] |
12.6 |
41.1 |
44 |
| |
| Overall |
15.5 |
48.8 |
|
At present, the reason for the large differences in ARDs among the different ILs cannot be definitively identified. However, the following findings serve as important clues for identifying the possible causes of these discrepancies: (i) the deviations observed in the correlations (Table 5) are relatively small; (ii) the deviations in the solubility parameters of CO2 are assumed to be minimal, as the parameters used in this study account for both temperature and pressure dependence; and (iii) the prediction accuracy of the densities of the IL + CO2 systems is extremely high, as shown in Section 3.3. Taken together, these considerations indicate that the observed discrepancies are more likely due to inaccuracies in the estimated solubility parameters of the ILs or the limitations of the present approach, which rely on correcting the FVT + ε*-mod SL-EoS model based solely on solubility parameter differences. In this study, the solubility parameters of the ILs were estimated from their critical properties for ease of calculation. However, the accuracy of this method may be limited; for example, it might cause large deviations for ILs with FAP-based anions containing a high number of fluorine atoms or fail to accurately capture subtle differences in the alkyl chain length. This aspect has room for improvement in future studies. However, this model provides a useful approach for predicting the viscosities of IL + CO2 mixtures without the need for direct viscosity correlations by applying corrections based on the solubility parameters.
4. Conclusions
This study developed a viscosity prediction model for IL + CO2 mixtures by combining FVT with the ε*-mod EoS. The proposed model accurately correlated the viscosities of the five imidazolium IL + CO2 mixtures by introducing a correction term based on the molar ratio of CO2 to IL. Furthermore, using the correction factor derived from the solubility parameters, the model enabled the prediction of the viscosity of the IL + CO2 mixtures in regions where the molar ratio of CO2 to IL was low (x′ < 1.0). The introduction of solubility parameters is considered to account for the changes in the molecular structure of the ILs upon CO2 dissolution, which cannot be fully described by FVT alone.
To enhance the versatility of the model developed in this study, further experimental data must be accumulated, and the model must be applied to these datasets. The applicability of different ILs should be verified by extending their use to a wide variety of systems, including phosphonium- and ammonium-based ILs, which were not covered in this study. To improve this model, it is important to address the limitations of this study. The increase in deviation in the high CO2 concentration region is considered to have occurred in a region that deviates from the concept that CO2 dissolves in the IL, increases the free volume, and weakens the ionic interactions within the ILs, thereby reducing viscosity. At high CO2 concentrations, the interactions between CO2 molecules should be strengthened. Therefore, representing the viscosity change in this region accurately is necessary, for example, by considering the viscosity of CO2, although other approaches may also be possible. Alternatively, in the current model, parameters A and B, which correlate with the viscosity of pure ILs based on FVT, were also applied to the mixture system. However, for greater accuracy, these parameters must be refined to account for the mixture effects. Reassessing the contributions of the corrections used in this study is essential for evaluating the accuracy of the model. Considering the fundamental principles of this model, its applicability can extend beyond CO2-containing systems to systems involving other gases or solvent mixtures. Therefore, future studies should explore these possibilities. Additionally, the model will be expanded to chemical absorption-type ILs by incorporating compositional changes owing to chemical absorption as variations in the free volume. Establishing such extensibility would lead to the development of a practical and widely applicable framework for predicting the viscosity of IL + CO2 mixtures, which in turn would significantly contribute to the selection of ILs applicable to CCUS technologies.
Abbreviations
| [emim] | 1-Ethyl-3-methylimidazolium |
| [hmim] | 1-Hexyl-3-methylimidazolium |
| [dmim] | 1-Decyl-3-methylimidazolium |
| [Tf2N] | Bis(trifluoromethylsulfonyl)imide |
| [FAP] | Tris(perfluoroethyl)trifluorophosphate |
Author contributions
Ryohei Otani: data curation, formal analysis, software, writing, and original draft. Yuya Hiraga: investigation, methodology, software, visualization, writing – review and editing. Masaru Watanabe: conceptualization, project administration, supervision, writing – review and editing, validation, and funding acquisition.
Data availability
The data supporting this article have been included as part of the ESI.†
Conflicts of interest
There are no conflicts to declare.
Acknowledgements
This work was supported by the project JPNP18016, subsidized by the New Energy and Industrial Technology Development Organization (NEDO).
References
- G. Li, S. Dong, P. Fu, Q. Yue, Y. Zhou and J. Wang, Green Chem., 2022, 24, 3433–3460 RSC.
- S. N. A. Shafie, N. A. H. Md Nordin, S. M. Racha, M. R. Bilad, M. H. D. Othman, N. Misdan, J. Jaafar, Z. A. Putra and M. D. H. Wirzal, J. Mol. Liq., 2022, 358, 119192 CrossRef CAS.
- S. D. Kenarsari, D. Yang, G. Jiang, S. Zhang, J. Wang, A. G. Russell, Q. Wei and M. Fan, RSC Adv., 2013, 3, 22739 RSC.
- J. Zhang, J. Sun, X. Zhang, Y. Zhao and S. Zhang, Greenhouse Gases: Sci. Technol., 2011, 1, 142–159 CrossRef CAS.
- K. Paduszyński and U. Domańska, Ind. Eng. Chem. Res., 2012, 51, 591–604 CrossRef.
- N. Gao, Y. Yang, Z. Wang, X. Guo, S. Jiang, J. Li, Y. Hu, Z. Liu and C. Xu, Chem. Rev., 2024, 124, 27–123 CrossRef CAS PubMed.
- Z. G. Lei, C. N. Dai and B. H. Chen, Chem. Rev., 2014, 114, 1289–1326 CrossRef CAS PubMed.
- M. FitzPatrick, P. Champagne and M. F. Cunningham, Cellulose, 2011, 19, 37–44 CrossRef.
- M. Iguchi, K. Kasuya, Y. Sato, T. M. Aida, M. Watanabe and R. L. Smith, Cellulose, 2013, 20, 1353–1367 CrossRef CAS.
- T. Numpilai, L. K. H. Pham and T. Witoon, Ind. Eng. Chem. Res., 2024, 63, 19865–19915 CrossRef CAS.
- A. Chamoun-Farah, A. N. Keller, M. Y. Balogun, L. M. Cañada, J. F. Brennecke and B. D. Freeman, J. Membr. Sci., 2024, 702, 122758 CrossRef CAS.
- E. Kamio, T. Matsuki, S. Kasahara and H. Matsuyama, Sep. Sci. Technol., 2016, 52, 209–220 CrossRef.
- A. Matsuoka, A. Otani, E. Kamio and H. Matsuyama, Sep. Purif. Technol., 2022, 280, 119847 CrossRef CAS.
- L. Wang, J. Chen, S. Wang, T. Zhou, D. Li, C. Li, L. Qian, Y. Xiong, L. Miao and Z. Xie, Sep. Purif. Technol., 2025, 354, 129302 CrossRef CAS.
- X. Zhang, W. Xiong, Z. Tu, L. Peng, Y. Wu and X. Hu, ACS Sustainable Chem. Eng., 2019, 7, 10792–10799 CrossRef CAS.
- H. Kawanami, A. Sasaki, K. Matsui and Y. Ikushima, Chem. Commun., 2003, 896–897 RSC.
- P. Jaiswal and M. N. Varma, J. CO2 Util., 2016, 14, 93–97 CrossRef CAS.
- R. Macías-Salinas, Ind. Eng. Chem. Res., 2024, 63, 7387–7400 CrossRef.
- Y. Sun, G. Shen, C. Held, X. Feng, X. Lu and X. Ji, Ind. Eng. Chem. Res., 2018, 57, 8784–8801 CrossRef CAS.
- A. K. Doolittle, J. Appl. Phys., 1951, 22, 1471–1475 CrossRef CAS.
- S. E. Quiñones-Cisneros, C. K. Zéberg-Mikkelsen and E. H. Stenby, Fluid Phase Equilib., 2000, 169, 249–276 CrossRef.
- G. Shen, C. Held, J.-P. Mikkola, X. Lu and X. Ji, Ind. Eng. Chem. Res., 2014, 53, 20258–20268 CrossRef CAS.
- L. F. Cameretti, G. Sadowski and J. M. Mollerup, Ind. Eng. Chem. Res., 2005, 44, 3355–3362 CrossRef CAS.
- J. M. Lopes, S. Kareth, M. D. Bermejo, Á. Martín, E. Weidner and M. J. Cocero, J. Supercrit. Fluids, 2016, 111, 91–96 CrossRef CAS.
- H. Machida, Y. Sato and R. L. Smith, Fluid Phase Equilib., 2010, 297, 205–209 CrossRef CAS.
- I. C. Sanchez and R. H. Lacombe, J. Phys. Chem., 1976, 80, 2352–2362 CrossRef CAS.
- I. C. Sanchez and R. H. Lacombe, Macromolecules, 1978, 11, 1145–1156 CrossRef CAS.
- M. S. Shannon, J. M. Tedstone, S. P. O. Danielsen, M. S. Hindman, A. C. Irvin and J. E. Bara, Ind. Eng. Chem. Res., 2012, 51, 5565–5576 CrossRef CAS.
- W. Jeffrey Horne, M. S. Shannon and J. E. Bara, J. Chem. Thermodyn., 2014, 77, 190–196 CrossRef CAS.
- E. A. Shelepova and N. N. Medvedev, J. Mol. Liq., 2022, 349, 118127 CrossRef CAS.
- E. A. Shelepova and N. N. Medvedev, J. Mol. Liq., 2022, 368, 120740 CrossRef CAS.
- W. Beichel, Y. Yu, G. Dlubek, R. Krause-Rehberg, J. Pionteck, D. Pfefferkorn, S. Bulut, D. Bejan, C. Friedrich and I. Krossing, Phys. Chem. Chem. Phys., 2013, 15, 8821–8830 RSC.
- G. Dlubek, Y. Yu, R. Krause-Rehberg, W. Beichel, S. Bulut, N. Pogodina, I. Krossing and C. Friedrich, J. Chem. Phys., 2010, 133, 124502 CrossRef CAS PubMed.
- Y. Yu, D. Bejan and R. Krause-Rehberg, Fluid Phase Equilib., 2014, 363, 48–54 CrossRef CAS.
- N. J. Brooks, F. Castiglione, C. M. Doherty, A. Dolan, A. J. Hill, P. A. Hunt, R. P. Matthews, M. Mauri, A. Mele, R. Simonutti, I. J. Villar-Garcia, C. C. Weber and T. Welton, Chem. Sci., 2017, 8, 6359–6374 RSC.
- Y. Hiraga, M. Goto, Y. Sato and R. L. Smith, J. Chem. Thermodyn., 2017, 104, 73–81 CrossRef CAS.
- Y. Hiraga, K. Koyama, Y. Sato and R. L. Smith, J. Chem. Thermodyn., 2017, 108, 7–17 CrossRef CAS.
- Y. Hiraga, S. Hagiwara, Y. Sato and R. L. Smith, J. Chem. Eng. Data, 2018, 63, 972–980 CrossRef CAS.
- Y. Hiraga, K. Koyama, Y. Sato and R. L. Smith, J. Supercrit. Fluids, 2018, 132, 42–50 CrossRef CAS.
- Q. Guo, C. B. Park, X. Xu and J. Wang, J. Cell. Plast., 2007, 43, 69–82 CrossRef CAS.
- X. Ji, C. Held and G. Sadowski, Fluid Phase Equilib., 2012, 335, 64–73 CrossRef CAS.
- X. Y. Ji and C. Held, Fluid Phase Equilib., 2016, 410, 9–22 CrossRef CAS.
- A. Ahosseini, E. Ortega, B. Sensenich and A. M. Scurto, Fluid Phase Equilib., 2009, 286, 72–78 CrossRef.
- K. Li, W. Wu, L. Peng and H. Zhang, J. Mol. Liq., 2021, 337, 116240 CrossRef CAS.
- J. J. Fillion and J. F. Brennecke, J. Chem. Eng. Data, 2017, 62, 1884–1901 CrossRef CAS.
- G. Yu, D. Zhao, L. Wen, S. Yang and X. Chen, AlChE J., 2011, 58, 2885–2899 CrossRef.
- X. Zhang, F. Huo, X. Liu, K. Dong, H. He, X. Yao and S. Zhang, Ind. Eng. Chem. Res., 2015, 54, 3505–3514 CrossRef CAS.
- B. F. Goodrich, J. C. de la Fuente, B. E. Gurkan, D. J. Zadigian, E. A. Price, Y. Huang and J. F. Brennecke, Ind. Eng. Chem. Res., 2011, 50, 111–118 CrossRef CAS.
- B. F. Goodrich, J. C. de la Fuente, B. E. Gurkan, Z. K. Lopez, E. A. Price, Y. Huang and J. F. Brennecke, J. Phys. Chem. B, 2011, 115, 9140–9150 CrossRef CAS PubMed.
- X.-M. Zhang, K. Huang, S. Xia, Y.-L. Chen, Y.-T. Wu and X.-B. Hu, Chem. Eng. J., 2015, 274, 30–38 CrossRef CAS.
- Y. Hiraga, Y. Takikawa, M. Tatsushima and M. Watanabe, Chem. Eng. Sci., 2025, 307, 121352 CrossRef CAS.
- J. Safarov, W. A. El-Awady, A. Shahverdiyev and E. Hassel, J. Chem. Eng. Data, 2011, 56, 106–112 CrossRef CAS.
- M. Iguchi, Y. Hiraga, Y. Sato, T. M. Aida, M. Watanabe and R. L. Smith, J. Chem. Eng. Data, 2014, 59, 709–717 CrossRef CAS.
- R. Kato and J. Gmehling, J. Chem. Thermodyn., 2005, 37, 603–619 CrossRef CAS.
- J. Safarov, R. Hamidova, S. Zepik, H. Schmidt, I. Kul, A. Shahverdiyev and E. Hassel, J. Mol. Liq., 2013, 187, 137–156 CrossRef CAS.
- L. I. N. Tomé, P. J. Carvalho, M. G. Freire, I. M. Marrucho, I. M. A. Fonseca, A. G. M. Ferreira, J. O. A. P. Coutinho and R. L. Gardas, J. Chem. Eng. Data, 2008, 53, 1914–1921 CrossRef.
- D. Almantariotis, S. Stevanovic, O. Fandino, A. S. Pensado, A. A. Padua, J. Y. Coxam and M. F. Costa Gomes, J. Phys. Chem. B, 2012, 116, 7728–7738 CrossRef CAS PubMed.
- K. R. Harris and M. Kanakubo, J. Chem. Eng. Data, 2016, 61, 2399–2411 CrossRef CAS.
- Q. S. Liu, J. Tong, Z. C. Tan, U. Welz-Biermann and J. Z. Yang, J. Chem. Eng. Data, 2010, 55, 2586–2589 CrossRef CAS.
- A. Nazet, S. Sokolov, T. Sonnleitner, T. Makino, M. Kanakubo and R. Buchner, J. Chem. Eng. Data, 2015, 60, 2400–2411 CrossRef CAS.
- S. Seki, S. Tsuzuki, K. Hayamizu, Y. Umebayashi, N. Serizawa, K. Takei and H. Miyashiro, J. Chem. Eng. Data, 2012, 57, 2211–2216 CrossRef CAS.
- M. Součková, J. Klomfar and J. Pátek, J. Chem. Thermodyn., 2012, 48, 267–275 CrossRef.
- J.-G. Li, Y.-F. Hu, S. Ling and J.-Z. Zhang, J. Chem. Eng. Data, 2011, 56, 3068–3072 CrossRef CAS.
- R. L. Gardas, M. G. Freire, P. J. Carvalho, I. M. Marrucho, I. M. A. Fonseca, A. G. M. Ferreira and J. A. P. Coutinho, J. Chem. Eng. Data, 2007, 52, 1881–1888 CrossRef CAS.
- K. R. Harris and M. Kanakubo, J. Chem. Eng. Data, 2021, 66, 4618–4628 CrossRef CAS.
- J. C. F. Diogo, F. J. P. Caetano, J. M. N. A. Fareleira and W. A. Wakeham, Fluid Phase Equilib., 2013, 353, 76–86 CrossRef CAS.
- M. E. Kandil, K. N. Marsh and A. R. H. Goodwin, J. Chem. Eng. Data, 2007, 52, 2382–2387 CrossRef CAS.
- A. Ahosseini and A. M. Scurto, Int. J. Thermophys., 2008, 29, 1222–1243 CrossRef CAS.
- G. B. Dutt, J. Phys. Chem. B, 2010, 114, 8971–8977 CrossRef CAS PubMed.
- M. Atilhan, J. Jacquemin, D. Rooney, M. Khraisheh and S. Aparicio, Ind. Eng. Chem. Res., 2013, 52, 16774–16785 CrossRef CAS.
- M. Watanabe, D. Kodama, T. Makino and M. Kanakubo, Fluid Phase Equilib., 2016, 420, 44–49 CrossRef CAS.
- T. Makino, M. Kanakubo, Y. Masuda, T. Umecky and A. Suzuki, Fluid Phase Equilib., 2014, 362, 300–306 CrossRef CAS.
- W. Ren, B. Sensenich and A. M. Scurto, J. Chem. Thermodyn., 2010, 42, 305–311 CrossRef CAS.
- E.-K. Shin, B.-C. Lee and J. S. Lim, J. Supercrit. Fluids, 2008, 45, 282–292 CrossRef CAS.
- D. Almantariotis, O. Fandiño, J. Y. Coxam and M. F. Costa Gomes, Int. J. Greenhouse Gas Control, 2012, 10, 329–340 CrossRef CAS.
- S. Raeissi, L. Florusse and C. J. Peters, J. Supercrit. Fluids, 2010, 55, 825–832 CrossRef CAS.
- M. Gonzalez-Miquel, J. Bedia, J. Palomar and F. Rodriguez, J. Chem. Eng. Data, 2014, 59, 212–217 CrossRef CAS.
- M. Althuluth, M. T. Mota-Martinez, M. C. Kroon and C. J. Peters, J. Chem. Eng. Data, 2012, 57, 3422–3425 CrossRef CAS.
- A. H. Jalili, M. Shokouhi, G. Maurer and M. Hosseini-Jenab, J. Chem. Thermodyn., 2013, 67, 55–62 Search PubMed.
- M. Nunes da Ponte and M. E. Zakrzewska, J. Supercrit. Fluids, 2016, 113, 61–65 CrossRef CAS.
- M. J. Muldoon, S. N. V. K. Aki, J. L. Anderson, J. K. Dixon and J. F. Brennecke, J. Phys. Chem. B, 2007, 111, 9001–9009 CrossRef CAS PubMed.
- X. Liu, M. He, N. Lv, H. Xu and L. Bai, J. Chem. Thermodyn., 2016, 97, 48–54 CrossRef CAS.
- Z. Liu, W. Wu, B. Han, Z. Dong, G. Zhao, J. Wang, T. Jiang and G. Yang, Chem. – Eur. J., 2003, 9, 3897–3903 CrossRef CAS PubMed.
- D. Tomida, A. Kumagai, K. Qiao and C. Yokoyama, J. Chem. Eng. Data, 2007, 52, 1638–1640 CrossRef CAS.
- S. N. V. K. Aki, B. R. Mellein, E. M. Saurer and J. F. Brennecke, J. Phys. Chem. B, 2004, 108, 20355–20365 CrossRef CAS.
- M. Ramdin, T. W. de Loos and T. J. H. Vlugt, Ind. Eng. Chem. Res., 2012, 51, 8149–8177 CrossRef CAS.
- X. H. Huang, C. J. Margulis, Y. H. Li and B. J. Berne, J. Am. Chem. Soc., 2005, 127, 17842–17851 CrossRef CAS PubMed.
- M. Klahn and A. Seduraman, J. Phys. Chem. B, 2015, 119, 10066–10078 CrossRef CAS PubMed.
- T. C. Lourenco, S. Aparicio, G. C. Costa and L. T. Costa, J. Chem. Phys., 2017, 146, 104502 CrossRef PubMed.
- L. F. Lepre, M. Costa Gomes and R. A. Ando, ChemPhysChem, 2020, 21, 1230–1234 CrossRef CAS PubMed.
- Y. S. Sistla and V. Sridhar, J. Mol. Liq., 2021, 325, 115162 CrossRef CAS.
- Y. Marcus, J. Solution Chem., 2018, 48, 1025–1034 CrossRef.
- C. Panayiotou and V. Hatzimanikatis, Fluid Phase Equilib., 2021, 527, 112828 CrossRef CAS.
- X. Xu, H. Chen, C. Liu and C. Dang, ACS Omega, 2019, 4, 13279–13294 CrossRef CAS PubMed.
- M. S. Graboski and T. E. Daubert, Ind. Eng. Chem. Process Des. Dev., 1978, 17, 448–454 CrossRef CAS.
- M. S. Graboski and T. E. Daubert, Ind. Eng. Chem. Process Des. Dev., 1979, 18, 300–306 CrossRef CAS.
- J. R. Elliott and T. E. Daubert, Ind. Eng. Chem. Process Des. Dev., 1985, 24, 743–748 CrossRef CAS.
- Y. Hiraga, W. Endo, H. Machida, Y. Sato, T. M. Aida, M. Watanabe and R. L. Smith Jr, J. Supercrit. Fluids, 2012, 66, 49–58 CrossRef CAS.
|
| This journal is © the Owner Societies 2025 |
Click here to see how this site uses Cookies. View our privacy policy here. 
 Open Access Article
 This Open Access Article is licensed under a Creative Commons Attribution-Non Commercial 3.0 Unported Licence
 ,
Yuya Hiraga
,
Yuya Hiraga


 , rmix,
  , and
, and 


 , 298.15 K;43 Δ, 323.15 K;43
  , 343.15 K;43 ▲, 323.15 K.44 Dashed lines: prediction with FVT + ε*-mod SL-EoS (β = 0). Solid lines: correlation with FVT + ε*-mod SL-EoS (β ≠ 0).
 , [emim][Tf2N] + CO2 mixture;43
  , [hmim][Tf2N] + CO2 mixture;43 ◊, [dmim][Tf2N] + CO2 mixture;43 ▽, [emim][FAP] + CO2 mixture;44
  , [hmim][FAP] + CO2 mixture.44 Dashed lines: overall ARDs (14.3%; see Table 5) of the FVT + ε*-mod SL-EoS model.


