
 Open Access Article
 This Open Access Article is licensed under a
 Creative Commons Attribution 3.0 Unported Licence
Natural kaolin-derived ruthenium-supported nanoporous geopolymer: a sustainable catalyst for CO2 methanation†
Mukesh
Kumar
and
Sudhanshu
Sharma
 *
*
Department of Chemistry, Indian Institute of Technology Gandhinagar, Palaj, 382355, India. E-mail: ssharma@iitgn.ac.in
First published on 28th May 2025
Abstract
To address the serious concern of excessive CO2 emissions, the conversion of environmental CO2 into methane via a CO2 methanation reaction is promising. Methane can be used not only as a fuel but also as a hydrogen carrier. In this study, a geopolymer synthesized using natural kaolin (GNK) is explored as a support. This geopolymer support was used to disperse ruthenium (Ru) nanoparticles through a single-step hydrazine reduction method. The catalyst was characterized using various surface and bulk techniques. Furthermore, the catalytic performance of the ruthenium-supported geopolymer (Ru/GNK) for the CO2 methanation process was explored with different Ru loadings (%) and at different flow rates. Catalyst stability was also investigated for 20 h by a time-on-stream isothermal experiment. The spent catalyst was characterized by O2-temperature programmed oxidation (O2-TPO) and X-ray photoelectron spectroscopy (XPS). Overall, the catalyst proved to be cost-effective and free from pretreatment requirements, in addition to exhibiting superior activity, high selectivity, and good stability.
1. Introduction
The development of renewable energy generation has accelerated over the world. Global warming caused by excessive fossil fuel consumption and their decreasing availability heightens the urgency of securing clean and renewable energy resources.1 Despite progress in solar2 and wind energy technologies,3 their energy production remains inconsistent due to seasonal changes. This makes it difficult to maintain a continuous energy supply and requires additional infrastructure to support it. Several reports have revealed that CO2 is one of the major components of burning fossil fuels, and its increasing concentration is responsible for global warming. Thus, CO2 mitigation has become a major concern. One possible way to mitigate environmental CO2 is through the methanation of CO2 to form methane (CH4). Since the methanation process requires hydrogen and its storage has many problems, hydrogen which can be generated by electrolysis using renewable energy can be utilized for the CO2 methanation. The resulting CH4 contains a high weight percent of hydrogen (25%) and solves the problem of hydrogen storage as well.CO2 methanation reaction is highly exothermic and thermodynamically favored at low temperatures. However, catalysts are necessary to lower the high activation barriers and to alter the kinetics of the reaction. According to the literature, several catalysts are available for this process, where active metals such as Ru, Rh, Pt, Ni, and Pd are supported on oxides such as SiO2, Al2O3, ZrO2, TiO2, and CeO2.4 Noble metals such as Ru, Rh, Pt and Pd are reported to be highly active for CO2 methanation.1 Moreover, these metals are resistant to deterioration by sulphur poisoning, carbon deposition, and carbide formation.5
Working with 5 wt% noble metal alumina-supported catalysts, as reported by Solymosi and Erdöhelyi, the rate of CO2 methanation follows the order of Ru > Rh > > Pt–Ir–Pd. Apart from that, a majority of the studies have reported that Ru-based catalysts are highly efficient towards CO2 conversion, showing high CH4 yield and selectivity. Furthermore, they remain stable over longer durations. Due to the minimal metal loading requirements for supported metal catalysts compared to bulk catalysts, they appear to be an economically viable choice.6 The characteristics of the catalyst support such as morphology, pore structures, and surface area significantly affect the metal dispersion over it, and thus, alter the reaction performance.7
In the CO2 methanation reaction, chemical properties such as acidity and basicity of the support do affect the carbon dioxide adsorption capacity.8 Catalyst supports derived from pure chemicals including SiO2, Al2O3, CeO2, and zeolites have been extensively reported for CO2 methanation.9 Natural materials such as kaolin clay and dolomite are cost-efficient and environmentally benign, and hence, they qualify to be used as the support. Kaolin, the natural clay, has been studied for CO2 methanation. Aimdate et al. studied kaolin as a support for CO2 methanation, and they carried out CeO2 promotion and microwave-assisted hydrothermal synthesis to increase the CO2 conversion.10 The challenges associated with the use of kaolin include its low surface area and acidic surface. Nevertheless, kaolin can be used as a raw material for the preparation of geopolymer, which is more basic in nature and has higher surface area and porosity.11
Geopolymers are inorganic polymers that are prepared by treating various aluminosilicates with hydroxides, silicates, or carbonates of alkali and alkaline earth metals.12 These materials have a three-dimensional network of AlO4 and SiO4 tetrahedra connected by oxygen corners and are amorphous or semicrystalline.13 Geopolymer has a tunable surface area and can be a potential support for fine metal dispersion. Geopolymer's stability at high temperatures (1000–1200 °C) makes it suitable for the demanding conditions. The ability to adjust acidity and basicity by controlling hydroxyl ion ratios influences CO2 adsorption during processes like methanation. Thus, geopolymer presents a cost-efficient, adaptable, and thermally stable support for various applications. However, there are very few reports on the use of geopolymers as catalyst supports. Therefore, it is necessary to further study the role of geopolymers as supports in catalysis, which will be helpful for the development and application of geopolymer-based catalysts. Herein, we report a natural kaolin-derived geopolymer as a support for CO2 methanation. In this study, geopolymer, prepared from alkali (KOH) activation of metakaolin derived from natural kaolin, is used as a support for Ru nanoparticles. This is a novel and economical approach that has not been explored earlier to the best of our knowledge. Further, yield and carbon balance are usually not reported in the literature and our analysis includes detailed mole-to-mole conversion calculations of reactants to products, providing critical insights into the reaction's efficiency and carbon utilization.
2. Materials and methods
2.1 Catalyst synthesis
Kaolin powder was calcined at 750 °C for 10 h to obtain metakaolin with increasing reaction activity for polymerization. To prepare the geopolymer from metakaolin, first the aqueous solution of KOH was prepared by dissolving 14 g of KOH in 32 mL of distilled water. Then 15.43 g of fumed silica was added to the aqueous solution of KOH and stirred with a mechanical stirrer for 30 min at 800 rpm to make a clear solution. Further, 10 g of metakaolin was added slowly and dissolved properly. The resulting resin was cured in an oven at 60 °C for 24 h.11 A brown-coloured (geopolymer) cured product was broken into sample pieces, crushed into a fine powder and then washed several times with DI water to remove the excess of alkali. This scheme is shown in Fig. 1(a). | ||
| Fig. 1 (a) Schematic of geopolymer preparation from natural kaolin. (b) Scheme of Ru nanoparticle deposition on the geopolymer. | ||
As shown in Fig. 1(b) for the dispersion of Ru on geopolymer, 0.75 g of geopolymer was taken in a round-bottom flask. 20 mL of DI water was added to it and sonicated for 30 min. As per requirement (for different Ru loading percentages), the required volume of 1 wt% solution of RuCl3·3H2O was added and sonicated again for 30 min. Next, 20 mL of hydrazine hydrate (99–100%) was added drop by drop under continuous stirring. After the complete addition of hydrazine hydrate, leave this solution under stirring for 6 h, so that there is a complete reduction of Ru (3+) to Ru (0). The obtained solution was filtered and washed with DI water for 4–5 times. The solid that remained after filtration was dried at 60 °C for 24 h. A brown color powder formed, which is Ru supported over geopolymer (Ru/GNK), which will be used for catalysis without further pretreatment.
2.2 Characterization of the catalyst
The synthesized Ru supported on geopolymer catalysts was characterized by X-ray diffraction (XRD) using a Bruker D8 Discover diffractometer equipped with a Cu Kα radiation source (λ = 1.5406 Å), and the analysis was performed in the 2θ range of 10 to 70 degrees at a scan speed of 2 degrees per min. High-resolution transmission electron microscopic (HR-TEM) images were acquired using a Thermo Titan Themis 300 kV at an accelerating voltage of 200 kV in order to understand the formation of Ru nanoparticles over the geopolymer. For the preparation of the TEM sample, the catalyst was first dispersed in methanol under ultrasonication. Then, the dispersed catalyst was drop-casted over the carbon-coated copper grid and dried for 1 h. For the calculation of particle size and d-spacing, the ImageJ software was used. A JEOL JSM-7900F field emission scanning electron microscope (FE-SEM) was used for the analysis of sample morphology. An energy-dispersive X-ray spectrometer (EDS) attached to an FE-SEM, with the AZtec (Oxford Instruments) software, was used to determine the elemental composition.The specific surface area of the prepared catalyst was studied using a Micromeritics 3Flex Surface analyzer. Before the measurement, the samples were preheated to remove the moisture and adsorbed gases from sample. The samples were degassed in vacuum first at 90 °C for 1 h and then at 350 °C for 4 h. The Brunauer–Emmett–Teller (BET) method was applied to calculate the specific surface area of the samples. Fourier transform infrared (FTIR) spectroscopy was performed to analyze the functional groups present in the materials using a Perkin Elmer (UATR two). The ruthenium (Ru) concentrations in the catalyst were measured using an ICP-OES instrument (Perkin Elmer, Avios 200). For this, Ru geopolymer was first digested with aqua regia to make it a clear solution; after that, water was added to make it a 100 ppm solution. To find the oxidation state of Ru in the catalyst, X-ray photoelectron spectroscopy was performed using an AXIS Ultra DLD spectrometer (Kratos) equipped with a monochromatic Al Kα radiation source (hv = 1486.6 eV) for excitation.
The reducibility of the catalyst was checked by performing a H2-TPR experiment using a TCD detector (CIC-Binary Gas Analyzer, Baroda, India). The basicity of the catalyst was checked by CO2-temperature programmed desorption using an FID detector (CIC-Binary Gas Analyzer, Baroda, India). CO2 gas was first adsorbed on the catalyst at a flow rate of 30 mL min−1 for 30 min at room temperature. The catalyst was then flushed with nitrogen for 10 min to remove the weakly adsorbed CO2. At last, the catalyst was heated from 30 to 700 °C at a constant heating rate of 10 °C min−1 in the presence of nitrogen.
2.3 Catalytic activity test
The catalytic activity of Ru/GNK was tested in a packed bed micro flow reactor with 50 mg catalyst. The quartz tube (25 cm length, 4 mm internal diameter), loaded with the catalyst packed with quartz wool, was placed in a tubular furnace with temperature control. CO2 methanation reactions were conducted with 10% CO2 + 90% N2 and 10% H2 + 90% N2, maintaining a 1![[thin space (1/6-em)]](https://www.rsc.org/images/entities/char_2009.gif) :4 = CO2:H2 ratio. Additional nitrogen was added to maintain the overall flow rate. Reaction conditions ranged from room temperature to 500 °C with space velocities from 20000 to 60000 h−1. A K-type thermocouple measured the catalytic bed temperature. Gas analysis was performed using a CIC Dhruva gas chromatography instrument. The standard calibration cylinder was used to calculate the number of moles of the reactants and products. These moles were used to calculate the conversions, yield, selectivity, and carbon balance using ESI† eqn (S1)–(S3).
:4 = CO2:H2 ratio. Additional nitrogen was added to maintain the overall flow rate. Reaction conditions ranged from room temperature to 500 °C with space velocities from 20000 to 60000 h−1. A K-type thermocouple measured the catalytic bed temperature. Gas analysis was performed using a CIC Dhruva gas chromatography instrument. The standard calibration cylinder was used to calculate the number of moles of the reactants and products. These moles were used to calculate the conversions, yield, selectivity, and carbon balance using ESI† eqn (S1)–(S3).
2.4 Analysis of spent catalyst
Spent 3%Ru/GNK after 20 h of long-term stability test was characterized by O2-temperature programmed oxidation (O2-TPO) and XPS. O2-TPO was carried out to estimate the deposited carbon on the catalyst. O2-TPO is performed on the same setup that was used in CO2-TPD. The catalyst was flushed with nitrogen for 10 min to remove the weakly adsorbed gases. Then, it was heated from 30 °C to 700 °C at a constant heating rate of 10 °C min−1 in the presence of oxygen.3. Results and discussion
3.1 Material characterization
X-ray diffraction patterns of the synthesized catalyst are obtained in the range of 2θ from 10–70°, as shown in Fig. 2(a). From the XRD analysis, as shown in Fig. S1,† it was observed that natural kaolin (NK) consisted of kaolinite, quartz, and a small amount of illite phase.14 Upon heating kaolin at 750 °C, the crystalline structure changed to an amorphous metakaolin (MK) structure. MK prepared from the calcination of NK was used to prepare the geopolymer. The geopolymer prepared from NK is amorphous and shows a small hump in the lower 2θ range. For all Ru/GNK with different amounts of Ru loadings, no peak corresponding to Ru and RuO2 is observed in the XRD pattern, which may be due to the very small amount Ru on the geopolymer or high dispersion of small-sized Ru on geopolymer not detectable by XRD. | ||
| Fig. 2 (a) X-ray diffraction pattern (XRD) of the geopolymer from natural kaolin (GNK) and Ru supported on the geopolymer from natural kaolin (Ru/GNK) with Ru loadings of 1%, 3% and 5%. (b) HR-TEM image of Ru nanoparticles on the geopolymer support (GNK) in 3% Ru/GNK. (c) HAADF-STEM image and the corresponding EDS element mapping showing the distribution of Ru on the geopolymer support in 3% Ru/GNK. (d) N2-sorption isotherms and (e) BJH desorption dV/dD pore volume vs. pore diameter curves of GNK and 1%, 3% and 5% Ru/GNK. (f) X-ray photoelectron spectroscopy (XPS) spectra of Ru 3p of 3% Ru/GNK. | ||
The HR-TEM images of 3% Ru/GNK reveal the presence of crystalline RuO2 on the GNK support, as shown in Fig. 2(b). As the support material is amorphous, we are not getting any lattice fringes corresponding to the support material. The yellow-colored circle corresponds to crystalline Ru dispersed over GNK. The calculated d-spacing value of 0.22 nm corresponds to the (200) plane of RuO2 in 3% Ru/GNK. The average particle size of RuO2 was calculated as 2.4 nm. Therefore, the TEM analysis confirms that RuO2 is present in the crystalline form and uniformly distributed on the surface of GNK. Considering that the particle size is very small, it was not detected during the XRD analysis. The HAADF-STEM image of 3% Ru/GNK is shown in Fig. 2(c), and the corresponding EDS elemental mapping shows the distribution of Ru over the geopolymer. From this image, it is confirmed that Ru is uniformly distributed over the geopolymer.
The actual weight percentage of ruthenium over geopolymer is confirmed by ICP-OES, which is given in Table 1. The ICP-OES results show that the estimated amount of deposited metal is close to the calculated value in the case of 1% and 3% Ru/GNK, but the value is less than expected in the case of 5% Ru/GNK. It is possible that the geopolymer surface is not able to accommodate the larger amount of Ru nanoparticles, and extra nanoparticles either wash off or remain in the solution phase without deposition.
| Catalyst name | ICP-OES metal loading (wt%) | Wt% from SEM-EDX | BET surface area (m2 g−1) | Pore volume (cm3 g−1) | Pore size (Å) |
|---|---|---|---|---|---|
| GNK | — | — | 141.7 | 0.305 | 77.2 |
| 1% Ru/GNK | 0.9 | 1.8 | 140.5 | 0.286 | 73.6 |
| 3% Ru/GNK | 2.8 | 3.9 | 132.4 | 0.268 | 72.2 |
| 5% Ru/GNK | 4.0 | 4.9 | 127.9 | 0.253 | 71.5 |
The N2 adsorption–desorption measurement was performed to evaluate the surface area, pore volume, and pore size of the support (GNK) and Ru metal deposited over the support (Ru/GNK). As shown in Fig. 2(d), GNK and Ru/GNK belong to type-IV adsorption isotherms and type-H2(b) hysteresis loops.15 The mesoporous architectures of the GNK and Ru/GNK catalysts were clearly visible in the graph of pore size distributions measured by BJH, as shown in Fig. 2(e). The surface area of GNK is 141.7 m2 g−1. After the deposition of Ru metal on the support (Ru/GNK), a decrease in surface was observed as compared with GNK. The surface area of 1% Ru/GNK, 3% Ru/GNK and 5% Ru/GNK is 140.5 m2 g−1, 132.4 m2 g−1 and 127.9 m2 g−1, respectively. The loading of Ru nanoparticles on the support partially blocks the pores, resulting in a decrease in surface area, pore volume, and pore size of Ru/GNK compared to the GNK support. The specific surface area, pore volume, and pore size of the catalyst are given in Table 1.
The NK has a sheet-like structure, and when heated at 750 °C, it gets converted into MK, where the sheet-like structure gets destroyed, as shown in Fig. SI3.† When MK was used for the preparation of the geopolymer, no significant changes were observed. Even after the deposition of Ru on the GNK, a negligible change was observed in the shape, size and overall morphology of the geopolymer, as shown in Fig. SI4,–SI6.† This indicates that the size of Ru nanoparticles deposited over GNK is very small, so no change in the size of the GNK is observed. As shown in Fig. SI4–SI6,† there is no particular shape of particles for all three Ru/GNK catalysts with different Ru loadings. All the three catalysts have almost a similar morphology.
XPS analysis was performed to investigate the components' chemical states over the prepared catalyst surface. The XPS survey scan spectrum of Ru/GNK reveals the presence of all expected elements such as Ru, Al, Si, C, and O, as shown in Fig. SI7.† In the overall XPS survey, the overlapping of peaks at around 285 eV for C 1s and Ru 3d leads to difficulties in the analysis of ruthenium; thus, Ru(3p) was chosen for the analysis. Fig. 2(f) shows the Ru(3p) XPS spectra for the 3% Ru/GNK catalyst. The doublet can be deconvoluted into a pair of peaks, in which the energy values are 463.3 eV for 3p3/2 and 485.4 eV for 3p1/2. These observed data are indicative of RuO2, which is in agreement with the data reported in the literature.16,17 This means that Ru nanoparticles undergo surface oxidation in the air to form RuO2.18
To check the reducibility of the catalyst, H2-TPR studies have been conducted, and the results are given in Fig SI8,† which also suggest that Ru is present as RuO2 on the surface of the catalyst.
CO2 temperature-programmed desorption (CO2-TPD) experiments were conducted to determine the basicity of the Ru-geopolymer. The results depicted in the Fig. 3(a) reveal two distinct peaks representing the adsorption of CO2 on the alkaline sites of different types in all the three catalysts. The peak observed in the temperature range of 250 °C–450 °C corresponds to a moderate alkaline site, while the peak observed in the range of 550–600 °C corresponds to a strong alkaline site. These peaks indicate the formation of distinct carbonate species due to the adsorption of CO2 on the alkaline sites. It is obvious from the Fig. 3(a) and (b) that 3% Ru/GNK is most basic in the all catalysts because the amount of CO2 adsorbed is maximum in this case. It is also possible that at this composition, dispersion is uniform and adequate, which provides a large number of active sites for CO2 to adsorb. Moreover, the peak which corresponds to strong alkaline sites is not present in 3%Ru/GNK, as shown in Fig. 3(a). For catalysis, strongly alkaline sites are not useful as they will violate the moderation principle.19
 | ||
| Fig. 3 (a) CO2 temperature-programmed desorption (CO2-TPD) profile and (b) adsorption capacity for CO2 of 1% Ru/GNK, 3% Ru/GNK and 5% Ru/GNK. Reaction conditions: amount of catalyst = 50 mg, P = 1 atm, and T = RT to 600 °C. | ||
3.2 Catalytic activity test
 | ||
| Fig. 4 Catalytic activity test with different loadings (wt%) of Ru on the geopolymer from natural kaolin (GNK): (a) CO2 conversion; (b) H2 consumption; (c) CH4 selectivity; (d) CH4 yield; (e) CO selectivity; and (f) CO yield. Reaction conditions: amount of catalyst = 50 mg, P = 1 atm, T = RT to 500 °C, GHSV = 20000 h−1 and (H2/CO2) ratio = 4. | ||
000 h−1 (20 k h−1), 40000 h−1 (40 k h−1), 50000 h−1 (50 k h−1) and 60000 h−1 (60 k h−1). Fig. 5 shows the results of CO2 methanation. With the increase in temperature, the conversion of CO2 increases and reaches its maximum, and then decreases. The CO2 methanation starts at ∼175 °C and shows maximum conversion between 350 and 400 °C. For 20 k h−1 GHSV, the optimal reaction temperature for the catalyst was 350 °C, and the CO2 conversion was 51.6%, with 41.8% CH4 yield and 97.7% CH4 selectivity. Increasing the space velocity decreased the CO2 conversion at the same temperature. For other space velocities (40 k, 50 k, and 60 k h−1), the CO2 conversion at 350 °C was less than that for 20 k h−1. This is not unusual because the contact time decreases as the flow rate increases, and thus, the conversion decreases.21 The selectivity and yield of CH4 also decrease with the increase in the flow rate of reactant gases. At a higher GHSV, there is less chance of CO reduction to CH4, the intermediate step of CO2 methanation.22 The exact reason is the higher selectivity and yield of CO with the increased GHSV. Thermodynamic CO2 conversion is higher than the experimental conversion at 350 °C. However, at 500 °C, the thermodynamic and experimental conversions are approaching each other.
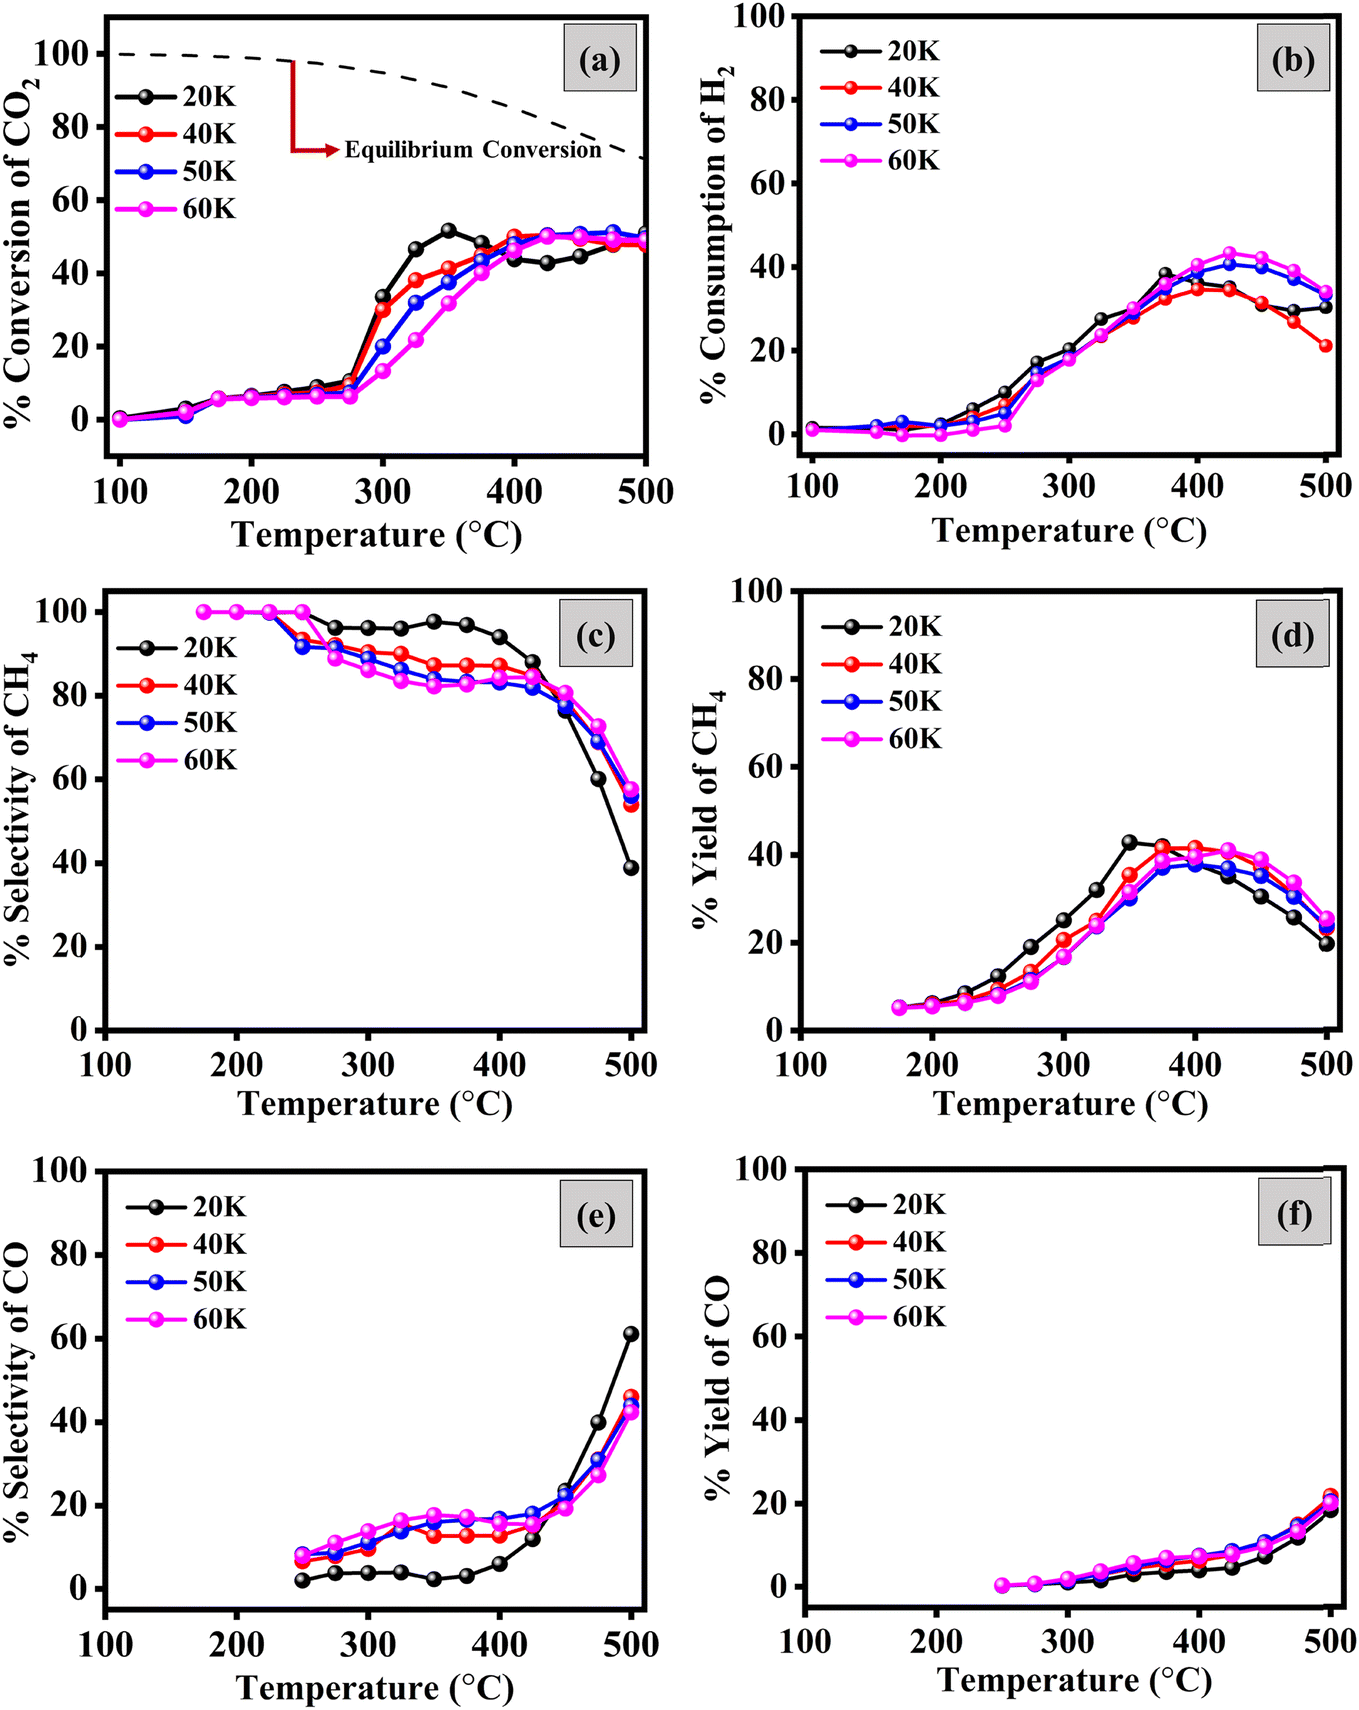 | ||
| Fig. 5 Effect of the flow rate on the catalytic activity of 3% Ru/GNK with temperature: (a) CO2 conversion; (b) H2 consumption; (c) CH4 selectivity; (d) CH4 yield; (e) CO selectivity; and (f) CO yield vs. temperature. Reaction conditions: amount of catalyst = 50 mg, P = 1 atm, T = RT to 500 °C, GHSV = 20000 h−1, 40000 h−1, 50000 h−1, 60, 000 h−1 and (H2/CO2) ratio = 4. | ||
 | ||
| Fig. 6 (a) Evolution of CO2 conversion and selectivity of CH4 at 350 °C with time-on-stream over 20 h for 3%Ru/GNK. Reaction conditions: amount of catalyst taken = 50 mg, P = 1 atm, T = 350 °C, GHSV = 20000 h−1 and (H2/CO2) ratio = 4. (b) O2-temperature programmed oxidation (O2-TPO). (c) Ru 3p XPS profiles of spent catalyst. (d) Arrhenius plot for the calculation of the apparent activation energy for CO2 methanation on 3%Ru/GNK. | ||
4. Characterization of spent catalysts
4.1 O2-temperature programmed oxidation (O2-TPO)
The carbon deposition on the spent catalyst was calculated by O2-TPO. On passing oxygen over the spent catalyst with the increase in temperature from 30 °C to 700 °C, the formation of CO2 was observed, as shown in Fig. 6(b). A weak signal confirmed that carbon deposition was minimal even after 20 hours of long-term stability test. Quantitatively, only 0.078 mg gcat−1 of carbon was deposited under the methanation reaction conditions at the end of 20 hours. The carbon balance (CB) for reactions was calculated using ESI† eqn (S4). For all the reactions performed with 3%Ru/GNK, CB is coming in the range of 3–6%, which means that carbon deposition in 3%Ru/GNK catalyst is minimal, and the majority of the reactant carbon forms the product.4.2 XPS of spent catalysts
The chemical state of Ru on the surface of the spent catalyst was investigated by XPS after CO2 methanation reactions. The Ru 3p XPS spectra for the Ru/GNK-spent catalyst are shown in Fig. 6(c). The Ru(3p) spectra of 3%Ru/GNK-spent can be deconvoluted into two pairs of peaks, in which the binding energy values are attributed to 3p3/2 (463.0 eV) and 3p1/2 (485.1 eV). These values are very close to binding energies in case of fresh catalysts (3%Ru/GNK). Therefore, there is no change in the oxidation state of Ru/GNK after CO2 methanation.5. Apparent activation energy calculation
Using the Arrhenius relationship, the activation energy for CO2 methanation was calculated. Fig. 6(d) depicts the Arrhenius plot for CO2 methanation and feed conversion in the 175–275 °C temperature range for CO2 methanation. Under kinetically controlled conditions, measurements were conducted at low conversions. The apparent activation energy for CO2 methanation is 63.6 kJ mol−1 for 3%Ru/GNK.According to the existing literature, we found that the geopolymer support derived from natural kaolin has not been extensively reported. Therefore, we compared the activity of our catalyst with relatively similar catalysts reported in the literature in terms of CO2 conversion, CH4 selectivity, CH4 yield, and apparent activation energy for CO2 methanation, as shown in ESI†Tables 1 and S2. In our study, the reaction was carried out with 50 mg of catalyst (3%Ru/GNK), showing a CO2 conversion of 51.6%, a CH4 selectivity of 97.7%, and a CH4 yield of 41.8% at 350 °C with a gas/weight hourly space velocity (GHSV/WHSV) of 20000 h−1/39600 mL g−1 h−1. Wan et al. have reported Ni–P-SGS, a slag-based geopolymer catalyst, for CO2 methanation, which shows a CO2 conversion of 80.2% and a CH4 selectivity of 99.2% at 400 °C and a weight hourly space velocity (WHSV) of 12000 mL g−1 h−1.23 The conversion in their case may be high due to the low WHSV, i.e. higher reactant to catalyst contact time compared to our case. The geopolymer they reported was prepared from synthetic chemicals [Si(OC2H5)4, Mg(NO3)2·6H2O, Al(NO3)3·9H2O, and Ca(NO3)·4H2O] using the sol–gel method, which is both expensive and time-consuming. In contrast, our catalyst is naturally derived from kaolin-based clay, making it more cost-effective and eco-friendly. Aimdate et al. have prepared a similar kind of catalyst using metakaolin as a support 30Ni–20Ce/MTK_M.10 In that case, with 100 mg of 20Ce/MTK_M catalyst, they obtained a CO2 conversion of 61.2% and a CH4 selectivity of 98% at 350 °C and a WHSV of 14000 mL g−1 h−1. Higher conversion in this case can be again due to the less WHSV and more amount of catalysts taken for the reaction. Czuma et al. have reported nickel deposited over fly ash-derived zeolite, 15%Ni/Fly ash zeolite-type X, as a catalyst for CO2 methanation.24 They achieved a CO2 conversion of 53% at 450 °C with a GHSV of 12000 h−1. However, in our case, we achieved almost similar CO2 conversion rates at a lower temperature 350 °C and a higher GHSV of 20000 h−1. To the best of our knowledge, there are no studies in which Ru-based geopolymers are explored for the CO2 methanation reaction. Therefore, it is very difficult to compare it with the reported literature. Moreover, the activity of the geopolymer varies with sources of kaolin clay used. In our case, we used kaolin clay of Indian origin.
On comparing the apparent activation energy for CO2 methanation, we found that it is comparable to the apparent activation energy reported for the CO2 methanation, as given in the ESI,† Table S2. In our study, the calculated apparent activation energy for 3%Ru/GNK is 63.6 kJ mol−1. With a similar kind of material like geopolymer, Aimdate et al. have reported the apparent activation energy for CO2 methanation on the 30Ni–20Ce/MTK_M catalyst as 55.1 kJ mol−1. Overall, our catalyst is comparable to the similar kind of catalyst reported in the literature.
6. Transient study
Transient studies were conducted to determine the dependence of the methanation reaction on the reactants, i.e., CO2 and H2, as shown in Fig. 7. For this, we chose the optimal conditions for the reaction, i.e., 3%Ru/GNK, Temp. = 350 °C GHSV = 20000 h−1 and (H2/CO2) ratio = 4. Initially, we had all reactant gases in the reaction stream, and their response was recorded using a mass spectrometer. Upon stopping the flow of CO2, whilst continuing the H2 flow, it was observed that the signals of CO2, CH4 and CO altogether approach zero. However, there was a time-lapse of 18 s in the decrease of CH4 response as compared to that of CO2, which suggests that there might be some intermediates (possibly carbonate type of species) on the surface of the catalyst that are responsible for the methanation, even though there is no CO2 in the gas stream. Further, to investigate whether the adsorbed hydrogen participates in the reaction, we stopped the H2 flow while continuing the CO2 flow. We observed that CH4 formation diminished right after the H2 flow was stopped. This means that the reaction of H2 with the carbonaceous intermediate is very swift. Therefore, there seems to be no role of chemisorbed H2 in the methanation step.
 | ||
| Fig. 7 Transient study of CO2 methanation on 3%Ru/GNK at 350 °C and GHSV = 20000 h−1. (a) Mass signal of reactant gases (CO2 and H2) and product gases (CH4 and CO) and the effect of removing reactant gases on product formation. (b) Magnified response of CH4, CO and CO2. (c) Magnified response on cutting H2. (d) Magnified response on cutting CO2. | ||
7. Conclusion
In conclusion, this study investigated the utilization of a geopolymer derived from natural kaolin as a support material for CO2 methanation. We successfully prepared a Ru-supported geopolymer catalyst (Ru/GNK) via hydrazine reduction, revealing some key findings. The XRD analysis revealed the amorphous nature of the geopolymer, and the introduction of Ru onto the geopolymer did not alter its XRD pattern significantly, while a small amount of Ru was noticed. The TEM studies confirmed the presence of RuO2 nanoparticles on the GNK support. ICP and SEM-EDS analyses further confirmed the presence of Ru in the catalyst. However, the deposition of Ru on the geopolymer led to a reduction in surface area, attributed to the partial pore occupation by RuO2 nanoparticles. XPS analysis provided insights into the oxidation state of Ru in the geopolymer, confirming its presence in the +4 oxidation state. Upon comparing various Ru loadings on the geopolymer for CO2 methanation, we identified 3%Ru/GNK as the catalyst that outperformed others in terms of temperature requirements for reaction, CO2 conversion, CH4 selectivity, and CH4 yield. For 3%Ru/GNK, the maximum CO2 conversion is 51.6% with 97.7% CH4 selectivity and 41.8% CH4 yield. Our CO2 TPD data emphasized the significance of catalyst basicity in CO2 methanation, with the order of CO2 adsorption capacity being 3%Ru/GNK > 5%Ru/GNK > 1%Ru/GNK. Furthermore, our study explored the importance of maintaining optimal reactant gas flow rates to maximize CO2 conversion and CH4 selectivity at lower temperatures. Our optimized conditions for CO2 methanation were established as GHSV = 20000 h−1, CO2:H2 = 1:4, and a temperature of 350 °C. Notably, long-term stability testing of the catalyst revealed only a 3% decrease in CO2 conversion and a 2% decrease in CH4 selectivity after 20 hours of testing under the optimized conditions. This decrease was attributed to the deposition of a small amount (0.078 mg gcat−1) of coke (C) during the reaction. In conclusion, this research provides valuable insights into the use of geopolymer-based catalysts for CO2 methanation, with the 3% Ru/GNK catalyst emerging as a promising candidate for sustainable methane production.
Data availability
The data supporting this article have been included as part of the ESI.†Conflicts of interest
There are no conflicts to declare.Acknowledgements
MK and SS acknowledge the Indian Institute of Technology Gandhinagar for providing the Central Instrumentation Facility for carrying out the characterization. MK is thankful to IIT Gandhinagar for fellowship. SS acknowledges the Department of Science and Technology and the Science and Engineering Research Board-sponsored research project CRG/2022/004926 and CEFIPRA-sponsored project-64T2B for funding.References
- P. Frontera, A. Macario, M. Ferraro and P. Antonucci, Catalysts, 2017, 7, 59 CrossRef.
- A. Arsalis, P. Papanastasiou and G. E. Georghiou, Renewable Energy, 2022, 191, 943–960 CrossRef CAS.
- Z. Li, P. Guo, R. Han and H. Sun, Energy Explor. Exploit., 2019, 37, 5–25 CrossRef CAS.
- C. Mebrahtu, F. Krebs, S. Abate, S. Perathoner, G. Centi and R. Palkovits, in Studies in Surface Science and Catalysis, Elsevier, 2019, vol. 178, pp. 85–103 Search PubMed.
- C. Q. Pham, M. B. Bahari, P. S. Kumar, S. F. Ahmed, L. Xiao, S. Kumar, A. S. Qazaq, T. J. Siang, H.-T. Tran, A. Islam, A. Al-Gheethi, Y. Vasseghian and D.-V. N. Vo, Environ. Chem. Lett., 2023, 13, 4996–5004 Search PubMed.
- L. Falbo, M. Martinelli, C. G. Visconti, L. Lietti, C. Bassano and P. Deiana, Appl. Catal., A, 2018, 225, 354–363 CrossRef CAS.
- L. Shen, J. Xu, M. Zhu and Y.-F. Han, ACS Catal., 2020, 10, 14581–14591 CrossRef CAS.
- C. Liang, L. Zhang, Y. Zheng, S. Zhang, Q. Liu, G. Gao, D. Dong, Y. Wang, L. Xu and X. Hu, Fuel, 2020, 262, 116521 CrossRef CAS.
- K. Ghaib, K. Nitz and F.-Z. Ben-Fares, ChemBioEng Rev., 2016, 3, 266–275 CrossRef.
- K. Aimdate, A. Srifa, W. Koo-amornpattana, C. Sakdaronnarong, W. Klysubun, S. Kiatphuengporn, S. Assabumrungrat, S. Wongsakulphasatch, W. Kaveevivitchai, M. Sudoh, R. Watanabe, C. Fukuhara and S. Ratchahat, ACS Omega, 2021, 6, 13779–13794 CrossRef CAS PubMed.
- A. Singhal, B. P. Gangwar and J. M. Gayathry, Appl. Clay Sci., 2017, 150, 106–114 CrossRef CAS.
- X. Yao, Z. Zhang, H. Zhu and Y. Chen, Thermochim. Acta, 2009, 493, 49–54 CrossRef CAS.
- J. Davidovits and M. Davidovics, How Concept Becomes Reality, 1991, 36, 1939–1949 CAS.
- E. Kłosek-Wawrzyn, J. Małolepszy and P. Murzyn, Procedia Eng., 2013, 57, 572–582 CrossRef.
- M. Thommes, K. Kaneko, A. V. Neimark, J. P. Olivier, F. Rodriguez-Reinoso, J. Rouquerol and K. S. Sing, Pure Appl. Chem., 2015, 87, 1051–1069 CrossRef CAS.
- V. B. Saptal, T. Sasaki and B. M. Bhanage, ChemCatChem, 2018, 10, 2593–2600 CrossRef CAS.
- M. K. Awasthi, R. K. Rai, S. Behrens and S. K. Singh, Catal. Sci. Technol., 2021, 11, 136–142 RSC.
- A. G. Shastri and J. Schwank, J. Catal., 1985, 95, 271–283 CrossRef CAS.
- H. Ooka, J. Huang and K. S. Exner, Front. Energy Res., 2021, 9, 654460 CrossRef.
- M. Tommasi, S. N. Degerli, G. Ramis and I. Rossetti, Chem. Eng. Res. Des., 2024, 201, 457–482 CrossRef CAS.
- A. Bisht, A. Sihag, A. Satyaprasad, S. S. Mallajosyala and S. Sharma, Catal. Lett., 2018, 148, 1965–1977 CrossRef CAS.
- K. Stangeland, D. Kalai, H. Li and Z. Yu, Energy Procedia, 2017, 105, 2022–2027 CrossRef CAS.
- H. Wan, Y. He, Q. Su, L. Liu and X. Cui, Fuel, 2022, 319, 123627 CrossRef CAS.
- N. Czuma, K. Zarębska, M. Motak, M. E. Gálvez and P. Da Costa, Fuel, 2020, 267, 117139 CrossRef CAS.
Footnote |
| † Electronic supplementary information (ESI) available. See DOI: https://doi.org/10.1039/d5cy00021a |
| This journal is © The Royal Society of Chemistry 2025 |