
 Open Access Article
 This Open Access Article is licensed under a Creative Commons Attribution-Non Commercial 3.0 Unported Licence
Triple-chromic (photo-, thermo-, and mechano-chromic) metal complexes containing N-salicylideneaminopyridine ligands†
Haruki
Sugiyama
 ab,
Atsuko
Arita
a,
Akiko
Sekine
a and
Hidehiro
Uekusa
*a
ab,
Atsuko
Arita
a,
Akiko
Sekine
a and
Hidehiro
Uekusa
*a
aDepartment of Chemistry, School of Science, Institute of Science Tokyo, 2-12-1, Ookayama, Meguro, Tokyo 152-8551, Japan. E-mail: uekusa@chem.sci.isct.ac.jp
bNeutron Industrial Application Promotion Center, Comprehensive Research Organization for Science and Society, Tokai, Ibaraki, 319-1106, Japan
First published on 7th February 2025
Abstract
N-Salicylideneaminopyridine (SAP) is a well-known organic chromic compound that shows a reversible colour change upon UV light irradiation (photochromism) and upon cooling (thermochromism). Herein, we report novel multi-chromic metal complexes containing SAP derivatives as ligands, viz. [Ni(NCS)2(3,5-t-Bu-SAP)4] (Ni1) and [Co(NCS)2(3,5-t-Bu-SAP)4] (Co1). The Ni1 crystals exhibited both photo- and thermochromism with new colour variations, which were due to the light absorption of the Ni(II) ions and chromic properties of the SAP ligands. The Co1 crystal also exhibited photo- and thermochromism originating from the SAP ligands. Furthermore, the Co1 crystal exhibited mechanochromism induced by grinding with a mortar, which was considered to be attributable to the change of the Co1 coordination structure. Such a triple-chromic material is rare and very fascinating for the applications of multiple sensors, memory devices, and functional inks.
Introduction
Chromism is a reversible colour-change phenomenon promoted by external stimuli. Several kinds of chromism are known and named to represent the type of stimulus, for example, photochromism,1 thermochromism,2,3 mechanochromism,4,5 solvatochromism,6,7 vapochromism,8,9 electrochromism,10,11 and piezochromism.12,13 In recent years, chromism has attracted considerable interest because of its potential applications in memory devices, photochromic lenses, rewritable paper displays, functional ink, and sensing media.14,15N-Salicylideneaniline (SA) and its derivatives are classical organic photochromic compounds. SA crystals change colour from yellow-orange to red upon UV light irradiation and revert to the original colour upon visible light irradiation or heating.16–20 Moreover, SA crystals exhibit thermochromism from orange to yellow or colourless, with decreasing temperature. Both photo- and thermochromism are caused by the isomerisation of SA molecules promoted by external stimuli. Fig. 1 illustrates the photo- and thermochromism mechanisms of these molecules. The chromic properties in the crystalline state are correlated to the crystal structures. Thus, photochromism can be observed in SA crystals containing non-planar molecules with an intramolecular dihedral angle greater than 30°.19,20 In contrast, SA crystals containing planar molecules do not exhibit photochromism. Additionally, the changes in thermochromic colour for the planar SA molecules are greater than those of the non-planar molecules.21,22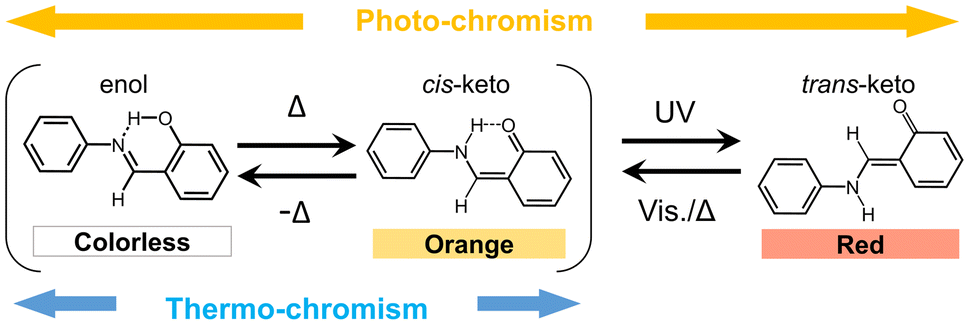 | ||
| Fig. 1 Photo- and thermochromism of SA derivatives. | ||
The formation of a multi-component crystal containing chromic compounds like SA is a promising crystal engineering technique to develop novel functional materials with modified or enhanced chromic properties. For example, Johmoto et al. controlled the photochromic activities of SA derivatives by acid–base co-crystallisation via modification of the molecular conformation in the crystal.23 Weerasekara et al. synthesised mixed crystals of fulgide derivatives that exhibited marked multi-colour photochromism, originating from the photochromic properties of the fulgide molecules.24 Moreover, the fatigue resistance for photochromism was enhanced in the mixed crystals compared to that of the original fulgide crystals.
As mentioned above, the combination of more than one component can afford a new functional material using traditional chromic compounds. Based on this strategy, transition metal complex formation was pursued using SA derivatives as ligands. Such a metal complex should display the photo- and thermo-chromism of SA ligands and new colour change due to d–d transition and charge transfer, other than those of the SA derivatives.25,26 Additionally, the metal complexes have the potential to alter their colour in response to the variation in metal–metal interaction, coordination geometry change, or chemical bond formation/cleavage.27,28 For example, several mechanochromism studies of metal complexes, including those of V(IV),27 Fe(II,III),29 Co(II),30 Cu(I),31,32 Ag(I),4 Pt(II),33,34 and Au(I)5,28,35 have been reported.
Therefore, metal complexes with SA derivative have potential to be multiple chromic materials, which are capable of switching their structures and properties by various stimuli. Those materials are extremely important in many scientific fields, including molecular computing, non-linear optics, and bioimaging, and are key materials for the further development of novel functional devices.36,37 Additionally, crystalline materials that can respond to multiple stimuli are being actively studied and referred to as “soft crystals”.38
Garcia et al. reported chromic metal complexes with SA derivatives.39–42 The [M(CH3OH)2(SAP)2(NCS)2] (M = CoII, NiII, MnII, and CuII; SAP = N-salicylideneaminopyridine) crystal exhibited thermochromism as a result of the enol–keto tautomerisation of the ligands, upon cooling with liquid nitrogen.39 Crystals of a dinuclear FeII complex with N-salicylidene-4-amino-1,2,4-triazole also exhibited thermochromism coloured from bright yellow to deep burgundy.41 However, no study on the successful synthesis of the photochromic metal complexes using SA derivatives has been reported to date.
In this study, two metal complexes with 3,5-di-tert-butyl-N-salicylideneaminopyridine (3,5-t-Bu-SAP) ligand, viz. [Ni(NCS)2(3,5-t-Bu-SAP)4] (Ni1) and [Co(NCS)2(3,5-t-Bu-SAP)4] (Co1), were synthesised and characterised (Fig. 2). The as-prepared complex crystals exhibited both photochromism and thermochromism. Surprisingly, the Co1 crystals also exhibited mechanochromism upon grinding in an agate mortar. The crystal structures were determined by single-crystal X-ray structural analysis, and the chromic properties were subsequently investigated. Finally, to investigate mechanochromism, that is, to elucidate the colour-change mechanism, UV-visible (UV-vis) spectra, X-ray Absorption Fine Structure (XAFS) spectra, Superconducting Quantum Interference Device (SQUID) measurement, and Fourier Transform Infrared (FT-IR) spectra were utilised.
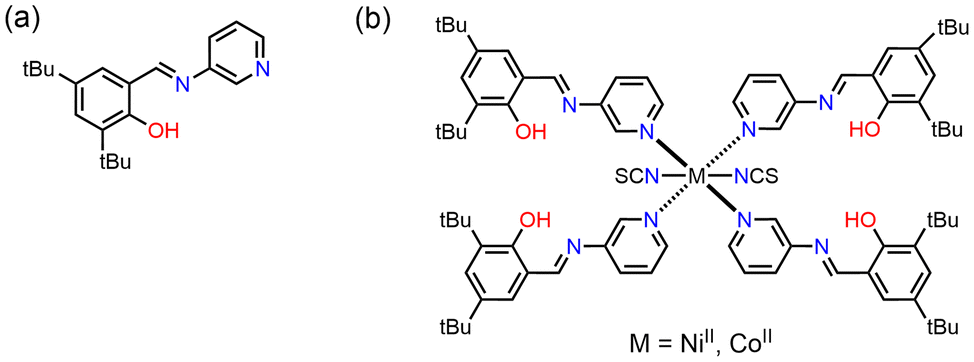 | ||
| Fig. 2 Chemical structure of 3,5-t-Bu-SAP (a), and the complexes Co1 and Ni1 (b). | ||
Experimental
Synthesis procedures of Ni1 and Co1
3-Aminopyridine and 3,5-di-tert-butyl-2-hydroxybenzaldehyde were purchased from Tokyo Chemical Industry Co., Ltd, nickel(II) chloride hexahydrate, cobalt(II) chloride hexahydrate, and ammonium thiocyanate were purchased from FUJIFILM Wako Pure Chemical Co., respectively. The SAP ligand, 3,5-t-Bu-SAP (Fig. 2a), was successfully synthesised following a previous study.43 A solution of ammonium thiocyanate (0.030 g, 0.40 mmol) dissolved in methanol (5.0 mL) was added to a solution of nickel(II) chloride hexahydrate (0.047 g, 0.20 mmol) or cobalt(II) chloride hexahydrate (0.047 g, 0.20 mmol) dissolved in methanol (5.0 mL). Subsequently, a solution of 3,5-t-Bu-SAP (0.25 g 0.80 mmol) dissolved in methanol (10 mL) was slowly added and mixed with the metal complex solution. The resulting solutions were slowly evaporated to obtain green (65% yield) or orange (70% yield) plate-like crystals, respectively. The purity of the crystalline samples was confirmed by powder X-ray diffractions. Anal. Calc. for C82H104N10O4S2Ni (Ni1): C, 69.5; H, 7.40; N, 9.89; S, 4.59. Found: 69.4; H, 7.56; N, 9.83; S, 4.43. Anal. Calc. for C82H104N10O4S2Co (Co1): C, 69.5; H, 7.40; N, 9.89; S, 4.53. Found: C, 69.5; H, 7.59; N, 9.83; S, 4.60.Single-crystal X-ray diffraction analysis
Single-crystal X-ray diffraction data were collected in the ω-scan mode using an R-AXIS RAPID imaging plate camera (Rigaku) with Mo-Kα radiation obtained from a rotating anode source with a graphite monochromator and an R-AXIS RAPID II imaging plate camera (Rigaku) with Cu-Kα radiation from a rotating anode source with a confocal multilayer. The integrated and scaled data were empirically corrected for absorption effects using ABSCOR.44 The initial structures were solved with SHELXT45 and refined on Fo with SHELXL.46 All non-hydrogen atoms were refined anisotropically. The crystallographic data are summarised in Table S1.†Crystalline or amorphous phase preparation of Co1
The crystalline and amorphous samples of Co1 for UV-vis, XAFS spectroscopy, TG-DTA, SQUID, IR and powder X-ray diffraction (PXRD) were prepared as follows. The amorphous phase was prepared by grinding crystals in an agate mortar for 30 min. In contrast, the crystalline sample was prepared by exposing the green amorphous phase to methanol vapour for one day.X-Ray absorption fine structure
XAFS spectra were recorded in transmission mode at the Rigaku Corporation facilities. Co K-edge (7708.8 eV) XAFS data were collected on a laboratory X-ray generator (Rigaku, 14 kV, 40 mA) with a focus size of 0.1 mm × 10 mm. The X-ray source was Mo with a LaB6 filament, and the white beam was monochromatised by a Ge(220) crystal monochromator (Fig. S6 and Table S6, 7†).Solid-state spectrum
The UV-vis spectra were recorded on a JASCO V-650 spectrometer equipped with an integrating sphere unit for diffuse reflectance spectroscopy. The samples were prepared by mixing the crystals (10 mg) with BaSO4 powder (100 mg). Photoirradiation was carried out with a UV-LED irradiator (High power UV-400 series, Keyence Corporation) at a wavelength of 365 nm. The sample was irradiated with UV light for 1 min with 50% maximum output at 298 K (the distance between the sample and the light source is 10 cm). To detect the thermochromic colour change, the UV-vis spectra of the cooled samples (liquid nitrogen) were also recorded on an S2000 miniature fibre optic spectrometer (OceanOptics) equipped with an integrating sphere comprising a DT 1000 CE (AIS) as the light source. IR spectra were recorded in the spectral range of 3500–500 cm−1 on a JASCO FT-IR 4100ST spectrometer using a KBr disk method (Fig. S10†).Thermal analysis
Thermogravimetry-differential thermal analysis (TG-DTA) data were recorded simultaneously on a Rigaku Thermo Plus EVO II TG8120 instrument. The samples were heated from 25.5 to 300 °C at 5 °C min−1 under a dry nitrogen atmosphere (flow rate = 100 mL min−1) (Fig. S1–3†).Magnetic analysis
The magnetic investigation was carried out with a SQUID magnetometer (Quantum Design MPMS) for orange crystalline and green amorphous phase of Co1, respectively. Powdery samples of crystalline and amorphous phase placed in a gelatin bag were subjected to measurements. The temperature dependence of magnetization was recorded under 10![[thin space (1/6-em)]](https://www.rsc.org/images/entities/char_2009.gif) 000 Oe external dc field. The magnetic measurement investigation was carried out from 5 K to 300 K and 270 K to 400 K (Fig. S8, 9 and Tables S8, 9†).
000 Oe external dc field. The magnetic measurement investigation was carried out from 5 K to 300 K and 270 K to 400 K (Fig. S8, 9 and Tables S8, 9†).
Results and discussion
Crystal structure of Ni1 and Co1 crystal
The Ni1 complex has an octahedral coordination geometry with two nitrogen-bound thiocyanate ions and four SAP ligands (Fig. 3a). The complex is placed on a crystallographic two-fold axis through the nickel ion centre, such that half of the molecule is independent. The metal–ligand bond lengths and angles are summarised in Tables S2 and S3.† These parameters suggest that the coordination geometry is compressed along the N(NCS)–Ni–N(NCS) axis (Z-in). The SAP ligands are coordinated to the central nickel ion on the pyridine moieties. All SAP ligands adopt a non-planar conformation with dihedral angles of 34.79(13) and 39.45(12)° (Fig. 3b), which are sufficiently large (>30°) for exhibiting photochromism. Only weak intermolecular interactions such as C–H⋯O and C–H⋯π were observed between the molecules in the crystal structure. The bulky tert-butyl groups of the SAP ligand prevented the creation of strong intermolar interaction with thiocyanate ions. Thus, the Ni1 crystal consisted of relatively loosed molecular packing. Although there is a small accessible void of 49 Å3 in the crystal structure, the crystal did not include any solvent, as observed by TG-DTA and elemental analysis (Fig. S1†).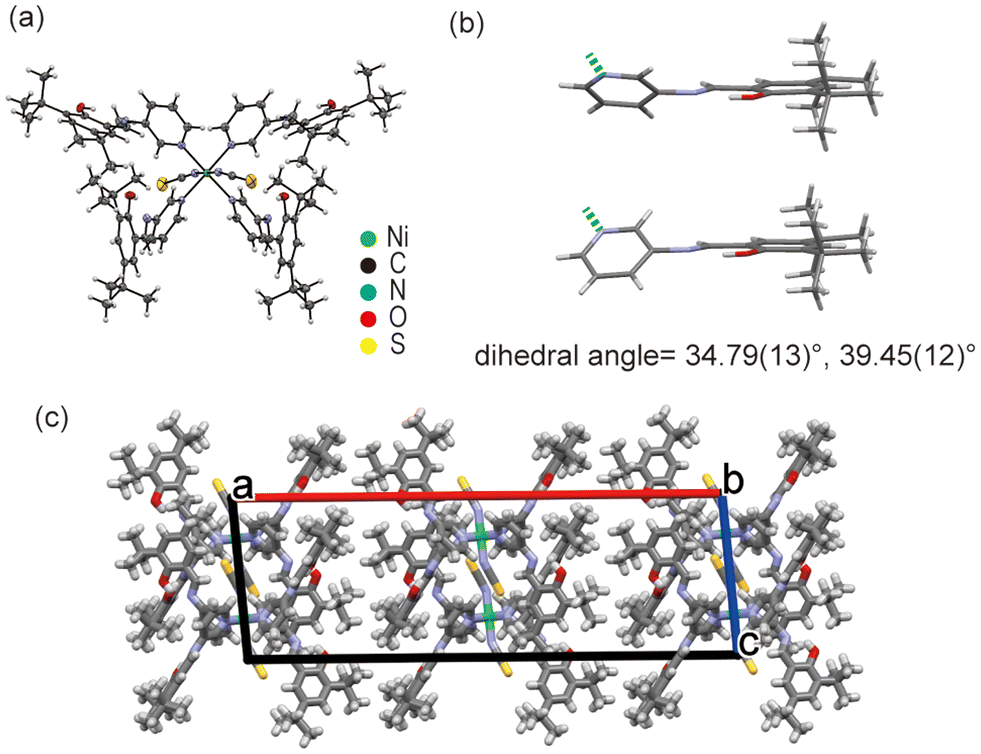 | ||
| Fig. 3 Crystal structure of Ni1. (a) ORTEP drawing with 50% probability, (b) dihedral angles of the SAP ligands, and (c) crystal packing along the b-axis. | ||
The Co1 crystal is isostructural to the Ni1 crystal (Fig. 4a). Tables S4 and S5† include the metal–ligand bond lengths and angles of the Co1 crystal. The SAP ligands adopt a non-planar conformation with large dihedral angles of 34.61(11)° and 39.30(11)°, suggesting that the Co1 crystals are also photochromic (Fig. 4b). Similar to that of Ni1, the Co1 crystal structure does not exhibit strong intermolecular interaction.
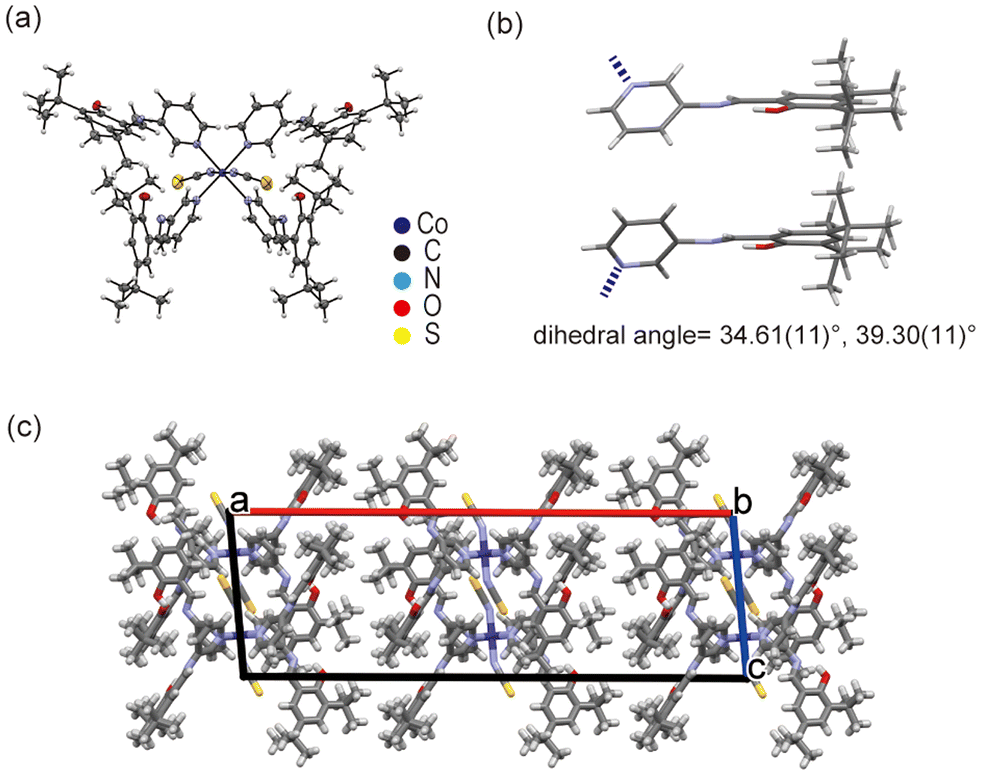 | ||
| Fig. 4 Crystal structure of Co1. (a) ORTEP drawing with 50% probability, (b) dihedral angles of the SAP ligands, and (c) crystal packing along the b-axis. | ||
Photo- and thermo-chromism of Ni1 crystal
The clear green Ni1 crystals display two absorption bands at ∼400 and ∼600 nm in the solid-state diffuse reflection spectra (Fig. 5a). The former strong band was assigned to the π–π* transition of cis-keto form of the SAP ligands. Whereas the latter weak band was attributed to 3A2g(F) → 3T1g(F) transition of a high-spin Ni(II) complex in an octahedral geometry.47 The Ni1 crystals undergo a colour change, from green to red, upon UV light irradiation (365 nm) and revert to the original green colour upon visible light irradiation (550 nm) or storage in a dark box (Fig. 6a). The diffuse reflection spectra before and after UV irradiation were compared to characterise this photochromic property (Fig. 5a). After UV irradiation, the absorption band at ∼500 nm increased in intensity. Moreover, the intensity of the absorption band decreased gradually when the coloured sample was placed under visible light. The reversible change in the spectra corresponds to the photo-induced isomerisation of SAP ligands between the cis-keto (orange) and the trans-keto (red) forms. Although the SAP ligands isomerised upon UV light irradiation, the weak absorption band attributed to the Ni(II) ion did not change, owing to the low isomerisation rates or the small complex structure change through the isomerisation. The Ni1 crystals also exhibited a thermochromic colour change, from green to violet, when the temperature was decreased using liquid nitrogen. Fig. 5b illustrates the UV-vis spectral change between 20 and −196 °C. The intensity of the absorption band at ∼450 nm decreases with a decrease in temperature due to the shift in tautomeric equilibrium from the cis-keto (orange) to enol (colourless) form. In addition, the absorption band of the Ni(II) complex moiety shifts slightly from 580 to 560 nm. The shift of the absorption band was attributed to the slight molecular structure change in the complex upon cooling.48 Tables S2 and S3† summarise the coordination bond lengths and angles at 20 and −180 °C, respectively. The coordination structure distorts slightly with a decrease in temperature. Moreover, the absorption band becomes sharper because the molecular thermal vibrations are reduced upon cooling. The spectral peaks regained the original intensities upon increase in temperature to 20 °C. These results indicate that the colour change induced by temperature variation is reversible.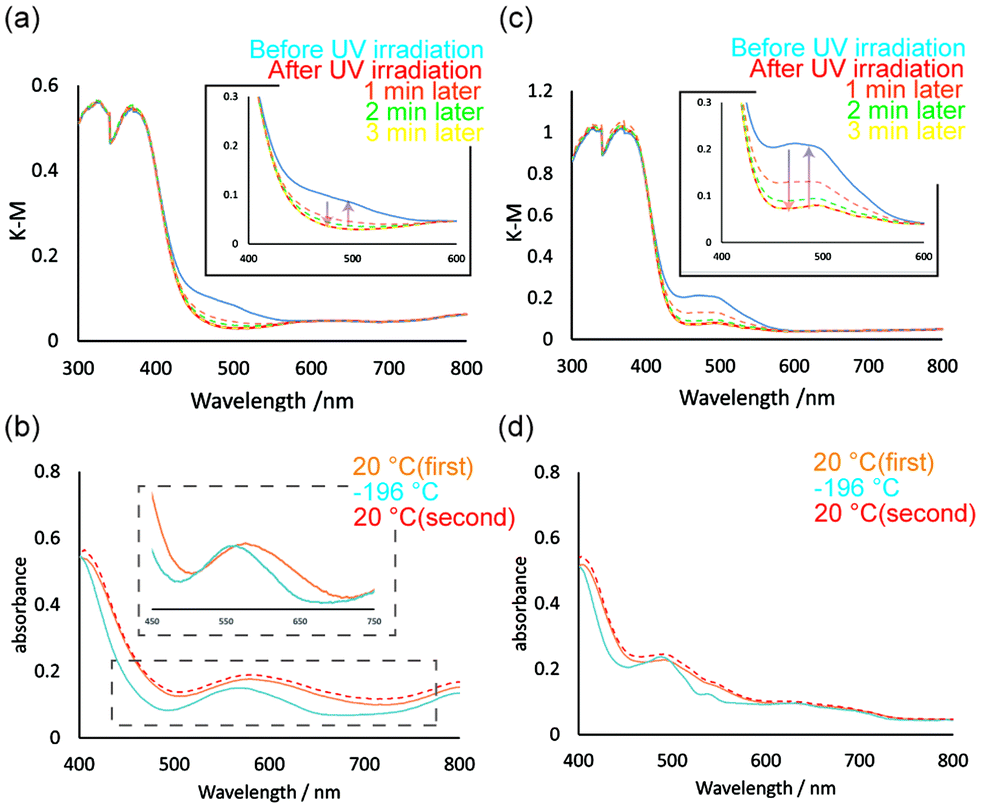 | ||
| Fig. 5 (a) and (c) UV-vis spectra of Ni1 and Co1 crystals before and after UV irradiation. The absorbance at 400–450 nm was increased upon UV light irradiation, and gradually decreased under visible light irradiation (550 nm). (b) and (d) UV-vis spectra of Ni1 and Co1 crystals for the temperature change from 20 °C to −196 °C to 20 °C. | ||
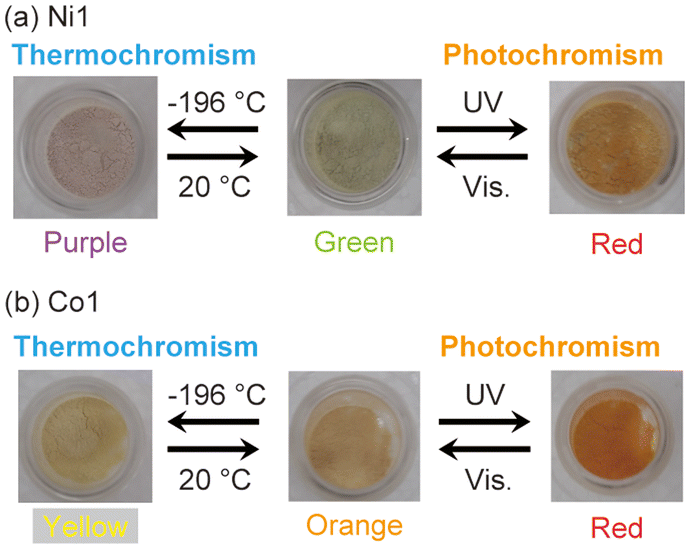 | ||
| Fig. 6 Images showing the photo- and thermochromic colour changes of the Ni1 (a) and Co1 (b) crystals; middle pictures were captured at 20 °C. | ||
Photo-, thermo, mechano-chromism of Co1 crystal
Co1 was expected to exhibit similar photochromic and thermochromic properties as those of Ni1 because its crystals are isostructural to those of Ni1. Indeed, the Co1 crystals exhibit both photochromism (orange to red) and thermochromism (orange to yellow) (Fig. 6b). In the UV-vis spectrum of Co1, two absorption bands were observed. The strong band at ∼450 nm was assigned to the π–π* transition of cis-keto form of the SAP ligands, whereas the very weak band at ∼500 nm can be assigned to 4T1g(F) → 4T1g(P) transition of a high-spin Co(II) ion in an octahedral geometry (Fig. 5c).49 Upon UV light irradiation, the intensity of the absorption band at ∼500 nm increases due to the SAP ligand isomerisation from the cis-keto to trans-keto form. The increased absorbance then decreased to the value before UV irradiation under the visible light irradiation. In contrast, the absorption band at ∼550 nm decreases due to the keto–enol tautomeric equilibrium with a decrease in temperature (Fig. 5d). In addition, the absorption band became sharper because of the reduction of the molecular thermal vibrations. Thus, an absorption peak corresponding to the Co(II) ion was clearly observed at −196 °C. When the temperature was reverted to 20 °C, the UV-vis spectra also reverted. Therefore, the reversible colour change of thermochromism was caused by the combination of the keto–enol tautomeric equilibrium shift of SAP ligands and the effect of sharpening in the spectrum upon cooling.Surprisingly, upon grinding in an agate mortar, the Co1 crystals transformed into the amorphous phase with a dramatic colour change from orange to green (Fig. 7). The green amorphous phase is relatively stable, which can be maintained for at least one month at 25 °C. Furthermore, the green colour (amorphous phase) changes to orange upon heating at 130 °C. The PXRD patterns indicate that the green amorphous phase reverts to the original orange crystalline phase upon heating. TG-DTA was performed for the green amorphous phase to clarify the thermal transformation. An exothermic peak was observed at 123 °C in the first heating cycle (20–150 °C; Fig. S3,† green DTA trace), consistent with crystallisation of the amorphous phase. After cooling to 20 °C (Fig. S3,† blue trace), no exothermic peak was observed at 123 °C during the second heating cycle (20–300 °C; Fig. S3,† red line), consistent with complete crystallisation of the amorphous phase during the first heating process. Furthermore, the green amorphous phase also crystallises into the original crystalline phase upon exposure to several organic solvent vapours, namely those of methanol, ethanol, acetone, ethyl acetate, hexene, acetonitrile, diethyl ether, and cyclohexane (Fig. S4†). PXRD patterns after exposing the organic solvent vapour are summarised in Fig. S5.† In the data, the PXRD patterns of hexene, diethyl ether, and cyclohexane are broadly compared to those of other solvents. This could be attributed to the solubilities of Co1 crystals in these organic solvents. Co1 crystals were almost insoluble in the former solvents and soluble in the latter solvents. The solvents with high affinity for Co1 are expected to support and promote the recrystallisation from amorphous phase. The reversible colour-change phenomena induced by mechanical stress is called mechanochromism. Moreover, it is also regarded as vapochromism because the colour was revered upon exposure to the organic solvent vapour. In most cases, mechanochromism occurs with a transformation from the crystalline to amorphous forms.50,51
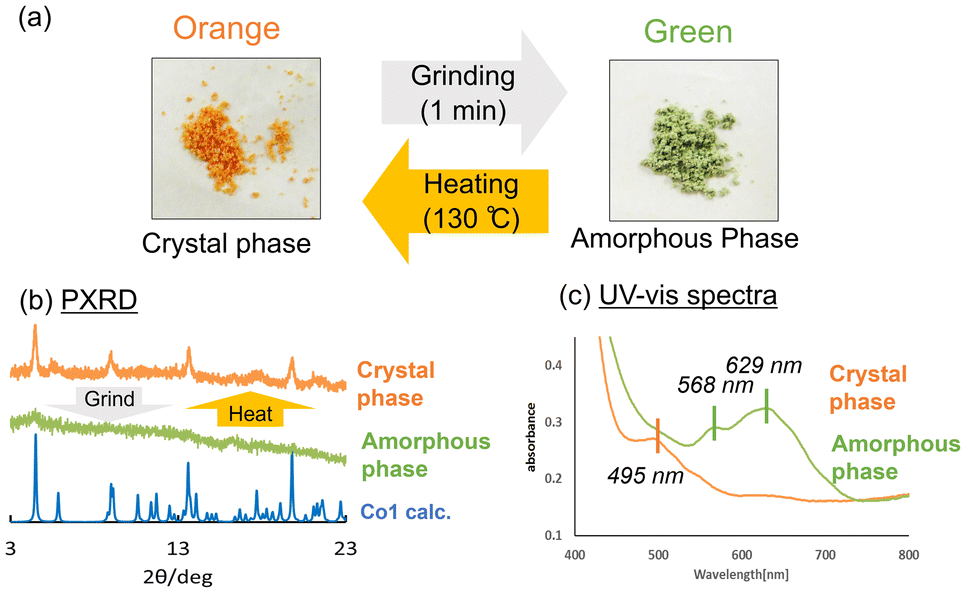 | ||
| Fig. 7 (a) Mechanochromism of the Co1 crystals. (b) PXRD patterns and (c) UV-vis spectra before (orange) and after (green) grinding. | ||
Interestingly, Ni1 crystal does not exhibit such mechanochromic color change, even though its crystal structure is similar to that of Co1. Thus, the mechanochromism mechanism would be attributed to the properties of metal complex rather than to the crystal structure. To elucidate the mechanochromism colour change mechanism, the green amorphous phase was structurally characterised using UV-vis, XAFS, IR spectroscopic analyses and magnetic measurement using SQUID. After grinding, a new absorption band centred at 568 and 629 nm was observed in the UV-vis spectra (Fig. 7).
The absorption band cannot be caused by the SAP ligands. The XAFS spectra of the crystalline and amorphous phases are displayed in Fig. S6.† X-ray Absorption Near-edge Structure spectra suggest no difference in the valence state of central Co(II) ion between crystalline and amorphous phases.
In contrast, the extended X-ray absorption fine structure spectra are slightly different for the crystalline and amorphous phases. The backscattering factor F(k) and phase shifting were estimated by curve fitting to the XAFS spectra of the crystal phase using crystal structure data as a model and are summarised in Table S6 and 7.† Compared to those in the crystalline phase, the amorphous phase Co⋯NSAP bond is shorter by 0.12 Å, while Co⋯NSCN is longer by 0.16 Å. Thus, the XAFS study suggests that the coordination geometry of the cobalt complex distorts like from Z-in to Z-out octahedral geometry upon grinding. Thus, Co1 could undergo a change in its complex structure via crystalline to amorphous phase transformation upon grinding. Owing to the complex structure distortion, the absorption band would be greatly changed, resulting in the amazing colour change from orange to green.
The magnetic measurement using SQUID revealed the Co(II) ions were in a high-spin state (S = 3/2) in both orange crystalline and green amorphous phases (Fig. S8 and Table S8†). The magnetic investigation result indicated the mechanochmism is not related to spin-state change in solid state. The green amorphous phase transformed to the orange crystalline phase at 393 K. Then, additional magnetic measurements were performed from 270 to 400 K to investigate magnetic change via the thermal phase transition (Fig. S9†). The magnetic moment (χ) for the green amorphous decreased irregularly around 350 K. Such behaviour was not observed in orange crystalline phase. Moreover, after the SQUID measurement for green amorphous, the sample colour changed from green to orange. That means the Curie constant slightly changed near the transition temperature from green amorphous to orange crystal phase. The difference in behaviour of magnetic moment with respect to temperature would suggest the complex structural change between green amorphous phase to orange crystal phase. FT-IR spectra were almost similar when comparing orange crystalline and green amorphous phase (Fig. S10†). In the FT-IR spectrum of orange crystal, a high intensity band ν(CN) at 2048 cm−1 was observed. On the other hand, the identical band is broadened and slightly shifted (at 2058 cm−1) in green amorphous phase. The broadening of the ν(CN) band might be due to some distortion or change of cobalt complex structure.
Thus, the XAFS, SQUID, and IR analyses suggested that the structural distortion of the Co(II) complex occurred in the transition from the orange crystal to the green amorphous phase by grinding without a change in the valence or spin state of the central cobalt ion. Therefore, the mechanochromic colour change (absorption band change from 495 nm to 568 nm and 629 nm) was attributed to the change in d-orbital energy level due to the change in the structure of Co(II) complex. On the other hand, the Ni1 complex did not show a significant colour change upon grinding. The electronic transitions for Co(II) and Ni(II) ion with an octahedral coordination are different due to the difference in d electron number and configuration. Therefore, the optical absorption properties of the Ni1 complex would not change significantly even if the d orbitals energy levels were changed by the structure distortions or changes of the Ni(II) complex upon grinding.
Additionally, the green amorphous phase exhibits photochromism (green to orange) and slight thermochromism (green to turquoise) due to SAP ligand isomerisation (Fig. S10 and 11†). The photo- and thermo-chromic colours are significantly different from the orange crystalline phase due to the absorption band changes of cobalt complex moiety.
Conclusions
In this study, metal complexes containing SAP molecules as ligands were synthesised to develop novel chromic materials exhibiting new colours and three types of chromism. The crystals of the Ni(II) complex with SAP ligands (Ni1) exhibit photochromism (green to red) and thermochromism (green to purple) due to molecular isomerisation of the SAP ligands by external stimuli. These chromic colour changes, including green and purple, are modified by the weak absorption band of the octahedral Ni(II) ion. The isostructural complex Co1 exhibits several kinds of chromism, including mechanochromism (orange to green), photochromism (orange to red), and thermochromism (orange to yellow). The mechanism of mechanochromism was presumed to be caused by the coordination geometry distortion or change upon amorphisation by grinding. Moreover, the third reversible colour-change phenomenon can be called vapochromism because the grind-induced colour reverted to the original upon exposure to the organic solvent vapours. The triple-chromism phenomenon is considered a hybrid of an organic reaction (isomerisation of SAP ligands) and inorganic reaction (coordination structure change). Metal complex formation with organic chromic compounds as ligands is an attractive methodology for the development of new chromic materials, and such hybrid chromic materials can potentially be applied as multiple sensors and switching devices.Author contributions
Haruki Sugiyama and Hidehiro Uekusa contributed to the conception, experimental design, material synthesis, data acquisition, and manuscript preparation. Atsuko Arita contributed to sample preparation, data acquisition. Akiko Sekine contributed to the data analysis and discussion.Data availability
The data supporting this article have been included as part of the ESI.†Crystallographic data for Co1 and Ni1 has been deposited at the CCDC 2045507–2045509 and 2056772†.
Conflicts of interest
There are no conflicts to declare.Acknowledgements
The authors would like to thank Dr Sasaki and Dr Taguchi from the Rigaku Corporation (Tokyo, Japan) for recording and analysing the XAFS spectra. The authors also would like to thank Prof. Kawaji from Institute of Science Tokyo (Tokyo, Japan) and Dr Ishikado from CROSS (Ibaraki, Japan) for recording the magnetic susceptibility change. Part of the magnetic susceptibility measurements were performed at the CROSS user laboratories. Part of this work was supported by JSPS KAKENHI Grant Number JP22K05032 and JP24H00005 (HU), and Sasakawa Scientific Research Grant from Japan (HS).References
- H. Dürr and H. Bouas-Laurent, Photochromism: Molecules and systems, 2003 Search PubMed.
- J. H. Day, Chem. Rev., 1963, 63, 65–80 CrossRef CAS.
- J. H. Day, Chem. Rev., 1968, 68, 649–657 CrossRef CAS.
- M. G. Babashkina, D. A. Safin, M. Bolte and Y. Garcia, Dalton Trans., 2011, 40, 8523–8526 RSC.
- T. Seki, Y. Takamatsu and H. Ito, J. Am. Chem. Soc., 2016, 138, 6252–6260 CrossRef CAS PubMed.
- K. Takao, Y. Tone, C. Hennig, S. Inoue and T. Tsubomura, Inorg. Chem., 2012, 51, 4850–4854 CrossRef CAS PubMed.
- S. D. Helland, A. S. Chang, K. W. Lee, P. S. Hutchison, W. W. Brennessel and W. T. Eckenhoff, Inorg. Chem., 2020, 59, 705–716 CrossRef CAS PubMed.
- T. Okamura, Y. Tomita and K. Onitsuka, Inorg. Chem., 2020, 59, 1164–1168 CrossRef CAS PubMed.
- M. Kato, M. Yoshida, Y. Sun and A. Kobayashi, J. Photochem. Photobiol., C, 2022, 51, 100477 CrossRef CAS.
- J. R. Farrell, D. P. Lavoie, R. T. Pennell, A. Çetin, J. L. Shaw and C. J. Ziegler, Inorg. Chem., 2007, 46, 6840–6842 CrossRef CAS PubMed.
- A. N. Woodward, J. M. Kolesar, S. R. Hall, N.-A. Saleh, D. S. Jones and M. G. Walter, J. Am. Chem. Soc., 2017, 139, 8467–8473 CrossRef CAS PubMed.
- A. Jaffe, Y. Lin, W. L. Mao and H. I. Karunadasa, J. Am. Chem. Soc., 2015, 137, 1673–1678 CrossRef CAS PubMed.
- H. Liu, Y. Gu, Y. Dai, K. Wang, S. Zhang, G. Chen, B. Zou and B. Yang, J. Am. Chem. Soc., 2020, 142, 1153–1158 CrossRef CAS PubMed.
- T. Fukaminato, T. Sasaki, T. Kawai, N. Tamai and M. Irie, J. Am. Chem. Soc., 2004, 126, 14843–14849 CrossRef CAS PubMed.
- H. Mizuno, T. K. Mal, M. Wälchli, A. Kikuchi, T. Fukano, R. Ando, J. Jeyakanthan, J. Taka, Y. Shiro, M. Ikura and A. Miyawaki, Proc. Natl. Acad. Sci. U. S. A., 2017, 27, 9227–9232 Search PubMed.
- J. Harada, H. Uekusa and Y. Ohashi, J. Am. Chem. Soc., 1999, 121, 5809–5810 CrossRef CAS.
- E. Hadjoudis and I. M. Mavridis, Chem. Soc. Rev., 2004, 33, 579–588 CAS.
- T. Fujiwara, J. Harada and K. Ogawa, J. Phys. Chem. B, 2004, 108, 4035–4038 CrossRef CAS.
- K. Johmoto, T. Ishida, A. Sekine, H. Uekusa and Y. Ohashi, Acta Crystallogr., Sect. B:Struct. Sci., 2012, 68, 297–304 CrossRef CAS PubMed.
- H. Sugiyama and H. Uekusa, CrystEngComm, 2018, 20, 2144–2151 RSC.
- H. Sugiyama, K. Johmoto, A. Sekine and H. Uekusa, Cryst. Growth Des., 2019, 19, 4324–4331 CrossRef CAS.
- S. D. Chatziefthimiou, Y. G. Lazarou, E. Hadjoudis, T. Dziembowska and I. M. Mavridis, J. Phys. Chem. B, 2006, 110, 23701–23709 CrossRef CAS PubMed.
- K. Johmoto, A. Sekine and H. Uekusa, Cryst. Growth Des., 2012, 12, 4779–4786 CrossRef CAS.
- R. K. Weerasekara, H. Uekusa and C. V. Hettiarachchi, Cryst. Growth Des., 2017, 17, 3040–3047 CrossRef CAS.
- M. Milek, F. W. Heinemann and M. M. Khusniyarov, Inorg. Chem., 2013, 52, 11585–11592 CrossRef CAS PubMed.
- B. Rösner, M. Milek, A. Witt, B. Gobaut, P. Torelli, R. H. Fink and M. M. Khusniyarov, Angew. Chem., Int. Ed., 2015, 54, 12976–12980 CrossRef PubMed.
- M. Kojima, K. Nakajima, M. Tsuchimoto, P. M. Treichel, S. Kashino and Y. Yoshikawa, Proc. Jpn. Acad., Ser. B, 1995, 71, 175–178 CrossRef.
- T. Seki, T. Ozaki, T. Okura, K. Asakura, A. Sakon, H. Uekusa and H. Ito, Chem. Sci., 2015, 6, 2187–2195 RSC.
- A. Abedi, N. Safari, V. Amani and H. R. Khavasi, Dalton Trans., 2011, 40, 6877–6885 RSC.
- G. Mehlana, C. Wilkinson, G. Ramon and S. A. Bourne, Polyhedron, 2015, 98, 224–229 Search PubMed.
- D. Peng, L.-H. He, P. Ju, J.-L. Chen, H.-Y. Ye, J.-Y. Wang, S.-J. Liu and H.-R. Wen, Inorg. Chem., 2020, 59, 17213–17223 CrossRef CAS PubMed.
- X.-W. Chen, L.-H. He, P. Ju, J.-L. Chen, S.-J. Liu and H.-R. Wen, J. Mater. Chem. C, 2020, 8, 16160–16167 RSC.
- K. Ohno, S. Yamaguchi, A. Nagasawa and T. Fujihara, Dalton Trans., 2016, 45, 5492–5503 RSC.
- Q.-Y. Yang, H.-H. Zhang, G. Xu, Z.-X. Diao, Z.-M. Zhou, D.-S. Zhang, X.-H. Chen, X.-P. Zhang and Z.-F. Shi, Inorg. Chim. Acta, 2021, 515, 120072 CrossRef CAS.
- Y.-F. Hsu, S.-Y. Chen, S. Maity, Y.-H. Liu, S.-M. Peng and J.-S. Yang, Dalton Trans., 2020, 49, 15602–15606 Search PubMed.
- K. Nagura, S. Saito, H. Yusa, H. Yamawaki, H. Fujihisa, H. Sato, Y. Shimoikeda and S. Yamaguchi, J. Am. Chem. Soc., 2013, 135, 10322–10325 CrossRef CAS PubMed.
- K. Salikolimi, M. Kawamoto, P. He, T. Aigaki and Y. Ito, Polym. J., 2017, 49, 429–437 Search PubMed.
- M. Kato, H. Ito, M. Hasegawa and K. Ishii, Chem. – Eur. J., 2019, 25, 5105–5112 CrossRef CAS PubMed.
- F. Robert, A. D. Naik, B. Tinant, R. Robiette and Y. Garcia, Chem. – Eur. J., 2009, 15, 4327–4342 Search PubMed.
- F. Robert, B. Tinant, R. Clérac, P.-L. Jacquemin and Y. Garcia, Polyhedron, 2010, 29, 2739–2746 Search PubMed.
- Y. Garcia, F. Robert, A. D. Naik, G. Zhou, B. Tinant, K. Robeyns, S. Michotte and L. Piraux, J. Am. Chem. Soc., 2011, 133, 15850–15853 Search PubMed.
- F. Robert, A. D. Naik, B. Tinant and Y. Garcia, Inorg. Chim. Acta, 2012, 380, 104–113 CrossRef CAS.
- H. Sugiyama and H. Uekusa, CrystEngComm, 2018, 20, 2144–2151 RSC.
- T. Higashi, ABSCOR, Rigaku Corporation, Tokyo, Japan, 1995 Search PubMed.
- G. M. Sheldrick, Acta Crystallogr., Sect. C:Struct. Chem., 2015, 71, 3–8 CrossRef PubMed.
- G. M. Sheldrick, Acta Crystallogr., Sect. A:Found. Adv., 2015, 71, 3–8 CrossRef PubMed.
- C. Ochs, F. E. Hahn and T. Lügger, Eur. J. Inorg. Chem., 2001, 2001, 1279–1285 CrossRef.
- T. Hamaguchi and I. Ando, Inorg. Chim. Acta, 2015, 427, 144–149 CrossRef CAS.
- A. Saritha, B. Raju, M. Narsimhulu, D. N. Rao, P. Raghavaiah and K. A. Hussain, Dalton Trans., 2016, 45, 8500–8505 RSC.
- T. Suzuki, H. Okada, T. Nakagawa, K. Komatsu, C. Fujimoto, H. Kagi and Y. Matsuo, Chem. Sci., 2018, 9, 475–482 RSC.
- H. Sakai, T. Sumi, D. Aoki, R. Goseki and H. Otsuka, ACS Macro Lett., 2018, 7, 1359–1363 CrossRef CAS PubMed.
Footnote |
| † Electronic supplementary information (ESI) available. CCDC 2045507–2045509 and 2056772. For ESI and crystallographic data in CIF or other electronic format see DOI: https://doi.org/10.1039/d4dt01755b |
| This journal is © The Royal Society of Chemistry 2025 |