 Open Access Article
Creative Commons Attribution 3.0 Unported Licence
Synthesis, XRD and DFT studies on Pb[ChCN]2 (Ch = O, S, Se) and Pb[SeCN][OH]†
Alena
Shlyaykher
a,
Aleksandar
Živković
 bc,
Hennes
Günther
a,
Anna Lea
Barba
a,
Nora H.
de Leeuw
 bd and
Frank
Tambornino
 *a
*a
aPhilipps-Universität Marburg, Hans-Meerwein Straße 4, Marburg, DE-35032, Germany. E-mail: frank.tambornino@chemie.uni-marburg.de
bDepartment of Earth Sciences, Utrecht University, 3548CB Utrecht, The Netherlands
cInstitute of Inorganic Chemistry, Christian-Albrecht University of Kiel, 24118 Kiel, Germany
dSchool of Chemistry, University of Leeds, Leeds LS2 9JT, UK
First published on 14th November 2024
Abstract
We report on the synthesis of Pb[ChCN]2 (Ch = O, S, Se) and Pb[SeCN][OH] and their hitherto unknown crystal structures. All products were fully characterized by single-crystal and powder X-ray diffraction. Bulk analysis was performed by Rietveld refinement, elemental analysis, differential scanning calorimetry–thermogravimetric analysis (DSC–TGA), and solid-state Raman spectroscopy. Quantum-mechanical calculations based on the density functional theory allowed optimization of the structural parameters of these lead-based compounds, as well as assessment of their electronic structures and detailed assignment and interpretation of the vibrational spectra. In addition, the origin of bands related to difficulties in assigning the exact position of H atoms in the structures was resolved.
Introduction
Chalcogenocyanates are archetypal pseudohalide anions with the general formula [ChCN]− (Ch = chalcogen). Four of the six theoretically possible candidates have been synthesized so far: cyanate [OCN]−, thiocyanate [SCN]−, selenocyanate [SeCN]−, and tellurocyanate [TeCN]−. However, only the binary salts of the two lightest homologues have been well researched and feature in introductory and general chemistry textbooks.1 One of the prominent compounds in the series of cyanates is ammonium cyanate, [NH4][OCN]. Almost 200 years ago Liebig and Wöhler discovered its ability to rearrange into urea, [NH2]2CO, a compound with the same sum formula but different structure. From this finding, they deduced the, at the time, revolutionary concept of isomerism, which has remained essentially unchanged until the present day.2 However, not only ammonium cyanate, but also a number of quasi-binary metal cyanates show the ability to yield urea, e.g., by heating with water. Lead cyanate, Pb[OCN]2, reacts with two equivalent measures of water to produce urea and lead carbonate, Pb[CO3], which allows the facile synthesis of pure urea. The progress of this reaction can be observed by the transformation of crystalline Pb[OCN]2 to an amorphous solid of lead carbonate Pb[CO3].3,4 The first mention of Pb[OCN]2 dates back to the year 1815, when Gay-Lussac combined lead(II/IV) oxide, Pb3O4, with an aqueous solution of cyanogen, [CN]2. The reaction mixture was transformed from a colourless suspension to a lemon-yellow solution, which was observed to react with calcium carbonate to form ammonia.5 In 1823, Wöhler synthesized Pb[OCN]2 from aqueous solutions of lead acetate and a cyanate and isolated the product as a white, light-polarising, crystalline precipitate, which was only slightly soluble in water, but soluble in ammonia.3,6 However, the only reported analytical data for Pb[OCN]2 was the elemental analysis of lead performed by precipitating it as lead sulphate.In the past, a compound erroneously identified as Pb[SCN]2 was synthesized by Liebig7 by adding a neutral solution of lead salt to a moderately concentrated solution of an alkali metal thiocyanate. The product was obtained in the form of white to faintly yellow anhydrous crystals, which were only sparingly (about 1%) soluble in cold water. As was known for several (pseudo-)halide salts, Pb[SCN]2 was slightly more soluble in solutions of thiocyanates.8 In addition, it was mentioned that Pb[SCN]2 synthesized from lead acetate was sensitive towards light and turned dark. It was found later that synthesis in a neutral medium delivered a mixture of lead thiocyanate, Pb[SCN]2, and basic lead thiocyanate, Pb[SCN][OH]. The crystal structure of Pb[SCN]2 was determined in 1966,9 followed in 1995 by a revised and more accurate model.9,10 Pure lead thiocyanate hydroxide, Pb[SCN][OH], can also be obtained by boiling crystals of Pb[SCN]2 in water, or by precipitating an aqueous thiocyanate solution with basic lead acetate, the latter leading to a white curd-like precipitate. By combining with lead halide salts, Pb[SCN]2 is converted to a number of “double salts”, e.g. water-soluble Pb[SCN]2·PbCl2, Pb[SCN]2·PbI2, and Pb[SCN]Cl, or the less soluble Pb[SCN]2·8 PbBr2.8
Recently, Pb[SCN]2 has found application as a material for photovoltaic elements. For example, (CH3NH3)2Pb(SCN)2I2 was synthesized by halide substitution starting from CH3NH3PbI3 and it was shown to be a promising candidate for lower-dimensional hybrid-halide compounds.11 Other reports demonstrated that materials with the pseudo-halide [SCN]− show higher moisture tolerance, device stability in solar cells, and reduced trap-assisted recombination.12–15
The synthesis of the heaviest compound in the series, lead selenocyanate, Pb[SeCN]2, was reported as early as 1851.16 The product was obtained as “lemon-yellow” needles by precipitation from a boiling acidic suspension of lead oxide with an aqueous solution of K[SeCN] and subsequent recrystallization. Pb[SeCN]2 was solely analysed by elemental analysis and described as insoluble in alcohol and thermally stable up to 100 °C. Further analytical data were not reported.16
Here, we report on the synthesis of Pb[OCN]2, Pb[SeCN]2 and Pb[SeCN][OH], as well as their hitherto unknown crystal structures, properties obtained from solid-state density functional theory calculations, vibrational spectra and thermal behaviour. In this context, the crystal structure and properties of the related Pb[SCN]2 are revisited.
Experimental section
General synthetic methods
All reactions and operations were performed in air. Lead acetate trihydrate (university stocks, purity confirmed by PXRD), potassium hydroxide (85.0%, Chemsolute), potassium cyanate (97%, Merck), potassium thiocyanate (university stocks, purity confirmed by PXRD), deuterium oxide (99.9%, www.deutero.de), and acetic acid (99–100%, GPR Rectapur) were obtained from commercial sources. Potassium selenocyanate was prepared following the literature procedure.1 Sodium deuteroxide was prepared following the literature procedure.17Methods
Single-crystal X-ray structure determination
Single-crystal X-ray diffraction data were collected using an IPDS-2 (STOE, Darmstadt) diffraction system equipped with a source of mirror-monochromated Mo Kα radiation (λ = 0.7107 Å, Xenocs Microfocus Source) and an Image Plate detector. Crystals were selected under Paratone-N oil, mounted on micromount loops, and quench-cooled using an Oxford Cryosystems open-flow N2 cooling device. Data were collected at 100 K or 180 K and processed using the X-Area program package, including unit-cell parameter refinement and interframe scaling (which was carried out using LANA within X-Area).18 The structure was subsequently solved using direct dual-space methods (SHELXT19) and refined on F2 with SHELXL using the Olex220 user interface. The crystal structure drawings were generated with DIAMOND.21Powder X-ray diffraction
Powder X-ray diffraction patterns were recorded on a STADI MP (STOE, Darmstadt) powder diffraction system equipped with a source of mirror-monochromatized Cu-Kα1 radiation (λ = 1.54175 Å) and a silicon-strip MYTHEN 1K detector. Data were collected at room temperature in transmission mode (Debye–Scherrer geometry). The powder samples were ground in agate mortars and flame-sealed in glass capillaries (inner diameter: 0.3 mm, Hilgenberg, Malsberg, Germany). For additional details, see Table S3.† Subsequent Rietveld refinements22 were performed with the TOPAS 7.0 program package.23 The structural models derived from single-crystal X-ray data were used as starting points for the refinements. Background functions were modelled using shifted Chebyshev polynomials, and profile functions were described with the modified Thompson–Cox–Hastings pseudo-Voigt “TCHZ” function as implemented in TOPAS. For additional details, see Table S3.† High-temperature powder X-ray diffraction patterns were recorded on a STADI P (STOE, Darmstadt) powder diffraction system equipped with a source of mirror-monochromatized Ag-Kα1 radiation (λ = 0.55941 Å) and a silicon-strip MYTHEN 1K detector. Data were collected in transmission mode (Debye–Scherrer geometry).Quantum-mechanical calculations
Density functional theory (DFT) calculations were performed using the all-electron code CRYSTAL.24–27 The global hybrid B3LYP exchange-correlation functional was used throughout the work28,29 (unless stated otherwise) together with the Peintinger–Oliveira–Bredow triple-ζ-valence + polarization basis set (pob-TZVP rev2).30 For Pb, an effective core potential was used. The Coulomb and exchange series were summed directly and truncated using overlap criteria with thresholds of 10–7, 10–7, 10–7, 10–7, and 10–14, as described previously.31,32 Reciprocal space33 was sampled according to a shrinking factor (input IS) of (3 7 3) for bulk Pb[SeCN]2 and Pb[SeCN][OH] and (7 7 3) for Pb[SCN]2 and Pb[OCN]2. Long-range dispersion corrections were included using the semiempirical D3 approach of Grimme et al. with Becke–Johnson damping.34–36 Band structure calculations were performed on optimized geometries along high-symmetry directions obtained using the SeeK-path interface.37Infrared and Raman intensities were calculated analytically through the coupled-perturbed/Kohn–Sham approach for the harmonic vibrational analysis.38,39 Integrated Raman intensities were normalised so that the most intense peak was set to 1000. The peak width is not explicitly available within this treatment; thus, it was kept constant. The spectra were constructed by using the transverse optical modes and adopting a pseudo-Voigt function with the default VOIGT and DAMPFAC variables of 1.0 (pure Lorentzian functions) and 8.0 (full width at half maximum used for the spectra), respectively. The temperature and laser wavelength, considered through a prefactor in the expression for the Raman integrated intensity, were set to 295 K and either 532 nm or 633 nm to facilitate comparison with experimental measurements.
Anharmonicity was treated using two different approaches. In the first approach, anharmonic effects were taken into account only for the O–H stretching mode by numerically solving the one-dimensional Schrödinger equation.40,41 In the second approach, anharmonic vibrational states were computed by solving the vibrational self-consistent field (VSCF) equations (where each mode interacts with an average potential of all the other modes) and the vibrational configuration interaction (VCI) equations, which allow for explicit mode–mode coupling treatment.42,43 The Energy–Gradient–Hessian (EGH) two-point finite difference scheme was used to compute high-order energy derivatives with a displacement of 0.9 in terms of the classical amplitude of each normal mode.44 By exploiting point symmetry, the number of distinct atomically displaced nuclear configurations that need to be explored for energy and force calculations is significantly reduced and made computationally tractable.45
Vibrational spectroscopy
Raman spectra were recorded on a MonoVista CRS + confocal Raman microscope (Spectroscopy & Imaging GmbH) using a 532 nm or 633 nm solid-state laser and a 300 grooves per mm grating. Samples were sealed in borosilicate ampoules at room temperature. Post-acquisition treatment of Raman spectra was achieved with the Origin46 program package.Thermogravimetric analysis/differential scanning calorimetry (TGA/DSC) measurements
TGA/DSC measurements were performed by in-house service personnel under a nominally dry nitrogen atmosphere in an MBraun UNIlab glovebox using a DSC-TGA 3 (Mettler Toledo) device. Post-acquisition treatment of the data was performed with the Origin46 program package.Elemental Analysis
Elemental analyses were performed by the in-house service personnel. CHN analyses were performed on a CHNS(S)-Analysator Vario MICRO CUBE (Elementar).UV-vis spectroscopy
Optical absorption spectra were collected on a Varian Cary 5000 UV/Vis/NIR spectrometer in the range of 200–800 nm in diffuse reflectance mode employing a Praying Mantis accessory (Harrick) with automatic baseline correction. Ba[SO4] was used as the white standard. To dilute the sample and reduce artefacts, the compounds were ground together with Ba[SO4] (10% of the studied compound by weight). The raw data were transformed from reflectance R to absorption according to the Kubelka–Munk function (F(R) = (1 − R)2/2R).Results and discussion
Pb[OCN]2 and Pb[SeCN]2 crystallize in the orthorhombic space group Pnma (No. 62). However, they do not crystallize as isotypical structures and, surprisingly, neither compound crystallizes as an isotypical structure with their sulfur analogue Pb[SCN]2 (C2/c, No. 15).47Synthesis and crystal structure of Pb[OCN]2
Pb[OCN]2 was synthesized by combining an aqueous solution of K[OCN] with an aqueous solution of Pb[CH3COO]2. Colourless needles, suitable for SC-XRD, precipitated slowly. Afterwards, the product was filtered, washed with acetone and diethyl ether, and dried in air. In contrast to Pb[SCN]2 and Pb[SeCN]2, lead cyanate does not form the hydroxide Pb[OCN][OH] either in neutral or basic environments.At 100 K, Pb[OCN]2 crystallizes in the orthorhombic space group Pnma (No. 62) (a = 8.569(2), b = 3.9410(9), c = 11.660(3) Å) with four formula units in the unit cell, one crystallographically independent Pb site and two independent [OCN]− anions (Fig. 1; for additional data see Table S4†). All atoms in the unit cell occupy the Wyckoff position 4c (.m.).
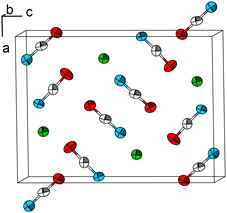 | ||
| Fig. 1 The crystal structure of Pb[OCN]2. Thermal displacement ellipsoids are drawn at the 75% probability level at 100 K. Green: Pb, white: C, blue: N, red: O. | ||
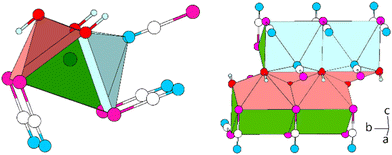
The Pb cation is coordinated by a total number of nine atoms with CNPb = 6 + 3 in the form of tricapped trigonal prisms with a continuous symmetry measure (csm) of 1.9400.48 The csm quantifies the minimal distance of movement that the points of an object have to undergo in order to transform into a shape of the desired symmetry (perfect polyhedra strive for csm = 0 and the maximum value of distortion strives for infinity).48,49 The trigonal prism is built of four N and two O atoms of altogether six cyanate anions (CN “6”, Fig. 2, left). Pb–N and Pb–O distances are within the expected range for the sum of their ionic radii (d(Pb–N) = 2.589(9)–2.685(8) Å, d(Pb–O) = 2.827(8) Å).50 Both faces of the prism, which are built from two N and two O atoms, are capped by O atoms of adjacent cyanate anions, respectively (d(Pb–O) = 2.895(10) and 3.173(11) Å, CN “+2”). The face of the prism built from four N atoms is capped by an N atom of an additional cyanate anion (d(Pb–O) = 2.607(13) Å, CN “+1”). Both crystallographically independent [OCN]− anions are almost linear with ∡O–C–N = 176.8(16) and 178.8(18)°, respectively. Along [010] the polyhedra are interconnected via common O–N–N faces (basal planes of the trigonal prism) thus forming chains. The chains are connected to each other via common N–N edges thus forming “double-chains” (Fig. 2, right).
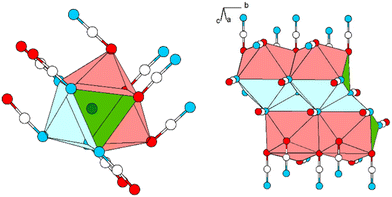 | ||
| Fig. 2 Excerpt of the crystal structure of Pb[OCN]2. Left: coordination polyhedron around Pb. Right: double-chain of polyhedra around Pb extending along [010]. Green: Pb, white: C, blue: N, red: O. | ||
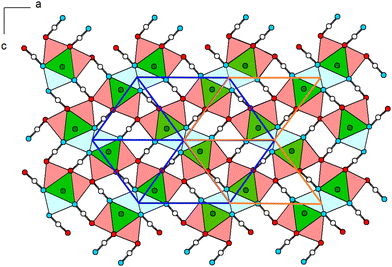
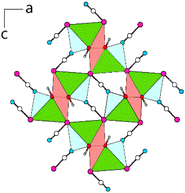
Within (101), the double-chains are connected via common [OCN]− anions (6× by O-terminus, 4× by N-terminus) as well as common O atoms of the [OCN]− anions (Fig. 3). Within the ac-plane the double-chains form the motif of a monoclinic/oblique rod packing (orange), which in this case is a distorted variant of the hexagonal rod packing (blue).
Phase purity was checked with PXRD and Rietveld refinement, which corroborated the model within close error margins (Fig. 4 and Table S3†).
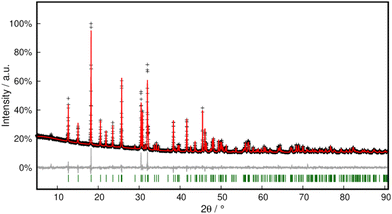 | ||
| Fig. 4 Rietveld refinement of Pb[OCN]2 at 298 K. Black crosses display measured data; the red line represents the refined model, green bars indicate Bragg positions and the grey line displays the difference plot. Further data are compiled in Table S3.† | ||
Synthesis and crystal structure of Pb[SCN]2
Pb[SCN]2 was synthesized via a modification of the literature procedure.7 To an aqueous solution of K[SCN], a small amount of concentrated acetic acid was added. Upon combining this solution with an aqueous solution of Pb[CH3COO]2, a colourless solid was precipitated immediately, which was washed with distilled water and dried in air. Single crystals of Pb[SCN]2 in the form of slightly yellow needles were obtained by layering a solution of Pb[CH3COO]2 with an aqueous and slightly acidified solution of K[SCN].At 100 K, Pb[SCN]2 crystallizes in the monoclinic space group C2/c (No. 15) (a = 9.6128(9), b = 6.5306(6), c = 8.1913(7) Å, β = 92.734(7)° ), (cf. Mokuolu & Speakman: a = 9.661(4), b = 6.544(3), c = 8.253(3) Å, β = 92.37(2)° ref. 47) with four formula units in the unit cell, one crystallographically independent Pb site and one independent [SCN]− anion (Fig. 5; for additional data see Table S4†). Here, the Pb atom occupies the Wyckoff position 4e (2), while the atoms of the [SCN]− anion lie in the Wyckoff position 8f (1).
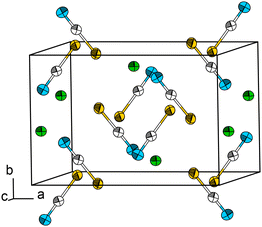 | ||
| Fig. 5 The crystal structure of Pb[SCN]2. Thermal displacement ellipsoids are drawn at the 50% probability level at 100 K. Green: Pb, white: C, blue: N, yellow: S. | ||
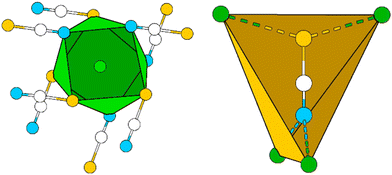
In Pb[SCN]2 the Pb atom lies on a two-fold rotation axis and is surrounded by four N (d(Pb–N) = 2.6820(3), 2.766(3) Å) and four S (d(Pb–S) = 2.9862(2), 3.1180(7) Å) atoms from eight [SCN]− units, forming a distorted tetragonal antiprism with a continuous symmetry measure (csm) of 0.7598 (Fig. 6, left). The basal planes of the antiprism are constructed by two N and two S atoms of four [SCN]− anions, respectively. The [SCN]− anions are surrounded by four Pb atoms in total: two are adjacent to the N terminus and two Pb atoms are adjacent to the S terminus, respectively. Alternatively, the coordination sphere can be described as a distorted hetero-disphenoid of four Pb atoms with the C atom as the center of the polyhedron (csm = 0.855249, Fig. 6, right).48
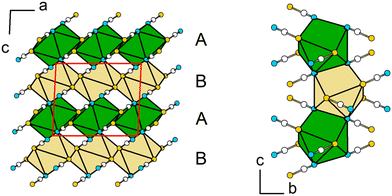
The antiprisms around Pb are connected to each other via two bridging [SCN]− anions along [010] and four common S-vertices within the ab-plane forming layers within [110] (Fig. 7, left). These layers are stacked along [001] in an ABAB motif, and are connected with each other by sharing common N,N-edges of individual polyhedra (Fig. 7, right).
Synthesis and crystal structure of Pb[SeCN]2
In the past, Pb[SeCN]2 has been reported to be synthesized by precipitation from a selenocyanate solution with lead acetate. After filtration of the suspension and crystallisation, lemon-yellow needles of the product were obtained. The salt was insoluble in alcohol, and stayed unchanged when heated to 100 °C.16 Akin to the synthesis of Pb[SCN]2, we repeated the described synthesis but were only able to obtain a mixture of Pb[SeCN]2 and Pb[SeCN][OH]. Pure Pb[SeCN]2 was synthesized by the modification of the literature procedure. To an aqueous solution of K[SeCN], a small amount of concentrated acetic acid was added. Upon combining this solution with an aqueous solution of Pb[CH3COO]2, the product precipitated immediately in the form of yellowish needles suitable for SC-XRD in 72% yield. It was filtered, washed with plenty of water to remove byproducts and subsequently dried under reduced pressure.At 100 K, Pb[SeCN]2 crystallizes in the orthorhombic space group Pnma (No. 62) (a = 12.479(2), b = 4.2277(9), c = 10.6523(17) Å) with four formula units in the unit cell, one crystallographically independent Pb site and two independent [SeCN]− anions (Fig. 8; for additional data see Table S4†). In Pb[SeCN]2, as well as in Pb[OCN]2, all atoms occupy the Wyckoff position 4c (.m.).
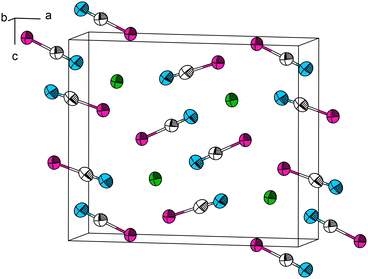 | ||
| Fig. 8 The crystal structure of Pb[SeCN]2. Thermal ellipsoids are drawn at the 90% probability level at 100 K. Green: Pb, white: C, blue: N, magenta: Se. | ||
The Pb cation is surrounded by a total number of 6 + 1 + 1 atoms in the form of a bicapped trigonal prism (csm = 3.5524). Here, two N and four Se atoms of six selenocyanate anions form a distorted trigonal antiprism (CN “6”, Fig. 9, left). Pb–N and Pb–Se distances are within the expected range for the sum of their ionic radii (d(Pb–N) = 3.016(6) Å, d(Pb–Se) = 3.0349(7), 3.1459(8) Å). The face of the prism constructed from four Se atoms is capped by an N atom of an additional selenocyanate unit (d(Pb–N) = 2.419(8) Å, CN “+1”). The N,N,Se,Se-face is capped by a Se atom of an additional cyanate anion (d(Pb–Se) = 3.2971(10) Å, CN “+1”). Along [010] the polyhedra are connected by common N,Se,Se-faces (basal planes) to each other, thereby forming chains. The chains are connected to each other via common Se-vertices to the zig-zag layers within [010] (Fig. 10).
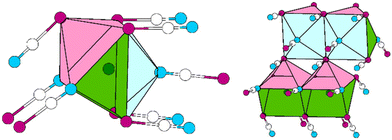 | ||
| Fig. 9 Excerpts of the crystal structure of Pb[SeCN]2. Left: coordination polyhedron around Pb. Right: double-chain of polyhedra around Pb along [010]. Green: Pb, white: C, blue: N, magenta: Se. | ||
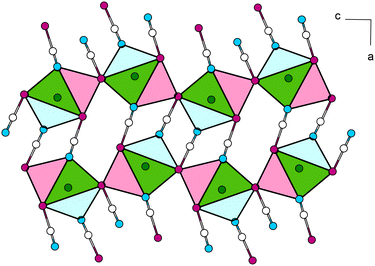 | ||
| Fig. 10 View of the crystal structure of Pb[SeCN]2 along [010]. Coordination polyhedra around Pb atoms are connected via common [SeCN]− units. Green: Pb, white: C, blue: N, magenta: Se. | ||
Single layers are connected via common almost linear [SeCN]− anions (∡Se–C–N = 177.6(9), 178.8(8)°), which run along [100] (Fig. 10).
Phase purity was checked with PXRD, and Rietveld refinement corroborated the model within close error margins (Fig. 11 and Table S3†).
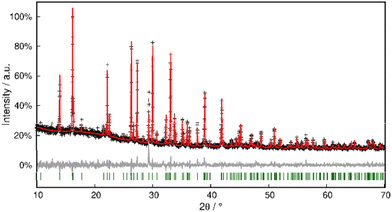 | ||
| Fig. 11 Rietveld refinement of Pb[SeCN]2 at 298 K. Black crosses display measured data; the red line represents the refined model, green bars indicate Bragg positions and the grey line displays the difference plot. Further data are compiled in Table S3.† | ||
For the three compounds discussed above, no trends for coordination polyhedra around the central Pb atoms were observed. Whereas in Pb[OCN]2, the Pb atom is surrounded by CN “6 + 3” atoms as a triple-capped trigonal antiprism, the Pb atom in Pb[SCN]2 shows a coordination of eight atoms as a tetragonal antiprism. In Pb[SeCN]2, the Pb atom is surrounded by 6 + 2 atoms as a bicapped trigonal prism. In Fig. 12, the shortest Pb–N und Pb–Ch distances of Pb[ChCN]2 are shown (Ch = O, S, Se). With the increase in the ionic radius of the chalcogen atom, both distances, Pb–N and Pb–Ch, increase, probably due to the increased space needed by the chalcogen atoms that coordinate the Pb atoms. In particular, the change in the Pb–N distance is noticeable.
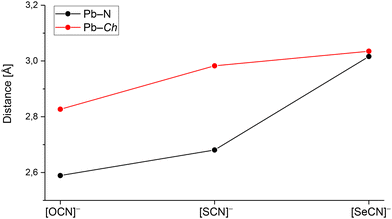 | ||
| Fig. 12 Pb–N and Pb–Ch distances in Pb[ChCN]2 (Ch = O, S, Se). For each salt the shortest distance was chosen. | ||
Furthermore, in the case of capped trigonal prisms in Pb[OCN]2 and Pb[SeCN]2, both are connected to each other by sharing common basal planes, forming rods. These rods are then connected by common edges of polyhedra to the double-chains. In Pb[SCN]2, a completely different motif was observed. Tetragonal antiprisms around Pb are connected by shared vertices and [SCN]− anions, forming layers. In conclusion, aside from the increase in the Pb–N and Pb–Ch interatomic distances, there are no clear trends visible. The bonding between Pb and the respective anions is ionic in nature and the different packing motifs likely affected by the size of the Ch atom.
Synthesis and crystal structure of Pb[SeCN][OH]
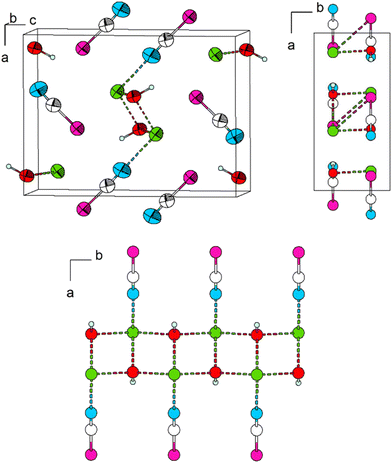
Impure basic lead selenocyanate, Pb[SeCN][OH], mixed with Pb[SeCN]2, can be obtained from the reaction of Pb[CH3COO]2 and K[SeCN]. Pure Pb[SeCN][OH] was obtained by adding an aqueous solution of K[SeCN] to an equimolar aqueous solution of Pb[CH3COO]2 and K[OH]. The product precipitates immediately in the form of a crystalline colourless solid. It was filtered, washed with excess water to remove K[CH3COO], and dried in air. Single crystals in the form of colourless needles were obtained by layering solutions of Pb[CH3COO]2/K[OH] in water with an aqueous solution of K[SeCN].At 180 K, Pb[SeCN][OH] crystallizes isotypically with Pb[SCN][OH] in the orthorhombic space group Pnma (No. 62) (a = 8.6244(2), b = 4.1674(4), c = 11.5412(6) Å) with four formula units in the unit cell (Fig. 13; for additional data see Table S4†). All atoms occupy Wyckoff position 4c (.m.). However, the crystal structure of Pb[SCN][OH] was previously described as Pnmb, a non-standard setting of Pnma. The relevant transformation matrix is  .10
.10
For Pb[SeCN][OH], we were not able to determine the positions of the H atoms by single-crystal X-ray diffraction. For structure refinements, restraints were applied in accordance with the chosen space group symmetry. These results were corroborated by solid-state DFT analysis. The presence of the OH group was additionally evidenced by Raman spectroscopy.
In Pb[SeCN][OH], as well as in Pb[SCN][OH], the atoms lie on the mirror plane parallel to [001] at b = ¾. Pb–O interactions cause the formation of ribbons along [010] (Fig. 13, bottom).10 As the H atoms could not be located from difference Fourier maps, they were artificially placed on the O atoms, thus forming [OH]− anions. The location of the H atoms is directly on the aforementioned mirror plane and thus fully occupied. The distance was constrained to 1.09 Å. Further investigations into the exact H atom location are described in the following sections.
The lead cation is surrounded in the form of a bicapped trigonal prism. The total coordination number of the lead atom is then CNPb = 6 + 1 + 1. The trigonal prismatic coordination sphere is constructed from four Se (d(Pb–Se) = 3.3174(6), 3.5396(6) Å) and two O atoms (d(Pb–O) = 2.455(3) Å) with Se,Se,O-basal planes (CN “6”). Both side planes built of two Se and two O atoms are capped. The one plane is capped by an N terminus of a [SeCN]− anion (d(Pb–N) = 2.708(7) Å, Fig. 14, left). The other plane is capped by an O atom of the hydroxy group (CN “+1 + 1”, d(Pb–0) = 2.360(5) Å). The polyhedra are connected to each other by common Se,Se,O-basal planes forming rods along [010]. Along [001], the rods are connected to each other by Pb–O interactions and, as a result, common O,O-edges form “double-chains” (Fig. 14, right). Via the N terminus, connected [SeCN]− anions are collinear with the Pb–N bond.
The double-chains share common Se-vertices with neighbouring double-chains and almost linear [SeCN]− anions (∡Se–C–N = 177.9(5)°, Fig. 15).
Phase purity was checked with PXRD and Rietveld refinement corroborated the model within close error margins (Fig. 16 and Table S3†).
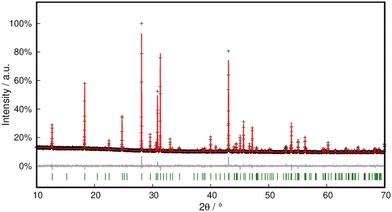 | ||
| Fig. 16 Rietveld refinement of Pb[SeCN][OH] at 298 K. Black crosses display measured data; the red line represents the refined model, green bars indicate Bragg positions and the grey line displays the difference plot. Further data are compiled in Table S3.† | ||
Previous studies have shown that depending on the hydrogen isotope, the Raman shift of the OH antisymmetric vibration vas can be found in different regions. For the 1H isotope, the signals are expected in the region of 3600 cm−1, and for the deuterated variant in the region of 2700 cm−1.51 In the Raman spectrum of Pb[SeCN][OH], the OH-stretch vibration vas can be found at 3529 cm−1 (see Fig. 17, black plot). To verify the affiliation of this vibration to Pb[SeCN][OH] and exclude the influence of air moisture on the Raman spectrum, a deuterated compound Pb[SeCN][OD] was synthesised. As expected, the OD-stretch vibration vas was found at 2605 cm−1 (Fig. 17, red plot).
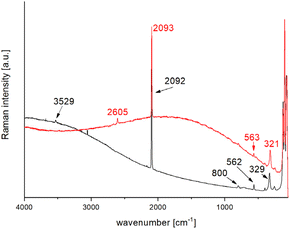 | ||
| Fig. 17 Collected Raman spectra of Pb[SeCN][OH] (black) and Pb[SeCN][OD] (red) at 298 K and λ = 633 nm. | ||
Thermal analysis
To study the thermal behaviour of the compounds in the series Pb[ChCN]2 (Ch = O, S, Se), we conducted differential scanning calorimetry coupled with thermogravimetry. According to the DSC-TGA data, the compounds Pb[ChCN]2 decompose upon heating without melting. Also, there is no relationship between the type of chalcogen atom and the respective decomposition temperature.For Pb[OCN]2 the onset point of decomposition is at 155 °C, as observed from the thermogravimetric data shown as the black line in Fig. 18. The decomposition is not concomitant with a signal in the DSC thermogram, indicating a very low thermal signature. In the accompanying high-temperature PXRD pattern, reflexes of Pb[OCN]2 were observed until 210 °C (red, I). In the region between 215 and 440 °C either no unit cell could be indexed or no crystalline compounds were detected (yellow–light blue, II–V). At 445 °C, an orthorhombic modification of PbO in the space group Cmme (No. 65) was found (blue, VI). After heating up to 540 °C, a tetragonal phase of PbO in the space group P4/mmm (No. 129) was found (violet, VII) up to a temperature of 650 °C.52 Above that, no crystalline phase was observed.
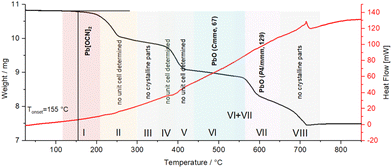 | ||
| Fig. 18 DSC-TGA analysis of Pb[OCN]2; black line: TGA graph, red line: DSC graph. Coloured highlights indicate phases observed by high-temperature PXRD. | ||
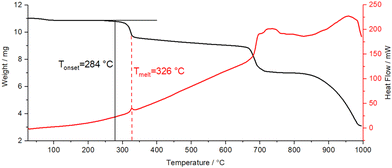
In contrast, Pb[SCN]2 shows a higher thermal stability up to 284 °C, which is the onset of the decomposition (Fig. 19). Here, the decomposition is concomitant with an exothermic signal in the DSC thermogram at 326 °C. The second step of the decomposition occurs at 700 °C.
Pb[SeCN]2 shows thermal stability up to 180 °C (see Fig. 20, red, I). In the region between 185 and 215 °C a mixed phase of Pb[SeCN]2 and PbSe53 could be detected (see Fig. 20, violet, II). After heating up to 220 °C pure cubic PbSe (No. 225) was found (see Fig. 20, blue, III).53
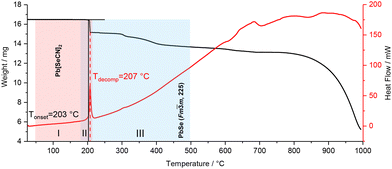 | ||
| Fig. 20 DSC-TGA analysis of Pb[SeCN]2; black line: TGA graph, red line: DSC graph. Coloured highlights indicate phases observed by high-temperature PXRD. | ||
Structure and electronic properties
The computed crystal structure parameters of the lead-based compounds under study are reported in Table 1. The agreement between the (B3LYP) calculated and experimentally measured lattice parameters is very good, with the largest deviation of about 3% obtained for the b lattice vector of Pb[OCN]2. Similar results (not explicitly shown) are found when using the PBE0 exchange-correlation functional, confirming the suitability of global hybrid functionals to describe the geometrical features of the lead-based compounds presented here.| Compound | Space group | a (Å) | b (Å) | c (Å) | E g (eV) | |
|---|---|---|---|---|---|---|
| Pb[OCN]2 | Pnma (No. 62) | 8.569 | 3.941 | 11.660 | Exp | |
| 8.625 | 4.068 | 11.820 | DFT | 5.43 (i) | ||
| 0.7 | 3.2 | 1.4 | Δ (%) | |||
| Pb[SCN]2 | C2/c (No. 15) | 9.656 | 6.539 | 8.251 | Exp | |
| 9.670 | 6.577 | 8.096 | DFT | 3.82 (i) | ||
| 0.1 | 0.6 | −1.9 | Δ (%) | |||
| Pb[SeCN]2 | Pnma (No. 62) | 12.479 | 4.228 | 10.652 | Exp | |
| 12.555 | 4.235 | 10.777 | DFT | 3.96 (i) | ||
| 0.6 | 0.2 | 1.2 | Δ (%) | |||
| Pb[SeCN][OH] | Pnma (No. 62) | 8.624 | 4.167 | 11.541 | Exp | |
| 8.502 | 4.184 | 11.555 | DFT | 4.47 (d) | ||
| −1.4 | 0.4 | 0.1 | Δ (%) |
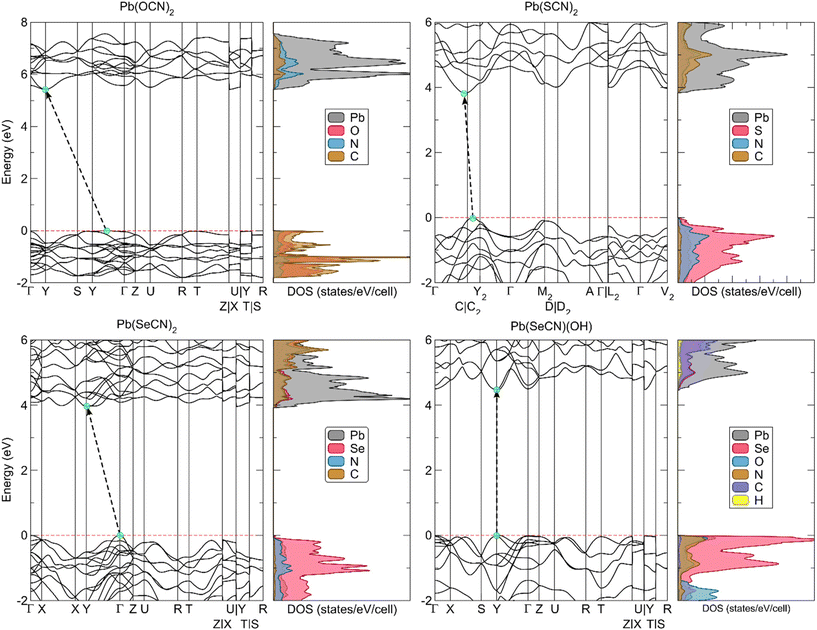
The calculated electronic band structures along high-symmetry paths in the Brillouin zone are shown in Fig. 21. All four compounds are wide-bandgap insulators with an electronic band gap of more than 3.8 eV, absorbing only in the high-frequency region of the visible spectrum. Overall, the bands show little dispersion with indirect band gaps for all compounds apart from Pb[SeCN][OH], which is a direct gap material.
To determine the experimental indirect band gap for Pb[ChCN]2 (Ch = O, S, Se) and the direct band gap for Pb[SeCN][OH], UV-Vis spectra in the range between 200 and 800 nm (∼1.5–6.2 eV) were recorded (Fig. S6†). Experimental results fit the calculated trend, where Pb[OCN]2 has the largest value for the band gap, and Pb[SCN]2 and Pb[SeCN]2 are in the same region and show a smaller band gap. The value for the band gap of Pb[SeCN][OH] lies between the values for Pb[OCN]2 and Pb[ChCN]2 (Ch = S, Se), which also matches the calculated results.
Analysis of the electronic densities of states (DOS) reveals that the top of the valence band of lead(II) selenocyanate and lead(II) selenocyanate hydroxide consists predominantly of Se 4p states with additional minor O 2p and N 2p states in Pb[SeCN][OH]. The bottom of the conduction band originates mainly from Pb 6p states. In Pb[OCN]2, the valence band is a mixture of C 2p, N 2p, and O 2p electronic states and the conduction band is derived from Pb 6p states, while in Pb[SCN]2 the valence band consists of a large portion of S 3p states mixed with smaller amounts of N 2p states.
Vibrational spectroscopy
The orthorhombic crystallographic cells of lead(II) selenocyanate and lead(II) cyanate contain 28 atoms in the unit cell (7 non-equivalent positions); its 84 vibrational modes can be further classified according to the irreducible representation of the mmm point group as follows:B1u, B2u, and B3u are IR active modes; Ag, B1g, B2g, and B3g are Raman active, while Au is silent. For lead(II) selenocyanate hydroxide, the irreducible representation is the same, but given that it contains 24 atoms in the unit cell (6 non-equivalent positions), the total number of vibrational modes is reduced from 84 to 72.
The monoclinic cell of lead(II) thiocyanate contains 14 atoms in the unit cell (4 non-equivalent positions, unique axis b), whose 42 vibrational modes are classified according to the irreducible representation of the 2/m point group as follows:
| Γtotal = 10Ag ⊗ 10Au ⊗ 11Bg ⊗ 11Bu. |
Au and Bu are IR active and Ag and Bg are Raman active.
Raman spectra calculated under the harmonic approximation are shown in Fig. 22, while the computed frequencies of the Raman active modes in the lead-based compounds studied in this work are reported in Tables S1 and S2.†
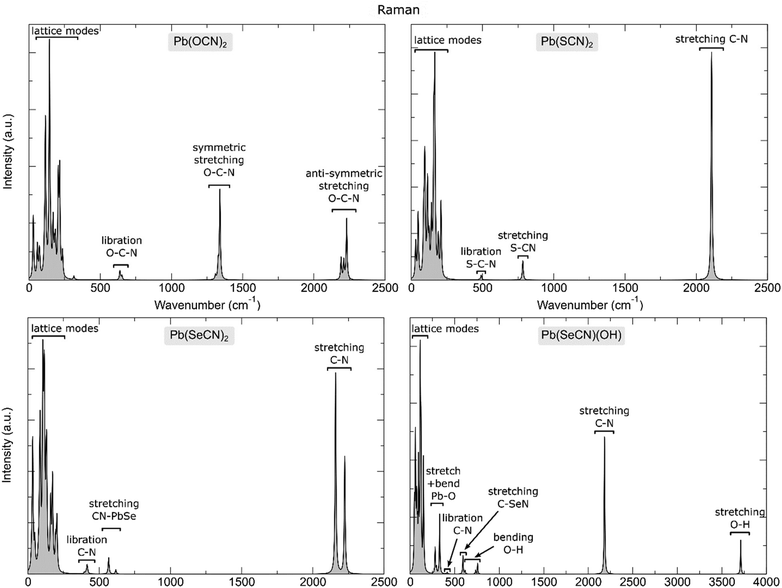 | ||
| Fig. 22 Calculated Raman spectrum of the lead-based compounds under analysis together with an assignment of the most prominent vibrational features. | ||
Resolving H occupation in Pb[SeCN][OH]
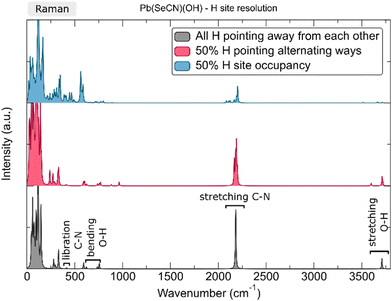
In several of the experimentally measured Raman spectra of Pb[SeCN][OH], a strong vibrational signal around 3000 cm−1 was noticed. Given that lead(II) selenocyanate hydroxide crystallizes in an orthorhombic crystal system with the space group Pnma and that the electron density of the hydrogen atom is difficult to locate exactly for the OH group, the proton was assigned a special position on the b-axis, which is a sensible choice for such systems. However, we decided to verify this suggestion using DFT to understand the possible origin of the vibrational frequency around 3000 cm−1 and rule out potential inaccuracies from the assignment of the initial H position. Several options were checked: optimization in the P1 space group, the displacement of the H atom out of the ac-plane, split-site position (50% occupancy of H sites), OH direction alteration, anharmonicity of the OH bond vibration, and overtone mode frequencies (Fig. 23).In the first scenario, a full geometry optimization without imposing any symmetry on the system did not result in any significant geometry alterations compared to the starting structure with full symmetry relaxation. In the second scenario, H was displaced out of the ac-plane where it occupied a special position as a result of the Pnma space group. By doing so, the number of symmetry operators of the system was reduced and depending on the motif occupied by the final displaced configurations, different sub-space groups were obtained, as listed in Table 2. However, upon relaxation (even while strictly imposing the new space groups), the H atoms reverted fully to their position along the b-axis, effectively again forming the original Pnma space group symmetry.
| H position displacement permutation | Space group | Starting angle wrt to ac-plane | Final angle wrt to ac-plane |
|---|---|---|---|
| Original | 62 | 0.0° | 0.0° |
| All +b (or −b) | 33 | 45.3° | 0.1° |
| +b −b +b −b | 14 | 45.3° | 0.0° |
| +b −b −b +b | 19 | 45.3° | 0.1° |
| +b +b −b −b | 14 | 45.3° | 0.0° |
In the third assessed scenario, a supercell was created where, as a result, only half of hydrogen sites were occupied. This induces a strong cell distortion, with the a lattice parameter contracting by 12% and the c lattice parameter expanding by more than 14%. This leads, in the vibrational spectrum, to an increase in the intensity of the lattice vibrations, together with a pronounced peak splitting of the pristine C–N symmetric stretching as a result of the symmetry reduction. However, no vibrations were observed between 2200 cm−1 and 3500 cm−1, neither in the IR nor Raman spectrum. Also, the intensity of the calculated Raman vibrations had decreased significantly.
The fourth explored scenario included the creation of a supercell where we altered 50% of the OH bond directions along the b-axis in such a way that they point towards each other in contrast to the pristine structure, where they always point away from each other. As such, the symmetry is almost entirely reduced, with a residual space group of P21/m (No. 11). Upon full geometric and atomic relaxation, the structure alters very little, up to a maximum of 2% expansion in the b crystallographic direction. The calculated Raman spectrum is displayed in the middle of Fig. 23. In this structure the O–H stretching mode splits due to the lifted degeneracy and displays two distinct peaks split by more than Δ = 100 cm−1. A second possibility was tested as well, with half of the OH bonds pointing in a direction perpendicular to the original OH bond along the b-axis, this time with the residual Pm space group (No. 6), but that structure reverted quickly to the starting configuration upon full relaxation.
In the fifth scenario, the anharmonicity of the O–H stretching vibration was considered in the original Pnma space group of Pb[SeCN][OH]. The computed frequencies of both IR and Raman active vibrational modes using the VSCF and VCI approaches to treat anharmonicity are listed in Table 3.
| Mode # | Symmetry label | Harmonic | Intrinsic anharmonic | VSCF (8 modes) | VCI@VSCF (8 modes) |
|---|---|---|---|---|---|
| 65 | B1u | 2174 | 2180 | 2174 | 2171 |
| 66 | Ag | 2181 | 2176 | 2181 | 2170 |
| 67 | B2u | 2184 | 2190 | 2184 | 2181 |
| 68 | B3g | 2184 | 2190 | 2184 | 2181 |
| 69 | Ag | 3712 | 3678 | 3699 | 3624 |
| 70 | B1u | 3712 | 3762 | 3685 | 3674 |
| 71 | B3g | 3713 | 3761 | 3686 | 3675 |
| 72 | B2u | 3713 | 3762 | 3686 | 3675 |
For comparison, using the approach of solving the 1D Schrödinger equation yields a harmonic frequency of 3739 cm−1 and the fundamental anharmonic frequency of 3552 cm−1 (mode no. 69), i.e., significantly different from the frequencies computed using the VSCF and VCI approaches. This illustrates once more the shortcomings of neglecting explicit phonon–phonon coupling, which can be effectively and efficiently treated in the VSCF and VCI approaches implemented in CRYSTAL. First, anharmonic treatment of the O–H stretch was performed as a single-mode, labelled as “intrinsic anharmonic” in Table 3, where mode–mode coupling is fully neglected. There, VSCF and VCI are formally identical.44 In the second approach, we allowed all the stretching modes to couple with each other (8 modes in total). The results of these analyses indicate that anharmonic shifts in frequency in Pb[SeCN][OH] are no larger than 90 cm−1, which is observed for the Ag Raman active O–H stretch.
In the final scenario, the possibility that the measured spectra display overtone features is assessed. First overtones were computed for the initial lead(II) selenocyanate hydroxide and the results indicated 16 potential combinations between the O–H bending and C–N stretching modes, which produce frequencies between 2909 cm−1 and 2941 cm−1. In addition, we computed the overtones for the Pb[SeCN][OH] structure with the OH bonds pointing in opposite directions (scenario four), and there we identified 80 potential combinations of modes that produce frequencies between 2903 cm−1 and 3164 cm−1.
Given the difficulty in detecting experimentally the exact H positions in the lattice as well as their potential to occupy sites that vary in direction across an experimentally synthesized sample, it is most likely that the measured vibrational frequencies noted in the area of around 3000 cm−1 originate from an overtone of the fundamental O–H bending and C–N stretching modes.
Conclusions
In this work, we have described the synthesis of the Pb[ChCN]2 series of compounds with Ch = O, S, Se, and Pb[SeCN][OH]. Whereas the lead thiocyanate54 and selenocyanate compounds are able to form hydroxides Pb[ChCN][OH] with Ch = S, Se under neutral conditions, the cyanate homologue solely forms Pb[OCN]2.10 All compounds were characterized by single-crystal and powder X-ray diffraction, Raman spectroscopy, solid-state DFT analysis, and thermogravimetric analysis/differential scanning calorimetry. For Pb[SeCN][OH], no H atoms could be found by X-ray diffraction and, for the structure refinements, the H atom positions were restrained in accordance with the symmetry of the chosen space group. For verification of the presence of the hydroxy group, Raman spectroscopy was performed. Additionally, a deuterated homologue was synthesized and characterized by Raman spectroscopy and powder X-ray diffraction. In the Raman spectra, the corresponding signals were observed and assigned to the calculated vibrations as well as compared with the literature data. Thermal decomposition of Pb[ChCN]2 (Ch = O, S, Se) was followed by DSC/TGA analysis for Ch = O, S, Se, and high-temperature powder diffraction for Ch = O, Se. Pb[SCN]2 shows the highest thermal stability in the series up to 284 °C. Crystalline Pb[OCN]2 and Pb[SeCN]2 were found by heating up to ∼200 °C in ht-PXRD. For all four of the compounds studied, DFT calculations were performed. According to the DFT studies, all four compounds are wide-bandgap insulators with electronic band gaps exceeding 3.8 eV, absorbing only in the high-frequency region of the visible spectrum. Overall, the bands show minimal dispersion with indirect band gaps for all compounds except for Pb[SeCN][OH], which is identified as a direct-gap material. For Pb[SeCN][OH], resolving the occupation of the H atoms was performed following several scenarios, although none could predict the accurate position of the H atoms. Based on the calculated Raman vibrations and their comparison with collected data, it is suggested that the location of the H atoms is directly on the aforementioned mirror plane and thus fully in accordance with the space group symmetry.Author contributions
FT conceptualized and led the study. AS performed the experiments and led the analytical investigations. AŽ and NHdL were responsible for the computational work. The manuscript was written through contributions from all authors. All authors have given approval for the final version of the manuscript.Data availability
Crystallographic data for Pb[OCN]2, Pb[SCN]2, Pb[SeCN]2 and Pb[SeCN][OH] have been deposited at the CCDC under deposition numbers 2383820, 2383821, 2383822 and 2383823. Additional data supporting this article have been included as part of the ESI.†Conflicts of interest
There are no conflicts to declare.Acknowledgements
FT thanks the Fonds der Chemischen Industrie for a Liebig fellowship. Additionally, FT and AS thank the German Research Council for funding (TA 1357/4-1). FT thanks Prof. F. Kraus for his generous support. AŽ and NHdL acknowledge the NWO ECHO grant (712.018.005) for funding and thank SURF (https://www.surf.nl) for access to the National Supercomputer Snellius.References
- A. Shlyaykher, M. Ehmann, A. J. Karttunen and F. Tambornino, A Comprehensive Study on the Full Series of Alkali–Metal Selenocyanates AI[SeCN] (AI=Li−Cs), Eur. J. Chem., 2021, 27, 13552–13557 CrossRef CAS.
- J. Liebig and F. Wöhler, Untersuchungen über die Cyansäure, Annu. Phys. Chem., 1830, 28, 188–191 Search PubMed.
- A. C. Cumming, CXXXV.—The formation of urea by the direct hydrolysis of lead cyanate, J. Chem. Soc., Trans., 1903, 83, 1391–1394 RSC.
- C. W. Blomstrand, Zur Kenntniss der gepaarten Verbindungen des fünfatomigen Stickstoffs, J. Prakt. Chem., 1871, 2, 201 Search PubMed.
- J. L. Gay-Lussac, Untersuchungen über die Blausäure, Ann. Phys., 1815, 139–168 Search PubMed.
- F. Wöhler, Bildung der Cyansäure auf neuem Wege, und fernere Untersuchungen über die Cyansäure und deren Salze, Gilbert's Ann., 1823, 73, 157 CrossRef.
- J. Liebig, Über einige Produkte, welche durch die Zersetzung mehrerer Salze vermittelst Chlor erhalten werden, Ann. Phys. Chem., 1829, 1, 541–572 CrossRef.
- H. E. Williams, Cyanogen Compounds Their Chemistry, Detection and Estimation, Edward Arnold & Co., London, 2nd edn, 1948 Search PubMed.
- J. A. A. Mokuolu and J. C. Speakman, The crystal structure of lead thiocyanate, Chem. Commun., 1966, 25 RSC.
- V. Adovasio and M. Nardelli, Metal–Hydroxy Ribbons in Pb(OH)(NCS), Acta Crystallogr., Sect. C: Cryst. Struct. Commun., 1995, 51, 380–382 CrossRef.
- J. G. Labram, N. R. Venkatesan, C. J. Takacs, H. A. Evans, E. E. Perry, F. Wudl and M. L. Chabinyc, Charge transport in a two-dimensional hybrid metal halide thiocyanate compound, J. Mater. Chem. C, 2017, 5, 5930–5938 RSC.
- Q. Jiang, D. Rebollar, J. Gong, E. L. Piacentino, C. Zheng and T. Xu, Pseudohalide–Induced Moisture Tolerance in Perovskite CH3NH3Pb(SCN)2I Thin Films, Angew. Chem., Int. Ed., 2015, 54, 7617–7620 CrossRef CAS PubMed.
- W. Ke, C. Xiao, C. Wang, B. Saparov, H. S. Duan, D. Zhao, Z. Xiao, P. Schulz, S. P. Harvey, W. Liao, W. Meng, Y. Yu, A. J. Cimaroli, C. S. Jiang, K. Zhu, M. Al-Jassim, G. Fang, D. B. Mitzi and Y. Yan, Employing Lead Thiocyanate Additive to Reduce the Hysteresis and Boost the Fill Factor of Planar Perovskite Solar Cells, Adv. Mater., 2016, 28, 5214–5221 CrossRef CAS PubMed.
- B. A. Koscher, J. K. Swabeck, N. D. Bronstein and A. P. Alivisatos, Essentially Trap-Free CsPbBr3 Colloidal Nanocrystals by Postsynthetic Thiocyanate Surface Treatment, J. Am. Chem. Soc., 2017, 139, 6566–6569 CrossRef CAS PubMed.
- B. Walker, G. Kim and J. Y. Kim, Pseudohalides in Lead–Based Perovskite Semiconductors, Adv. Mater., 2019, 31, 1807029–1807029 CrossRef.
- W. Crookes, Ueber die Selencyanide, Ann. Chem. Pharm., 1851, 78, 177–187 CrossRef.
- G. Brauer, Handbuch der Präparativen Anorganischen Chemie, Ferdinand Enke Verlag, Stuttgart, 3. Auflage, 1975 Search PubMed.
- X-Area 1.88, Stoe & Cie GmbH, Darmstadt, Germany, 2019 Search PubMed.
- G. M. Sheldrick, A short history of Shelx, Acta Crystallogr., Sect. F: Struct. Biol. Cryst. Commun., 2008, 64, 112–122 CrossRef CAS.
- O. V. Dolomanov, L. J. Bourhis, R. J. Gildea, J. A. K. Howard and H. Puschmann, OLEX2: A complete structure solution, refinement and analysis program, J. Appl. Crystallogr., 2009, 42, 339–341 CrossRef CAS.
- K. Brandenburg and H. Putz, DIAMOND, Program for X-Ray Strkucture Analysis, Crystal Impact GbR, Bonn, Gemany, 2005 Search PubMed.
- H. M. Rietveld, A profile refinement method for nuclear and magnetic structures, J. Appl. Crystallogr., 1969, 2, 65–71 CrossRef CAS.
- A. A. Coelho, TOPAS and TOPAS-Academic : an optimization program integrating computer algebra and crystallographic objects written in C++, J. Appl. Crystallogr., 2018, 51, 210–218 CrossRef CAS.
- R. Dovesi, A. Erba, R. Orlando, C. M. Zicovich-Wilson, B. Civalleri, L. Maschio, M. Rérat, S. Casassa, J. Baima, S. Salustro and B. Kirtman, Quantum-mechanical condensed matter simulations with CRYSTAL, Wiley Interdiscip. Rev.: Comput. Mol. Sci., 2018, 8, e1360 Search PubMed.
- F. Pascale, C. M. Zicovich-Wilson, F. López Gejo, B. Civalleri, R. Orlando and R. Dovesi, The calculation of the vibrational frequencies of crystalline compounds and its implementation in the CRYSTAL code, J. Comput. Chem., 2004, 25, 888–897 CrossRef CAS PubMed.
- C. M. Zicovich-Wilson, F. Pascale, C. Roetti, V. R. Saunders, R. Orlando and R. Dovesi, Calculation of the vibration frequencies of α-quartz: The effect of Hamiltonian and basis set, J. Comput. Chem., 2004, 25, 1873–1881 CrossRef CAS PubMed.
- A. Erba, J. K. Desmarais, S. Casassa, B. Civalleri, L. Donà, I. J. Bush, B. Searle, L. Maschio, L. Edith-Daga, A. Cossard, C. Ribaldone, E. Ascrizzi, N. L. Marana, J.-P. Flament and B. Kirtman, CRYSTAL23: A Program for Computational Solid State Physics and Chemistry, J. Chem. Theory Comput., 2022, 19, 6891–6932, DOI:10.1021/acs.jctc.2c00958.
- A. D. Becke, A new mixing of Hartree–Fock and local density–functional theories, J. Chem. Phys., 1993, 98, 1372–1377 CrossRef CAS.
- C. Lee, W. Yang and R. G. Parr, Development of the Colle-Salvetti correlation-energy formula into a functional of the electron density, Phys. Rev. B: Condens. Matter Mater. Phys., 1988, 37, 785–789 CrossRef CAS PubMed.
- D. Vilela Oliveira, J. Laun, M. F. Peintinger and T. Bredow, BSSE-correction scheme for consistent gaussian basis sets of double- and triple-zeta valence with polarization quality for solid-state calculations, J. Comput. Chem., 2019, 40, 2364–2376 CrossRef CAS PubMed.
- C. Pisani, R. Dovesi and C. Roetti, Hartree-Fock Ab Initio Treatment of Crystalline Systems, Springer Berlin Heidelberg, Berlin, Heidelberg, 1988, vol. 48 Search PubMed.
- R. Dovesi, V. R. Saunders, C. Roetti, R. Orlando, C. M. Zicovich-Wilson, F. Pascale, B. Civalleri, K. Doll, N. M. Harrison, I. J. Bush, P. D'Arco, M. Llunell, M. Causà, Y. Noël, L. Maschio, A. Erba, M. Rerat and S. Casassa, Crystal17 User's Manual 2017 Search PubMed.
- H. J. Monkhorst and J. D. Pack, Special points for Brillouin-zone integrations, Phys. Rev. B: Solid State, 1976, 13, 5188–5192 CrossRef.
- S. Grimme, J. Antony, S. Ehrlich and H. Krieg, A consistent and accurate ab initio parametrization of density functional dispersion correction (DFT-D) for the 94 elements H-Pu, J. Chem. Phys., 2010, 132, 1–19 CrossRef.
- S. Grimme, S. Ehrlich and L. Goerigk, Effect of the damping function in dispersion corrected density functional theory, J. Comput. Chem., 2011, 32, 1456–1465 CrossRef CAS PubMed.
- S. Grimme, A. Hansen, J. G. Brandenburg and C. Bannwarth, Dispersion-Corrected Mean-Field Electronic Structure Methods, Chem. Rev., 2016, 116, 5105–5154 CrossRef CAS PubMed.
- Y. Hinuma, G. Pizzi, Y. Kumagai, F. Oba and I. Tanaka, Band structure diagram paths based on crystallography, Comput. Mater. Sci., 2017, 128, 140–184 CrossRef CAS.
- L. Maschio, B. Kirtman, M. Rérat, R. Orlando and R. Dovesi, Ab initio analytical Raman intensities for periodic systems through a coupled perturbed Hartree-Fock/Kohn-Sham method in an atomic orbital basis. II. Validation and comparison with experiments, J. Chem. Phys., 2013, 139, 1–13 Search PubMed.
- L. Maschio, B. Kirtman, R. Orlando and M. Rèrat, Ab initio analytical infrared intensities for periodic systems through a coupled perturbed Hartree-Fock/Kohn-Sham method, J. Chem. Phys., 2012, 137, 204113 CrossRef.
- F. Pascale, S. Tosoni, C. Zicovich-Wilson, P. Ugliengo, R. Orlando and R. Dovesi, Vibrational spectrum of brucite, Mg(OH)2: a periodic ab initio quantum mechanical calculation including OH anharmonicity, Chem. Phys. Lett., 2004, 396, 308–315 CrossRef CAS.
- P. Ugliengo, F. Pascale, M. Mérawa, P. Labéguerie, S. Tosoni and R. Dovesi, Infrared Spectra of Hydrogen-Bonded Ionic Crystals: Ab Initio Study of Mg(OH)2 and β-Be(OH)2, J. Phys. Chem. B, 2004, 108, 13632–13637 CrossRef CAS.
- A. Erba, J. Maul, M. Ferrabone, R. Dovesi, M. Rérat and P. Carbonnière, Anharmonic Vibrational States of Solids from DFT Calculations. Part II: Implementation of the VSCF and VCI Methods, J. Chem. Theory Comput., 2019, 15, 3766–3777 CrossRef CAS.
- A. Erba, J. Maul, M. Ferrabone, P. Carbonnière, M. Rérat and R. Dovesi, Anharmonic Vibrational States of Solids from DFT Calculations. Part I: Description of the Potential Energy Surface, J. Chem. Theory Comput., 2019, 15, 3755–3765 CrossRef CAS.
- R. G. Schireman, J. Maul, A. Erba and M. T. Ruggiero, Anharmonic Coupling of Stretching Vibrations in Ice: A Periodic VSCF and VCI Description, J. Chem. Theory Comput., 2022, 18, 4428–4437 CrossRef CAS.
- D. Mitoli, J. Maul and A. Erba, Anharmonic Terms of the Potential Energy Surface: A Group Theoretical Approach, Cryst. Growth Des., 2023, 23, 3671–3680, DOI:10.1021/acs.cgd.3c00104.
- Origin(Pro), Version 8G. OriginLab Corporation, Northampton, MA, USA., 2008 Search PubMed.
- J. A. A. Mokuolu and J. C. Speakman, The crystal structure of lead(II) thiocyanate, Acta Crystallogr., Sect. B: Struct. Crystallogr. Cryst. Chem., 1975, 31, 172–176 CrossRef.
- L. Link and R. Niewa, Polynator : a tool to identify and quantitatively evaluate polyhedra and other shapes in crystal structures, J. Appl. Crystallogr., 2023, 56, 1855–1864, DOI:10.1107/S1600576723008476.
- H. Zabrodsky, S. Peleg and D. Avnir, Continuous Symmetry Measures, J. Am. Chem. Soc., 1992, 114, 7843–7851 CrossRef CAS.
- R. D. Shannon, Revised effective ionic radii and systematic studies of interatomic distances in halides and chalcogenides, Acta Crystallogr., Sect. A: Cryst. Phys., Diffr., Theor. Gen. Crystallogr., 1976, 32, 751–767 CrossRef.
- A. Zarei, S. Klumbach and H. Keppler, The Relative Raman Scattering Cross Sections of H2O and D2O, with Implications for In Situ Studies of Isotope Fractionation, CS Earth Space Chem., 2018, 2, 925–934 CrossRef CAS.
- P. Boher, P. Garnier, J. R. Gavarri and A. W. Hewat, Monoxyde quadratique PbOα(I): Description de la transition structurale ferroélastique, J. Solid State Chem., 1985, 57, 343–350 CrossRef CAS.
- Y. Noda, K. Masumoto, S. Ohba, Y. Saito, K. Toriumi, Y. Iwata and I. Shibuya, Temperature dependence of atomic thermal parameters of lead chalcogenides, PbS, PbSe and PbTe, Acta Crystallogr., Sect. A: Found. Crystallogr., 1987, 43, 1443–1445 Search PubMed.
- B. Akteries and J. C. Jochims, Reactions of carbonyl diisocyanate with amides and acids, Chem. Ber., 1986, 119, 669–682 CrossRef CAS.
Footnote |
| † Electronic supplementary information (ESI) available. CCDC 2383820–2383823. For ESI and crystallographic data in CIF or other electronic format see DOI: https://doi.org/10.1039/d4dt02830a |
| This journal is © The Royal Society of Chemistry 2025 |

