
 Open Access Article
 This Open Access Article is licensed under a Creative Commons Attribution-Non Commercial 3.0 Unported Licence
Operando Raman and ex situ characterization of an iron-based conductive MOF as a negative electrode in Li-ion batteries†
Isabel
Ciria-Ramos
ab,
Alex R.
Neale
 c,
Laurence J.
Hardwick
c,
Emilio J.
Juarez-Perez
ad,
Ignacio
Gascón
*ab and
Marta
Haro
*ab
c,
Laurence J.
Hardwick
c,
Emilio J.
Juarez-Perez
ad,
Ignacio
Gascón
*ab and
Marta
Haro
*ab
aInstituto de Nanociencia y Materiales de Aragón (INMA), CSIC-Universidad de Zaragoza, Zaragoza, 50009, Spain. E-mail: igascon@unizar.es; mharo@unizar.es
bDepartamento de Química Física, Facultad de Ciencias, Universidad de Zaragoza, Zaragoza, 50009, Spain
cStephenson Institute for Renewable Energy (SIRE), Department of Chemistry, University of Liverpool, Liverpool L69 7ZF, UK
dAragonese Foundation for Research and Development (ARAID). Government of Aragon, Zaragoza, 50018, Spain
First published on 27th May 2025
Abstract
An iron-based electrically conductive metal–organic framework (MOF), Fe-HHTP, formed by the coordination of Fe cations and the organic ligand HHTP (2,3,6,7,10,11-hexahydroxytriphenylene), has been synthesized, characterized, and explored as a potential negative electrode for lithium-ion batteries (LIBs). Galvanostatic cycling experiments, with a lower cut-off voltage of 0.1 V vs. Li/Li+, reveal that Fe-HHTP undergoes a significant activation process, resulting in an increase in specific capacity up to 1142 mAh g−1 after ∼220 cycles at a current of 355 mA g−1. Operando Raman spectroscopy during the first lithiation, complemented by ex situ techniques at different cycling stages, demonstrates that both the organic ligands and metal centers actively contribute to Li+ storage. Initially, lithiation occurs primarily at the MOF boundaries, while continuous cycling induces a structural transformation that allows greater accessibility to the inner regions of Fe-HHTP. These results provide a better understanding of the electrochemical and structural behavior of pristine MOFs that allow tailoring their properties for direct application in energy storage devices without the need for high-temperature processes.
1. Introduction
Studies on metal–organic frameworks (MOFs), composed of organic ligands and metal centers, as electrodes for Li-ion batteries (LIBs) have gained increasing attention in recent years due to several reasons.1 First, MOFs typically exhibit large surface areas, facilitating extensive interaction with the electrolyte and accelerating Li+ and e− transport.2 Second, their multiple components (including functional groups, pore structures, and metal centers) offer diverse sites for Li+ storage, which could potentially lead to higher specific capacities.3,4 Additionally, the insertion or intercalation of Li+ at these sites occurs at distinct voltages, some of which are sufficiently separated from the Li+ reduction potential, and, therefore, it is possible to avoid the potential problems derived from Li dendrite formation while still achieving good capacities. Third, their high porosity can accommodate the volume changes associated with conversion reactions,5 which provide higher specific capacities than insertion processes, thus enhancing battery cycle life. Finally, MOFs are also easily synthesized and tunable,6 allowing modifications to optimize their Li+ storage performance.2 As a result, MOF electrodes can theoretically operate within tailored voltage windows to balance capacity and stability.Despite their advantages, MOFs face challenges such as low electrical conductivity and structural stability.2,6–9 In this context, MOF-derived nanostructures obtained using high-temperature processes, such as pyrolysis or calcination, are also investigated as components of LIBs.5 MOF derivatives are formed using MOF as precursors or templates and comprise metal particles, metal compounds, such as metal oxides10 or metal–carbon composites,11 that may contain different metals uniformly distributed, as well as porous carbon materials doped with different heteroatoms.12 However, the use of unmodified MOFs is still desirable, since it saves energy and allows exploiting their intrinsic properties. In particular, some families of MOFs with relatively high intrinsic conductivity, such as those containing triphenylene ligands with π–d conjugation to transition metals,4,13,14 are of great interest for the development of different technological applications. In relation to the structural instability of pristine MOFs, often considered a limitation, has been recently suggested as a potential advantage, as it may enhance energy storage capacity by enabling new electrochemical processes.15 In this regard, the transition to a semi-crystalline or completely amorphous organic framework results in an electrode with both high energy storage capacity and excellent cycling performance.15,16
Considering these aspects, it is not surprising that the number of studies on LIBs with triphenylene-based MOFs has increased in recent years.17–22 However, the performance of these LIB electrodes has shown significant variability in electrochemical behavior due to structural differences arising from synthesis or electrode preparation. For instance, a previously reported MOF composed of the same ligand and metallic center as the one described in this study presents noticeable differences with respect to electrochemical performance and (de)lithiation mechanism.22 Moreover, cyclic voltammetry measurements of triphenylene-based MOFs often reveal major lithiation processes near 0 V vs. Li/Li+, associated with Li+ insertion between MOF layers. Therefore, in these studies the lower cut-off voltage commonly used is 0.01 V vs. Li+/Li, which maximizes capacity but also increases the risk of dendrite formation.
In this study, an iron-based conductive MOF named Fe-HHTP (where HHTP = 2,3,6,7,10,11-hexahydroxytriphenylene) was synthesized and characterized as a negative electrode for LIBs. Galvanostatic cycling experiments using a relatively high lower voltage of 0.1 V vs. Li+/Li revealed a significant activation process in Fe-HHTP, leading to an increase in specific capacity to 1142 mAh g−1 after ∼220 cycles at a current of 355 mAh g−1. Operando Raman spectroscopy was employed during the first lithiation cycle to investigate bond and chemical environment changes in real time. This operando technique has been previously used in MOFs to study their synthesis processes,23 or their use in different applications such as electrocatalysis,24,25 or gas adsorption.26,27 Also, operando Raman spectroscopy has been employed with other LIBs electrode materials,28–34 but, as far as the authors are concerned, these materials do not include MOFs. Operando Raman observations of the Fe-HHTP electrode, complemented by ex situ techniques at different cycles and cycling stages, demonstrated that both the organic ligands and metal centers in Fe-HHTP actively contribute to Li+ storage. Initially, lithiation occurs predominantly at the MOF boundaries, while continuous cycling induces a structural transformation, granting greater accessibility to the inner regions of the material. Although the gradual activation process may limit the immediate applicability of Fe-HHTP in commercial devices, it provides a valuable opportunity to study the fundamental mechanisms behind such behavior. A similar capacity enhancement upon cycling has recently been observed in a covalent organic framework (COF),35 reinforcing the importance of understanding these phenomena for the development of next-generation electrode materials. The combination of operando Raman and ex situ techniques highlights the strong relationship between the structure of Fe-HHTP and its electrochemical performance, offering valuable insights for the design of MOFs with enhanced properties for energy storage applications.
2. Results and discussion
2.1. MOF powder characterization
The weak PXRD pattern of the synthesized Fe-HHTP MOF (Fig. 1a) shows a low-crystalline material,36 with a series of weak reflections centered at ∼9.3°, ∼15.1°, ∼16.5°, ∼21.3°, ∼25.7°, ∼27.1° and ∼27.5°. The former four peaks are typically found in triphenylene-based MOFs with ligands coordinated to metals with square planar geometries and assigned to the bidimensional structure of the MOF in the ab plane.20,37,38 In those MOFs the peak of the stacking of these 2D layers along the c-axis appears at ∼27°, but this position shifts to 24–26° when the metal is Fe,22,36 probably due to its tendency to adopt an octahedral environment. However, the fact that the peaks at ∼27.1° and ∼27.5° are so close to each other and that the latter one is located at a position near that of the most intense peak in the ligand XRD spectrum (Fig. S1†) might suggest that there are some non-conjugated HHTP molecules in the MOF structure that contribute to the signal observed. For comparison, the previous similar MOF reported as an anode in LIBs22 (from now on Fe-CAT) presents a more intense peak at ∼25.7° than at ∼27°. SEM images show that Fe-HTTP is composed of disordered flakes with different sizes in the order of several tens to hundreds nm (Fig. S2†), instead of the typical rod-like structure found in other triphenylene-based MOFs. The flake structures indicate a preference for in-plane growth rather than stacking of layers along the c-axis, and has been associated with the presence of DMF molecules between MOFs layers.36 | ||
| Fig. 1 Characterization of the synthesized Fe-HHTP powders including (a) PXRD pattern with blue lines indicating the peak positions, (b) XPS high-resolution Fe 2p graph, (c) comparison between Fe-HHTP and HHTP infrared spectrum and (d) Raman spectrum. | ||
The survey XPS spectrum (Fig. S3a†) verifies the presence of nitrogen in the sample which can only come from the DMF solvent used in the synthesis. Probably, DMF is not fully removed during the filtration and washing steps of the synthesis because of the tendency of iron to adopt an octahedral coordination.36 Nevertheless, the N 1s peak is very small, so the presence of this solvent in the structure is minimal. High-resolution C 1s spectrum (Fig. S3b†) can be divided into five peaks at 283.9 eV, 284.8 eV, 285.9 eV, 287.8 eV and 290.4 eV corresponding to the bonds C![[double bond, length as m-dash]](https://www.rsc.org/images/entities/char_e001.gif) C, C–C, C–O and CO and the π–π interaction of stacked layers, respectively. HHTP can adopt seven configurations depending on whether its 6-membered rings are in the quinone, semiquinone (sq) or catecholate (cat) forms or a combination of these,39 although in this study it is just expected to find the rings either in the sq or the cat form (Fig. S4†). Therefore, the CO peak indicates the presence of at least some HHTP rings in the sq configuration.40 In high-resolution O 1s spectrum, apart from the C–O and CO bands at 532.02 eV and 532.74 eV, there are other two peaks corresponding to O–H (at 534.85 eV), and Fe–O (at 530.99 eV) bonds (Fig. S3c†), indicating both the presence of H2O molecules in the MOF structure and the coordination of HHTP ligands to iron metal centers. Moreover, XPS (Fig. 1b) shows that Fe atoms have a mixed state of oxidation +2/+3, which means that HHTP rings are probably in the configurations [sq, sq, sq]−3 and [cat, sq, sq]−4. In contrast, XPS spectrum of Fe-CAT is significantly different, without any N (DMF was not employed in its synthesis) nor O–H bonds peaks and lower C–C/CC and CO/C–O ratios than Fe-HHTP,22 signifying that our MOF has a larger number of HHTP rings with a sq form.
C, C–C, C–O and CO and the π–π interaction of stacked layers, respectively. HHTP can adopt seven configurations depending on whether its 6-membered rings are in the quinone, semiquinone (sq) or catecholate (cat) forms or a combination of these,39 although in this study it is just expected to find the rings either in the sq or the cat form (Fig. S4†). Therefore, the CO peak indicates the presence of at least some HHTP rings in the sq configuration.40 In high-resolution O 1s spectrum, apart from the C–O and CO bands at 532.02 eV and 532.74 eV, there are other two peaks corresponding to O–H (at 534.85 eV), and Fe–O (at 530.99 eV) bonds (Fig. S3c†), indicating both the presence of H2O molecules in the MOF structure and the coordination of HHTP ligands to iron metal centers. Moreover, XPS (Fig. 1b) shows that Fe atoms have a mixed state of oxidation +2/+3, which means that HHTP rings are probably in the configurations [sq, sq, sq]−3 and [cat, sq, sq]−4. In contrast, XPS spectrum of Fe-CAT is significantly different, without any N (DMF was not employed in its synthesis) nor O–H bonds peaks and lower C–C/CC and CO/C–O ratios than Fe-HHTP,22 signifying that our MOF has a larger number of HHTP rings with a sq form.
The infrared (IR) spectrum is in good agreement with the XPS results since it presents a series of bands associated to the stretching vibrations of the bonds O–H, CO, CC and C–O and C–OH at ∼3200 cm−1, ∼1615 cm−1, ∼1440 cm−1, ∼1225 cm−1 and ∼1000 cm−1, respectively (Fig. 1c).36,41–43 Also, the disappearance of CC band observed at ∼1530 cm−1 for HHTP confirms the coordination between Fe and HHTP.44,45 The presence of both DMF and H2O was further confirmed by TGA measurements (Fig. S5†), where a weight loss of 23% is observed from room temperature to 240 °C corresponding to those two compounds leaving MOF structure.19,20,36 Again, the presence of DMF is minimal since the majority of this weight loss occurs at lower temperatures than this compound boiling point. At higher temperatures there is a thermal decomposition of the MOF until reaching 475 °C, when probably the only species remaining are iron oxides.20 This temperature is slightly higher than the one of previous Fe-CAT,22 indicating a somewhat higher thermal stability of our Fe-HHTP.
Raman measurements were performed on dried powder placed on an airtight Raman cell to avoid the MOF reabsorption of atmospheric water (Fig. 1d). The presence of several peaks below 650 cm−1, associated to Fe–O vibrations,46–49 proves that the peak found in XPS assigned to this bond is related to the coordination between the metal atom and the ligand HHTP rather than the oxygen from H2O. The observed peaks at 1345 cm−1 and 1575 cm−1, analogous of graphitic carbon D and G bands, correspond to the breathing mode of HHTP and the C–C stretching respectively.50 Moreover, there is a shoulder at about 1050 cm−1 and a wide and moderately intense band centered at 2780 cm−1 which are assigned to the in-plane bending of C–H,48,51 and an overtone (analogue of the 2D band),52 which is associated to the stacking of MOFs layers along the c-axis,22,53,54 respectively. The weak band at 1462 cm−1 is attributed to the C–C stretching and C–H bending of the HHTP in the catecholate form.48 The complete list of the Raman bands and their assignments can be found in Table S1.† Finally, the calculated electronic conductivity of the bulk material is 5.40 × 10⁻⁴ S m−1 (Fig. S6†), measured by a two-point probe method. This value is between one and two orders of magnitude lower than previous reported Fe-CAT,36 that was determined using the four-point probe method, which usually provides higher conductivity values than the two-point one employed here. Still, the obtained value in this study is rather high compared to most MOFs.55
2.2. Electrochemical performance
Lithiation/delithiation cycles of Fe-HHTP electrodes were studied to evaluate its performance as a negative electrode in LIBs. Galvanostatic profiles show no clear plateau at any cycle at 355 mA g−1 (Fig. 2a) nor when varying the applied current (Fig. 2b), characteristic of pseudocapacitive behavior. Given this sloping voltage profile without defined plateaus, the electrodes were cycled within a relatively wide potential window of 0.1–3.0 V vs. Li+/Li. This range allows to evaluate the contribution of all redox-active components in the MOF, including both the metal centers and the organic ligands. Similar voltage windows have been employed in studies of MOF-based electrodes showing comparable electrochemical behavior.56 The first lithiation plot (Fig. 2a) reflects the SEI formation, with a very gradual voltage decrease below 0.75 V and a high specific capacity value that is not recovered during delithiation process. By cycle 20, secondary reactions related to solid electrolyte interface (SEI) formation are no longer occurring, as indicated by the fact that the specific capacities of both lithiation and delithiation processes coincide at ∼230 mAh g−1. This capacity increases fivefold by cycle 200. Fig. 2b also demonstrates the high rate capability of the Fe-HHTP MOF, with a capacity close to 125 mAh g−1 at 1000 mA g−1. All of this is in good agreement with an intercalation pseudocapacitive mechanism, which is common for MOFs due to their, in principle, high electrode/electrolyte interface contact.57 However, in this case, the electrode/electrolyte contact initially appears limited but increases progressively with cycling. | ||
| Fig. 2 Galvanostatic lithiation/delithiation graphs showing (a) the plot profiles at different cycles when applying a constant current of 355 mA g−1 (inset represents the profile of the 20th cycle to facilitate its visualization), (b) the plot profiles of the last cycle at 50 mA g−1 and the fifth cycle of the rest of the applied currents, (c) the cycling performance at 355 mA g−1 and (d) the rate capability (numbers inside indicate the applied current as mA g−1) of synthesized Fe-HHTP. | ||
This activation process is clearly observed in Fig. 2c, in which the discharge specific capacity values increase from 186 mAh g−1 to 1142 mAh g−1 from the 7th to the 225th cycles. Further cycling of Fe-HHTP leads to a slow decrease of the capacity leading to a ∼85% of capacity retention in the 350th cycle with respect to the highest value of measured specific capacity. Rate capability test shows that at 50 mA g−1 the coulombic efficiency (CE) of the first cycle is ∼22%, but it gradually increases in the following cycles (Fig. 2d), likely related to the SEI formation. The increasing tendency of CE with cycles continues when increasing the applied current until it reaches a value >99% at 500 mA g−1 in the 18th cycle. Nevertheless, when returning to 50 mA g−1, CE slightly decays until reaching a value of ∼93% in the 45th cycle. This could imply that Fe-HHTP experiences a kinetically slow process that is not fully reversible. Therefore, this MOF is more suitable for applications where applied currents higher than 100 mA g−1 are needed. Regarding specific capacities, the activation process in which capacities increase with cycles just occurs at applied currents ≤500 mA g−1, being this phenomenon more significant at 50 mA g−1 (Fig. 2d) than at 100, 200 and 500 mA g−1 (Fig. S7a†). Whereas, at higher currents, specific capacities gradually decrease until they seem to stabilize at 2000 mA g−1 (Fig. S7b†).
Comparing to the previous study that used Fe-CAT as an anode,22 the maximum value obtained for the discharge specific capacity was similar, although the activation was shorter in the previous study, which may be related to the lower cut-off voltage used (0.01 V vs. Li/Li+). Nevertheless, the contribution of other factors such as the different electrolyte and binder employed, and the higher proportion of carbon additive used in the previous study cannot be discarded.
2.3. Study of the electrochemical mechanism
To further investigate the electrochemical mechanism and the activation process of Fe-HHTP, XRD (Fig. S8†), XPS, IR and ex situ Raman measurements have been performed over fresh and galvanostatic cycled electrodes stopped at 0.1 V (lithiated) and 3 V (delithiated) after 1, 20 and 200 cycles. Moreover, the first lithiation has also been studied by operando Raman spectroscopy for the first time.The XPS (Fig. 3) high-resolution C 1s band of fresh electrodes present the same CC, C–C, C–O, CO and the π–π interaction stack bands that were observed in the synthesized material. Moreover, it should be considered that, in the same region of π–π interaction stack, the peak ascribed to C–F bond from PVDF binder has also been reported.58 When these electrodes are cycled, the peak in the region of 290.2 eV gets broader and is shifted to higher binding energy. Then, it can be fitted with two bands, one assigned to C–F bond and the other to a new interaction of C with Li+, as it has been reported previously.21,35 The peak assigned to C–Li interaction increases its intensity with cycles and it is also larger in the lithiated electrodes with respect to the delithiated ones, which is coherent with the increment of the specific capacity. The remaining C–Li bond in electrodes stopped at 3 V can be related to the SEI layer (with the formation of Li2CO3 among other species) or to a not fully reversible lithium-ion storage process. Regarding carbon–carbon and carbon–oxygen bonds, there is a clear reduction of the ratios CC/C–C and CO/C–O in lithiated samples with number of cycles. CC bonds are almost fully recovered during delithiation at cycles 1 and 20, but in the case of the 200th cycle there are no major changes in the lithiation and delithiation samples. The same evolution occurs with CO, since these bonds increase its intensity during delithiation in the first cycles but remain almost unchanged in the 200th one. These results are compatible with a reduction of the ligand during lithiation leading to a transition from the [sq, sq, sq]−3 or [cat, sq, sq]−4 configurations to the [cat, cat, cat]−6 one,39 and the interaction of Li+ with the catecholate aromatic ring structure. These processes seem to be not fully reversible, but, looking at the cyclability graph, this does not seem to have a significant negative effect in the CEs (>94% from the 15th cycle) nor in the specific capacities.
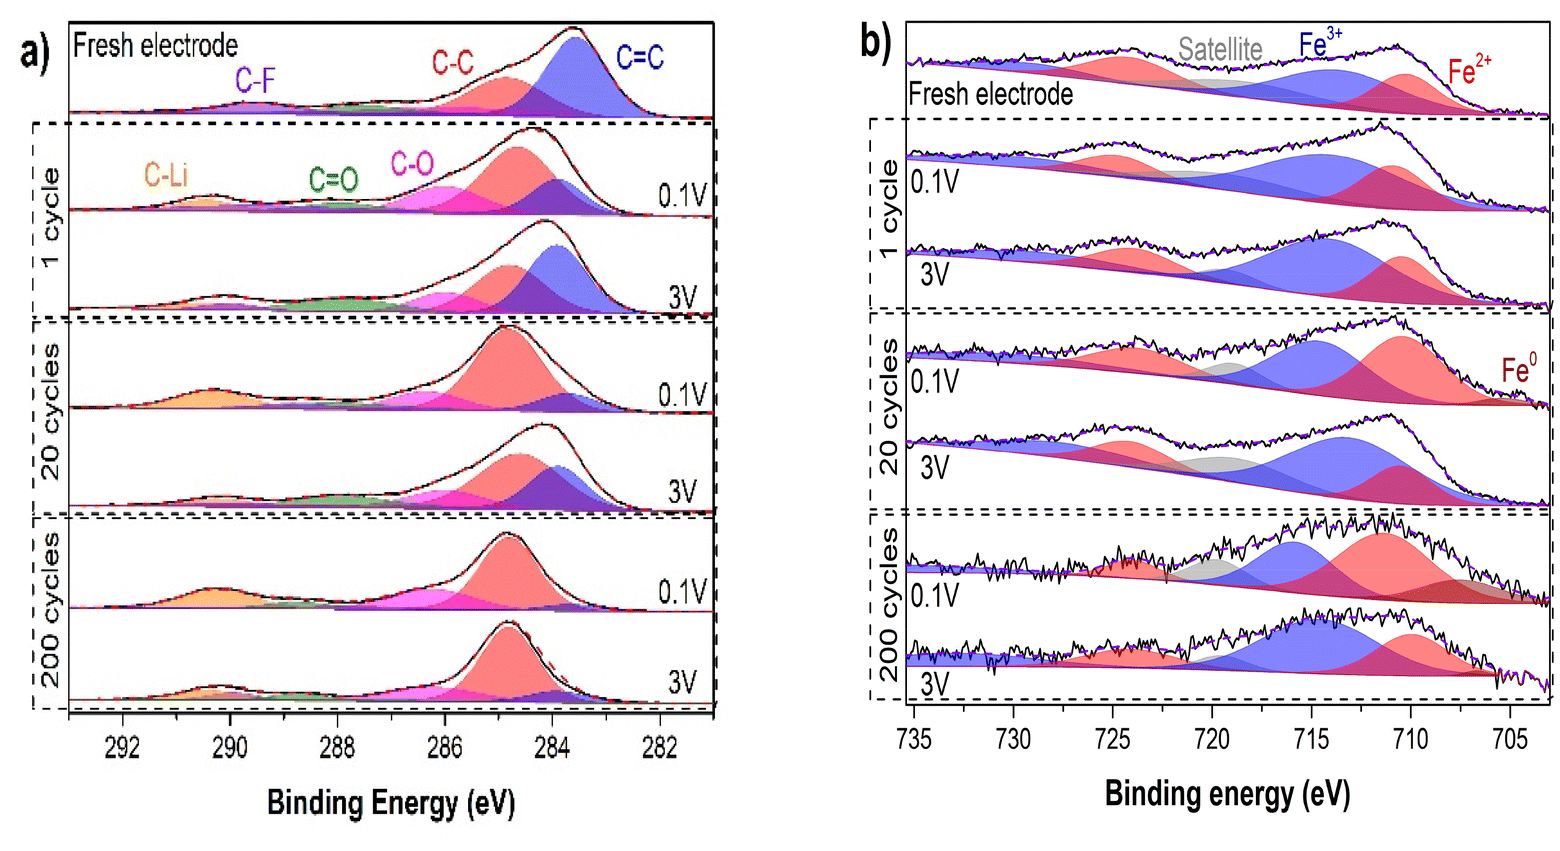 | ||
| Fig. 3 XPS high-resolution (a) C 1s and (b) Fe 2p spectra of a fresh electrode and of lithiated/delithiated electrodes stopped at the galvanostatic cycles 1st, 20th and 200th. | ||
XPS high-resolution Fe 2p plots (Fig. 3b) show that iron metal centers are electrochemically active in the Li+ storage mechanism since they undergo a reduction reaction from Fe3+ to Fe2+ during lithiation. Also, in lithiated samples at cycles 20 and 200 a new peak appears corresponding to Fe0, which is an indicative of a conversion reaction. This peak also appears in the 200th cycle delithiated sample, indicating that this process is not fully reversible. However, the intensity of this peak in this last sample is pretty low, so the number of Fe atoms that remain as Fe0 during delithiation is minimal. The fact that the Fe0 peak is significantly more intense in the 200th cycle lithiated sample than in the 20th one, means that not all metal centers are active in the first cycles, but they are being activated during cycling.
These results indicate that CO and Fe also participate in the (de)lithiation processes in Fe-HHTP, contrarily to the previously reported behavior for Fe-CAT.22 This may be the reason why fully activated Fe-HHTP can provide similar specific capacities than Fe-CAT with a higher cut-off voltage (0.1 V vs. 0.01 V vs. Li+/Li). Although this difference may also be due to the fact that the previous work only studies the first cycle, which would indicate that Fe contribution needs for an activation process.
The infrared spectrum of the fresh electrode contains three main bands at 1625 cm−1, 1255 cm−1 and 1074 cm−1 corresponding to CO, C–O and C–C bonds respectively (Fig. 4a). The band at 1255 cm−1 is also present in cycled electrodes with a second peak at 1315 cm−1. This last peak is ascribed to an increment in the electronic density around oxygen atoms, which increases the strength of the oxygen–lithium interaction, leading to an accelerated bond vibration.59 CO band is also split in two in cycled electrodes. This indicates that the oxygen atoms have two different chemical environments, which reinforces the idea of the conversion of the HHTP rings from the semiquinone (more oxidized) to the catecholate (more reduced) form. Nevertheless, the presence of CO bonds in the electrodes, even after 200 cycles, suggests that at least some of those rings remain as semiquinones (probably with a [cat, sq, sq]−4 configuration). The intensity ratio of the 1315 cm−1/1255 cm−1 bands is larger in lithiated samples with respect to delithiated ones and it also increases with cycles, which is coherent with XPS results. Also, the intensity of the peak associated with the C–C bond dramatically increases during cycling (as it was also observed for Fe-CAT during lithiation), which is an indicator of the conversion of CC bonds to C–C, probably as a result of Li+ interaction with the ligand rings.22
 | ||
| Fig. 4 Infrared spectra of fresh and cycled electrodes stopped at 0.1 V (lithiated) and 3 V (delithiated) showing the regions (a) from 2170 cm−1 to 600 cm−1 and (b) from 3740 cm−1 to 3525 cm−1. | ||
High-frequency IR spectra of cycled electrodes contain a series of weak and sharp peaks centered at 3676 cm−1 and 3566 cm−1 (the latter is only present in 20th and 200th cycles lithiated electrodes) (Fig. 4b). These peaks are related to the presence of lithium species in the electrodes that react during its exposure to the atmosphere to form LiOH and LiOH·H2O respectively.15,60,61 The increasing intensity of these peaks with cycles in lithiated samples is in good agreement with XPS results.
The Raman spectrum of a fresh non-cycled electrode contains the same Fe–O peaks at identical positions as its dried powder (Fig. 5a). Regarding the ligand related bands, there is a slight blue-shift of the ∼1584 cm−1 C–C stretching peak and an increase in the 1345 cm−1 (HHTP breathing mode)/1584 cm−1 bands intensity ratio. This may be ascribed either to the presence of a carbon additive in the electrode or to a decrease of the MOF particle size upon grinding during electrode preparation, as observed for graphitic carbon materials.50 The first galvanostatic lithiation was studied by operando Raman (Fig. 5b). The spectrum recorded in open circuit conditions shows that both the C–C stretching and the breathing mode of HHTP peaks are shifted with respect to the fresh electrode, appearing at 1588 cm−1 and 1373 cm−1 respectively. Also, the relative intensities of several peaks associated to both Fe–O bonds and HHTP ligands change with respect to the spectrum of fresh electrode with some bands no longer being visible. These changes might be associated with electrolyte interactions. During lithiation, the intensity of both 1373 cm−1 and 1588 cm−1 bands increases until reaching a voltage of 2 V vs. Li/Li+ and subsequently it continuously decreases. The first increment is presumably related to an increase in the Raman laser focusing on the electrode due to its volume changes induced by lithium insertion,62 whereas the intensity decrease is reported to occur in carbon materials as a result of the intercalation of Li+.62,63 Also, there is a clear red-shift of the 1385 cm−1 band during lithiation, which can be ascribed to a decrease of the aromatic C–C bond strength.63,64 This is in good agreement with XPS and IR data. Meanwhile, the position of the 1585 cm−1 band does not change.
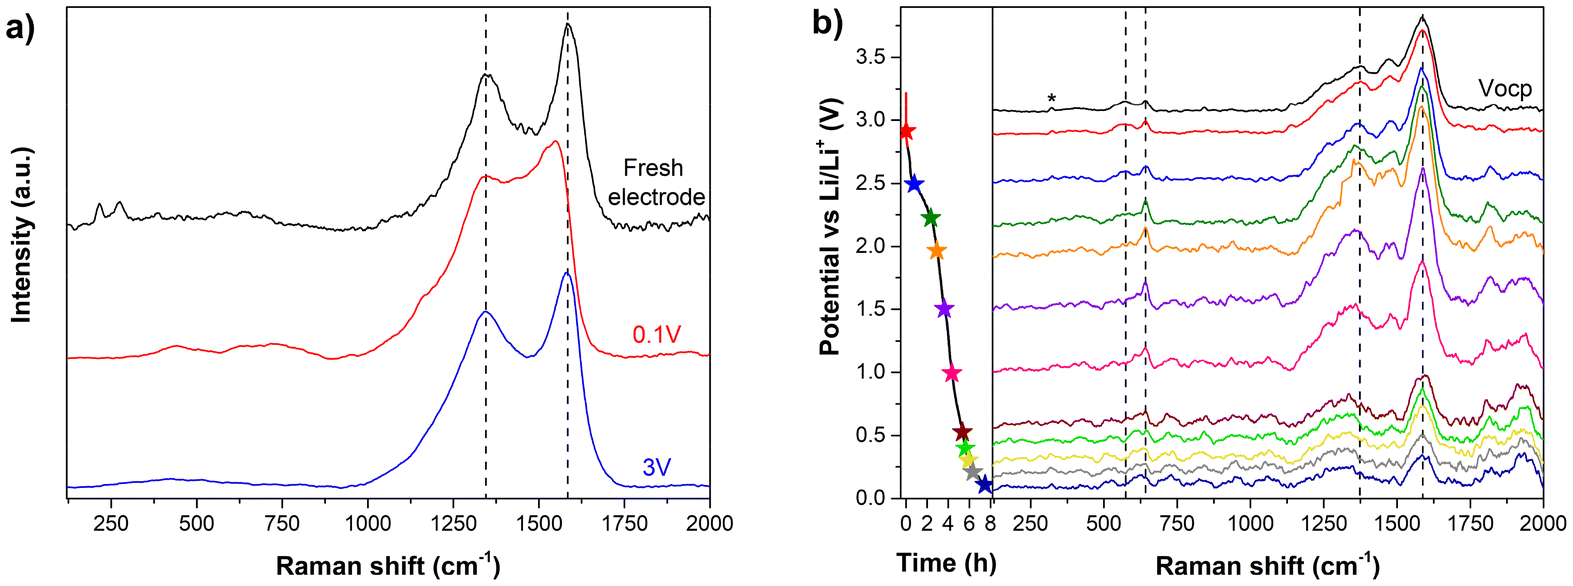 | ||
| Fig. 5 (a) Ex situ Raman measurements of two fully activated electrodes stopped at 0.1 V (lithiated) and 3 V (delithiated) and a fresh non-cycled electrode. The three spectra have been normalized to facilitate comparison. (b) Operando Raman spectra of the first galvanostatic lithiation measured at the voltages indicated in the plot profile on the left. The asterisk indicates the peak from the CaF2 window of the Raman cell used for the operando Raman measurements. | ||
To study the effect of cycles in these two bands positions, ex situ Raman measurements were performed, revealing that fully activated electrodes present an opposite behavior, with a significant red-shift of the aromatic C–C stretching peak and just a minimal change in HHTP breathing mode band position towards lower wavenumbers during lithiation (Fig. 5a). These peaks, analogous to the D and G bands of graphitic carbon are associated with the MOF boundaries and inner structure, respectively; thus, changes in the breathing mode band may reflect processes at the MOF boundaries, while modifications in the C–C stretching peak are more likely linked to transformations occurring within the MOF framework. Thus, Raman measurements presumably indicate that initially Li+ ions cannot reach the inner structure of the MOF flakes, so they just interact with Fe-HHTP units at the MOF boundaries. However, the inner MOF part eventually becomes more accessible with cycles, which could explain the increase in the specific capacity observed in galvanostatic lithiation/delithiation measurements. Hence, the activation process appears to be related to a change in the MOF structure with cycling. In the previous study, Fe-CAT electrodes were characterized by ex situ Raman,22 obtaining that both C–C stretching peak and HHTP breathing mode bands shift during the first cycle, but unlike in this study, the former band moves towards higher wavenumbers during lithiation at voltages ≤0.5 V vs. Li/Li+. The origin of this blue-shift is unclear, since the study does not provide detailed information about the electrode processing before the Raman measurement.
Regarding the lower frequency Raman region, the clearest peaks associated with Fe–O bonds in open circuit conditions appear at 567 cm−1 and 642 cm−1.48,49 Both bands show a red-shift during lithiation, likely related to a weakening of the bond, which further confirm the interaction between Li+ and the oxygen atoms.
To further investigate the processes occurring in this MOF during (de)lithiation, CVs along with EIS measurements have been performed. Fig. 6a shows the first three CVs cycles at 0.1 mV s−1. A broad voltammogram with wide, low-intensity peaks is obtained, aligning well with a pseudocapacitive multistep intercalation mechanism. In the first cathodic scan, four main peaks appear at 1.47 V, 0.65 V, 0.56 V and 0.1 V (vs. Li+/Li) and their intensities dramatically decrease in subsequent cycles, which is associated to the SEI formation. In the second and third cycles, the peak at 0.56 V disappears, but the other three can still be observed and they are assigned to the transitions from CO to C–O65 and from CC to C–C,22 and to the Li+ insertion between the MOF layers,20 respectively. Also, at 0.7 V appears the conversion peak related to Fe metal,66 but according to the XPS, this contribution is not appreciable in the first cycles. In the anodic scans, there are two main peaks which are related to the recovery of CO bonds at 2.15 V, and the reaction from C–C to CC at ∼1 V, and a shoulder at ∼0.3 V associated with the delithiation process from the MOF layers.20 Along further cycling (Fig. S9a and b†), the cathodic peak at 0.1 V experiences a major reduction in the first few scans and it never recovers with cycles. Whereas the peak associated with the C–C formation becomes more intense and displaces to higher voltages until the 30th cycle, indicating that the great majority of Li+ storage occurs at voltages far enough from Li+ reduction. Therefore, the formation of dendrites can be reduced with this MOF while still providing good specific capacities. The evolution of the rest of the peaks is described in Fig. S9.†
 | ||
| Fig. 6 (a) CVs obtained at a scan rate of 0.1 mV s−1 showing the first 3 cycles. (b) Third scan of the CVs measured at scan rates from 0.1 mV s−1 to 2.5 mV s−1. For easier visualization of peaks changes the scan rates of 5 mV s−1 and 10 mV s−1 have not been included, but they can be seen in Fig. S10.† (c) Nyquist plots obtained at 1.5 V in the cathodic (red) and anodic (blue) sweep of the 20th cycle (the experimental values appear as circles and the fittings as lines). Inset contains the equivalent circuits used for the fitting. (d) Evolution of the calculated values of Rr at 1.5 V in the anodic sweep and of Rd at 0.1 V and 1.5 V in the cathodic sweep with the number of cycles. | ||
CVs at different scan rates from 0.1 mV s−1 to 10 mV s−1 are shown in Fig. 6b and Fig. S10.† When the scan rate is increased the position of the two peaks related to the interconversion between CC and C–C bonds shift so that they become more separated. Nevertheless, the shift of the anodic peak is significantly larger, which confirms that the recovery of CC is a slower process. The cathodic peak associated with the formation of C–O also displaces to lower voltages with scan rate. However, its corresponding anodic peak does not change its position, but it rather becomes much wider as the speed increases, which can also be related to a kinetically slow reaction.
Electrochemical impedance spectroscopy (EIS) measurements were conducted at various potentials during cyclic voltammetry (CV) cycles. Fig. 6c illustrates representative Nyquist plots obtained at 1.5 V during both cathodic and anodic scans of cycle 20. The experimental data (symbols) were fitted (solid lines) using two distinct electrical equivalent circuits, shown in the figure inset.
In the high-frequency region, both Nyquist plots exhibit a characteristic semicircle, which was modeled using a series resistance (Rs) connected to a parallel combination of charge transfer resistance (Rct) and double-layer capacitance (Cdl). At lower frequencies, the plots display divergent behavior, necessitating different circuit elements for accurate fitting. In the cathodic sweep, a straight line suggests a finite-length diffusion element with γ < 1, characteristic of a multiphasic.67,68 Conversely, in the anodic scan, a second semicircle appears, modeled with a resistance (Rr) in parallel with a chemical capacitance (Cμ). These findings indicate that lithiation and delithiation processes share similar Rct and Cdl values, as evidenced by the comparable arches at high frequencies. However, the limiting processes differ: during lithiation, diffusion resistance (Rd) dominates, whereas delithiation is limited by a resistance of different origin. In both cases, the Rr and Rd are in the same order of magnitude (Fig. 6d). In this figure, Rd calculated at 0.1 V is also represented. At 0.1 V, a finite-length diffusion element provides a better fit than a resistance–capacitance parallel model, confirming that Li+ diffusion within the MOF limits the lithiation process. Besides, Rd at 0.1 V is an order of magnitude lower than at cathodic 1.5 V suggesting that the lithiation diffusion within the MOF is easier once the change from CC to C–C has occurred at 0.65 V.
2.4. Mechanism proposal
Based on all the information obtained, an electrochemical mechanism is proposed. Regarding the ligand, during the galvanostatic discharge, the negative charges inserted into the electrode provoke the HHTP carbon rings transition from its original semiquinone form to the catecholate one, probably adopting a [cat, cat, cat]−6 configuration. The ratio of C–O/CO groups is larger in catecholates than in semiquinones, so this transition would explain the results obtained by XPS, FTIR and CVs. Also, these techniques show an increase of C–C ratio with respect to CC. Therefore, besides the formation of catecholate, C–Li interactions occur breaking the π bonds. During delithiation, the reverse processes occur: a cleavage of C–Li bonds and a recovery of both CC bonds and the semiquinone form. However, these recovery reactions are kinetically slower than the lithiation ones, which causes an incomplete restoration of the initial configuration. Meanwhile, Fe atoms undergo a reduction reaction during lithiation from Fe3+ to Fe2+ and some of them even to Fe0. Probably, iron cations remain attached to HHTP ligands, but their Fe–O bonds are weakened because of the Li+ interactions with oxygen atoms, as observed in operando Raman results. Then, Fe0 atoms may leave the MOF structure while Li+ occupy their initial positions during the conversion reaction. However, XPS show that most Fe0 are subsequently oxidized and, therefore, after delithiation, they appear to be part of the framework structure. This mechanism differs from that described for Fe-CAT, in which the only process occurring is the C–Li bond formation.22
At first, these processes just happen at the Fe-HHTP structure boundaries, but as cycles pass, they also begin to occur in its internal region. This could indicate that the initial MOF framework physically hinders Li+ penetration into its inner part, but that its structure evolves with cycles making this internal part more accessible. This evolution, which is responsible of the activation process observed in galvanostatic cycles, could either be related to an increase of the interlayer spacing between its 2D layers (as observed for some covalent–organic frameworks)35 or to a complete deformation of the MOF structure in a way in which all its parts are exposed. Possibly, this activation process is relatively slow and requires a significant amount of Li+ to interact with the MOF. This could explain why the specific capacities increase only at low rates in the rate capability graph. Finally, since delithiation processes are not fully reversible, there is a point after several cycles in which a significant amount of HHTP ligands remain in the [cat, cat, cat]−6 configuration with some presence of the [cat, sq, sq]−4 one and most CC bonds are no longer being recovered. This may be the reason for the minimal changes observed in C 1s XPS spectra of lithiated and delithiated electrodes in the 200th cycle.
3. Conclusions
This study highlights the relevance of operando Raman spectroscopy, complemented by ex situ techniques, for understanding the (de)lithiation mechanisms in MOFs used as electrodes in LIBs. In particular, Fe-HHTP MOF, synthesized through a simple procedure, has been studied as a negative electrode in LIBs, showing a progressive increase in specific capacity up to 1142 mAh g−1 after 225 cycles at 355 mA g−1. This capacity enhancement is attributed to a structural activation process induced by cycling, enabling great accessibility to the inner regions of the material.Operando Raman spectroscopy during the first lithiation reveals Li+ insertion and a weakening of aromatic C–C bonds. Additional ex situ characterizations indicate that this effect becomes more relevant with cycling, which also leads to a weakening of the Fe–O bond due to the increasing interaction between Li+ and the oxygen atoms as the number of cycles increases. These results confirm a gradual structural transformation of the MOF during battery operation, leading to a fully activated material after extended cycling.
These findings evidence the multistep intercalation mechanism and the importance of the electrolyte accessibility to the MOF electrode for fully utilizing its capacity, involving not only interlayer space but also structural C–C, C–O and Fe–O bonds. Thus, synthesis and electrode preparation play a key role in battery performance. To enable the direct application of MOFs in batteries, it is essential to ensure full electrolyte access so that the MOF is already activated. This could be achieved through initial conditioning protocols during cell formation, or by optimizing the MOF design to facilitate earlier activation.
Future studies should focus on accelerating this activation by implementing preconditioning prorocols prior galvanostatic or structural modifications of the MOF. Preconditioning protocols include reducing the cycling rate, adjusting the cut-off voltage, or maintaining the cell at low potential (e.g. 10 mV vs. Li+/Li) during the initial cycles to promote early structural transformation. Cyclic voltammetry instead of constant current cycling could also be employed to facilitate equilibration. Additionally, structural modifications may include adjusting the composition to control the crystallinity and introduce 1D channels, using spacers to increase interlayer separation, modifying the ligand nature69 or employing metal substitution or mixture of metals56 to alter ionic radius or electronic structure. These modifications should follow green synthetic principles, such as the use of longer-chain solvents or modulation of metal–ligand coordination to enhance flexibility, porosity, and electrolyte accessibility from the earliest stages of cycling.
4. Materials and methods
4.1. MOF synthesis
The synthesis, adapted from a previous publication,70 consists in mixing 0.032 mmol of HHTP (>95.0%, TCI), 0.065 mmol of iron(II) acetate (99.995%, Sigma-Aldrich) and 1.95 mL of deionized water in a 10 mL vial and placing it in an ultrasound bath for 5 minutes. 0.15 mL of dimethylformamide (DMF; ≥99.8%, Sigma-Aldrich) are added and the vial is sonicated for another 5 minutes. After that, the closed vial is heated at 80 °C in an oven for 20 hours. Afterwards, the content of the vial is centrifugated, and the solid is washed with water, ethanol and acetone (two times with each solvent). Finally, the obtained powder is dried at 50 °C.4.2. Powder and electrodes ex situ characterization techniques
Powder X-Ray Diffraction (PXRD) characterization was performed in a D-Max Rigaku, Ru300 equipped with a rotating anode and using Cu Kα radiation. The measurement conditions were between 3° and 50° 2θ with a 0.03° step and 1 s per step for the synthesized powder and between 5° and 35° 2θ with a 0.03° step and 2 s per step for the fresh electrode. A FEG INSPECT 50 from FEI was used to obtain Scanning Electron Microscopy (SEM) images. An X-ray photoelectron spectroscopy AXIS SupraTM from Kratos with monochromated Al Kα = 1486.6 eV performed the X-ray photoelectron spectroscopy (XPS) measurements. The obtained data were calibrated considering that the position of the C–C peak in the high-resolution C 1s spectra is at 284.8 eV and analyzed with the software CasaXPS. A Bruker FTIR Vertex 70 performed the attenuated total reflection-Fourier transform infrared spectroscopy measurements between 4000 and 600 cm−1 by averaging 40 scans. Thermogravimetric analysis (TGA) was done in a SDT 2960 from TA Instruments from room temperature to 700 °C heating at a rate of 5 °C min−1 in air. Ex situ Raman measurements were performed by placing the dried materials inside an airtight Raman cell with a borosilicate window and using a Renishaw in Via Raman Microscope with a 50× objective. The Raman measurement conditions were an excitation wavelength of 532 nm at 10% of power, 1 accumulation and an acquisition time of 20 s for fresh powder and electrodes and of 60 s for cycled electrodes. The baseline of Raman spectra was removed, and the resulting plots were smoothed to facilitate the visualization of the different peaks. The bulk electronic conductivity (σ) was obtained by a two-point probe method in which synthesized Fe-HHTP powder were placed between the two stainless steel current collectors (⊘ 7 mm) of a Swagelok cell. The resistance (R) was obtained by doing an electrochemical impedance spectroscopy (EIS) measurement between 106 to 10−2 Hz while applying 1 V with an Autolab M204 and a pressure of 226 MPa using a hydraulic press (RIKEN SEIKI P-163), and by fitting the obtained data to a Randles model equivalent circuit. A micrometer (Mitutoyo) was used for measuring the thickness of the formed pellet (l). Finally, the electronic conductivity (σ) was calculated with the equation σ = l/(R·A), being A the pellet area.All galvanostatic cycled electrodes were washed with one of the electrolytes organic solvents (DEC for ex situ PXRD, XPS and IR, and DMC for ex situ Raman) and dried under vacuum in the antechamber of the glovebox for a few hours prior to measurement.
4.3. Electrochemical measurements and operando Raman
Electrodes were prepared by mixing in an agate mortar the synthesized Fe-HHTP powder with carbon black Super P (99+, AlfaAesar) and poly(vinylidene fluoride) (PVDF, AlfaAesar) in a weight ratio 80![[thin space (1/6-em)]](https://www.rsc.org/images/entities/char_2009.gif) :10:10 and adding N-methyl pyrrolidone (NMP, Sigma-Aldrich) as the solvent. The obtained slurry was deposited onto a copper foil (thickness 0.012 mm, Aotelec) and then dried first in a hot-plate for 10 minutes and subsequently in a thermostatic vacuum dryer (Selecta) for 12 hours at 120 °C in vacuum conditions. The obtained sample was pressed at 128 kg cm−2 and ⊘ 8 mm discs were cut and assembled in either CR2032 coin cells (for performing the electrochemical measurements) or in Swagelok cells (for subsequent characterization of the cycled electrodes by XRD, XPS and IR) inside an Ar glovebox (VAC-ATM). Lithium foil (thickness 0.4 mm, Aotelec) was the reference and counter electrode, and the electrolyte used was 1 M LiPF6 in EC:DEC (1:1) (v:v) (Sigma-Aldrich) embedded in a fiber glass (Grade GF/C, Whatman® glass) separator. Alternatively, rectangular electrodes of ∼10 mm × ∼2 mm were cut and assembled in an adapted electrochemical Raman cell inside an Ar glovebox (PureLab HE, H2O and O2 ≤0.1 ppm) using 1 M LiPF6 in DMC:EC (1:1) (v:v) (Solvionic) electrolyte embedded in two fiber glass (Grade GF/F, Whatman® glass) separators and a lithium disc (thickness 0.38 mm, Sigma-Aldrich) was used as reference and counter electrode for performing the operando Raman measurements. For assembling this electrochemical Raman cell, the rectangular electrode was wrapped between the two separators (one of them containing a hole in the middle) and placed with the copper foil facing lithium, as it is reported elsewhere.71 For sealing the cell a CaF2 window was used, which gives rise to a peak at 320 cm−1 in the Raman spectra. The scheme of the electrochemical Raman cell configuration can be observed in Fig. S11.† The average active material loading in the electrodes was 0.56 ± 0.28 mg cm−2.
:10:10 and adding N-methyl pyrrolidone (NMP, Sigma-Aldrich) as the solvent. The obtained slurry was deposited onto a copper foil (thickness 0.012 mm, Aotelec) and then dried first in a hot-plate for 10 minutes and subsequently in a thermostatic vacuum dryer (Selecta) for 12 hours at 120 °C in vacuum conditions. The obtained sample was pressed at 128 kg cm−2 and ⊘ 8 mm discs were cut and assembled in either CR2032 coin cells (for performing the electrochemical measurements) or in Swagelok cells (for subsequent characterization of the cycled electrodes by XRD, XPS and IR) inside an Ar glovebox (VAC-ATM). Lithium foil (thickness 0.4 mm, Aotelec) was the reference and counter electrode, and the electrolyte used was 1 M LiPF6 in EC:DEC (1:1) (v:v) (Sigma-Aldrich) embedded in a fiber glass (Grade GF/C, Whatman® glass) separator. Alternatively, rectangular electrodes of ∼10 mm × ∼2 mm were cut and assembled in an adapted electrochemical Raman cell inside an Ar glovebox (PureLab HE, H2O and O2 ≤0.1 ppm) using 1 M LiPF6 in DMC:EC (1:1) (v:v) (Solvionic) electrolyte embedded in two fiber glass (Grade GF/F, Whatman® glass) separators and a lithium disc (thickness 0.38 mm, Sigma-Aldrich) was used as reference and counter electrode for performing the operando Raman measurements. For assembling this electrochemical Raman cell, the rectangular electrode was wrapped between the two separators (one of them containing a hole in the middle) and placed with the copper foil facing lithium, as it is reported elsewhere.71 For sealing the cell a CaF2 window was used, which gives rise to a peak at 320 cm−1 in the Raman spectra. The scheme of the electrochemical Raman cell configuration can be observed in Fig. S11.† The average active material loading in the electrodes was 0.56 ± 0.28 mg cm−2.
The rate capability measurements and the cycling performance test at 355 mA g−1 were performed between 0.1 and 3 V vs. Li+/Li in a Neware Battery Tester System. An Autolab M204 measured the cyclic voltammetries (CVs) in the same voltage range and the electrochemical impedance spectroscopy (EIS) between 1 MHz and 10 mHz. Z-view software was used for fitting the obtained EIS data to the proposed equivalent circuit. Operando Raman measurements were performed in a Renishaw in Via Raman Microscope with a 50× objective with a 532 nm excitation wavelength at 1% of power doing 2 accumulations and using an acquisition time of 90 s. A Bio-Logic SP-150 was used for applying the galvanostatic current during the operando Raman measurements. The baseline of all Raman spectra was removed, and the obtained plots were smoothed to facilitate the visualization of the different peaks.
Abbreviations
| cat | Catecholate |
| CE | Coulombic efficiency |
| CV | Cyclic voltammetry |
| DMF | Dimethylformamide |
| EIS | Electrochemical impedance spectroscopy |
| HHTP | 2,3,6,7,10,11-Hexahydroxytriphenylene |
| IR | Infrared spectroscopy |
| LIBs | Lithium-ion batteries |
| MOF | Metal–organic framework |
| PXRD | Powder X-Ray diffraction |
| SEI | Solid electrolyte interphase |
| SEM | Scanning electron microscopy |
| sq | Semiquinone |
| TGA | Thermogravimetric analysis |
| XPS | X-ray photoelectron spectroscopy |
Data availability
The data that support the findings of this study are available from the corresponding author upon reasonable request.Conflicts of interest
The authors declare no conflict of interest.Acknowledgements
I. C.-R. acknowledges Programa Ibercaja-CAI de Estancias de Investigación (reference number CB 5/24). M. H. and E. J. J.-P. acknowledge the project CPP2022-009766 funded by MICIU/AEI/10.13039/501100011033 and NextGenerationEU/PRTR. M. H. acknowledges the project CNS2023-14197, funded by MICIU/AEI/10.13039/501100011033, and, “ESF Investing in your future” and the European Union NextGenerationEU/PRTR. I. C.-R., E. J. J.-P., M. H. and I. G. acknowledge the projects PID2022-140516OB-I00 and CEX2023-001286-S funded by MCICIU/AEI/10.13039/501100011033 and FEDER, UE. L. H. and A. N. acknowledge UK Faraday Institution (EPSRC EP/S003053/1) through the degradation project (grant number FIRG024). I. C.-R., I. G. and M. H. acknowledge financial support from the Aragón Government (PLATON E31_23R). Authors would like to acknowledge the use of Servicio General de Apoyo a la Investigación-SAI, Universidad de Zaragoza.References
- Basree, A. Ali, K. Kumari, M. Ahmad and G. C. Nayak, Chem. Commun., 2024, 60, 13292–13313 RSC
.
- G. Song, Y. Shi, S. Jiang and H. Pang, Adv. Funct. Mater., 2023, 33, 2303121 CrossRef CAS
- F. S. Ke, Y. S. Wu and H. Deng, J. Solid State Chem., 2015, 223, 109–121 CrossRef CAS
- L. Niu, T. Wu, M. Chen, L. Yang, J. Yang, Z. Wang, A. A. Kornyshev, H. Jiang, S. Bi and G. Feng, Adv. Mater., 2022, 34, 2200999 CrossRef CAS PubMed
- M. Shen and H. Ma, Coord. Chem. Rev., 2022, 470, 214715 CrossRef CAS
- T. Li, Y. Bai, Y. Wang, H. Xu and H. Jin, Coord. Chem. Rev., 2020, 410, 213221 CrossRef CAS
- G. Fang, J. Zhou, C. Liang, A. Pan, C. Zhang, Y. Tang, X. Tan, J. Liu and S. Liang, Nano Energy, 2016, 26, 57–65 CrossRef CAS
- X. Tan, Y. Wu, X. Lin, A. Zeb, X. Xu, Y. Luo and J. Liu, Inorg. Chem. Front., 2020, 7, 4939–4955 RSC
- D. P. Dubal, K. Jayaramulu, J. Sunil, Š. Kment, P. Gomez-Romero, C. Narayana, R. Zbořil and R. A. Fischer, Adv. Funct. Mater., 2019, 29, 1900532 CrossRef
- X. Xu, R. Cao, S. Jeong and J. Cho, Nano Lett., 2012, 12, 4988–4991 CrossRef CAS PubMed
- J. Lin, C. Zeng, Y. Chen, X. Lin, C. Xu and C. Y. Su, J. Mater. Chem. A, 2020, 8, 6607–6618 RSC
- F. Zheng, Y. Yang and Q. Chen, Nat. Commun., 2014, 5, 1–10 Search PubMed
- H. Meng, Y. Han, C. Zhou, Q. Jiang, X. Shi, C. Zhan and R. Zhang, Small Methods, 2020, 4, 2000396 CrossRef CAS
- M. Ko, L. Mendecki and K. A. Mirica, Chem. Commun., 2018, 54, 7873–7891 RSC
- I. Ciria-Ramos, A. García-Fernández, Á. Mayoral, A. Orera, E. J. Juarez-Perez and M. Haro, J. Mater. Chem. A, 2024, 12, 20215–20228 RSC
- L. Moutanassim, M. Aqil, A. Chari, J. Alami, M. Dahbi and S. El Hankari, J. Energy Storage, 2024, 93, 112055 Search PubMed
- J. C. Yin, X. Lian, Z. G. Li, M. Cheng, M. Liu, J. Xu, W. Li, Y. Xu, N. Li and X. H. Bu, Adv. Funct. Mater., 2024, 34, 2403656 Search PubMed
- Y. Cai, W. Wang, X. Cao, L. Wei, C. Ye, C. Meng, A. Yuan, H. Pang and C. Yu, Adv. Funct. Mater., 2022, 32, 2109927 CrossRef CAS
- P. Mao, H. Fan, C. Liu, G. Lan, W. Huang, Z. Li, H. Mahmoud, R. Zheng, Z. Wang, H. Sun and Y. Liu, Sustainable Energy Fuels, 2022, 6, 4075–4084 Search PubMed
- A. Nazir, H. T. T. Le, A. G. Nguyen and C. J. Park, Electrochim. Acta, 2021, 389, 138750 CrossRef CAS
- L. Guo, J. Sun, X. Sun, J. Zhang, L. Hou and C. Yuan, Nanoscale Adv., 2019, 1, 4688–4691 RSC
- P. Mao, H. Fan, G. Zhou, H. Arandiyan, C. Liu, G. Lan, Y. Wang, R. Zheng, Z. Wang, S. K. Bhargava, H. Sun and Y. Liu, J. Colloid Interface Sci., 2023, 634, 63–73 Search PubMed
- C. Leroy, T. X. Métro, I. Hung, Z. Gan, C. Gervais and D. Laurencin, Chem. Mater., 2022, 34, 2292–2312 CrossRef CAS PubMed
- X. Wang, W. Zhou, S. Zhai, X. Chen, Z. Peng, Z. Liu, W. Q. Deng and H. Wu, Angew. Chem., Int. Ed., 2024, 63, e202400323 CrossRef CAS PubMed
- M. Kim, J. Jeong, D. H. Kim, G. Park, J. Yi, S. Kim, H. Kim, C. H. Choi, H. Shin and S. S. Park, Adv. Energy Mater., 2024, 14, 2401198 CrossRef CAS
- L. Hamon, P. L. Llewellyn, T. Devic, A. Ghoufi, G. Clet, V. Guillerm, G. D. Pirngruber, G. Maurin, C. Serre, G. Driver, W. Van Beek, E. Jolimaître, A. Vimont, M. Daturi and G. Férey, J. Am. Chem. Soc., 2009, 131, 17490–17499 Search PubMed
- J. Sunil, C. Narayana, G. Kumari and K. Jayaramulu, Chem. Soc. Rev., 2023, 52, 3397–3437 Search PubMed
- W. Lv, X. Shi, H. Huang, Y. Niu, W. Yang, P. Liu, W. Qin and W. He, Mater. Today Energy, 2017, 3, 40–44 CrossRef
- A. R. Neale, D. C. Milan, F. Braga, I. V. Sazanovich and L. J. Hardwick, ACS Energy Lett., 2022, 7, 2611–2618 CrossRef CAS PubMed
- Y. Miroshnikov and D. Zitoun, J. Nanopart. Res., 2017, 19, 1–12 CrossRef CAS
- Y. Miroshnikov, J. Yang, V. Shokhen, M. Alesker, G. Gershinsky, A. Kraytsberg, Y. Ein-Eli and D. Zitoun, ACS Appl. Energy Mater., 2018, 1, 1096–1105 CrossRef CAS
- E. Flores, P. Novák and E. J. Berg, Front. Energy Res., 2018, 6, 82 CrossRef
- P. Jehnichen and C. Korte, Anal. Chem., 2019, 91, 8054–8061 Search PubMed
- H. Gao, A. R. Neale, Q. Zhu, M. Bahri, X. Wang, H. Yang, Y. Xu, R. Clowes, N. D. Browning, M. A. Little, L. J. Hardwick and A. I. Cooper, J. Am. Chem. Soc., 2022, 144, 9434–9442 CrossRef CAS PubMed
- Z. Lei, Q. Yang, Y. Xu, S. Guo, W. Sun, H. Liu, L. P. Lv, Y. Zhang and Y. Wang, Nat. Commun., 2018, 9, 1–13 CrossRef PubMed
- M. Stodolka, J. Y. Choi, J. Flood, H. T. B. Pham and J. Park, ACS Appl. Nano Mater., 2022, 5, 2156–2162 CrossRef CAS
- J. Li, Y. Huang, Y. Zhou, H. Dong, H. Wang, H. Shan, Y. Li, M. Xu and X. Wang, ACS Appl. Nano Mater., 2023, 6, 22916–22926 Search PubMed
- Y. Liu, Y. Wei, M. Liu, Y. Bai, X. Wang, S. Shang, C. Du, W. Gao, J. Chen and Y. Liu, Adv. Mater., 2021, 33, 2007741 CrossRef CAS PubMed
- C. S. Grange, A. J. H. M. Meijer and M. D. Ward, Dalton Trans., 2010, 39, 200–211 RSC
- M. Hmadeh, Z. Lu, Z. Liu, F. Gándara, H. Furukawa, S. Wan, V. Augustyn, R. Chang, L. Liao, F. Zhou, E. Perre, V. Ozolins, K. Suenaga, X. Duan, B. Dunn, Y. Yamamto, O. Terasaki and O. M. Yaghi, Chem. Mater., 2012, 24, 3511–3513 CrossRef CAS
- X. Liu, M. Zhuo, W. Zhang, M. Gao, X. H. Liu, B. Sun and J. Wu, Ultrason. Sonochem., 2020, 67, 105179 CrossRef CAS PubMed
- H. Cao, L. Ji and S. Shen, Chem. Eng. J., 2023, 456, 141081 CrossRef CAS
- J. Dong, D. W. Boukhvalov, C. Lv, M. G. Humphrey, C. Zhang and Z. Huang, J. Mater. Chem. A, 2023, 11, 16683–16694 RSC
- S. Jiang, X. Mo, X. Zhao, X. Yan, Z. Zhang, J. Liu, H. Hu, N. Wang and M. Yang, Analysis Sens., 2024, 4, e202400024 CrossRef CAS
- Z. Z. Ma, Q. H. Li, Z. Wang, Z. G. Gu and J. Zhang, Nat. Commun., 2022, 13, 6347 CrossRef CAS PubMed
- D. L. A. De Faria, S. Venâncio Silva and M. T. De Oliveira, J. Raman Spectrosc., 1997, 28, 873–878 CrossRef CAS
- J. Fujita, A. E. Martell and K. Nakamoto, J. Chem. Phys., 1962, 36, 324–331 CrossRef CAS
- W. J. Barreto, R. A. Ando, P. S. Santos and W. P. Silva, Spectrochim. Acta, Part A, 2007, 68, 612–618 Search PubMed
- I. Michaud-Soret, K. K. Andersson, L. Que Jr and J. Haavik, Biochemistry, 1995, 34, 5504–5510 CrossRef CAS PubMed
- A. Ferrari and J. Robertson, Phys. Rev. B: Condens. Matter Mater. Phys., 2000, 61, 14095 CrossRef CAS
- L. Öhrström and I. Michaud-Soret, J. Phys. Chem. A, 1999, 103, 256–264 Search PubMed
- C. Guo, Z. Li, F. Duan, Z. Zhang, F. Marchetti and M. Du, J. Mater. Chem. B, 2020, 8, 9951–9960 RSC
- Z. Liu, M. Chen, Y. Lin, W. Liu, Y. Peng and Y. Liu, Int. J. Hydrogen Energy, 2024, 53, 891–898 CrossRef CAS
- F. Jiang, Y. Wang, T. Qiu, G. Yang, C. Yang, J. Huang, Z. Fang and J. Li, J. Power Sources, 2022, 523, 231041 Search PubMed
- L. Sun, M. G. Campbell and M. Dincă, Angew. Chem., Int. Ed., 2016, 55, 3566–3579 CrossRef CAS PubMed
- D. Zhou, J. Ni and L. Li, Nano Energy, 2019, 57, 711–717 Search PubMed
- Y. Liao, C. Li, X. Lou, P. Wang, Q. Yang, M. Shen and B. Hu, J. Colloid Interface Sci., 2017, 506, 365–372 CrossRef CAS PubMed
- Y. Zhu, J. Wang, F. Zhang, S. Gao, A. Wang, W. Fang and J. Jin, Adv. Funct. Mater., 2018, 28, 1804121 CrossRef
- C. Dong and L. Xu, ACS Appl. Mater. Interfaces, 2017, 9, 7160–7168 CrossRef CAS PubMed
- X. Liu and J. Liu, Corros. Sci., 2017, 115, 129–134 CrossRef CAS
- X. Zhang, L. Guo, L. Gan, Y. Zhang, J. Wang, L. R. Johnson, P. G. Bruce and Z. Peng, J. Phys. Chem. Lett., 2017, 8, 2334–2338 Search PubMed
- M. A. Cabañero, M. Hagen and E. Quiroga-González, Electrochim. Acta, 2021, 374, 137487 CrossRef
- C. Sole, N. E. Drewett and L. J. Hardwick, Faraday Discuss., 2014, 172, 223–237 RSC
- L. J. Hardwick, P. W. Ruch, M. Hahn, W. Scheifele, R. Kötz and P. Novák, J. Phys. Chem. Solids, 2008, 69, 1232–1237 Search PubMed
- Y. Chen, Q. Zhu, K. Fan, Y. Gu, M. Sun, Z. Li, C. Zhang, Y. Wu, Q. Wang, S. Xu, J. Ma, C. Wang and W. Hu, Angew. Chem., 2021, 133, 18917–18924 CrossRef
- J. S. Cho, Y. J. Hong and Y. C. Kang, ACS Nano, 2015, 9, 4026–4035 Search PubMed
- J. Bisquert, G. Garcia-Belmonte and Á. Pitarch, ChemPhysChem, 2003, 4, 287–292 CrossRef CAS PubMed
- N. Vicente, M. Haro and G. Garcia-Belmonte, Chem. Commun., 2018, 54, 1025–1040 RSC
- D. Zhou and J. Ni, Chem. – Eur. J., 2025, 31, e202403902 CrossRef CAS PubMed
- M. Ko, A. Aykanat, M. K. Smith and K. A. Mirica, Sensors, 2017, 17, 2192 CrossRef PubMed
- T. E. Rosser, E. J. F. Dickinson, R. Raccichini, K. Hunter, A. D. Searle, C. M. Kavanagh, P. J. Curran, G. Hinds, J. Park and A. J. Wain, J. Electrochem. Soc., 2021, 168, 070541 CrossRef CAS
Footnote |
| † Electronic supplementary information (ESI) available. See DOI: https://doi.org/10.1039/d5dt00893j |
| This journal is © The Royal Society of Chemistry 2025 |