 Open Access Article
Creative Commons Attribution 3.0 Unported Licence
Low temperature growth of sub 10 nm particles by ammonium nitrate condensation
Neil M.
Donahue
 *a,
Mao
Xiao
b,
Ruby
Marten
 b,
Mingyi
Wang
ad,
Weimeng
Kong
h,
Meredith
Schervish
 ac,
Qing
Ye
a,
Victoria
Hofbauer
a,
Lubna
Dada
 b,
Jonathan
Duplissy
 g,
Henning
Finkenzeller
g,
Hamish
Gordon
g,
Henning
Finkenzeller
g,
Hamish
Gordon
 a,
Jasper
Kirkby
 fj,
Houssni
Lamkaddam
b,
Vladimir
Makhmutov
k,
Maxim
Philippov
 k,
Birte
Rörup
 g,
Rainer
Volkamer
i,
Dongyu
Wang
b,
Stefan K.
Weber
j,
Richard C.
Flagan
h,
Dominik
Stolzenburg
e and
Imad
El Hadad
 b
b
aCarnegie Mellon University, Department of Chemistry, Pittsburgh, PA, USA. E-mail: nmd@andrew.cmu.edu; Tel: +1 412 268-4415
bLaboratory for Atmospheric Chemistry, Paul Scherrer Institute, Villigen, Switzerland
cUniversity of California, Irvine Department of Chemistry, Irvine, CA, USA
dUniversity of Chicago Department of the Geophysical Sciences, Chicago, IL, USA
eTechnical University of Vienna, Vienna, Austria
fInstitute, for Atmospheric and Environmental Sciences, Goethe University Frankfurt, Altenhöferallee 1, 60438 Frankfurt am Main, Germany
gInstitute for Atmospheric and Earth System Research/Physics, Faculty of Science, University of Helsinki, 00014 Helsinki, Finland
hDivision of Chemistry and Chemical Engineering, California Institute of Technology, Pasadena, CA 91125, USA
iDepartment of Chemistry, University of Colorado, Boulder, CO 80305, USA
jCERN, Geneva, CH-1211, Switzerland
kP.N. Lebedev Physical Institute of the Russian Academy of Sciences, 119991 Moscow, Russia
First published on 21st October 2024
Abstract
Co-condensation of nitric acid and ammonia vapors to form ammonium nitrate transforms from a fully semi-volatile behavior when it is relatively warm (273 K and above, typical of the seasonal planetary boundary layer) into effectively non-volatile and irreversible uptake for the limiting vapor when it is cold (well below 273 K, typical of the upper troposphere and occasionally the wintertime boundary layer). This causes the system to switch in character from the one governed by semi-volatile equilibrium (how it is usually portrayed) to the one governed by irreversible reactive uptake to even the smallest particles. Uptake involves an activation diameter, which can be as small as 1 nm for typical vapor concentrations, and subsequent growth rates can be very high, exceeding 1000 nm h−1. In addition to this somewhat surprising behavior, the system provides an exemplary case for semi-volatile reactive uptake within the context of volatility and saturation ratios.
Environmental significanceAmmonium nitrate is a major constituent of submicron aerosol particles, and with rapidly decreasing sulfur emissions, it is likely to become even more important to submicron aerosol composition in the future. Though it is often treated with equilibrium thermodynamics in chemical transport models, when it is very cold, the condensation of the less abundant (rate limiting) vapor, either ammonia or nitric acid, becomes irreversible. This can drive growth of extremely small particles and may be a prominent growth mechanism in the parts of the upper troposphere such as the Asian tropopause aerosol layer, where nitrate is known to be a major aerosol constituent. |
1 Introduction
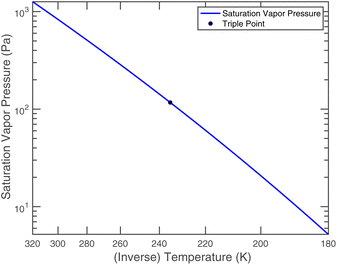
In atmospheric aerosols, ammonium nitrate (NH4·NO3) is in many ways a quintessential example of semi-volatile reactive uptake, with strong temperature and humidity dependent partitioning between the gas-phase acid–base pair and the condensed-phase (aerosol) crystalline or dissolved salt.1The equilibrium and volatility are affected by both water activity (for an aqueous solution) and of course temperature (for any aerosol phase). Both ammonia and nitric acid are by themselves highly volatile; nitric acid has a saturation vapor pressure of 117 Pa at a triple point of 235 K,2 while ammonia has a saturation vapor pressure of 6063 Pa at a triple point of 195 K.3 Consequently, by themselves, neither would be found in the condensed phase under any realistic conditions of Earth's atmosphere. It is only the proton transfer reaction to make the ionized salt solution that renders them at least semi volatile. The system thus serves as a canonical example of a condensed-phase reaction (proton transfer) that drives volatility.
Because the individual constituents are so volatile and the equilibrium partitioning between the vapor and aerosol phases is so sensitive to temperature, most treatments of nitrate partitioning assume that (submicron) particles equilibrate rapidly,4 though supermicron particles (often with different cations) require a dynamical treatment.5 Because of this, ammonium nitrate has rarely been regarded as important to nucleation and growth of nanoparticles. However, when it is cold enough and when there is a sufficient quantity (production or emission rate) of ammonia and nitric acid, ammonium nitrate will participate in the growth of extremely small particles and eventually nucleation itself.6–9 Our objective here is to explore the transition of ammonium nitrate partitioning from an essentially semi-volatile nature to an effectively non-volatile (irreversible in the limiting vapor) behavior.
2 Setup
We are interested in the transition of ammonium nitrate partitioning from being qualitatively “semi volatile” at relatively high temperature to qualitatively “irreversible” at lower temperature. In this case the individual constituents remain volatile under all relevant atmospheric conditions, but the equilibrium reaction to an effectively non-volatile salt becomes effectively irreversible and ultimately rate-limited by uptake of the limiting vapor. Because we are interested in the low temperature behavior, here we shall consider only the solid, crystalline phase of ammonium nitrate. We need to consider three fully reversible processes:| NH3(v) ⇄ NH3(s) | (R1) |
| HONO2(v) ⇄ HONO2(s) | (R2) |
| NH3(s) + HONO2(s) ⇄ NH4·NO3(s) | (R3) |
A full treatment, especially with other ions and for aqueous solutions, would break reaction R3 into its elementary steps as well.
| HONO2(s) ⇄ NO3− + H+ |
| NH3(s) + H+ ⇄ NH4+ |
| NH4+ + NO3− ⇄ NH4·NO3(s) |
However, as we are considering pure, solid ammonium nitrate we omit these reactions here.
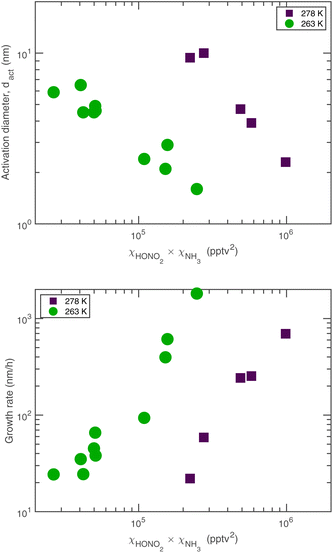
The experimental evidence motivating this analysis is observations from the CERN CLOUD experiment demonstrating that systems containing mixtures of sulfuric acid, nitric acid, and ammonia (and in some cases oxidized organics) show clear evidence for nucleation followed by activation and very rapid growth (20–2000 nm h−1) of small particles with 1.7 nm < dp < 15 nm. The experiments were designed to mimic conditions of a wintertime megacity and were thus carried out at 263 K and 278 K, with 1 ppbv < χNH3 < 3 ppbv and 10 pptv < χHONO2 < 1000 pptv. The observed activation diameters and growth rates are shown in Fig. 1.6 Both the activation diameters and the growth rates showed an empirical relationship to the product χHONO2·χNH3. This is expected for activation as it is fundamentally related to the saturation ratio of the vapors, and for this second-order process the saturation ratio involves the product of the vapor concentrations (activities). However, the quadratic growth-rate dependence is more of a surprise, as one might expect the growth rate to depend only on the concentration of the limiting vapor to an expected stoichiometric uptake.
3 Thermodynamics
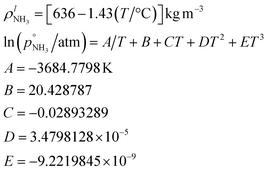
For our calculations we need to know the saturation vapor pressure of ammonia, the saturation vapor pressure,
  of nitric acid,
  and the equilibrium constant for ammonium nitrate formation in a condensed phase containing pure saturated ammonium nitrate, KeqR3. From this we can determine activities, a, and the reactive activity product in the vapor (v) and suspended (s) phases. The gas-phase activity at pressure, p, and temperature, T, is the saturation ratio with respect to partial pressure (pi), vapor concentration (cvi), or vapor mole fraction (mixing ratio, xvi):
 | (1) |
The condensed-phase (suspended) activity is the product of a fraction (mole, xi,p; mass, wi,p, and volume) and the appropriate activity coefficient (mole, ηi,p; mass, ζi,p):
| asi,p = ηi,pxsi,p = ζi,pwsi,p | (2) |
In practice, values are known for the overall equilibrium between the condensed phase and the vapor, giving the vapor activity product,1 but it is informative to separate out the gas-particle partitioning of the unreacted vapors and the particle-phase proton-transfer reaction as we have done in order to illustrate the overall process. All of the processes are “functionally” reversible, making this a true semi-volatile system. We need to know the physical and thermodynamic properties of all constituents to describe the dynamics. Ultimately the accuracy for this system depends on the overall (vapor to salt) equilibrium and so we ensure that the individual vapor pressures and condensed-phase equilibrium constant are consistent with the more accurate overall equilibrium constant.1
3.1 Ammonia
Ammonia is extremely volatile. The molar mass is| MNH3 = 17.03026 × 10⁻³ kg mol−1 |
Its triple point properties are
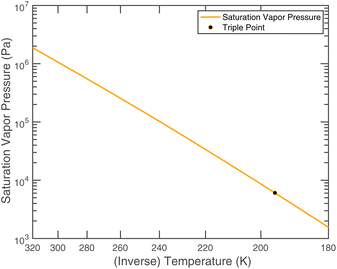
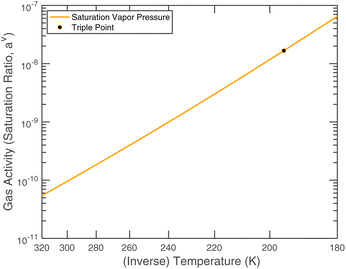
or since 1 atm = 1.01325 × 10⁵ Pa, B/Pa = 31.9549. This all gives the vapor pressure plot under atmospheric conditions shown in Fig. 2. That is such an enormous value it is worth considering the gas-phase activity of a reference level of ammonia. For this we shall consider a mole fraction of 1 ppbv, meaning a partial pressure of pNH3 = 10−4 Pa. Fig. 3 shows the gas-phase activity  of 1 ppbv of ammonia. Even at 200 K it is 10−8 and at 280 K it is just above 10−10. The gas-phase activity of 1 ppbv of ammonia at +5 °C is 2.0 × 10⁻¹⁰ while at −10 °C it is 3.5 × 10⁻¹⁰.
3.2 Nitric acid
Nitric acid is also quite volatile, with a molar mass| MHONO2 = 63.012 × 10⁻³ kg mol−1 |
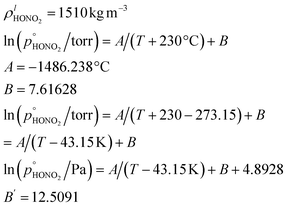
Combining values from Mozurkewich1 and the saturation vapor pressure from Duisman.2
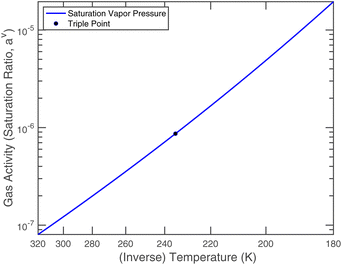
Nitric acid has a lower vapor pressure than ammonia but not by all that much, as we see in Fig. 4. Thus, again for a reference mixing ratio of 1 ppbv, the gas-phase activities in Fig. 5 are about 2 × 10⁻⁷ at 280 K and 4 × 10⁻⁶ at 200 K (over a supercooled liquid solution, not nitric acid trihydrate or anything like that). The gas-phase activity of 1 ppbv of ammonia at +5 °C is 2.1 × 10⁻⁷ while at −10 °C it is 3.2 × 10⁻⁷.
3.3 Ammonium nitrate
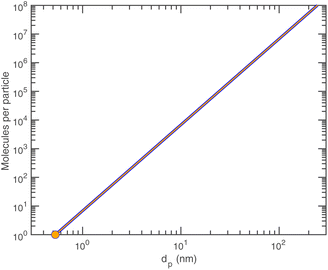
Finally, ammonium nitrate has the following properties:Given the density of ammonium nitrate we can easily calculate the number of NH4·NO3 per particle vs. diameter, as shown in Fig. 6.
| NH3(v) + HONO2(v) ⇄ NH4·NO3(s) |
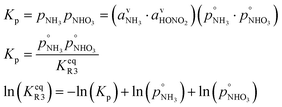
However, we can consider the equilibrium of reaction R3, where in terms of activity the equilibrium can be written as
Here, we make use of the negligibly small activities of the undissociated molecules in the suspended particle phase at equilibrium with the vapor partial pressures we have already calculated. For our purposes, over a flat surface the gas-particle system is at equilibrium for 100 pptv of ammonia and about 2 ppbv of nitric acid at +5 °C and about 20 pptv of nitric acid at −10 °C.
The overall equilibrium between vapor and a saturated condensed phase of ammonium nitrate can be expressed via a dissociation constant for
| NH4·NO3 ⇄ NH3(v) + HONO2(v) |
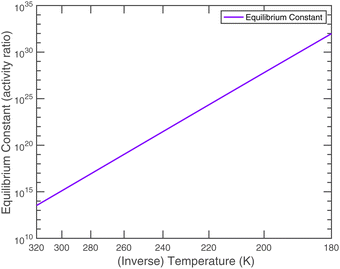
Mozurkewich1 gives an overall dissociation constant for solid-vapor (in nb2 = 10−8 Pa2) of
An effective Arrhenius activation energy for the equilibrium coefficient is 18![[thin space (1/6-em)]](https://www.rsc.org/images/entities/char_2009.gif) 150 K; it is extremely temperature dependent. It is important to emphasize again that this overall equilibrium is well constrained, and the individual condensed-phase equilibrium coefficient and the vapor pressures only provide useful insights. Fig. 7 shows that most of the temperature dependence comes from the ammonium nitrate dissociation, which spans 18 orders of magnitude over the atmospheric temperature range (compared with 2 or 3 decades for the vapor pressures). This is why the potential for relatively rapid growth (rather than equilibrium ammonium nitrate formation in larger particles) is confined to low temperature regions of the atmosphere.
150 K; it is extremely temperature dependent. It is important to emphasize again that this overall equilibrium is well constrained, and the individual condensed-phase equilibrium coefficient and the vapor pressures only provide useful insights. Fig. 7 shows that most of the temperature dependence comes from the ammonium nitrate dissociation, which spans 18 orders of magnitude over the atmospheric temperature range (compared with 2 or 3 decades for the vapor pressures). This is why the potential for relatively rapid growth (rather than equilibrium ammonium nitrate formation in larger particles) is confined to low temperature regions of the atmosphere.
4 Microphysics
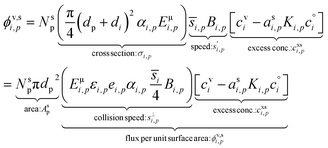
With the thermodynamics (vapor pressures and equilibrium coefficients) known, we can now consider the microphysics of collisions. We will use a microphysical formulation grounded in the kinetic regime of molecular (and particle) collisions, rather than the bulk fluid continuum regime of diffusion to and from particles. This is because we are most interested in condensation to particles with 2 ≲ dp ≲ 100 nm, where the Knudsen number Kn ≳ 1 and microphysics are more kinetic than not.The net condensation flux of a species with vapor concentration cvi and saturation concentration  to a suspension of identical particles p with number concentration Nsp and (physical) diameter dp depends fundamentally on the collision cross section, σi,p, the collision speed,
  and the thermodynamic excess concentration,cxsi,p.10 This can also be expressed in terms of the (effective spherical) particle surface area, Asp and the (effective perpendicular) collision speed of molecules with that surface, s⊥i,p, but with several modifying factors that we define below.
Note that the diameter is the physical diameter, not the mobility diameter (which is typically dmob ≃ dp + 0.3 nm).11
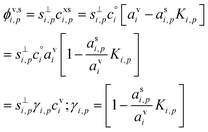
The flux of the condensing species per unit particle surface area is
 | (3) |
This depends on the collision speed, the vapor concentration, and an uptake coefficient, γi,p, that in turn depends on the activities in both phases as well as a Kelvin term, Ki,p for curvature effects over very small particles. The flux is either number per unit area or mass per unit area depending on the concentration units.
The collision speed, s⊥i,p, is the effective line-of-centers velocity of each vapor toward the particle surface, accounting for enhancements (i.e. van der Waals, vapor size, reduced mass) and limitations (i.e. accommodation, gas-phase diffusion near the particle). It is derived from the average molecular speed,  van der Waals interactions between the vapor and particle (charge-dipole, dipole-induced dipole, and induced dipole-induced dipole) can be represented as an enhancement over hard-sphere collisions, Eμi,p = Eμ(Ai,p), where Ai,p is the Hamaker constant in joule.12,13 The non-zero size of the vapor is accounted for by εi,p = (di2 + dp2)/dp2, and the non-infinite mass of small clusters gives a reduced-mass correction of
  10 The mass accommodation coefficient, αi,p is likely 1.14 Gas-phase diffusion limitations emerging for small Knudsen numbers are given by Bi,p.10,15
The excess concentration, sometimes also known as the thermodynamic driving force, can be written as
 | (4) |
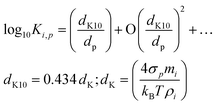
The Kelvin term Ki,p scales with a “Kelvin diameter” for decadal change, dK10. We use base-10 because it is a little easier to think in decades; for particles with dp = dK10, condensed-phase activity is increased by a factor of 10.
 | (5) |
This relates the bulk properties (σi, ρp) to the molecular properties of clusters via the correspondence principle (potentially with higher-order terms). It is perhaps not widely recognized how small dK10 actually is; it is the diameter where the effective saturation concentration increases by 1 decade, and for typical surface tensions and densities, dK10 ≃ 4–5 nm. Still, for dp = 1 nm, Ki,p = 104–105, which is why, in classical nucleation theory, very high supersaturations can be required to surmount the critical cluster. This is crucial to the activation behavior observed in ammonium-nitrate condensation in Fig. 1.
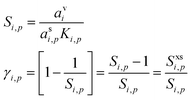
We can express the excess concentration as the product of the vapor concentration and an uptake coefficient, γi,p (the fraction of collisions resulting in uptake), defined in eqn (3). We can re-write this in terms of the saturation ratio (including curvature), Si,p, and the excess saturation ratio, Sxsi,p = Si,p − 1.
 | (6) |
The uptake coefficient is simply the fractional excess saturation ratio over a small, curved particle: the ratio of the “Kelvin adjusted” suspended-phase activity, asiKi,p, to the equilibrium suspended-phase activity, which would be avi. For example, for water vapor during cloud droplet activation, the fractional excess saturation ratio is typically 0.002–0.01, so between 1% and 0.2% of water vapor collisions are taken up (assuming a mass accommodation coefficient, α = 1). If the system is at equilibrium, γi,p = 0, whereas for kinetic uptake on every collision with the surface, γi,p = 1. The uptake coefficient is thus just the fractional excess saturation ratio (at the surface – we neglect any condensed phase diffusion limitations, which in any event are irrelevant for this pure model system).
The growth rate, Rgri,p, is proportional to the flux per unit surface area, ϕv,si,p. Assuming a spherical particle (or a spherical equivalent dp), the growth rate due to condensation of a given species is
 | (7) |
The factor of 2 is because growth extends the diameter by extending the radius symmetrically about the sphere. The molecular volume in the particle is Vi,p = mi,p/ρi,p; we retain the {i, p} “species within particle” designation to account for the form of the species within the particle. Specifically in the case we are considering here, one mole of either ammonia or nitric acid condensation will result in one mole of ammonium nitrate, and so the appropriate mass and density are those of ammonium nitrate. More generally, we could write δVi,p as the change in particle volume arising from condensation of this species; here we can also treat condensation of water vapor for deliquesced and/or aqueous particles.
We can solve eqn (7) for any given parameter, but for the most part we will either want to know the growth rate for a given vapor concentration cvi or mixing ratio xvi or conversely find either of those in terms of a given growth rate:
| Rgri,p = 2Vi,ps⊥i,pγi,pcvi = 2Vi,ps⊥i,pγi,pxviccM | (8) |
We also may want to identify the maximum possible growth rate, when γi,p = 1:
| Rmaxi,p = 2Vi,ps⊥i,pcvi = 2Vi,ps⊥i,pxvicvM | (9) |
The concentration of all (air) molecules is cvM.
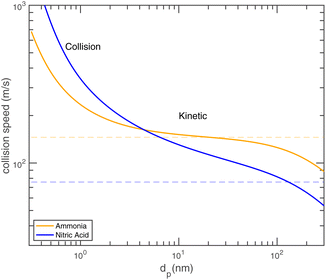
Fig. 8 shows the collision speeds for both NH3 and HONO2, including the “kinetic regime” asymptote  This assumes Hamaker constants of AHONO2 = 6 × 10⁻²⁰ joule and ANH3 = 0 joule, because HONO2 has a larger dipole moment than NH3. Values are based on growth rate observations for H2SO4 → (NH4)2·SO4 (ref. 15) because the dipole moment of HONO2 vapor is similar to the dipole moment of H2SO4 vapor and the relative values appropriate for (NH4)·NO3vs. (NH4)2·SO4 are not known. The exact values are not overly important to this example, but the difference between a highly polar but relatively heavy acid and a non-polar but light base is interesting and illustrative. As Fig. 8 shows, NH3 has a speed advantage above 5 nm, but for very small particles the van der Waals effect (as well as the molecular size and reduced mass effects) give HONO2 a speed advantage. Growth by ammonium nitrate formation ultimately means a 1
![[thin space (1/6-em)]](https://www.rsc.org/images/entities/char_2009.gif) :
:![[thin space (1/6-em)]](https://www.rsc.org/images/entities/char_2009.gif) 1 uptake frequency for NH3 and HONO2, and this collision speed transition means that in some circumstances a system can go from being NH3 limited for the smallest particles to HONO2 limited for larger particles.
1 uptake frequency for NH3 and HONO2, and this collision speed transition means that in some circumstances a system can go from being NH3 limited for the smallest particles to HONO2 limited for larger particles.
5 Semivolatile condensation
Let us consider a flux balance for ammonium nitrate uptake. For the sake of simplicity and generality of (mono)acid–base condensation we shall refer to HONO2 as A and NH3 as B.5.1 Setup
Because of the 1![[thin space (1/6-em)]](https://www.rsc.org/images/entities/char_2009.gif) :
:![[thin space (1/6-em)]](https://www.rsc.org/images/entities/char_2009.gif) 1 stoichiometry enforced by the reactive uptake, there will be a stoichiometric, molar, flux balance:
1 stoichiometry enforced by the reactive uptake, there will be a stoichiometric, molar, flux balance: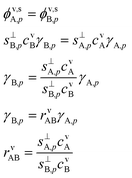 | (10) |
Here we define a collision ratio of A and B with the surface, rνAB. This is the concentration ratio of the two species scaled by the collision speed for each molecule seen in Fig. 8. Eqn (10) is symmetrical, but it is easier to think of the case where rνAB ≥ 1 so that A is in excess and B is the rate-limiting contributor to condensational growth. In the limit of rνAB ≫ 1, there is a large excess of A and we expect A to be equilibrated (asA,pKA,p → avA), so γA,p → 0.
When the collision ratio rνAB = 1, the system is at the “equi-collision” point where with stoichiometric uptake we must have γA = γB. For large excess saturation, γ = 1. In the real case we are considering, NH3 (B) is about twice as fast as HONO2 (A), so the equi-collision point occurs when cHONO2 ≃ 2cNH3 (A![[thin space (1/6-em)]](https://www.rsc.org/images/entities/char_2009.gif) :
:![[thin space (1/6-em)]](https://www.rsc.org/images/entities/char_2009.gif) B ≃ 2).
B ≃ 2).
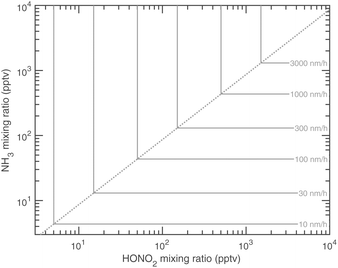
The maximal growth rates, for γ = 1, form a chevron meeting along this “equi-collision” line, as shown in Fig. 9 for dp = 10 nm. This shows that a few 100 pptv of either NH3 or HONO2 have the potential to drive particle growth at sgr > 100 nm h−1, provided that there is enough driving force (supersaturation) for this to actually occur. As a point of reference, growth rates between 1 and 10 nm h−1 are typical of the continental boundary layer when conditions permit accurate determination of aerosol growth.16,17
However, we also have the ammonium nitrate equilibrium to consider. Here we assume rapid equilibration of the salt with the undissociated molecules in the suspended particle phase (slow particle phase kinetics is a completely different limit, mostly controlled by volatility). This imposes a balance on the activity product in the particles.
 | (11) |
The overall saturation of vapors toward the particle phase can be written as
 | (12) |
This is the product of the vapor activities (saturation ratios) and suspended particle phase activities (including curvature) and it is the fundamental imposed thermodynamic driver for growth. The two Kelvin terms multiply, which we represent as the square based on the average of the two Kelvin diameters, dK10,AB = 0.5 × (dK10,A + dK10,B).
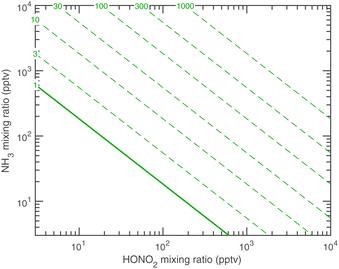
The overall equilibrium between vapor concentrations and the salt is what is best constrained by thermodynamic data and calculations (without the Kelvin effect).1 As Fig. 10 shows, for sub-freezing conditions (263 K) the saturation isopleths over a flat surface cut through typical ambient (urban) mixing ratios of NH3 and HONO2.
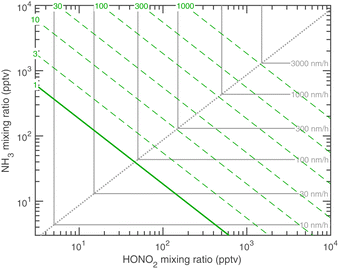
We have two constraints on the actual growth rate. One is the maximum possible growth rate shown in Fig. 9, and the other is the saturation ratio, SAB,p, shown in Fig. 10, both at 263 K. These two combine to give the overall constraints to growth, as shown in Fig. 11. We expect the actual growth rate to be at the maximum value for SAB,p ≫ 1, but obviously much lower for SAB,p ≳ 1, where the natural quantity is the excess saturation, SAB,p − 1. Of course, for SAB,p < 1 there is no growth, and the dynamics turn to evaporation.
The collision rates and thus the maximum growth rates are only a weak function of temperature, whereas the saturation ratios (at a fixed concentration or mixing ratio) are extremely strong functions of temperature. The saturation limits will thus sweep from the lower left of Fig. 11 toward the upper right as temperature increases.
5.2 Activation diameter
Before anything grows, the growth must start. This is activation, and it is characterized by an activation diameter, dact. Unactivated particles are made of something, and here we assume that ammonium nitrate (acid and base) does not interact with the unactivated particles beyond the Kelvin effect. The activation diameter simply depends on supersaturation and so strictly scales with the square of the gas-phase concentrations (and thus activities) of the acid and base.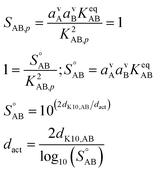 | (13) |
As stated above we treat the Kelvin diameter(s) as an adjustable parameter given the very small number of molecules in the activating clusters. However, we expect the values to lie somewhere between those of water (dK10,H2O ≃ 1 nm) and organics (dK10,org ≃ 6 nm). If the growing particle is a quasi aqueous solution with σ ≃ 75 mN m−1, we might expect NH3 to have dK10,NH3 ≃ 1 nm and HONO2 to have dK10,HONO2 ≃ 3.7 nm, based solely on mass, with an average of about 2.4 nm.
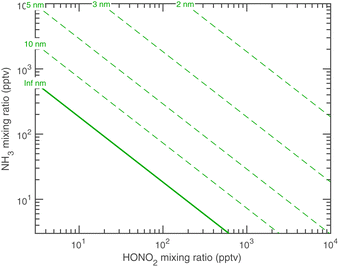
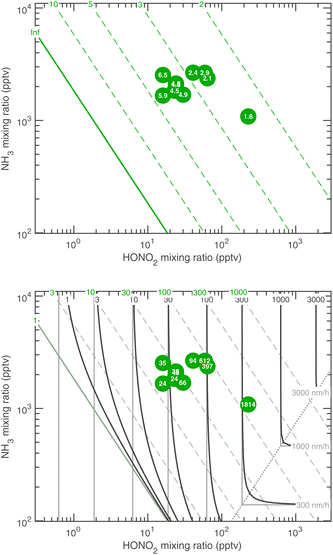
Fig. 12 shows the activation diameters at 263 K for dK10 = 3 nm over this broad atmospheric range of HONO2 and NH3. The solid green activation threshold is identical to the saturation line (S = 1), with particles activating only in the supersaturated region to the upper right. The smallest activation diameters sit far from the saturation line because of the exponential dependence; this is in contrast to the regular spacing of the saturation contours in Fig. 10 and 11.
5.3 Overall flux balance solution
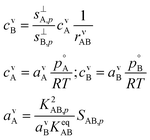
Eqn (8) shows that to find the growth rate we need to determine the uptake coefficient of the limiting species. We can combine the constraining expressions to write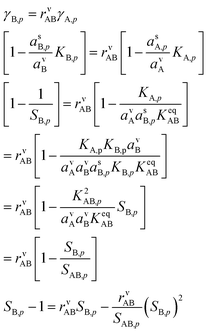 | (14) |
And so
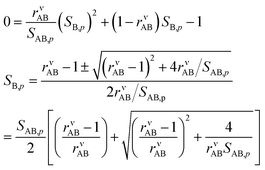 | (15) |
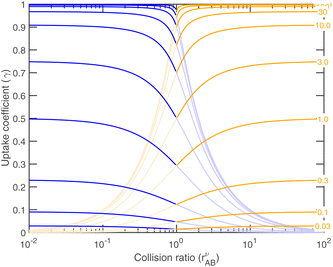
We take the positive root because we require a positive solution. This gives us the uptake coefficient for the limiting species (B here), from eqn (6). There are two natural variables here: the collision ratio, rνAB, and the saturation ratio, SAB,p. These are more or less at 45° to the mixing ratio axes in the figures, with the origin at the intersection of the equi-collision diagonal (from the lower left to the upper right) and the saturation (S = 1) diagonal.
There are two important limits. The first is symmetrical condensation where the collision rates of NH3 and HONO3 are identical rAB = 1. Here,
The second case is the opposite, with a large asymmetry (r → 0 or r → ∞).
As the collision ratio (asymmetry) increases the saturation ratio of the limiting species also increases from  to SAB,p. The limiting species will carry the full burden of sustaining the saturation ratio, as the excess species will be almost perfectly saturated; at this limit, the uptake coefficient, γ, will remain constant. This is shown in Fig. 13, which also shows γ drop away toward zero dramatically as the collision ratio switches from acid limited (rνAB < 1) to base limited (rνAB > 1), with the limiting species emphasized by darker (more saturated) curves over the range of excess saturation ratios, SxsAB. For large saturation ratios, SxsAB ≲ 10, the uptake coefficient of the limiting species γ ≃ 1, with the exception of a small downward cusp at r = 1.
5.4 Growth rates
Returning to the growth rate in the “natural” coordinates of SAB,p and rνAB, with rνAB > 1 and growth thus limited by condensation of B, driven by a condensation rate of B toward the particles, RgrAB,p, | (16) |
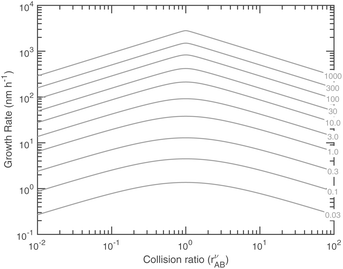
This applies for either A or B at any rAB, but for the limiting vapor as we have just seen, γ → 1 (in many cases) whereas for the excess vapor γ → 0 (in all cases). This is sufficient to determine the growth rate given measured concentrations of A and B (along with the thermodynamics). However, we would also like to contour growth rates for a given saturation ratio, SAB,p, and for this we need cvB as a function of SAB,p and rνAB.
With the ideal gas vapor concentrations from eqn (1), the gas-particle equilibrium from eqn (12), and the collision ratio from eqn (10) we can derive the vapor concentration of the limiting reagent in terms of the natural coordinates.
This gives
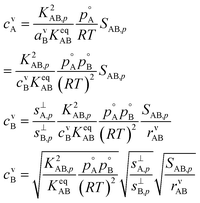 | (17) |
Fig. 14 shows the growth rates (in nm h−1) at 263 K versus these natural coordinates for a range of excess saturation ratios. Combining with Fig. 13 we find, somewhat paradoxically, that, for any given saturation ratio, the limiting uptake coefficient, γ, reaches a (cusped) minimum at the equi-collision point, rAB = 1, but the growth rate reaches a maximum at this same value. This is because both species are contributing to growth for rAB ≃ 1. These natural coordinates of collision ratio and saturation ratio are roughly 45° from the concentration axes in Fig. 9–11. Because of this, for a constant total saturation ratio, the activity and thus concentration of the limiting gas-phase species will decrease as the collision ratio increases, and so the growth rate (as opposed to the uptake coefficient) will decrease, and for rAB ≃ 1 the growth rate has a maximum even though the uptake coefficients have a minimum. Simply following the saturation ratio contours in Fig. 11 shows this clearly; the rAB = 1 equi-collision spine is the diagonal running from lower left to upper right, and following a saturation ratio contour away from this spine shows steadily declining maximum growth rates. At very low excess saturation, the growth-rate curve in Fig. 14 is quite smooth, whereas at high excess saturation the curve takes on the sharp-peaked nature given by the sudden transition as the excess vapor changes identity at rνAB = 1 as shown in Fig. 11 and the growth rate is always very near its maximum value. The smooth curve for S ≲ 3 leads to the quadratic growth-rate dependence as shown in Fig. 1.
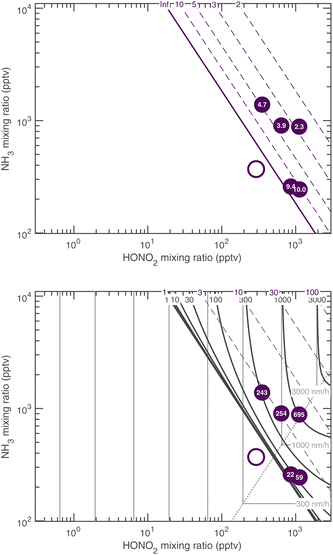
Fig. 15 combines these elements to show the growth rates of 10 nm particles in the ammonium nitrate phase space at 278 K and at 263 K. The black contours are at regular intervals of the growth rate (in nm h−1) and, as expected, they bunch up near the SAB = 1 saturation line. Above (to the upper right) that saturation line, with saturation ratios shown as dashed diagonals, the growth-rate contours ultimately approach the limiting maximum growth rates (in gray). For large SAB, the contours even retain a sharp transition along the equi-collision spine, consistent with the near cusp in Fig. 14.
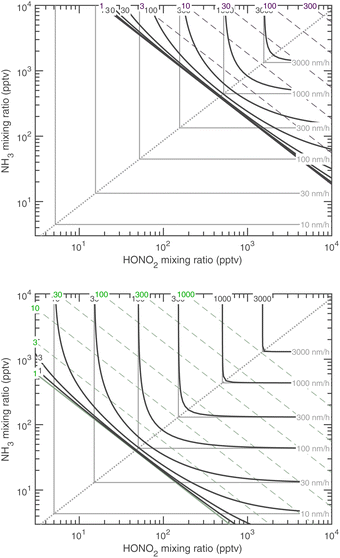 | ||
Fig. 15 Growth rate at 10 nm at 278 K (top, with dashed purple saturation ratio diagonal lines) and 263 K (bottom, with dashed green saturation ratio diagonal lines). These are the two temperatures shown for CLOUD data in Fig. 1. As with the “natural” growth coordinates, near the 1![[thin space (1/6-em)]](https://www.rsc.org/images/entities/char_2009.gif) : :![[thin space (1/6-em)]](https://www.rsc.org/images/entities/char_2009.gif) 1 equi-collision spine the growth rate is rounded compared to the sharp limiting values, with contours converging toward no growth at the S = 1 saturation diagonal line. 1 equi-collision spine the growth rate is rounded compared to the sharp limiting values, with contours converging toward no growth at the S = 1 saturation diagonal line. | ||
5.5 Temperature dependence
Almost all the temperature dependence in the system is caused by ammonium nitrate decomposition. Progressive cooling from 278 K to 223 K is shown in Fig. 15 (for warmer conditions) and Fig. 16 (for colder conditions). The colder axes in Fig. 16 are shifted by a factor of 100 toward low mixing ratios. The colored contours in each figure are the growth rate, and the color of the saturation ratio diagonals indicates the temperature (as in Fig. 1, purple is 278 K and green is 263 K). Starting at 223 K and warming, the progressive volatilization of the HN4·NO3 drives the saturation (S = 1) line, which sweeps from the lower left up along the equi-collision spine like a plow, gathering “isotachs” of constant growth rate as it moves toward the upper right.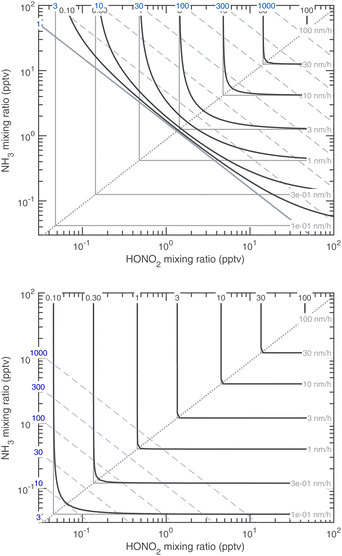 | ||
| Fig. 16 Growth rate of 10 nm particles at 243 K (top) and 223 K (bottom). Note the axes shift by a factor of 100 compared to the warmer Fig. 15. At 223 K (i.e. in the upper troposphere), the only sign of reversible (semi-volatile) condensation by the limiting reagent is curvature near the equi-collision spine with both vapors below a 1 pptv mixing ratio and almost imperceptible growth of 0.1 nm h−1. | ||
Fig. 16 reflects free-tropospheric conditions whereas Fig. 15 reflects lower tropospheric and wintertime boundary layer conditions, where the actual mixing ratios of NH3 and HONO2 can be much higher. At 223 K the system is almost non-volatile, except that the constituents are still very volatile and so any excess will remain in the gas phase; however, growth by the limiting constituent is essentially kinetic. Conversely, by 278 K, any disequilibrium implies very rapid growth (or evaporation) – the saturation line is a stable attractor, and so in practice this means the system will equilibrate very rapidly. This is why air-quality models often assume that ammonium nitrate is in equilibrium.5
5.6 Size dependent growth rates
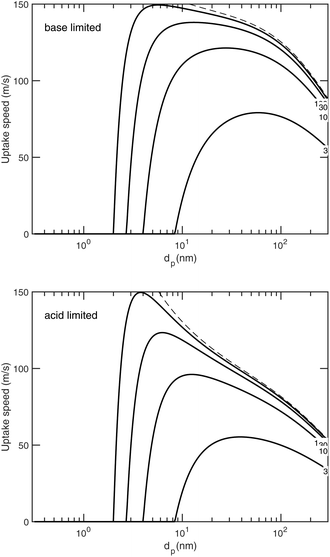
We have been presenting growth rates as a semi-constant value (specified at a reference diameter, dp = 10 nm but only considering the saturation ratio over a flat surface, ). However, we can define an uptake speed as the product of the collision speed and the uptake coefficient, supi,p = s⊥i,pγi,p. The uptake speed (and thus the growth rate) is anything but a constant, as shown in Fig. 8. Some of those collisions do not result in uptake, even for the limiting vapor; as shown above this is especially pronounced for low saturation ratios. Once we know the uptake coefficient of the limiting species, γlim, we can consider the effective collision speed of that species as a function of size, which will be affected by the Kelvin term and thus incorporates the activation diameter (where the speed drops to zero). This is s = γs⊥, which we show in Fig. 17 for a collision asymmetry rνAB = 10 (so limited by ammonia) on top and rνAB = 0.1 (so limited by nitric acid) on bottom. For the purposes of illustration we assume negligible van der Waals enhancement for NH3 and a large enhancement for HONO2. For S° ≳ 10, activation is quite rapid and the speed reaches its maximum value quite quickly, but for less saturated cases the size dependence has a broad maximum. This is especially dramatic for HONO2-limited uptake, where the van der Waals term drops off sharply with a size difference between the colliding species (vapor and particle) and so the dipole – induced-dipole enhancement as mostly manifest below 10 nm. For cases near 1
![[thin space (1/6-em)]](https://www.rsc.org/images/entities/char_2009.gif) :
:![[thin space (1/6-em)]](https://www.rsc.org/images/entities/char_2009.gif) 1, the system will even switch between being acid limited for small size to being base limited for larger particles as the relative collision speeds of the two vapors change with particle size (as in Fig. 8).
1, the system will even switch between being acid limited for small size to being base limited for larger particles as the relative collision speeds of the two vapors change with particle size (as in Fig. 8).
6 CLOUD results
We can now compare our theoretical values for the activation diameter and growth rate to those observed at CLOUD. The CLOUD observations are shown in Fig. 1. We compare these to the theory in Fig. 18 and 19. Here we use a reference diameter dp = 30 nm, more or less in the middle of the observed growth range for activated particles; however, especially for high growth rates, the absolute values are quite uncertain. The experiments were carried out with nucleation by ammonia and sulfuric acid. In some cases oxidized (aromatic) organic vapors may have contributed some growth but the experiments in this dataset had very low organic growth compared to the activated ammonium nitrate growth.6 However, the composition and interactions below or near the activation diameter are not known precisely. For this reason, we treat the Kelvin diameter as an unknown parameter.Fig. 18 shows that the activation at 278 K is consistent with theory for a small dK10 = 1 nm. This is similar to water and somewhat smaller than the expected 2.5 nm or so; the experiment did include oxidized aromatic organic compounds as well, and it is possible that some co-condensing HOMs were surface active and able to drop the surface tension from a water-like 75 mN m−1 to a more organic-like 30 mN m−1, which would quantitatively explain the observations. The predicted and observed growth rates in Fig. 18 are consistent, including the experiment in undersaturated conditions. These data are all near the equi-collision spine and most of the variation in both the activation diameter and growth rate appears to be due to variation in NH3.
Fig. 19 shows that the activation at 263 K is reasonably consistent with theory for dK10 = 2.5 nm. This suggests a more aqueous-like activating particle, perhaps with less surfactant. However, these activating particles contain between 10 and 100 NH4·NO3, and so bulk behavior is far from assured. The growth rates are now well into the HONO2-limited regime, and while they qualitatively agree well with theory, observed growth above 100 nm h−1 is significantly faster than predicted (by about a factor of 5). Overall the agreement is good, though the fastest growth rates are not perfectly reproduced, and the Kelvin diameter remains a free (ish) parameter.
7 Atmospheric significance
Any unified aerosol system (such as the atmosphere) will move toward the equilibrium SAB = 1 line without a cause sustaining any supersaturation. If it is supersaturated, condensation will deplete the excess vapor (after driving particle growth), and if it is undersaturated, evaporation will be a source of vapors. The timescale for reaching a steady state will be the collision frequency of vapors with the particles (the condensation sink).18 If there is a source of vapors (i.e. photochemical production of HONO2 or uniform emission of NH3), the system will relax toward a steady state with that production balancing the condensational loss. However, transient events may also be important, because rapid growth for only a few minutes can carry nucleated particles through the “valley of death” between 2 and 10 nm where coagulation loss is high and survival probability is low. These transients can be driven by chemical production, transport, or steady temperature change.A box model based on the microphysics presented here and simulating the CLOUD conditions for these experiments reproduces the observed behavior in CLOUD. Simulations show that the survival probability of nucleated particles is greatly increased with the rapid growth driven by ammonium nitrate condensation.7 Further simulations show that transient increases in the saturation ratio simulating turbulent vertical transport in the boundary layer can drive brief pulses of growth from the smallest sizes, thus enhancing the average survival probability.9 In the real world, ambient observations of size distributions evolving over hours at a fixed surface site within spatially inhomogeneous conditions may well render these pulses difficult to discern. However, the nearly irreversible condensational growth described here will occur whenever it is cold enough for substantial saturation ratios to be sustained, either via temperature changes (specifically uplift) or chemical production (of nitric acid vapor). We thus expect it to be important for particle growth well below 10 nm in both the wintertime boundary layer6 (even for modest 3–10 nm h−1 growth rates limited by HONO2 production) and throughout the upper troposphere.8,19 To address this, chemical transport models will need to either treat the condensation dynamics directly or implement a hybrid solution to condense ammonium nitrate in proportion to the aerosol volume under equilibrium conditions and in proportion to the aerosol surface area under dynamic steady state conditions.20
8 Conclusions
The theory of semi-volatile reactive uptake is straightforward for a simple system with well constrained thermodynamics, such as ammonium nitrate. Considering the dual constraints of dynamics (condensation speeds) and thermodynamics (saturation ratios), and especially how saturation ratios change with temperature, we are able to develop a framework for visualizing the transition from semi-volatile equilibration to irreversible uptake that predicts both activation diameters and growth rates. This framework reproduces observations from the CERN CLOUD experiment.Data availability
All data used in this work are in the literature, and all parameters are in the text.Author contributions
NMD conceived the project and designed the overall scope. MX inspired the framework and wrote an initial version of the dynamical model. NMD wrote the manuscript along with DS and IEH, with editorial input from all coauthors.Conflicts of interest
The authors declare no conflicts.Acknowledgements
This work was supported by Grant AGS2132089 from the U.S. National Science Foundation; the Vienna Science and Technology Fund (WWF) through project VRG22-003; grant 200021_213071 and PZ00P2_216181 from the Swiss National Science Fund.Notes and references
- M. Mozurkewich, Atmos. Environ., Part A, 1993, 27, 261–270 CrossRef.
- J. A. Duisman and S. A. Stern, J. Chem. Eng. Data, 1969, 14, 457–459 CrossRef CAS.
- L. Haar and J. S. Gallagher, J. Phys. Chem. Ref. Data, 1978, 7, 635–792 CrossRef CAS.
- C. Fountoukis and A. Nenes, Atmos. Chem. Phys., 2007, 7, 4639–4659 CrossRef CAS.
- E. R. Trump, C. Fountoukis, N. M. Donahue and S. N. Pandis, Atmos. Environ., 2015, 102, 274–281 CrossRef CAS.
- M. Wang, W. Kong, R. Marten, X.-C. He, D. Chen, J. Pfeifer, A. Heitto, J. Kontkanen, L. Dada, A. Kurten, T. Yli-Juuti, H. E. Manninen, S. Amanatidis, A. Amorim, R. Baalbaki, A. Baccarini, D. M. Bell, B. Bertozzi, S. Brakling, S. Brilke, L. C. Murillo, R. Chiu, B. Chu, L.-P. D. Menezes, H. Finkenzeller, L. G. Carracedo, M. Granzin, R. Guida, A. Hansel, V. Hofbauer, J. Shen, J. Duplissy, K. Lehtipalo, H. Lamkaddam, M. Lampimaki, C. P. Lee, V. Makhmutov, G. Marie, S. Mathot, R. L. Mauldin III, B. Mentler, T. Muller, A. Onnela, E. Partoll, T. Petaja, M. Philippov, V. Pospisilova, A. Ranjithkumar, M. Rissanen, B. Rorup, W. Scholz, M. Simon, M. Sipila, G. Steiner, D. Stolzenburg, Y. J. Tham, A. Tome, A. C. Wagner, D. S. Wang, S. K. Weber, P. M. Winkler, P. J. Wlasits, Y. Wu, M. Xiao, Q. Ye, M. Zauner-Wieczorek, X. Zhou, R. Volkamer, I. Riipinen, J. Dommen, J. Curtius, U. Baltensperger, M. Kulmala, D. R. Worsnop, J. Kirkby, J. H. Seinfeld, I. El-Haddad, R. C. Flagan and N. M. Donahue, Nature, 2020, 581, 184–189 CrossRef CAS PubMed.
- R. Marten, M. Xiao, B. Rörup, M. Wang, W. Kong, X.-C. He, D. Stolzenburg, J. Pfeifer, G. Marie, D. S. Wang, W. Scholz, A. Baccarini, C. P. Lee, A. Amorim, R. Baalbaki, D. M. Bell, B. Bertozzi, L. Caudillo, B. Chu, L. Dada, J. Duplissy, H. Finkenzeller, L. G. Carracedo, M. Granzin, A. Hansel, M. Heinritzi, V. Hofbauer, D. Kemppainen, A. Kürten, M. Lampimäki, K. Lehtipalo, V. Makhmutov, H. E. Manninen, B. Mentler, T. Petäjä, M. Philippov, J. Shen, M. Simon, Y. Stozhkov, A. Tomé, A. C. Wagner, Y. Wang, S. K. Weber, Y. Wu, M. Zauner-Wieczorek, J. Curtius, M. Kulmala, O. Möhler, R. Volkamer, P. M. Winkler, D. R. Worsnop, J. Dommen, R. C. Flagan, J. Kirkby, N. M. Donahue, H. Lamkaddam, U. Baltensperger and I. El Haddad, Environ. Sci.: Atmos., 2022, 2, 491–499 CAS.
- M. Wang, M. Xiao, B. Bertozzi, G. Marie, B. Rörup, B. Schulze, R. Bardakov, X.-C. He, J. Shen, W. Scholz, R. Marten, L. Dada, R. Baalbaki, B. Lopez, H. Lamkaddam, H. E. Manninen, A. Amorim, F. Ataei, P. Bogert, Z. Brasseur, L. Caudillo, L.-P. D. Menezes, J. Duplissy, A. M. L. Ekman, H. Finkenzeller, L. G. Carracedo, M. Granzin, R. Guida, M. Heinritzi, V. Hofbauer, K. Höhler, J. E. Krechmer, A. Kürten, K. Lehtipalo, N. G. A. Mahfouz, V. Makhmutov, D. Massabò, S. Mathot, R. L. Mauldin, B. Mentler, T. Müller, A. Onnela, T. Petäjä, M. Philippov, A. A. Piedehierro, A. Pozzer, A. Ranjithkumar, M. Schervish, M. Simon, Y. Stozhkov, A. Tomé, N. S. Umo, F. Vogel, R. Wagner, D. S. Wang, S. K. Weber, A. Welti, Y. Wu, M. Zauner-Wieczorek, M. Sipilä, P. M. Winkler, A. Hansel, U. Baltensperger, M. Kulmala, R. C. Flagan, J. Curtius, I. Riipinen, H. Gordon, J. Lelieveld, I. El-Haddad, R. Volkamer, D. R. Worsnop, T. Christoudias, J. Kirkby, O. Möhler and N. M. Don, Nature, 2022, 605, 483–489 CrossRef CAS.
- R. Marten, M. Xiao, M. Wang, W. Kong, X.-C. He, D. Stolzenburg, J. Pfeifer, G. Marie, D. S. Wang, A. Baccarini, C. P. Lee, A. Amorim, R. Baalbaki, D. M. Bell, B. Bertozzi, L. Caudillo, L. Dada, J. Duplissy, H. Finkenzeller, M. Heinritzi, M. Lampimäki, K. Lehtipalo, H. E. Manninen, B. Mentler, A. Onnela, T. Petäjä, M. Philippov, B. Rörup, W. Scholz, J. Shen, Y. J. Tham, A. Tomé, A. C. Wagner, S. K. Weber, M. Zauner-Wieczorek, J. Curtius, M. Kulmala, R. Volkamer, D. R. Worsnop, J. Dommen, R. C. Flagan, J. Kirkby, N. M. Donahue, H. Lamkaddam, U. Baltensperger and I. E. Haddad, Environ. Sci.: Atmos., 2024, 4, 265–274 CAS.
- N. M. Donahue, W. K. Chuang and M. SchervishGas-Phase Organic Oxidation Chemistry and Atmospheric Particles, in Advances in Chemistry of the Contemporary Atmosphere, ed. J. R. Barker, A. Steiner and T. J. Wallington, World Scientific, 2019, vol. 2, ch, pp. 199–317 Search PubMed.
- C. Larriba, C. J. Hogan Jr, M. Attoui, R. Borrajo, J. F. Garcia and J. F. de la Mora, Aerosol Sci. Technol., 2011, 45, 453–467 CrossRef CAS.
- H. C. Hamaker, Physica, 1937, 4, 1058–1072 CrossRef CAS.
- J. E. Brockmann, P. H. M. Murry and B. Y. H. Liu, J. Colloid Interface Sci., 1982, 88, 522–529 CrossRef CAS.
- J. Julin, P. M. Winkler, N. M. Donahue, P. E. Wagner and I. Riipinen, Environ. Sci. Technol., 2014, 48, 12083–12089 CrossRef CAS PubMed.
- D. Stolzenburg, M. Simon, A. Ranjithkumar, A. Kürten, K. Lehtipalo, H. Gordon, T. Nieminen, L. Pichelstorfer, X. He, S. Brilke, M. Xiao, A. Amorim, R. Baalbaki, A. Baccarini, L. Beck, S. Bräkling, L. C. Murillo, D. Chen, B. Chu, L. Dada, A. Dias, J. Dommen, J. Duplissy, I. E. Haddad, H. Finkenzeller, L. Fischer, L. G. Carracedo, M. Heinritzi, C. Kim, T. K. Koenig, W. Kong, H. Lamkaddam, C. P. Lee, M. Leiminger, Z. Li, V. Makhmutov, H. E. Manninen, G. Marie, R. Marten, T. Müller, W. Nie, E. Partol, T. Petäjä, J. Pfeifer, M. Philipov, M. P. Rissanen, B. Rörup, S. Schobesberger, S. Schuchmann, J. Shen, M. Sipilä, G. Steiner, Y. Stozhkov, C. Tauber, Y. J. Tham, A. Tomé, M. Vazquez-Pufleau, A. C. Wagner, M. Wang, Y. Wang, S. K. Weber, D. Wimmer, P. J. Wlasits, Y. Wu, Q. Ye, M. Zauner-Wieczorek, U. Baltensperger, K. S. Carslaw, J. Curtius, N. M. Donahue, R. C. Flagan, A. Hansel, M. Kulmala, R. Volkamer, J. Kirkby and P. M. Winkler, Atmos. Chem. Phys., 2020, 20, 7359–7372 CrossRef CAS.
- I. Riipinen, T. Yli-Juuti, J. R. Pierce, T. Petäjä, D. R. Worsnop, M. Kulmala and N. M. Donahue, Nat. Geosci., 2012, 5, 453–458 CrossRef CAS.
- M. Kulmala, V.-M. Kerminen, T. Petäjä, A. J. Ding and L. Wang, Faraday Discuss., 2017, 200, 271–288 RSC.
- R. Saleh, N. M. Donahue and A. L. Robinson, Environ. Sci. Technol., 2013, 47, 5588–5594 CrossRef CAS PubMed.
- C. J. Williamson, A. Kupc, D. Axisa, K. R. Bilsback, T. Bui, P. Campuzano-Jost, M. Dollner, K. D. Froyd, A. L. Hodshire, J. L. Jimenez, J. K. Kodros, G. Luo, D. M. Murphy, B. A. Nault, E. A. Ray, B. Weinzierl, J. C. Wilson, F. Yu, P. Yu, J. R. Pierce and C. A. Brock, Nature, 2019, 574, 399–403 CrossRef CAS.
- J. R. Pierce, I. Riipinen, M. Kulmala, M. Ehn, T. Petäjä, H. Junninen, D. R. Worsnop and N. M. Donahue, Atmos. Chem. Phys., 2011, 11, 9019–9036 CrossRef CAS.
| This journal is © The Royal Society of Chemistry 2025 |


