 Open Access Article
Revealing heterogeneous electric double layer (EDL) structures of localized high-concentration electrolytes (LHCEs) and their impact on solid–electrolyte interphase (SEI) formation in lithium batteries†
Qisheng
Wu
 and
Yue
Qi
 *
*
School of Engineering, Brown University, Providence, RI 02912, USA. E-mail: yueqi@brown.edu
First published on 12th February 2025
Abstract
Recently, we have proposed micelle-like structures to fully understand microstructures in localized high-concentration electrolytes (LHCEs) that provide many benefits to high-capacity electrodes. It is critical to understand the electric double layer (EDL) structures of LHCEs, how they differ from the bulk electrolyte structure, and how they impact solid electrolyte interphase (SEI) formation on a Li–metal electrode with a combined DFT-MD-data approach. In this work, we reveal the heterogeneous EDL structures of a prototypical LHCE consisting of lithium bis(fluorosulfonyl)imide (LiFSI) salt, dimethoxyethane (DME) solvent, and tris(2,2,2-trifluoroethyl)orthoformate (TFEO) diluent at a concentration of LiFSI–1.2DME–2TFEO for lithium batteries. We find that the 1D EDL Stern model with an adsorbed cation layer and a more diffused layer with ions, solvents, and diluents missed the heterogeneity of this type of electrolyte. The micelle-like structures in the LHCE are maintained in its EDL that is divided into the Li+-rich salt-solvent cluster region and the Li+-poor diluent region. The diluent region contains Li+ ions in the EDL but has no ions in the bulk of the LHCE. This is because TFEO cannot form a complete solvation shell in the bulk electrolyte due to the steric effect; however, only a partial solvation shell is needed near the surface. The appearance of Li+ ions in the diluent region is also necessary for the EDL, as TFEO alone cannot screen the charge. Thus, the reduction voltage of TFEO will be increased by the association of Li+ ions in the EDL, highlighting one of the impacts of the heterogeneous EDL structures on SEI formation. This work helps extend the development of the EDL theory and guides the design of more effective LHCEs for high-performance rechargeable batteries.
Broader contextHigh-energy-density Li-metal batteries show promising applications in electric vehicles, low-altitude economy and many others. However, the drastic reactivity of a Li-metal anode limits its battery performance. Localized high-concentration electrolytes (LHCEs) demonstrate low viscosity, high ionic conductivity, and stable solid–electrolyte interphase (SEI) formation that can protect the Li-metal anode, thus dramatically improving the performance and durability. Recently, we have proposed micelle-like structures to fully understand the underlying microstructural characteristics of the bulk LHCE to bridge the scales from atomistic solvation structures to macroscopically homogeneous liquid electrolytes (C. M. Efaw, Q. Wu, N. Gao, Y. Zhang, H. Zhu, K. Gering, M. F. Hurley, H. Xiong, E. Hu and X. Cao, et al., Nat. Mater. 2023, 22(12), 1531–1539). It is important to recognize that the SEI formation occurs near the negatively charged negative electrode surface. This paper reveals the heterogeneous electric double layer (EDL) structures of a prototypical LHCE consisting of LiFSI salt, DME solvent, and TFEO diluent. We find that the classical Stern model missed the heterogeneity of this type of electrolyte. The micelle-like structures in the LHCE are maintained in its EDL that is divided into the Li+-rich salt-solvent cluster region and the Li+-poor diluent region. The diluent region contains Li+ ions in the EDL but has no ions in the bulk of the LHCE. The appearance of Li+ ions in the diluent region is necessary for the EDL, as TFEO alone cannot screen the charge. Thus, the reduction voltage of the TFEO diluent will be increased by the association of Li+ ions in the EDL, highlighting one of the impacts of the heterogeneous EDL structures on SEI formation. This work helps extend the development of the EDL theory and guides the design of more effective LHCEs for high-performance rechargeable batteries. |
1. Introduction
The use of high-capacity anodes (e.g., Li metal, Si, and Na metal) has posed significant challenges to the conventional low-concentration electrolytes (LCEs) in developing high-energy rechargeable batteries that are needed to advance electric vehicle and electric aircraft capabilities.1 The solvent-derived solid–electrolyte interphase (SEI) layers are not stable on the high-capacity anodes that experience large volume changes, leading to a continuous loss of active materials and rapid dendrite growth.2–4 These challenges can be largely tackled by increasing the salt concentration to form high-concentration electrolytes (HCEs), thereby favoring anion reduction to form a stable, inorganic-rich SEI.5,6 However, sluggish ion transport and an increase in cost come with increasing salt concentration.5 To mitigate these pitfalls, a low-viscosity diluent is added to form localized high-concentration electrolytes (LHCEs), thus improving high-capacity anode performance.7 It has been realized in both experiments and computations that the cation solvation shells are fully occupied by the salt anion and solvent with little diluent participation if there is any.7,8 The origin of the LHCE microstructures remained unclear until the recently proposed micelle-like structures, where a network of salt–solvent clusters are mostly separated from the diluent matrix by a solvent-rich surfactant region.9,10 In an LHCE, the salt is soluble in the solvent but not in the diluent, and the diluent is completely miscible with the solvent. The relationship among the salt, solvent, and diluent is analogous to that among water, oil, and the surfactant, which is widely recognized in micelles.11,12 While the micelle-like structure is consistent with the previously proposed solvation cluster model of LHCEs,7,13 it further explains why those clusters are stable and why the salt concentration can be even higher in the salt–solvent clusters, which further improves the SEI formation compared to their HCE counterparts with the same salt to solvent ratio.9 However, the details of SEI formation of the LHCE have not been fully understood.It is important to recognize that the SEI formation occurs near the negatively charged negative electrode surface. The electric double layer (EDL) structure of electrolytes near a charged surface is a fundamental topic in electrochemistry important for energy storage, electrocatalysis, and many other technological applications.14,15 Salt ions, solvents, and additive molecules redistribute in the EDL, wherein the electrolyte structures differ from those in the bulk phase and vary as a function of the potential on the electrode.16,17 The SEI layers, mainly formed by electrolyte reduction reactions,18–20 must be sensitive to the electrolyte structures within the EDL, which are subject to an external electric field.17,21 Therefore, it is critical to gain atomistic insights into the reduction reactions of the electrolyte species in the EDL to help predict and control the formation of the SEI layers as well as the Li plating morphology.22 In our recent work,21 we have developed an interactive Density Functional Theory (DFT)-Molecular Dynamics (MD)-data model and applied it to investigate the EDL structures of commonly used LCEs (e.g., 1 M LiPF6 in carbonate electrolytes for a graphite anode and 1 M LiTFSI in ether electrolytes for a Li–metal anode) and their effects on reduction reactions of multi-component electrolytes and SEI formation. In contrast to that of LCEs, there are much fewer reports on the EDL structures of HCEs in the literature. One special case of an HCE is the so-called water-in-salt electrolyte (WiSE), a highly concentrated aqueous electrolyte,23,24 whose interface structures near the electrode were revealed through molecular dynamics simulations.25,26 Both LCE and HCE systems feature homogeneous spatial distributions of the salt–solvent cluster;9 however, like microemulsions,27 LHCE systems are microscopically heterogeneous featuring micelle-like structures.9 Considering the significance of the EDL, the following questions naturally arise: what are the characteristics of the EDL structures of heterogeneous liquids like LHCEs and how will the EDL of the LHCE impact its electrolyte reduction and SEI formation? The EDL structures of the LHCE have been rarely discussed in the literature despite the rich understanding of LHCE structures in its bulk phase.13,28
The idea of an EDL has been extensively developed29 since its initial definition by Helmholz in 1853.30 Despite its success, the classical Gouy–Chapman–Stern model31–33 neglects ion size effects (or steric effects), short-range correlations, and solvent polarization.14 The Gouy–Chapman theory provides an analytical solution for the Poisson–Boltzmann equation at the steady state; however, it works well only for a dilute electrolyte, where the ion concentration is usually at least one order of magnitude less than 1.0 molar (M).14 Since salt concentrations in the battery electrolytes are typically around 1.0 M for LCEs and much higher for HCEs,34 more advanced theories are urgently needed.35–39 As a step forward, a simple modified Poisson–Fermi theory was recently developed for the EDL in the WiSE that helped further understand and quantify the competing solvation and polarization forces acting on water molecules near electrified interfaces in the WiSE.40 Other hybrid methods that combine the electron density, electric potential, and solvent polarization are being developed.41 Despite a recent attempt to develop the theory of bulk structures in LHCEs,42 the theory of the EDL for LHCEs is yet to be developed. To achieve this, it requires a precise microscopic picture of the EDL of the LHCE that can be provided by cost-effective yet powerful MD simulations.29,43–45
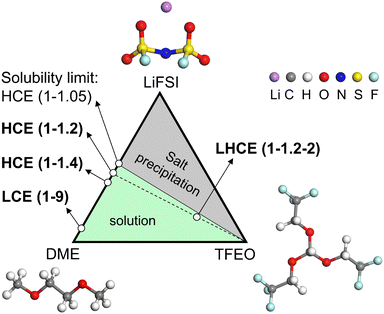
In this work, we have conducted comprehensive MD simulations (more details in the ESI†) of the EDL structures for a LCE, HCE, and LHCE, as well as made systematic comparisons between them with the prototypical systems consisting of lithium bis(fluorosulfonyl)imide (LiFSI) salt, dimethoxyethane (DME) solvent, and tris(2,2,2-trifluoroethyl)orthoformate (TFEO) diluent, whose molecular structures are given in Fig. 1. The different electrolyte compositions are highlighted in the ternary phase diagram in Fig. 1.9 LiFSI salt and DME solvent can form homogeneous electrolytes with different salt concentrations. Here, we use LiFSI–9DME, namely LCE(1–9), to represent a LCE system.46 In addition, we use LiFSI–1.4DME (4 M) and LiFSI–1.2DME to represent HCE systems, namely HCE(1–1.4) and HCE(1–1.2), both of which were shown to exhibit a high coulombic efficiency and excellent cycling stability.46,47 Connecting the points of HCE(1–1.2) and TFEO corners in the phase diagram, a series of LHCE(1–1.2–x) can be formed. Here, we use LiFSI–1.2DME–2TFEO, namely LHCE(1–1.2–2), to represent the LHCE system, which was shown to be able to stabilize the high-voltage cathode, suppress the continuous SEI growth on Li–metal anodes, and enable high capacity retention (>80% over 200 cycles) of Li-metal batteries.47
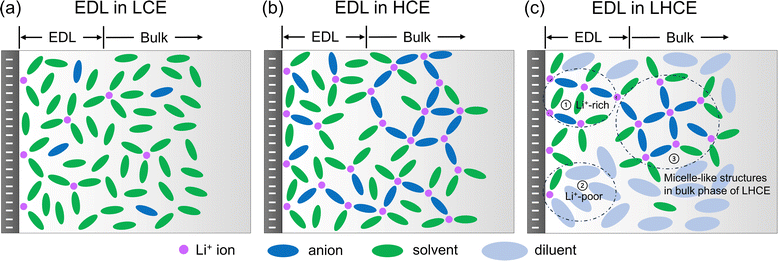
Based on the MD simulations and structural analyses (Sections 2.1 and 2.2), we have drawn the schematics for the illustration of the EDL structures in the LCE, HCE, and LHCE near the negatively charged electrode, as shown in Fig. 2. For the LCE (Fig. 2a), the EDL near the negatively charged electrode (i.e., the Li–metal/graphene anode during the charging process) features adsorbed Li+ ions that mainly coordinate with solvent molecules with a tiny fraction of anions (most of the anions are repelled from the negatively charged electrode).21 For the HCE (Fig. 2b), more Li+ ions are found to be in the EDL region due to the increasing salt concentration. The Li+ ions not only coordinate with solvent molecules but also coordinate with a significant amount of salt anions due to strong ion pairing and the formation of aggregates in the HCE.40,48,49 Both the LCE and HCE show homogeneous spatial distributions of species in the EDL. In contrast, the heterogeneous micelle-like structures of the bulk LHCE are extended to the EDL with different characteristics from its bulk structures. As shown in Fig. 2c, the EDL of the LHCE can be divided into two distinct regions, one being Li+-rich with aggregated clusters that maintain the micelle-like characteristics and the other being Li+-poor mainly with a diluent. The diluent region contains Li+ ions near the negatively charged surface but does not have any ions in the bulk of the LHCE.9 The reasons for these differences will be investigated in Sections 2.2 and 2.3. In addition, the impacts of the heterogeneous EDL structures on the electrolyte reduction and SEI formation are discussed in Section 2.4.
2. Results and discussion
2.1 EDL structures for the LCE, HCE, and LHCE
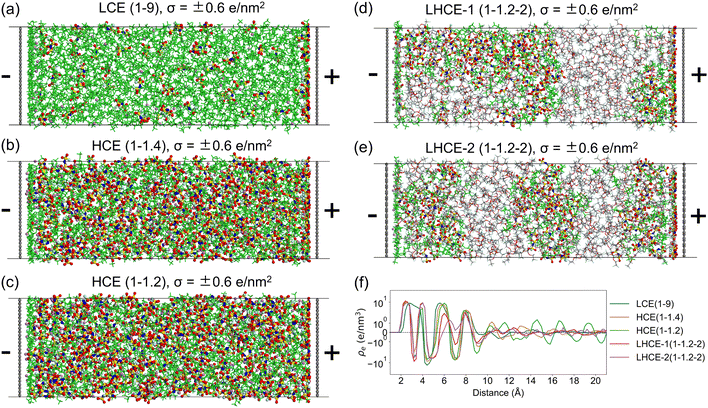
Before introducing the EDL structures, we first summarize the structures in bulk electrolytes, LCE(1–9), HCE(1–1.4), HCE(1–1.2), and LHCE(1–1.2–2), obtained from our previous MD work.9 In LCE(1–9), LiFSI is dissolved in the DME solvent to mainly form solvent-separated ionic pairs (SSIPs, >70%) along with a small portion of contact ion pairs (CIPs). In HCE(1–1.4) and HCE(1–1.2), the salt–solvent clusters are dominated by ion-pair aggregates (AGG) along with some CIPs and more coordinated ion-pair aggregates (AGG+). In LHCE(1–1.2–2), the salt–solvent clusters are dominated by AGG and AGG+ with a small fraction of CIPs. It is worth mentioning that the salt–solvent clusters of LHCE(1–1.2–2) feature higher AGG+ contribution than that of its HCE counterpart, i.e., HCE(1–1.2), due to the existence of micelle-like structures. In the micelle-like structures, the DME solvent plays the role of a surfactant and tends to show more in the interfacial region between the salt–solvent cluster region and the TFEO diluent region since it is miscible with the TFEO diluent. A small fraction of the DME solvent is completely dissolved into the TFEO diluent region. As a result, more Li+–FSI− coordination appears in the salt–solvent clusters, giving a higher local salt concentration.To investigate the EDL structures of the abovementioned electrolytes, interfacial systems have been built in which the electrolyte is sandwiched by two graphene electrodes with constant charges. See more details in the Methods section in the ESI.† The numbers of the LiFSI salt, DME solvent, and TFEO diluent in the interfacial systems for LCE(1–9), HCE(1–1.4), HCE(1–1.2), and LHCE(1–1.2–2) are given in Table S1 (ESI†). The final frames of the MD trajectories for LCE(1–9), HCE(1–1.4), and HCE(1–1.2) under a graphene surface charge density of σ = ±0.6 e nm−2 are shown in Fig. 3a–c, while those under σ = ±0.8 e nm−2 are also displayed in Fig. S1 (ESI†). Special attention is paid to σ = ±0.6 e nm−2 since it is about the surface charge under the electrochemical equilibrium conditions for Li+/Li0.50 The structures of EDLs for LCEs and HCEs under other surface charge densities are not shown, but their statistical analyses will be discussed later. As revealed in the previous study,9 the salt–solvent clusters of LHCE(1–1.2–2) in its bulk phase form a three-dimensional connected network surrounded by the TFEO matrix. Due to the limited sizes of the simulated interfacial systems in this work, the three-dimensional connected network of salt–solvent clusters may not be captured in a single simulation setup. To resolve this, we have considered two different initial configurations for LHCE(1–1.2–2), as demonstrated in Fig. S2 (ESI†). In the first initial configuration, namely LHCE-1(1–1.2–2), the system is built so that the salt–solvent clusters are connected along the direction perpendicular to the graphene plane (Fig. S2a, ESI†). In the second initial configuration, namely LHCE-2(1–1.2–2), the system is built so that the salt–solvent clusters are connected along a direction that is parallel to the graphene plane (Fig. S2b, ESI†). The time-averaged energies between these two systems are small (Fig. S2c, ESI†), suggesting that both scenarios would occur in the real interfacial system that is large enough along the graphene electrode plane. The final frames of the interfacial systems for LHCE-1(1–1.2–2) and LHCE-2(1–1.2–2) under a surface charge density of σ = ±0.6 e nm−2 are shown in Fig. 3d and e, while those under all other surface charge densities are presented in Fig. S3–S4 (ESI†). It is seen that some of the salt–solvent networks are broken after MD simulations due to their interactions with the diluent and graphene electrodes (both uncharged and charged).
It is expected that some Li+ ions are attracted to the negatively charged graphene electrode, and FSI− ions are gathered near the positively charged graphene electrode in all LCE, HCE, and LHCE systems due to Coulombic interactions between the ions and the charged graphene electrodes, as seen in the number density profiles in Fig. S5–S9 (ESI†). This becomes clearer with increasing negative charge densities on the surface and the increasing salt density in the electrolyte. In comparison, the interface adsorption interactions are more important for the first peak near the surface on zero-charged surfaces. This also suggests that the EDL structure becomes less sensitive to the electrode materials with increasing surface charge. As a result, the EDL forms near the charged electrode, as clearly shown by the charge density profiles in Fig. S10 (ESI†). In this work, the thickness of the EDL is defined as the region within 10.0 Å from the surface of the negatively charged graphene electrode51 based on these charge density profiles (Fig. S5–S10, ESI†) converging at distances of around 10 Å from the graphene electrode. This is much larger than the classical Debye length, which is about 0.6 Å for 1 M salt and 0.3 Å for 4 M salt in the DME solvent with a dielectric constant of 2.97. To compare different electrolytes, the charge density profiles (on a log scale to amplify the small fluctuations beyond the EDL region) under the surface charge density of σ = ±0.6 e nm−2 are shown in Fig. 3f. It is seen that HCE(1–1.2) features the most prominent fluctuations in its charge density profile beyond the EDL region, which is probably due to its higher overall salt concentration among the electrolyte systems investigated in this work. This is also opposite to the classical Debye length, which decreases with increasing salt concentration.
2.2 Solvation shell of Li+ ions in the EDL of the LCE, HCE, and LHCE
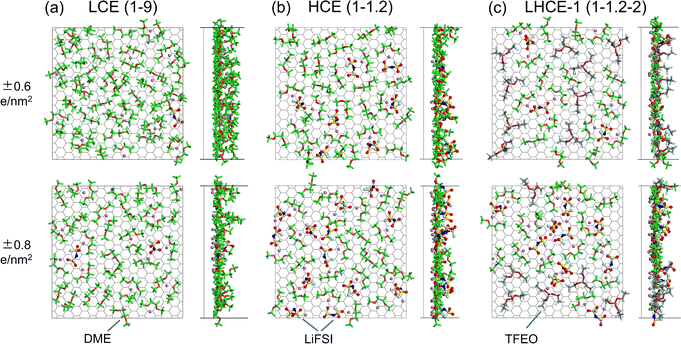
Understanding the Li+ solvation shell in the EDL is important for two reasons: (a) the desolvation of Li+ from its solvation shell impacts the Li+/Li0 charge transfer kinetics; (b) the Li+ coordination can increase the reduction voltage of a solvent species dramatically.52 The interfacial structures of the electrolyte species that directly contact the negatively charged graphene electrode for LCE(1–9), HCE(1–1.2), and LHCE-1(1–1.2–2) under surface charge densities of σ = ±0.6 e nm−2 and σ = ±0.8 e nm−2 are shown in Fig. 4, while those for HCE(1–1.4) and LHCE-2(1–1.2–2) are shown in Fig. S11 (ESI†). Near the negatively charged graphene electrode of LCE(1–9) (Fig. 4a), many Li+ ions accumulate in the EDL along with much fewer FSI− ions, phenomenologically consistent with typical EDL models. In the adsorbed layer near the negatively charged graphene electrode for HCE(1–1.4) and HCE(1–1.2), the amount of both Li+ and FSI− is significant due to the high salt concentration in this type of electrolyte. Both the Li+–FSI− and Li+–DME coordinated pairs are present in the EDL for LCEs and HCEs, as shown in Fig. 4b and Fig. S11a (ESI†). For both LHCE-1(1–1.2–2) and LHCE-2(1–1.2–2), TFEO diluent molecules show up in the EDL as well in addition to the presence of Li+, FSI−, and the DME solvent (Fig. 4c and Fig. S11b, ESI†).Surprisingly, in the EDL of LHCE(1–1.2–2), the Li+ ions appear in the diluent region and coordinate with the TFEO diluent molecules, behaving differently from that in the bulk phase.9 On one hand, the existence of Li+ ions in the TFEO diluent region is needed to screen the surface charge, as TFEO itself cannot completely screen the charges on the electrodes. As shown in Fig. S12 (ESI†), in the pure TFEO system that is sandwiched by the negatively and positively charged graphene electrodes, the TFEO molecules could form layered structures when the surface charge density of the graphene electrode is high enough (|σ| ≥ 0.6 e nm−2). This is clearly shown by the visualization of the simulated layered molecular structures under the surface charge density of σ = ±0.6 e nm−2 (Fig. S12a and b, ESI†) and verified by the repeated sparks in the charge density profiles (Fig. S12c, ESI†). This suggests that TFEO itself does not form the EDL and cannot screen the surface charges. Thus, the cations must exist in the TFEO region to screen the surface charge, which is the reason why EDL forms. On the other hand, partial desolvation allows coordination between Li+ and the TFEO diluent, which will be explained in Section 2.3.
2.3 The adsorption layer in the EDL
In the bulk phase of LCE(1–9), each Li+ is solvated by a total number of around 3.02 anions and solvent molecules (0.32 FSI− and 2.71 DME) on average (Fig. S13a, ESI†). The total Li+ ion coordination numbers are 3.81 (2.44 FSI− and 1.37 DME) in the bulk phase of HCE(1–1.4) and 3.93 (2.73 FSI− and 1.20 DME) in the bulk phase of HCE(1–1.2). In the bulk phase of LHCE(1–1.2–2) with a total Li+ coordination number of 3.90, the coordination number of Li+ to FSI− is slightly increased to 2.74 and the coordination number to DME is slightly decreased to 1.14 compared to those in HCE(1–1.2). More than that, the ratio of AGG+ is significantly increased from 17% to 25% while the ratios of both CIPs and AGG are reduced, indicating a higher localized concentration.9 The coordination number of Li+–TFEO is 0.02 in LHCE(1–1.2–2), suggesting minimal participation of TFEO in the solvation shell of Li+ ions.9The Li+ solvation shell in LHCE(1–1.2–2) has changed when it comes to the EDL and it will return to its bulk properties outside of the EDL. To capture this transition, we further divide the EDL (10 Å from the charged electrode) into two regions, i.e. the 0–5 Å region as the first layer and the 5–10 Å region as the second layer. Within 5 Å from the electrode, the number density profiles of Li+ ions (in Fig. S5–S9, ESI†) all show the first prominent peak value at around 2.5 Å from the negatively charged electrode (Fig. S5–S9, ESI†). Thus, these are considered as adsorbed cations.
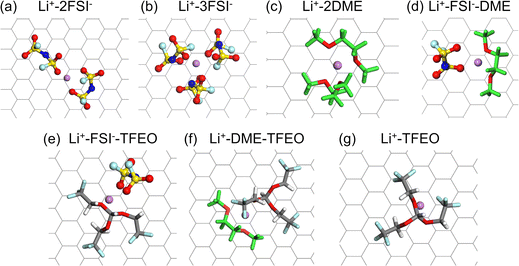
Fig. 5 shows all the possible solvation shells of the adsorbed Li+ ions for the investigated electrolyte systems. In most cases, Li+ ions coordinate with only two of the anions, solvent, and diluent molecules due to partial solvation (Fig. 5a,c–f). A particularly interesting finding is that the TFEO molecule can enter the solvation shell of Li+ ions (Fig. 5d and e), which cannot be found in bulk LHCE(1–1.2–2). Our previous study showed that each Li+ ion can be solvated by three DME molecules or two TFEO molecules in the gas phase.9 The binding energies for the Li+–FSI− pair (6.07 eV) and Li+–3DME pair (5.39 eV) are both significantly higher than that for the Li+–2TFEO pair (2.89 eV).9 As a result, the TFEO diluent molecule is not able to enter the Li+ ion solvation shell in bulk LHCE(1–1.2–2). However, in the EDL of LHCE(1–1.2–2), the partial solvation shell of the adsorbed Li+ ions can be filled by the participation of the TFEO molecule. The partial solvation shell of the Li+ ion can be even solely occupied by three ether oxygen atoms from one single TFEO molecule without any participation of FSI− ions or DME (Fig. 5g).
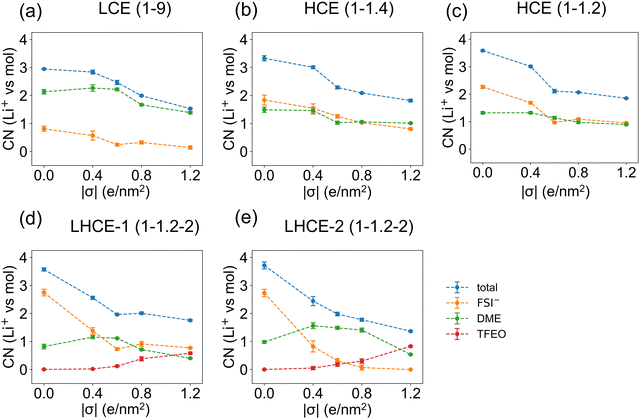
Fig. 6 shows that the total coordination numbers of the first-layer Li+ ions to the other electrolyte species decrease by around 1.5 when the surface charge density of the graphene electrode increases from σ = 0.0 e nm−2 to σ = ±1.2 e nm−2, suggesting the desolvation of Li+ ions under a more negative overpotential. As shown in Fig. 5, when the Li+ ion absorbs on the electrode, only half of its solvation shell can be occupied by the electrolyte species. It is seen from Fig. 6d and e that, in the EDL of LHCE(1–1.2–2) systems, starting at the surface charge density of σ = ±0.6 e nm−2, an average of 0.1–0.8 TFEO molecules show up in the solvation shell of each first-layer Li+ ions. For the second-layer Li+ ions, their solvation shells can be completely occupied by other electrolyte species, and thus the total coordination numbers are mostly independent of the surface charge densities of the graphene electrode (Fig. S14, ESI†). Beyond the EDL region, the coordination of Li+ is close to the bulk electrolytes.
The Stern model with an absorbed cation layer and a more diffused layer with a cation, anion, solvent, and diluent, can be used to describe the EDL of this type of electrolyte but would miss the heterogeneity.33 Because only a partial solvation shell is needed in the Stern layer in the EDL, the heterogeneous structures of the LHCE in the EDL can be very different from that in the bulk. The diluent region contains Li+ ions in the EDL but does not have any ions in the bulk of the LHCE.9 This is because TFEO cannot form a complete solvation shell in the bulk electrolyte due to the steric effect. The appearance of Li+ ions in the diluent is also necessary for the EDL, as TFEO alone cannot screen the charge. This implies that the TFEO will also contribute to SEI formation, especially when it is coordinated with Li+, in which case its reduction voltage will be increased (Fig. 7 and Table S2, ESI†).
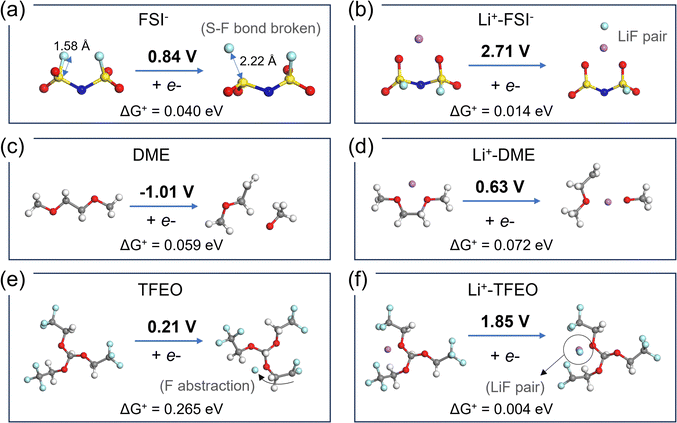 | ||
| Fig. 7 DFT-optimized geometries of the redox species and calculated reduction potentials for (a) FSI−, (b) LiFSI, (c) DME, (d) Li+–DME, (e) TFEO, and (f) Li+–TFEO. The gray, red, white, purple, light blue, yellow, and dark blue spheres stand for C, O, H, Li, F, S, and N atoms, respectively. Reduction reaction barriers are calculated following Nelsen's four-point method.53 | ||
2.4 Impact of the EDL of the LHCE on its electrolyte reduction and SEI formation
Fig. 7 shows the DFT computed reduction voltage of the anion, solvent, and diluent that constitute the LHCE. The reduction reaction barriers (ΔG+) are also calculated following Marcus theory54–56 and Nelsen's four-point method53 to account for the outer-shell and inner-shell reorganization energies (Fig. S15 and Methods in the ESI†). Since the Marcus theory estimation for the outer-shell reorganization energy is based on homogenous solutions, its accuracy on the LHCE needs to be validated in future studies with more advanced methods using molecular dynamics simulations.57,58 Nevertheless, the results show that free DME will not be reduced and contribute to SEI formation. Many experiments have correlated better SEI performance with F species in the SEI. Both FSI− anions (other reduction pathways are shown in Fig. S16, ESI†) and TFEO can contribute to LiF in the SEI. Free TFEO can be reduced above the Li deposition voltage, but the barrier is higher compared to other reduction reactions. The reduction of TFEO occurs at a much higher voltage with a much lower barrier when it is associated with Li+ ions. Thus, without clarifying the EDL structure of the LHCE, the contribution of the TFEO diluent to SEI formation may be overlooked.As we discussed above, the EDL presents complicated local structures that can dramatically change the reduction voltage and the composition of the SEI layer. Following the MD-DFT-data protocol devised by Wu et al.,21 we assume all the species in the EDL may be reduced via out-sphere electron transfer reactions. Thus, the statistics of the electrolyte in the EDL are analyzed in terms of (a) solvents/anions/diluent coordinated with Li+ in the first solvation shell and (b) free solvent/anions/diluent species (not coordinated to any Li+).21 The numbers of these electrolyte species in the EDL for the LCE, HCE, and LHCE systems are summarized in Fig. S17 (ESI†). Then, the onset of the one-electron reduction reaction voltage was calculated for all the major Li+ solvation shell structures (Fig. S18, ESI†) and the free species (Fig. 7). Their occurrence probabilities are ranked to show the sequence of reduction reactions while the potential on the electrode is lowered to the Li+/Li0 reduction voltage, to directly correlate with the SEI components observed in the experiments (Fig. S19, ESI†).
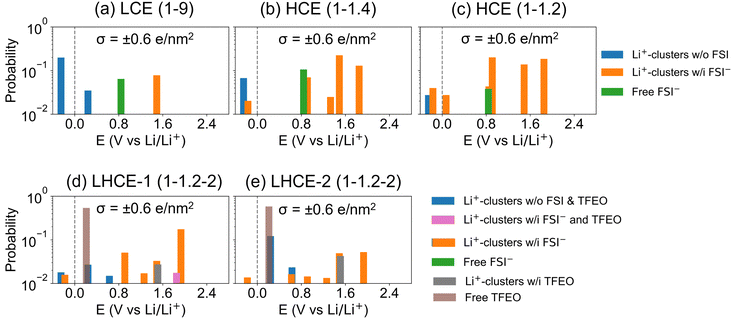
Fig. 8 shows the probability of different types of EDL species being reduced at different voltages. See more details about the definition of the probability of different types in the Methods section of the ESI.† As the electric potential is lowered in SEI formation cycles (i.e., from higher to lower values), the first to be reduced are Li+-associated FSI− anions (orange color), followed by Li+-associated TFEO (gray color); free FSI− (green color); and lastly Li+-associated DME (blue color) species. Although FSI− anions reduce first, the LCE has a higher percentage of a DME reduction induced SEI and thus a less LiF content (Fig. 8a). With increasing salt concentrations to the HCE, the probability of Li+-associated DME (blue color) reduction is minimized and the contributions from various FSI− containing species are dramatically increased. Fig. 8b and c indeed predict that HCE(1–1.4) and HCE(1–1.2) only have an anion derived SEI and there are no contributions from DME reduction above the Li/Li+ reduction voltage. Adding TFEO will introduce another F source, as both Li+-associated and free TFEOs can be reduced and generate LiF in the SEI. It is predicted that Li+-associated DME also contributes to SEI formation (blue color in Fig. 8d and e); however, its contribution is much smaller than that of TFEO. The multiple LiF sources and the different reduction kinetics of free TFEO versus other species may generate more heterogeneous nano-grained LiF phases in the SEI, as reported recently on the local SEI structures probed by nuclear magnetic resonance (NMR) measurements.59 This suggests that the design of the LHCE must consider the SEI formability of the diluents, as they have a large contribution to the EDL layer. Fluorinated diluents that generate LiF are needed.60–62
3. Conclusions
To conclude, we have revealed the EDL structures of LHCEs through MD simulations of the prototypical system of LiFSI–1.2DME–2TFEO for Li batteries. Systematic comparisons have been made with the EDL structures for LCE (LiFSI–9DME), HCE (LiFSI–1.4DME) and HCE (LiFSI–1.2DME). Both the LCE and HCE show homogeneous spatial distributions of species in the EDL. For the LCE, the adsorbed Li+ ions mainly coordinate with solvent molecules while the anion species are mostly repelled away from the negatively charged electrode surface. For the HCE, the Li+ ions not only coordinate with solvent molecules but also coordinate with a significant amount of salt anions due to strong ion pairing and the formation of aggregates.For the LHCE, the heterogeneous micelle-like structures of the bulk are extended to the EDL that is divided into the Li+-rich salt–solvent cluster region and the Li+-poor diluent region. The heterogeneity of this type of electrolyte is beyond what can be described by the Stern model with an adsorbed cation layer and a more diffused layer with ions, solvents, and diluents. Despite non-coordination between Li+ ions and the TFEO diluent in the bulk of the LHCE, the diluent region contains Li+ ions in the EDL to effectively screen the negative charge from the electrode. Only a partial solvation shell is needed near the surface, which allows coordination between Li+ and the TFEO diluent. Thus, the reduction voltage of TFEO will be increased by the association of Li+ ions in the EDL, highlighting one of the impacts of the heterogeneous EDL structures on SEI formation. This work helps extend the development of the EDL theory and guides the design of more effective LHCEs for high-performance rechargeable batteries.
Data availability
The data that support the findings of this study are available from the corresponding author upon reasonable request.Conflicts of interest
The authors have no conflicts to disclose.Acknowledgements
Q. Wu and Y. Qi thank NASA for financial support (grant no. 80NSSC21M0107) and the Center for Computation and Visualization at Brown University for providing computational resources.References
- H. Wang, Z. Yu, X. Kong, S. C. Kim, D. T. Boyle, J. Qin, Z. Bao and Y. Cui, Liquid Electrolyte: The Nexus of Practical Lithium Metal Batteries, Joule, 2022, 6(3), 588–616 CrossRef CAS.
- S. Li, M. Jiang, Y. Xie, H. Xu, J. Jia and J. Li, Developing High-Performance Lithium Metal Anode in Liquid Electrolytes: Challenges and Progress, Adv. Mater., 2018, 30(17), 1–29 Search PubMed.
- J. Kim, O. B. Chae and B. L. Lucht, Perspective—Structure and Stability of the Solid Electrolyte Interphase on Silicon Anodes of Lithium-Ion Batteries, J. Electrochem. Soc., 2021, 168(3), 030521 CrossRef CAS.
- B. Lee, E. Paek, D. Mitlin and S. W. Lee, Sodium Metal Anodes: Emerging Solutions to Dendrite Growth, Chem. Rev., 2019, 119(8), 5416–5460 CrossRef CAS PubMed.
- J. Wang, Y. Yamada, K. Sodeyama, C. H. Chiang, Y. Tateyama and A. Yamada, Superconcentrated Electrolytes for a High-Voltage Lithium-Ion Battery, Nat. Commun., 2016, 7(May), 1–9 Search PubMed.
- Y. Yamada and A. Yamada, Review—Superconcentrated Electrolytes for Lithium Batteries, J. Electrochem. Soc., 2015, 162(14), A2406–A2423 CrossRef CAS.
- X. Cao, H. Jia, W. Xu and J.-G. Zhang, Review—Localized High-Concentration Electrolytes for Lithium Batteries, J. Electrochem. Soc., 2021, 168(1), 010522 CrossRef CAS.
- N. Piao, X. Ji, H. Xu, X. Fan, L. Chen, S. Liu, M. N. Garaga, S. G. Greenbaum, L. Wang and C. Wang, et al., Countersolvent Electrolytes for Lithium-Metal Batteries, Adv. Energy Mater., 2020, 10(10), 1–9 Search PubMed.
- C. M. Efaw, Q. Wu, N. Gao, Y. Zhang, H. Zhu, K. Gering, M. F. Hurley, H. Xiong, E. Hu and X. Cao, et al., Localized High-Concentration Electrolytes Get More Localized through Micelle-like Structures, Nat. Mater., 2023, 22(12), 1531–1539 CrossRef CAS PubMed.
- M. J. Hossain, Q. Wu, E. J. Marin Bernardez, C. D. Quilty, A. C. Marschilok, E. S. Takeuchi, D. C. Bock, K. J. Takeuchi and Y. Qi, The Relationship between Ionic Conductivity and Solvation Structures of Localized High-Concentration Fluorinated Electrolytes for Lithium-Ion Batteries, J. Phys. Chem. Lett., 2023, 14(34), 7718–7731 CrossRef CAS PubMed.
- S. B. Schryver, W. Ramsden, C. F. Cross, P. Schidrowitz, W. P. Dreaper, J. W. McBain, T. Turner, F. P. Worley, C. J. Martin and W. R. Bousfield, et al., Discussion: Colloids and Their Viscosity, Trans. Faraday Soc., 1913, 9, 93 RSC.
- D. J. McClements, Nanoemulsions versus Microemulsions: Terminology, Differences, and Similarities, Soft Matter, 2012, 8(6), 1719–1729 RSC.
- A. Verma, M. C. Schulze and A. Colclasure, Micelle-like Bulk Structure of Localized High-Concentration Electrolytes, Joule, 2024, 8(1), 10–12 CrossRef.
- J. Wu, Understanding the Electric Double-Layer Structure, Capacitance, and Charging Dynamics, Chem. Rev., 2022, 122(12), 10821–10859 CrossRef CAS PubMed.
- M. W. Swift, J. W. Swift and Y. Qi, Modeling the Electrical Double Layer at Solid-State Electrochemical Interfaces, Nat. Comput. Sci., 2021, 1(3), 212–220 CrossRef PubMed.
- R. Jorn, R. Kumar, D. P. Abraham and G. A. Voth, Atomistic Modeling of the Electrode-Electrolyte Interface in Li-Ion Energy Storage Systems: Electrolyte Structuring, J. Phys. Chem. C, 2013, 117(8), 3747–3761 CrossRef CAS.
- O. Borodin, X. Ren, J. Vatamanu, A. Von Wald Cresce, J. Knap and K. Xu, Modeling Insight into Battery Electrolyte Electrochemical Stability and Interfacial Structure, Acc. Chem. Res., 2017, 50(12), 2886–2894 CrossRef CAS PubMed.
- A. Wang, S. Kadam, H. Li, S. Shi and Y. Qi, Review on Modeling of the Anode Solid Electrolyte Interphase (SEI) for Lithium-Ion Batteries, npj Comput. Mater., 2018, 4(1), 15 CrossRef.
- P. M. Attia, S. Das, S. J. Harris, M. Z. Bazant and W. C. Chueh, Electrochemical Kinetics of SEI Growth on Carbon Black: Part I. Experiments, J. Electrochem. Soc., 2019, 166(4), E97–E106 CrossRef CAS.
- S. Das, P. M. Attia, W. C. Chueh and M. Z. Bazant, Electrochemical Kinetics of SEI Growth on Carbon Black: Part II. Modeling, J. Electrochem. Soc., 2019, 166(4), E107–E118 CrossRef CAS.
- Q. Wu, M. T. McDowell and Y. Qi, Effect of the Electric Double Layer (EDL) in Multicomponent Electrolyte Reduction and Solid Electrolyte Interphase (SEI) Formation in Lithium Batteries, J. Am. Chem. Soc., 2023, 145(4), 2473–2484 CrossRef CAS PubMed.
- F. Chen, Atomistic Modelling Approaches to Understanding the Interfaces of Ionic Liquid Electrolytes for Batteries and Electrochemical Devices, Curr. Opin. Electrochem., 2022, 35, 101086 CrossRef CAS.
- L. Suo, O. Borodin, T. Gao, M. Olguin, J. Ho, X. Fan, C. Luo, C. Wang and K. Xu, “Water-in-Salt” Electrolyte Enables High-Voltage Aqueous Lithium-Ion Chemistries, Science, 2015, 350(6263), 938–943 CrossRef CAS PubMed.
- C. Yang, J. Chen, T. Qing, X. Fan, W. Sun, A. von Cresce, M. S. Ding, O. Borodin, J. Vatamanu and M. A. Schroeder, et al., 4.0 V Aqueous Li-Ion Batteries, Joule, 2017, 1(1), 122–132 CrossRef CAS.
- J. Vatamanu and O. Borodin, Ramifications of Water-in-Salt Interfacial Structure at Charged Electrodes for Electrolyte Electrochemical Stability, J. Phys. Chem. Lett., 2017, 8(18), 4362–4367 CrossRef CAS PubMed.
- C.-Y. Li, M. Chen, S. Liu, X. Lu, J. Meng, J. Yan, H. D. Abruña, G. Feng and T. Lian, Unconventional Interfacial Water Structure of Highly Concentrated Aqueous Electrolytes at Negative Electrode Polarizations, Nat. Commun., 2022, 13(1), 5330 CrossRef CAS PubMed.
- M. Kahlweit, Microemulsions, Science, 1988, 240(4852), 617–621 CrossRef CAS PubMed.
- J. Holoubek, K. Yu, J. Wu, S. Wang, M. Li, H. Gao, Z. Hui, G. Hyun, Y. Yin and A. U. Mu, et al., Toward a Quantitative Interfacial Description of Solvation for Li Metal Battery Operation under Extreme Conditions, Proc. Natl. Acad. Sci. U. S. A., 2023, 120(41), 2017 CrossRef PubMed.
- L. Zeng, J. Peng, J. Zhang, X. Tan, X. Ji, S. Li and G. Feng, Molecular Dynamics Simulations of Electrochemical Interfaces, J. Chem. Phys., 2023, 159(9), 091001 CrossRef CAS PubMed.
- H. Helmholtz, Ueber Einige Gesetze Der Vertheilung Elektrischer Ströme in Körperlichen Leitern, Mit Anwendung Auf Die Thierisch-elektrischen Versuche (Schluss.), Ann. Phys., 1853, 165(7), 353–377 CrossRef.
- M. Gouy, Sur La Constitution de La Charge Électrique à La Surface d’un Électrolyte, J. Phys. Theor. Appl., 1910, 9(1), 457–468 CrossRef.
- D. L. Chapman, LI. A Contribution to the Theory of Electrocapillarity, London, Edinburgh Dublin Philos. Mag. J. Sci., 1913, 25(148), 475–481 CrossRef.
- O. Stern, Zur Theorie der elektrolytischen Doppelschicht, Z. Elektrochem. Angew. Phys. Chem., 1924, 30(21–22), 508–516 CrossRef CAS.
- G. A. Giffin, The Role of Concentration in Electrolyte Solutions for Non-Aqueous Lithium-Based Batteries, Nat. Commun., 2022, 13(1), 5250 CrossRef CAS PubMed.
- I. Borukhov, D. Andelman and H. Orland, Steric Effects in Electrolytes: A Modified Poisson-Boltzmann Equation, Phys. Rev. Lett., 1997, 79(3), 435–438 CrossRef CAS.
- A. A. Kornyshev, Double-Layer in Ionic Liquids: Paradigm Change?, J. Phys. Chem. B, 2007, 111(20), 5545–5557 CrossRef CAS PubMed.
- M. Z. Bazant, B. D. Storey and A. A. Kornyshev, Double Layer in Ionic Liquids: Overscreening versus Crowding, Phys. Rev. Lett., 2011, 106(4), 046102 CrossRef PubMed.
- Z. A. H. Goodwin and A. A. Kornyshev, Underscreening, Overscreening and Double-Layer Capacitance, Electrochem. Commun., 2017, 82(June), 129–133 CrossRef CAS.
- Z. Zhang, Y. Gao, S. Chen and J. Huang, Understanding Dynamics of Electrochemical Double Layers via a Modified Concentrated Solution Theory, J. Electrochem. Soc., 2020, 167(1), 013519 CrossRef.
- M. McEldrew, Z. A. H. Goodwin, A. A. Kornyshev and M. Z. Bazant, Theory of the Double Layer in Water-in-Salt Electrolytes, J. Phys. Chem. Lett., 2018, 9(19), 5840–5846 CrossRef CAS PubMed.
- M. Zhang, Y. Chen, M. Eikerling and J. Huang, Grand-Canonical Variational Theory of Oscillatory Fields at Electrified Metal-Solution Interfaces, ChemRxiv, 2024, preprint DOI:10.26434/chemrxiv-2024-c5dvr.
- Z. A. H. Goodwin, M. McEldrew, B. Kozinsky and M. Z. Bazant, Theory of Cation Solvation and Ionic Association in Nonaqueous Solvent Mixtures, PRX Energy, 2023, 2(1), 013007 CrossRef.
- N. Yao, X. Chen, Z. Fu and Q. Zhang, Applying Classical, Ab Initio, and Machine-Learning Molecular Dynamics Simulations to the Liquid Electrolyte for Rechargeable Batteries, Chem. Rev., 2022, 122(12), 10970–11021 CrossRef CAS PubMed.
- L. Scalfi, M. Salanne and B. Rotenberg, Molecular Simulation of Electrode-Solution Interfaces, Annu. Rev. Phys. Chem., 2021, 72(1), 189–212 CrossRef CAS PubMed.
- R. Sundararaman, D. Vigil-Fowler and K. Schwarz, Improving the Accuracy of Atomistic Simulations of the Electrochemical Interface, Chem. Rev., 2022, 122(12), 10651–10674 CrossRef CAS PubMed.
- J. Qian, W. A. Henderson, W. Xu, P. Bhattacharya, M. Engelhard, O. Borodin and J.-G. Zhang, High Rate and Stable Cycling of Lithium Metal Anode, Nat. Commun., 2015, 6(1), 6362 CrossRef CAS PubMed.
- X. Cao, L. Zou, B. E. Matthews, L. Zhang, X. He, X. Ren, M. H. Engelhard, S. D. Burton, P. Z. El-Khoury and H. S. Lim, et al., Optimization of Fluorinated Orthoformate Based Electrolytes for Practical High-Voltage Lithium Metal Batteries, Energy Storage Mater., 2021, 34, 76–84 CrossRef.
- M. McEldrew, Z. A. H. Goodwin, S. Bi, M. Z. Bazant and A. A. Kornyshev, Theory of Ion Aggregation and Gelation in Super-Concentrated Electrolytes, J. Chem. Phys., 2020, 152(23), 234506 CrossRef CAS PubMed.
- Z. A. H. Goodwin, M. McEldrew, J. P. De Souza, M. Z. Bazant and A. A. Kornyshev, Gelation, Clustering, and Crowding in the Electrical Double Layer of Ionic Liquids, J. Chem. Phys., 2022, 157(9), 094106 CrossRef CAS PubMed.
- Y. Li and Y. Qi, Energy Landscape of the Charge Transfer Reaction at the Complex Li/SEI/Electrolyte Interface, Energy Environ. Sci., 2019, 12(4), 1286–1295 RSC.
- J. W. Abbott and F. Hanke, Kinetically Corrected Monte Carlo–Molecular Dynamics Simulations of Solid Electrolyte Interphase Growth, J. Chem. Theory Comput., 2022, 18(2), 925–934 CrossRef CAS PubMed.
- O. Borodin, M. Olguin, C. E. Spear, K. W. Leiter and J. Knap, Towards High Throughput Screening of Electrochemical Stability of Battery Electrolytes, Nanotechnology, 2015, 26(35), 354003 CrossRef PubMed.
- S. F. Nelsen, S. C. Blackstock and Y. Kim, Estimation of Inner Shell Marcus Terms for Amino Nitrogen Compounds by Molecular Orbital Calculations, J. Am. Chem. Soc., 1987, 109(3), 677–682 CrossRef CAS.
- R. A. Marcus, On the Theory of Electron-Transfer Reactions. VI. Unified Treatment for Homogeneous and Electrode Reactions, J. Chem. Phys., 1965, 43(2), 679–701 CrossRef CAS.
- R. A. Marcus, Electron Transfer Reactions in Chemistry. Theory and Experiment, Rev. Mod. Phys., 1993, 65(3), 599–610 CrossRef CAS.
- T. P. Silverstein, Marcus Theory: Thermodynamics CAN Control the Kinetics of Electron Transfer Reactions, J. Chem. Educ., 2012, 89(9), 1159–1167 CrossRef CAS.
- R. A. Kuharski, J. S. Bader, D. Chandler, M. Sprik, M. L. Klein and R. W. Impey, Molecular Model for Aqueous Ferrous–Ferric Electron Transfer, J. Chem. Phys., 1988, 89(5), 3248–3257 CrossRef CAS.
- C.-H. Yang, C.-I. Wang, Y.-S. Wang and C.-P. Hsu, Non-Negligible Outer-Shell Reorganization Energy for Charge Transfer in Nonpolar Systems, J. Chem. Theory Comput., 2024, 20(16), 6981–6991 CAS.
- A. Svirinovsky-Arbeli, M. Juelsholt, R. May, Y. Kwon and L. E. Marbella, Using NMR Spectroscopy to Link Structure to Function at the Li Solid Electrolyte Interphase, Joule, 2024, 1919–1935 CrossRef CAS.
- J. Chen, H. Zhang, M. Fang, C. Ke, S. Liu and J. Wang, Design of Localized High-Concentration Electrolytes via Donor Number, ACS Energy Lett., 2023, 8(4), 1723–1734 CrossRef CAS.
- Y. Wang, Z. Li, Y. Hou, Z. Hao, Q. Zhang, Y. Ni, Y. Lu, Z. Yan, K. Zhang and Q. Zhao, et al., Emerging Electrolytes with Fluorinated Solvents for Rechargeable Lithium-Based Batteries, Chem. Soc. Rev., 2023, 2713–2763 RSC.
- J. Moon, D. O. Kim, L. Bekaert, M. Song, J. Chung, D. Lee, A. Hubin and J. Lim, Non-Fluorinated Non-Solvating Cosolvent Enabling Superior Performance of Lithium Metal Negative Electrode Battery, Nat. Commun., 2022, 13(1), 4538 CrossRef CAS PubMed.
Footnote |
| † Electronic supplementary information (ESI) available. See DOI: https://doi.org/10.1039/d5ee00206k |
| This journal is © The Royal Society of Chemistry 2025 |

