
 Open Access Article
 This Open Access Article is licensed under a
 Creative Commons Attribution 3.0 Unported Licence
Operando single-particle imaging reveals that asymmetric ion flux contributes to capacity degradation in aged Ni-rich layered cathodes†
Zhengyan
Lun
 abcd,
Alice J.
Merryweather‡
abce,
Amoghavarsha
Mahadevegowda‡
cf,
Shrinidhi S.
Pandurangi‡
cg,
Chao
Xu
abch,
Simon
Fairclough
e,
Vikram S.
Deshpande
cg,
Norman A.
Fleck
cg,
Caterina
Ducati
cf,
Christoph
Schnedermann
*bce,
Akshay
Rao
*bce and
Clare P.
Grey
*abce
abcd,
Alice J.
Merryweather‡
abce,
Amoghavarsha
Mahadevegowda‡
cf,
Shrinidhi S.
Pandurangi‡
cg,
Chao
Xu
abch,
Simon
Fairclough
e,
Vikram S.
Deshpande
cg,
Norman A.
Fleck
cg,
Caterina
Ducati
cf,
Christoph
Schnedermann
*bce,
Akshay
Rao
*bce and
Clare P.
Grey
*abce
aYusuf Hamied Department of Chemistry, University of Cambridge, Cambridge, UK. E-mail: cpg27@cam.ac.uk
bCavendish Laboratory, University of Cambridge, Cambridge, UK. E-mail: cs2002@cam.ac.uk; ar525@cam.ac.uk
cThe Faraday Institution, Quad One, Harwell Science and Innovation Campus, Didcot, UK
dSchool of Chemical Sciences, University of Chinese Academy of Sciences, Beijing, China
eIllumion Ltd, Maxwell Centre, Cambridge, UK
fDepartment of Materials Science and Metallurgy, University of Cambridge, UK
gDepartment of Engineering, University of Cambridge, Cambridge, UK
hSchool of Physical Science and Technology, ShanghaiTech University, Shanghai, China
First published on 24th March 2025
Abstract
Extensive worldwide efforts have been made to understand the degradation behavior of layered Ni-rich LiNixMnyCo(1−x−y)O2 (NMC) cathodes. The majority of studies carried out to date have focused on thermodynamic perspectives and are conducted ex situ; operando investigations on aged materials, especially those that can resolve dynamic information in a single-particle level remain sparse, preventing the development of long-term stable NMCs. Here, we directly visualize the real-time Li-ion transport kinetics of aged Ni-rich single-crystal NMC under operando conditions and at single-particle level using a recently developed optical microscopy technique. For both fresh and aged particles, we identify Li-ion concentration gradients developing during the early stages of delithiation – resulting in a Li-rich core and Li-poor surface – as observed previously and attributed to low Li-ion diffusivity at high Li-occupancies. Critically, in contrast to fresh particles, the Li-ion gradients in aged particles become markedly asymmetric, with the Li-rich core shifted away from the center of mass of the particle. Using ex situ transmission electron microscopy, we show that cell aging produces an uneven build-up of a surface rocksalt layer. Supported by finite-element modelling, we attribute the asymmetric delithiation behavior of the aged particles to this uneven rocksalt layer, which impedes the Li-ion flux heterogeneously at the particle surface. Our results demonstrate a new mechanism that contributes to the capacity and rate degradation of Ni-rich cathodes, highlighting the importance of controlling the build-up of detrimental interfacial layers in cathodes and providing a rational for improving the long-term stability and rate capabilities of Ni-rich NMC cathodes.
Broader contextThe development of high-performance rechargeable Li-ion batteries is a prerequisite for the large-scale deployment of electric vehicles (EVs), which is essential to the realization of a carbon-neutral society. Owing to their excellent energy density, layered Ni-rich cathodes are arguably the most promising cathode materials for EV applications. However, they are prone to substantially faster capacity degradation than lower-Ni counterparts. Via work described here, we propose a new mechanism that contributes to the capacity and rate degradation in Ni-rich NMC cathode upon extended cycling. Specifically, we show that the Li-ion flux across the particle surface becomes noticeably more heterogeneous due to the uneven growth of rocksalt phase, which alters the Li ion transport kinetics. We examine this phenomenon by visualizing the operando charging behavior of individual NMC single-crystal particles within fresh and aged Ni-rich cathode materials using recently-developed operando optical scattering microscopy. Electron microscopic and computational evidences are also applied to rationalize our optical observations from a structural and physical perspective. Our work reveals important non-equilibrium processes occurring in the state-of-the-art layered cathode materials and their evolution upon extended cycling, which must be taken into account when developing next-generation materials with better rate capability and longer lifetime. |
Introduction
Despite the demonstrated higher capacity and energy density, the commercialization of Ni-rich LiNixMnyCo(1−x−y)O2 (NMC) cathodes is hindered by cycling stability issues.1–8 Several degradation mechanisms have been proposed. Irreversible oxygen loss and electrolyte decomposition at the interface lead to surface impedance growth;5,8–11 this is associated with the growth of rocksalt layers (RSLs) that impede Li-ion transport.6,12,13 The large lattice strain, especially at high state of charge (SOC), is believed to be a key reason for secondary particle cracking, which enhances interfacial side-reactions.7,14 The related lattice mismatch between the layered phase and rocksalt phase may also create a ‘fatigued phase’ that can barely reach beyond 75% delithiation.15 Other factors, such as residual Li compounds from synthesis16,17 or transition metal (TM) dissolution18–20 have also been demonstrated to contribute to the capacity degradation. While all these advancements deepen the understanding of Ni-rich NMC degradation, they focus mainly on thermodynamic aspects and do not provide much information on the dynamic processes during degradation. In particular, changes to the Li-ion transport behavior within individual active particles during cycling remain unresolved, since such information requires single-particle level real-time imaging with high time resolution.Synchrotron operando diffraction demonstrates reasonable time resolution and has been used to capture kinetically-induced phase segregation or metastable states,21,22 which relax back to thermodynamically stable states and are no longer observable when measured ex situ. However, diffraction techniques are generally sensitive only to the bulk and ensemble system, incapable of identifying if such phase segregation occurs at the inter- or intra-particle level. Synchrotron-based imaging techniques, such as transmission X-ray microscopy (TXM) or scanning transmission X-ray microscopy (STXM) can be applied to image nanoscale single-particle heterogeneity,23,24 and recent advancements in certain synchrotron beamlines have made it possible to fully map a micrometer-sized cathode particle with sufficient energy resolution within a timeframe of several to tens of minutes. Mapping of transmission electron microscopy (TEM) has improved spatial resolution and time efficiency compared to X-ray based techniques,25,26 though it typically requires high-vacuum operation and thin samples, making it challenging for operando tests.27
In view of these limitations of various techniques, we applied our recently-developed optical scattering microscopy method,28–30 which is now also known as charge photometry, to image the real-time Li-ion transport dynamics at the single-particle level for aged single-crystal Ni-rich NMC particles. Our previous work has demonstrated the optical scattering microscopy to be a powerful tool to map the local Li-ion concentration within individual particles including both anode29 and cathode28,30 materials, which is correlated with the optical intensity and Li spatial distribution. Its high time resolution, capable of imaging within millisecond, also enables its operando capability. Using this technique, we recently observed a kinetically-induced particle-level reaction heterogeneity at the beginning of charge in single-crystal Ni-rich NMC cathodes, with a distinct Li-rich core and Li-poor surface developing via a ‘shrinking-core’-like behavior, as a result of the low Li-ion mobility near a full-lithiated state.30
By applying the same technique to aged single-crystal Ni-rich NMC cathodes, we now reveal how extended aging cycles lead to another source of heterogeneity which arises dynamically at the single-particle level. We find that some parts of the particle surface experience a higher Li-ion flux than the others, resulting in an asymmetric ‘shrinking core’-like behavior at the beginning of charge. Combining high-resolution TEM imaging and finite element simulation, we attribute the asymmetric delithiation to the non-uniform growth of rocksalt layers, which significantly impacts the Li-ion diffusion within the particles. We further highlight that this asymmetric Li-ion flux is especially detrimental to the rate capability of the aged Ni-rich NMC and the capacity fade of Ni-rich NMC is manifested as more of a rate-capability fade.
Material characterization and operando optical microscopy
Single-crystal Ni-rich NMC with composition of LiNi0.88Mn0.05Co0.07O2 was used for operando optical imaging because of its large particle size (average particle size of 3.5–4.0 μm, with span ∼1.2 μm) and well-defined basal plane (a/b plane). X-ray diffraction pattern and Rietveld refinement of the pristine powder confirm its phase purity with low Li/Ni anti-site mixing less than 2%, as shown in Fig. 1a and Table S1 (ESI†). The fresh NMC particles were prepared in a free-standing electrode (60% mass loading) and assembled in an optically-accessible electrochemical half-cell (Fig. 1b) as described previously.28–30 A typical image obtained by optical scattering microscopy is shown in Fig. 1c (left) and highlights bright NMC particles embedded in a darker surrounding conductive carbon matrix. These bright particles can be further identified as particles with their flat basal planes perpendicular to the light illumination,29,30 as confirmed by an SEM image collected from the same area of the electrode (Fig. 1c, right).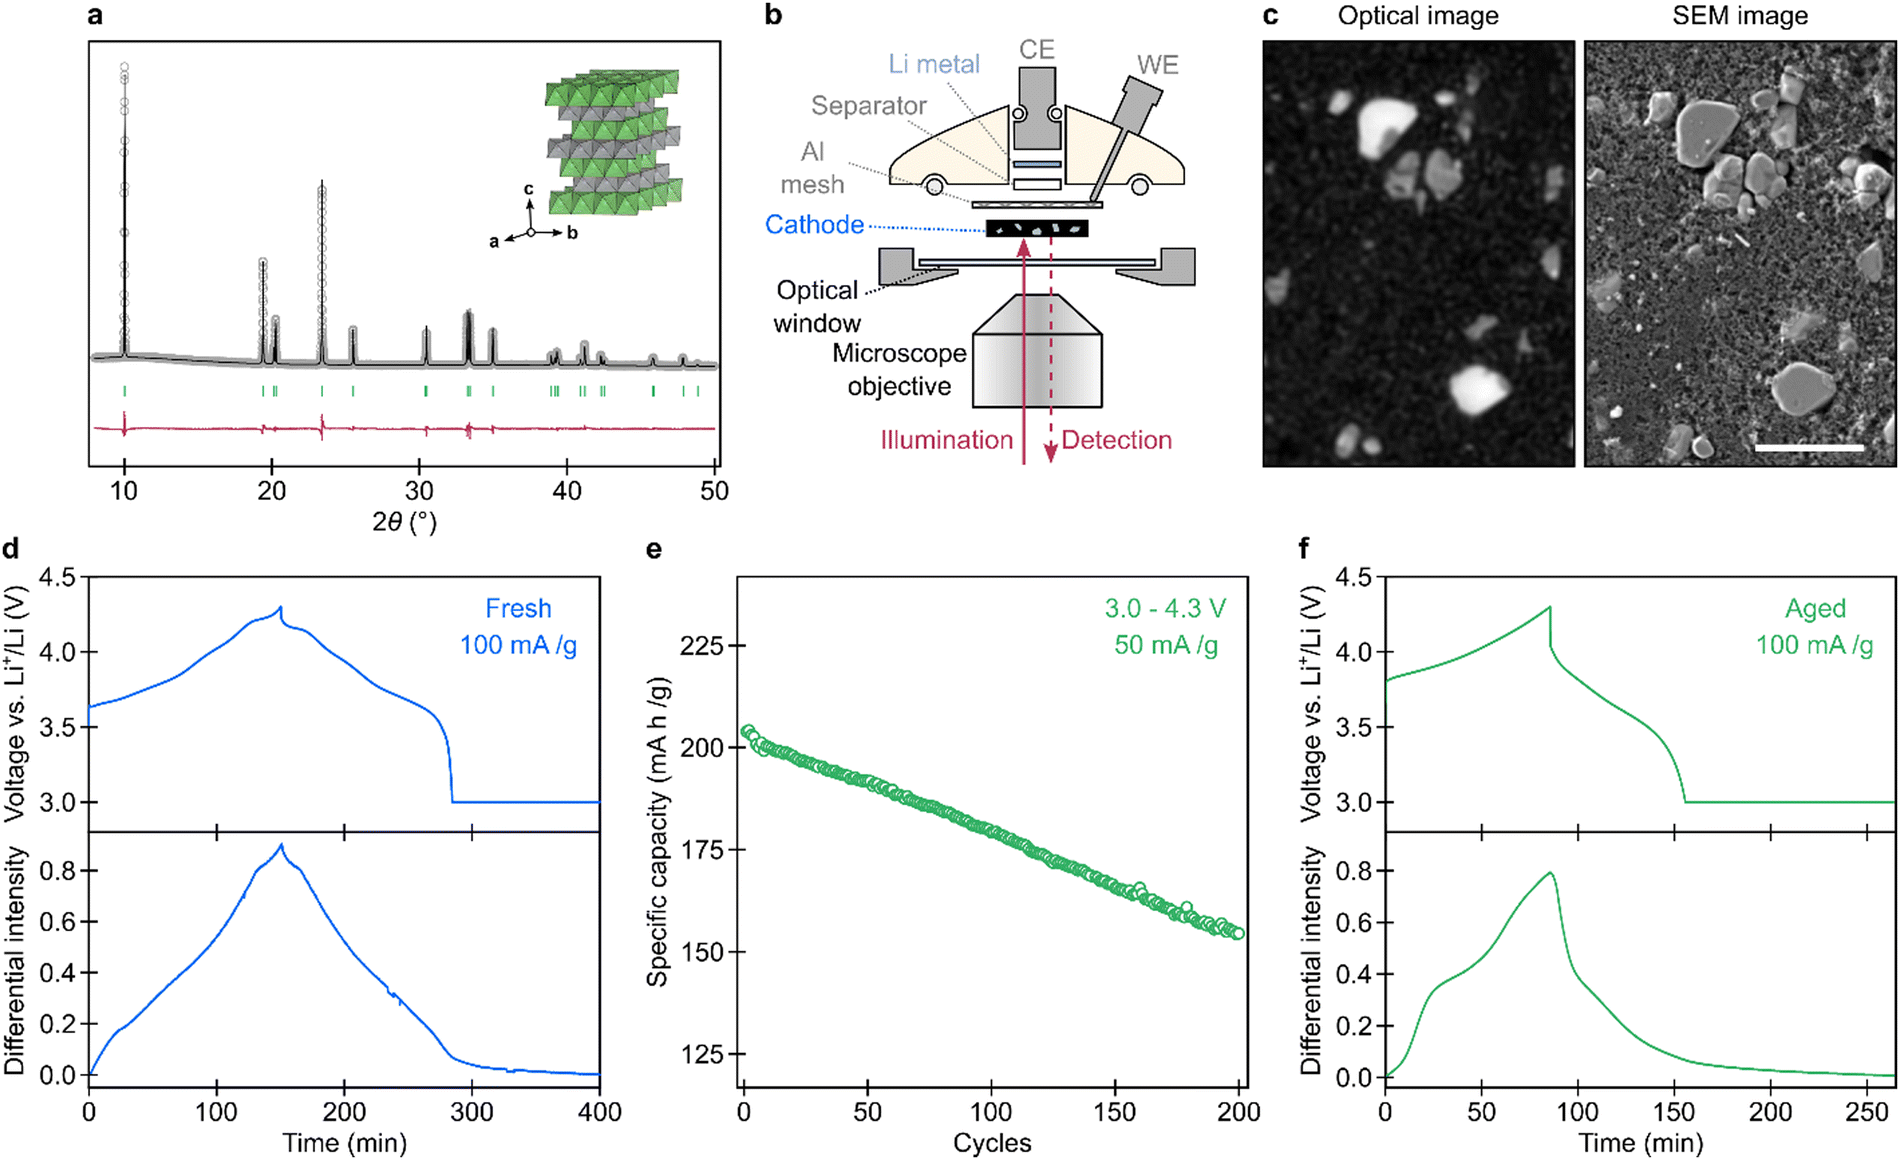 | ||
| Fig. 1 Characterization of single-crystal Ni-rich NMC cathode, including operando optical scattering microscopy. (a) X-ray diffraction pattern and Rietveld refinement of pristine single-crystal Ni-rich NMC cathode. The inset demonstrates the crystal structure of the material. The a/b plane is the basal plane in which the two-dimensional (2D) Li+ transport happens. The c-axis is perpendicular to the basal (a/b) plane. (b) Schematic of the optically-accessible cell for operando optical microscopy measurement. A self-standing electrode composite, Al mesh and Li chip are used as cathode, current collector and anode, respectively. (c) A representative demonstration of an optical scattering microscopy image showing part of a self-standing aged electrode composite and its corresponding SEM image. Scale bar 5 μm. (d) A representative demonstration of the cell-level voltage profile and corresponding normalized optical intensity of an individual fresh NMC particle. The electrode was cycled between 4.3 and 3 V at a constant current of 100 mA g−1 followed by a constant voltage holding at 3 V. (e) Cycling capacity of the NMC electrode in a half cell between 3 and 4.3 V at a cycling rate of 50 mA g−1, producing an ‘aged’ electrode after 200 cycles. (f) A representative demonstration of the cell-level voltage profile and corresponding normalized optical intensity of an individual aged NMC particle. After aging for 200 cycles under the cycling conditions shown in panel (e), the electrode was then cycled in the optical cell between 4.3 and 3 V at a constant current of 100 mA g−1, followed by a constant voltage hold at 3 V, whilst obtaining optical images. | ||
The optical intensity, referring to the amount of light that is reflected/scattered from the sample and then collected and detected by the microscope and CMOS camera, is affected by a number of factors, including the microscope components, the optical cell design, the refractive index of the electrolyte, and, crucially, the reflectivity of the active NMC material, as discussed in our previous work.28 This last factor is determined by the electronic structure of the NMC, which changes as a function of changing lithiation state. Therefore, as the NMC is (de)lithiated, the detected optical intensity changes in response, allowing changes to the local lithiation state to be imaged and tracked in real time. Specifically when cycling this battery, the optical intensity of pristine NMC particles monotonically increases upon delithiation and monotonically decreases upon lithiation, in line with previous reports.30 The optical intensity changes arise because the dielectric properties of the NMC cathode are strongly dependent on its Li-content, meaning that the changes in optical intensity can be used as a qualitative proxy for the changing local state-of-charge. The correlation between the cell-level state of charge and the single-particle differential intensity (integrated over the particle and normalized with respect to the first frame) during an operando charge–discharge measurement is displayed in Fig. 1d, confirming these monotonic intensity behaviors.
For optical measurements of aged materials, the self-standing electrode was first aged in a standard coin cell with a Li metal anode according to various aging protocols. A typical capacity retention curve for a cell that was cycled between 3 and 4.3 V at a rate of 50 mA g−1 (∼C/4) for 200 cycles is shown in Fig. 1e. The first cycle capacity is 204 mA h g−1, with 155 mA g−1 maintained after 200 cycles, corresponding to 75.9% of its initial capacity. The aged electrode was then extracted from the coin cell and re-assembled into an optically-accessible cell for operando optical scattering microscopy measurements. A representative comparison of the cell-level voltage profile and single-particle optical intensity response for an aged particle is shown in Fig. 1f. The aged electrode shows reduced capacity and increased polarization compared to the fresh electrode, but the particle intensity response still monotonically increases during charge and monotonically decreases during discharge, albeit with changes in the shape of the optical response profile.5,6,28,30
Off-centered ‘shrinking-core’ and asymmetric Li-ion flux in aged particles
We explored the single-particle Li-ion transport dynamics in fresh and aged particles using operando optical scattering microscopy, focusing on NMC particles with the basal plane perpendicular to the light illumination. The optically-accessible cells were cycled at 100 mA g−1 (∼C/2) between 3.0 V and 4.3 V. Fig. 2a presents the voltage profile and normalized optical intensity evolution at the beginning of charge, for a fresh electrode. Blue circles mark the time points when the differential optical intensity image of a representative particle is extracted and displayed in Fig. 2b. See Video S1 (ESI†) for the full set of images recorded over the full cycle and Video S2 (ESI†) for differential intensity evolution. | ||
| Fig. 2 Single particle reaction heterogeneity in fresh and aged Ni-rich NMC particles. (a) Voltage profile and normalized optical intensity evolution of a selected fresh particle during the first 30 min of the operando measurement. The optical cell was cycled at 100 mA g−1 and the optical intensity was obtained by averaging the intensity across the whole active particle in (b). (b) Normalized (with respect to the first frame) differential optical intensity distribution across a representative fresh particle at the beginning of charge, for the time spots marked by blue circles in (a). The binary color scale is centered at zero (white); with positive values representing an intensity increase (red color) and Li removal. (c) Voltage profile and normalized optical intensity evolution of a selected aged particle (which had first been aged in a coin cell via the cycling protocol shown in Fig. 1e) during the first 30 min of the operando imaging measurement. The optical cell was cycled at 100 mA g−1. (d) Normalized (with respect to the first frame) differential optical intensity distribution across a representative aged particle at the beginning of charge, for the time spots marked by green circles in (c). (e) Voltage profile and normalized optical intensity evolution of the same aged particle (also shown in d) during a charge-rest measurement. The optical cell was charged at 70 mA g−1 for 20 min and rested. (f) Normalized (with respect to the first frame) differential optical intensity distribution across the same particle at various periods during the charge-rest experiment marked by red circles in (f). Scale bars 1 μm. | ||
It can be observed from Fig. 2a and b that, at the beginning of charge, the Li removal from the particle is heterogeneous. The periphery of the particle gets delithiated first, as indicated by the increasing optical intensity in these regions (the red regions in Fig. 2b) while the core of the particle remains mostly fully lithiated with little change in optical intensity for the first ∼15 minutes (the white regions in Fig. 2b), causing a distinct segregation between a Li-poor periphery and a Li-rich core. On continued charging, the Li-poor region propagates towards the core (referred to here as a ‘shrinking core’-like behavior), and eventually (after ∼25 min) the Li-poor region reaches the center and the particle intensity becomes more homogenous across the particle. This observation is in full agreement with previous reports where the ‘shrinking core’-like behavior is shown to be a kinetically-induced reaction heterogeneity and can be attributed to the sluggish Li-ion diffusion at near-full Li-occupancies30 (Fig. S1, ESI†). We highlight, in particular, that the ‘shrinking core’-like behavior is largely symmetric, i.e., the Li-poor region develops evenly around the periphery of the particle, and the Li-rich core is located close to the center of mass of the particle. This symmetric behavior is shown to be prevalent across many different individual particles observed in the fresh electrode (a further 10 examples are shown in Fig. S2, ESI†).
Equivalent measurements were also performed on aged electrodes (see Methodology section) and the results for a representative aged particle are shown in Fig. 2c, d and Video S3 (ESI†) (raw images), Video S4 (ESI†) (differential analysis). We find that the aged particle also shows a “shrinking core”-like behavior, with Li-poor and Li-rich regions forming at the beginning of charge, similar to the fresh electrode. Critically, however, the “shrinking core” appears to be significantly asymmetric – for the particle depicted in Fig. 2d, the Li-poor regions develop predominantly from the right edge of the particle, leaving the Li-rich region near the left edge of the particle, rather than at its center of mass.
We repeated this experiment for 17 similar particles across 3 different electrodes which had undergone the same aging protocols and found that 12 particles displayed pronounced asymmetry (i.e. 71% of particles, characterized by the Li-poor regions initially forming unevenly around the particle periphery and the Li-rich region being displaced from the particle center), while only 5 displayed a symmetric “shrinking core”-like behavior (Fig. S3 and S7, ESI†). In contrast, only 2 out of 18 particles selected from several fresh electrodes displayed an asymmetric behavior (11%), while 16 out of 18 were symmetric (Fig. S2 and S7, ESI†). Taken together, these results show that aging has a profound impact on the spatially-resolved evolution of delithiated regions within single-crystal NMC particles during charging.
Asymmetric Li-ion flux is a surface dominated phenomenon
To understand the origin of the asymmetric delithiation, we first conducted a charge-rest experiment of the aged electrode. Whilst recording optical images of the same particle, the electrode was charged at a rate of 70 mA g−1 for 20 min and then the current was stopped as the electrode was allowed to rest (Fig. 2e). Similar to the results shown in Fig. 2d, we again observed an asymmetric distribution of Li-poor and Li-rich regions developing within the particle whilst the charging current was applied, with the Li-poor region again emerging predominantly on the right side of the particle (Fig. 2f). During the following rest period, this inhomogeneous Li-ion distribution quickly equilibrated within the particle, as indicated by the near-uniform differential intensity across the particle after only ∼10 min of relaxation. This rapid relaxation to near-uniform lithiation state within the aged particle suggests that the reason for the initially asymmetric Li-ion distribution is non-equilibrium and kinetic in nature, and not related to any bulk degradation affecting the ability of the material to become delithiated. Such a kinetically-controlled phenomenon points towards a non-uniform removal of Li-ions at the active surfaces of the particle, e.g., partial blocking of the particle surface, hindering Li-ion flux across these regions compared to the rest of the particle.To investigate the physical origin of the suggested partial surface blocking, we conducted high-resolution high-angle annular dark-field scanning transmission electron microscopy (HAADF-STEM) imaging to examine the surfaces of fresh and aged Ni-rich NMC particles (Fig. 3). It is widely accepted that Ni-rich NMC cathodes are prone to layered-to-rocksalt phase transformation at the particle surface.31,32 The formed rocksalt layers exhibit a much higher Li migration barrier than the layered phase,33–35 and thus may block facile Li-ion transport through the particle surface. For example, previous nudged elastic band (NEB) simulations have suggested a 150–200 meV lower Li hopping barrier in a layered phase than in a rocksalt phase, corresponding to an ∼3000 times larger diffusivity (estimated by [exp(200 meV kT−1)]).33
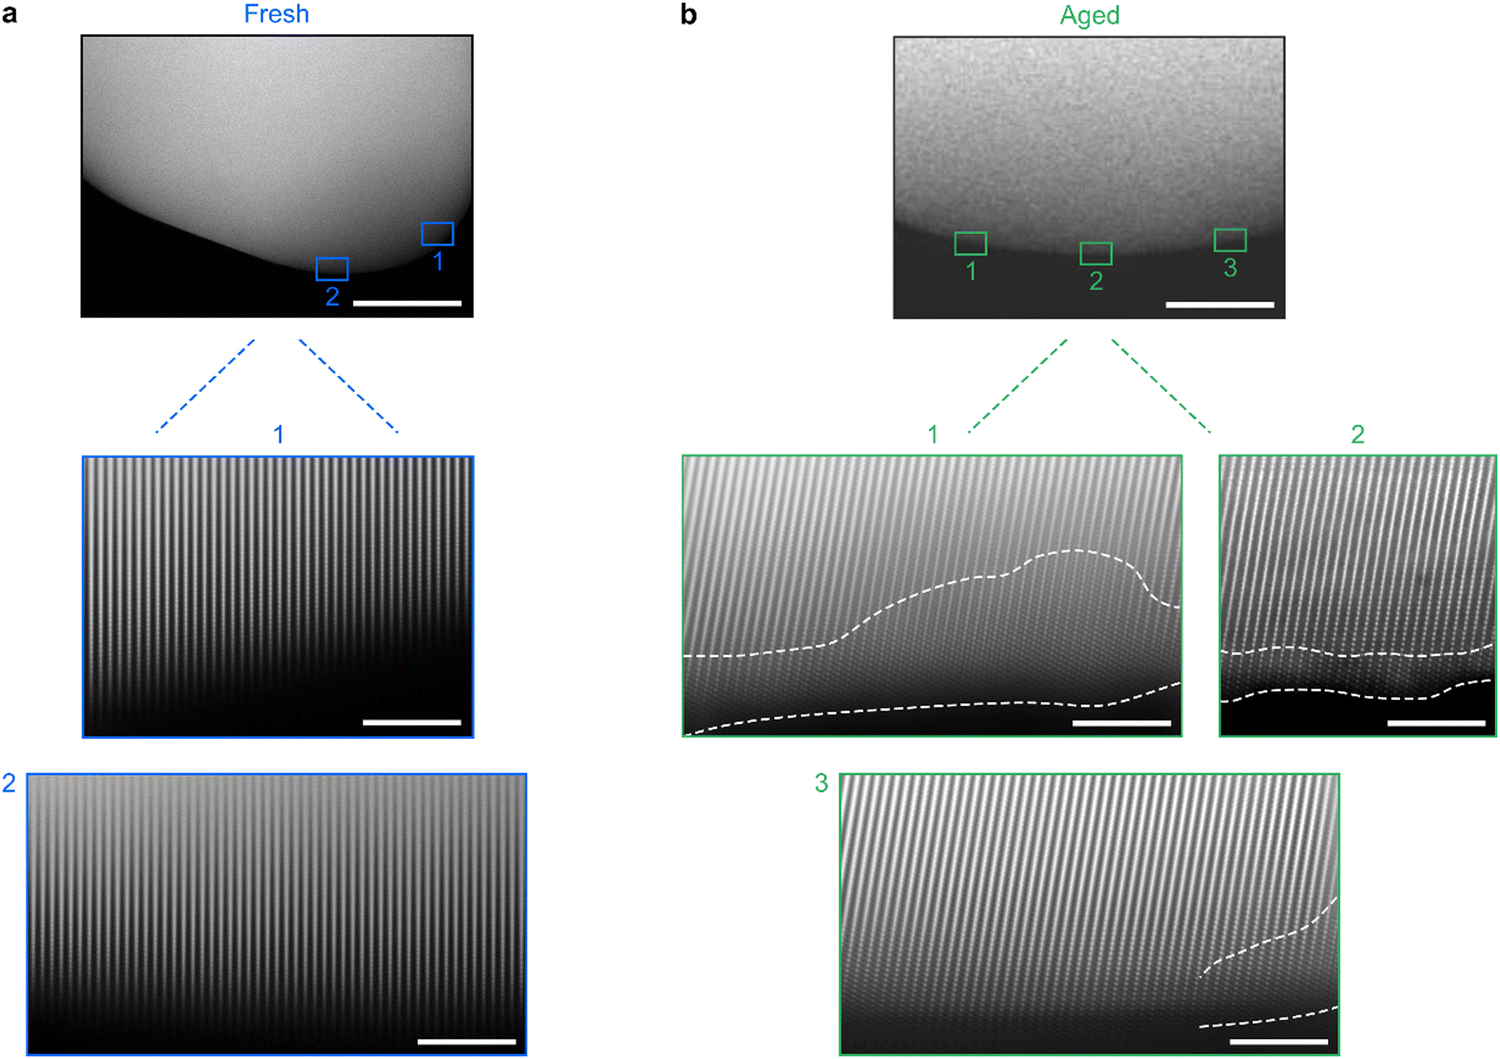 | ||
| Fig. 3 High-resolution STEM analyses of fresh and aged Ni-rich NMC. (a) STEM HAADF image (upper image, scale bar 50 nm) of a fresh particle and FFT-filtered high-resolution STEM HAADF images (lower images, scale bar 5 nm) acquired from two different surface regions (indicated by blue rectangles). All images were collected along the 〈100〉 zone axis and show open channels without any observable surface rocksalt layer. (b) Equivalent STEM HAADF and FFT-filtered STEM HAADF images of an aged particle (formed via the cycling protocol shown in Fig. 1e), collected along the 〈100〉 zone axis. Surface rocksalt layers are observed and outlined by white dashed lines. There is a large variation of the thickness of rocksalt layers. | ||
For a fresh Ni-rich particle shown in Fig. 3a, we mapped the surface structure at different regions around the edge of the particle, which show open layered channels without observable rocksalt layer formation. This suggests that there would be unimpeded Li-ion flux at all active surfaces of the particle, leading to the symmetric and centered “shrinking core”-like behavior during delithiation. In contrast, for an aged particle (Fig. 3b), we observe regions of rocksalt phase at the edges of the particle, as annotated by the white dashed lines. Importantly, we note that there is a large variation in the thickness of the rocksalt layer at different positions on the particle surface. Rather thick rocksalt layers (up to ∼4 nm thick) can be identified in region 1, whilst very thin (<1 nm) or no rocksalt phases are observed in regions 2 and 3. During cycling of such an aged particle, we would thus expect less impeded Li-ion transport and therefore a higher Li-ion flux at regions 2 and 3 compared to region 1. Such unevenly distributed Li-ion flux around the surface of a particle would be expected to contribute to the asymmetric and off-centered “shrinking core”-like behavior.
We then explored the hypothesis that partial surface blocking and heterogeneity in Li transport leads to asymmetric shrinking core behavior using finite element simulations with different levels of partial surface blocking. All the simulation details are described in the methodology section and the results are shown in Fig. 4a–d. A 2.4 μm-diameter cylindrical particle was used to represent a single crystal NMC particle. Four different surface blocking conditions were modelled, with different areal ratios between the blocked and unblocked regions, as well as different current flux across the blocked and unblocked areas. The blocked region is associated with the rocksalt layer (RSL) with its associated poorer lithium-ion transport; this is modeled via a smaller current flux jRSL; the unblocked region represents particle surface with very thin or no rocksalt layer that experience a higher current flux jNMC in the simulation. The ratio between jRSL and jNMC, η (i.e., η = jRSL/jNMC), is then defined to allow easy comparison. Four different conditions were chosen to illustrate the general effect of partial Li blocking at the surface: (i) no surface blocking, with a uniform surface flux of jNMC (Fig. 4a); (ii) one quarter of the particle surface is partially blocked, with η = 0.7, i.e., the current flux across the blocked region (jRSL) is 70% of that across the unblocked region (jNMC) (Fig. 4b); (iii) one quarter of the particle surface is blocked, with η = 0.3 (Fig. 4c); (iv) one half of the particle surface gets blocked, with η = 0.3 (Fig. 4d). Despite various degrees of asymmetry under each condition, the asymmetric “shrinking core”-like behavior can be well reproduced under all three of the partially-blocked conditions (Fig. 4b–d) as compared to the fully symmetric Li-ion flux without any surface blocking (Fig. 4a), supporting the physical rationality of the partial surface blocking model.
 | ||
| Fig. 4 Computational evidence for the asymmetric “shrinking core”-like behavior being a surface-dominated phenomenon. Simulated delithiation process in the ab-plane of a cylindrical particle with various surface blocking conditions at a charging rate of 100 mA g−1 (∼C/2). The blocked surfaces are highlighted with thicker red or blue outlines. (a) No surface blocking applied; (b) one quarter of the particle surface blocked, with η = 0.7; (c) one quarter of the particle surface blocked, with η = 0.3; (d) one half of the particle surface blocked, with η = 0.3. Li-ion distributions are displayed at four different time points (5 min, 10 min, 15 min and 20 min) under all three simulated delithiation scenarios. The particle is 2.4 μm (diameter) in size. | ||
Asymmetric Li-ion flux and rate capability degradation as a function of aging conditions
Our combined high-resolution STEM microscopy and optical scattering microscopy observations show that the thickness of the rocksalt phase is surprisingly inhomogeneous, giving rise to heterogenous Li-ion flux at the surface of the individual active particles, as evidenced by the asymmetric shrinking core behavior at the beginning of charge. We now further evaluate the impact of the uneven rocksalt layer growth and resulting asymmetric Li-ion flux on the overall electrochemical performance of aged NMC particles. Fig. 5a compares the capacities delivered at various rates before and after aging. We find that the capacity gap between fresh and aged electrodes significantly enlarges at high cycling rates, which suggests that the capacity degradation of Ni-rich NMC upon galvanostatic cycling is dominated by a rate degradation. | ||
| Fig. 5 Asymmetric Li flux and rate degradation in Ni-rich NMC cathodes. (a) A comparison of the rate capability between fresh and aged cathodes. The aged electrode was first prepared by cycling in a coin cell vs. Li between 3 and 4.3 V at a cycling rate of 50 mA g−1 for 200 cycles. The aged electrode was then removed, washed with DMC, and transferred into a new cell with fresh anode chips and electrolyte for the subsequent rate capability test. Two ‘formation cycles’ at a slow rate of 10 mA g−1 were conducted before the initiation of rate tests for both electrodes. A larger capacity difference can be observed at a higher rate, suggesting the capacity fade in aged Ni-rich NMC is dominated by the rate capability fade. (b) Computational evaluation of the impact of asymmetric Li flux on rate capability. The amount of Li that can be extracted from the particle before reaching a certain surface Li occupancy (θ = 0.2 in LiθTMO2) was calculated at rates of 50, 100, 200 and 400 mA g−1 with or without partial surface blocking. One quarter of the particle surface is blocked in the simulation with η = 0.7 or 0.3. (c) Analysis of the ‘shrinking core’ asymmetry at different cycling rates (50, 100, 200, 400 mA g−1) in the same aged NMC particle as shown in Fig. 2d and f. The differential intensity was evaluated for a line-cut across the particle (marked with a blue line in the inset image), as a function of capacity, for different cycling rates. The dashed lines are guides to the eye marking the approximate boundaries between ‘reacted’ (red) and ‘unreacted’ (white) regions. The asymmetry is clearly enhanced at a higher rate. (d) Quantification of the distance (d in the inset) between the COM of the whole particle (marked by OCOM in the inset) and the COM of the ‘unreacted’ region of the particle (marked by OLi-rich in the inset), for different cycling rates. The ‘unreacted’ region of the particle is defined as the region with differential optical intensity <0.05. (e) Statistics of particles with or without asymmetric ‘shrinking-core’ behavior from optical measurements under various aging conditions: fresh, 3–4.3 V at 50 mA g−1, 3–4.3 V at 200 mA g−1, 3–4.3 V at 400 mA g−1 and 3–4.5 V at 200 mA g−1. Only particles with an observable basal plane (perpendicular to the illumination direction) are counted. Blue and green bars (left y axis) show the number of particles with symmetric and asymmetric shrinking core behavior, respectively. Black diamonds (right y axis) show the fraction of particles with asymmetric shrinking core behavior among all particles counted. Scale bar 1 μm. | ||
Contributions to the rate degradation of the cathodes can also be partially captured by our simulations using partial surface blocking to model asymmetric Li-ion flux. These simulations were used to calculate the total amount of Li that had been extracted when the surface of the particle reached a fixed Li chemical potential cut-off, at various cycling rates, with and without partial surface blocking. We kept the same model of a right-circular cylindrical particle (2.4 μm diameter) with one quarter of the surface blocked, considering η values of 0.3 and 0.7 (where η = jRSL/jNMC). The charge process was set to terminate when the Li-occupancy on any region of the particle surface reached 0.2, approximating a fixed upper cut-off voltage during a galvanostatic cycling, when the particle surface exhibits the same Li chemical potential (μLi). The amount of Li extracted during the whole charge process was then determined for each cycling rate, both with and without partial surface blocking, as shown in Fig. 5b. It can be clearly seen that more Li is extracted from the particle when the Li surface flux is more uniformly distributed, and that this effect is enlarged at higher rates. A more significant partial surface blocking (i.e. a significantly smaller η) may further enlarge the gap. These simulations indicate that an asymmetric distribution of Li flux at the surface of the aged particles represents one contributing factor to the rate capability loss observed experimentally in the aged materials. We note that the rate capability seen experimentally (Fig. 5a) is worse than that shown by our simulations (Fig. 5b), in part because the values of η may significantly vary (as discussed in the previous section) but also because other factors also contribute to the rate degradation; these include the effect of the steady growth in interfacial impedance growth8,36 on the ability to extract all the Li+ for fixed upper cut-off voltages.
To further investigate the potential correlation between asymmetric Li-ion flux and rate degradation, we first compared the degree of asymmetry at various cycling rates using optical scattering microscopy. An aged electrode was cycled at current densities of 50, 100, 200 and 400 mA g−1 and the asymmetry was then evaluated at each current by examining the optical intensity evolution for a line-cut across a selected particle (Fig. 5c). A horizontal orientation was selected for the line-cut through the particle (see image inset, Fig. 5c) since the asymmetry is most prevalent in the horizontal direction for this specific particle (as shown in Fig. 2d and f). In this line-cut, 0 nm and 2368 nm correspond to the edges of the particle, as marked on the inset of Fig. 5c. For each current density, the plots in Fig. 5c show the evolution of the differential intensity along the line-cut, for early delithiation. In each plot, the x-axis represents the spatial line-cut across the particle, the y-axis represents the total current that has been passed through the cell (“capacity”), and the color-scale represents the changing differential intensity (equivalent to the color-scale used in Fig. 2b, d and f). The dashed black lines are guides to the eye to qualitatively indicate the boundaries between the Li-poor (‘reacted’, red) and Li-rich (‘unreacted’, white) regions within the line-cut. The last part of the “shrinking core” (i.e., the time and location along the line-cut at which the last part of the Li-rich region starts to become delithiated) is highlighted by the blue circles. As the cycling rate was increased, the Li-heterogeneity extended into higher cell-level SOCs (with the unreacted Li-rich region persisting until the cell reached a capacity of ∼15 mA h g−1 for the lowest applied current, but ∼30 mA h g−1 for the highest applied current). It can also be seen that the degree of spatial asymmetry increased with increasing cycling rate, with the final part of the “shrinking core” (blue circle) moving closer to the left-edge of the particle.
A more quantitative analysis of the degree of spatial asymmetry in the delithiation was carried out by determining the distances between the center of mass (COM) of the whole particle (OCOM) and the COM of the ‘unreacted’ Li-rich region of the particle (OLi-rich, estimated by considering only the regions of the particle with a differential intensity smaller than 0.05), as marked by d in the inset of Fig. 5d. As plotted in Fig. 5d, the distance between OCOM and OLi-rich reaches larger values for higher applied currents, indicating an increasingly asymmetric delithiation at faster cycling rates. We note that the slope and curvature of the d evolution curves shown in Fig. 5d may vary significantly for different particles, depending on the degree of rocksalt heterogeneity and the shape of the particle, as demonstrated by the equivalent data for another particle shown in Fig. S4 (ESI†). However, a similar trend of increasing delithiation asymmetry with increasing current densities is still observed.
Lastly, we expand our discussion on aging conditions to compare the delithiation heterogeneity in particles aged under various conditions using optical scattering microscopy. Another three aging conditions were applied to prepare aged particles: 3–4.3 V at 200 mA g−1, 3–4.3 V at 400 mA g−1, 3–4.5 V at 200 mA g−1; all in half cells for 200 aging cycles with LP30 as electrolyte. The cycling stability under these cycling conditions is presented in Fig. S5 (ESI†). We examined similar particles with basal planes perpendicular to the direction of illumination in each case (Fig. S7, ESI†). Fig. 5e summarizes the total number of particles displaying symmetric (blue bars) vs. asymmetric (green bars) “shrinking core”-like behavior at the beginning of charge. Black diamonds plot the fraction of particles displaying the asymmetric “shrinking core”-like behavior, which is indicative of asymmetric Li-ion flux. The material aged under the conditions of 3–4.3 V at 50 mA g−1 and 3–4.5 V at 200 mA g−1 present the largest degree of reaction asymmetry (71 and 73% of all the particles under investigation, respectively), which also show the worst rate capability (Fig. S6, ESI†). This indicates that deeper delithiation, accomplished either through a slow cycling rate or a higher upper cutoff voltage plays a key role in the generation of the observed reaction asymmetry within the particles. These results provide further evidence that the asymmetric delithiation is a surface dominated phenomenon. We note that this is in line with previous research showing that deep delithiation may trigger oxygen release from the particle surface, producing a rocksalt phase at the surface.37–40 Our study now shows that such rocksalt layers can be remarkably inhomogeneous across the surface of the individual particles, contributing to capacity and rate capability degradation.
Outlook: promoting uniform delithiation
In this work, we applied an operando optical scattering microscopy method to track the Li-ion dynamics in individual single-crystals of Ni-rich NMC cathode materials. We identified the build-up of pronounced Li-ion concentration gradients at the beginning of charge, progressing in a “shrinking core”-like fashion. Notably, aged particles exhibit a strongly spatially-asymmetric Li-ion concentration gradient (relative to the particle's center of mass), as compared to freshly prepared NMC particles. This behavior is attributed to an asymmetric Li-ion flux at the particle surface due to the formation of an uneven surface rocksalt layer formed during aging, as revealed by high resolution TEM HAADF imaging. Charge-rest experiments and finite element simulations support that this uneven surface blocking results in asymmetric delithiation within the particles and contributes to the rate degradation of the cathode upon aging. We would like to note that it is already well-accepted that rocksalt layer growth generally causes sluggish Li-ion transport kinetics, impedance increases, and significant capacity fading. Our observations here suggest a new and additional mechanism that builds upon the surface rocksalt formation theory, pointing out that the growth of rocksalt layer can be remarkably asymmetric, which further exacerbates the loss of capacity and rate capability, as computationally evaluated in Fig. 5b. This non-uniformity requires additional attention during the optimization of Ni-rich NMC cathodes. We note that the structural causes of this delithiation homogeneity may be closely linked, for example the extent and uniformity of Li/Ni exchange and cation distributions may be strongly coupled to local lithium mobility so that in practice, many of these structural parameters need to be considered together, since they may result from interconnected structure characteristics.While further studies are needed to understand the cause of the uneven rocksalt layer growth, we hypothesize that it may in part be a result of a non-uniform distribution of TM ions within the NMC lattice. It is reported that the energetic difference between a disordered rocksalt phase and a layered or spinel phase in a Ni-rich composition is much smaller than that in a Ni-poor and Mn/Co rich composition,41 suggesting that a Ni-rich composition is more prone to rocksalt formation. Uneven precursor mixing or coprecipitation during the synthesis may result in a heterogeneous TM distribution in the final product of NMC cathodes,42 eventually leading to the non-uniform rocksalt layer growth that harms the capacity and especially the rate capability. Heterogeneity in Li-distribution within the storage particles may also cause stress-driven fracture of active particles leading to capacity loss of the battery.43
Coating has been proposed to be an effective way of mitigating interfacial side reactions, preventing oxygen loss and thus rocksalt layer formation.44–47 Our findings highlight the importance of the uniformity of a coating layer. Uneven coatings may offer heterogeneous protection of the particle surface from side reactions and oxygen loss, allowing the non-uniform rocksalt layer growth and asymmetric Li-ion flux that contribute to rate capability degradation. It is thus of significance to optimize the synthesis or coating techniques for a robust and uniform surface, in order to achieve high stability Ni-rich NMC cathode materials. Our optical scattering technique could be a valuable tool-of-choice to investigate the impact of coating layers on the uniformity of Li-ion flux throughout the surface of Ni-rich NMC, which represents an important future research direction. Finally, other factors may also be important to the development of heterogenous surface flux. For example, in practical electrodes, local variations in electrode porosity or uneven electrical contact between active particles and conductive reagents may also contribute to asymmetric Li-ion flux, due to the different tortuous pathways taken by the lithium ions and electrons through the composite electrode. As no prominent Li-ion flux asymmetry was observed in fresh particles, the origin of the asymmetry is highly to be aging-induced, suggesting that among all other possible causes, an uneven rocksalt growth at the particle surface is the most likely, since it is well-known to build up as a result of aging and it directly modifies the local Li-ion diffusivity. Whilst we hypothesize that the uneven rocksalt may be a result of a non-uniform distribution of TM ions, we also note that some facets may delithiate preferentially;48 computational studies also suggest some facets are more prone to oxygen loss,49,50 which could lead to non-uniform rocksalt layer formation. Our work motivates studies to explore how the morphology of single crystal particles affects these phenomena and whether facet engineering or an appropriate choice of electrolyte and electrolyte additives may help to mitigate the difference in reactivity of different crystal facets, ultimately promoting a more uniform delithiation behavior.
Author contributions
Z. L. and C. P. G. conceived the idea and planned the work with A. J. M., A. R. and C. S.; Z. L. performed the operando optical microscopy experiments with the help from A. J. M., C. X. and C. S.; Z. L. analyzed the optical microscopy data with support from A. J. M., C. X. and C. S.; Z. L. performed electrochemical measurements, synchrotron PXRD and analyzed the data; Z. L. and A. J. M. performed the SEM measurements; A. M. and S. F. performed the TEM measurements and analyzed the data with input from C. D.; S. S. P. performed the finite element simulations under guidance of N. A. F. and V. S. D.; The manuscript was drafted by Z. L., A. J. M., C. S. and C. P. G. and was revised by all the authors; All authors contributed to discussions.Data availability
The data for this study are available from corresponding authors upon reasonable request.Conflicts of interest
A. J. M., C. S., A. R., and C. P. G. are founders of Illumion, Ltd.Acknowledgements
The authors are grateful to Umicore for providing the NMC material used in this work and to Dr Jérémie Auvergniot for helpful discussions. This work was supported by the Faraday Institution Degradation Project (grant numbers FIRG001 and FIRG024) to C. P. G., A. R., N. A. F., and C. D., and the Engineering and Physical Sciences Research Council. A. J. M. acknowledges financial support from the EPSRC Cambridge NanoDTC (EP/L015978/1) and from Newnham College. C. S. acknowledges financial support from the Royal Commission of the Exhibition of 1851. A. R. acknowledges financial support from the EPSRC and the Winton Program for the Physics of Sustainability. This research used resources of the Beamline i11 at Diamond Light Source.References
- S. S. Zhang, Energy Storage Mater., 2020, 24, 247–254 CrossRef.
- F. Friedrich, B. Strehle, A. T. S. Freiberg, K. Kleiner, S. J. Day, C. Erk, M. Piana and H. A. Gasteiger, J. Electrochem. Soc., 2019, 166, A3760–A3774 CrossRef CAS.
- P. Teichert, G. G. Eshetu, H. Jahnke and E. Figgemeier, Batteries, 2020, 6, 8 CrossRef CAS.
- H. Li, A. Liu, N. Zhang, Y. Wang, S. Yin, H. Wu and J. R. Dahn, Chem. Mater., 2019, 31, 7574–7583 CrossRef CAS.
- A. S. Menon, N. Shah, J. A. Gott, E. Fiamegkou, M. J. W. Ogley, G. J. Páez Fajardo, N. Vaenas, I. Ellis, N. Ravichandran, P. Cloetens, D. Karpov, J. M. Warnett, P. Malliband, D. Walker, G. West, M. Loveridge and L. F. J. Piper, PRX Energy, 2024, 3, 013004 Search PubMed.
- G. J. Páez Fajardo, E. Fiamegkou, J. A. Gott, H. Wang, I. Temprano, I. D. Seymour, M. J. W. Ogley, A. S. Menon, I. E. L. Stephens, M. Ans, T.-L. Lee, P. K. Thakur, W. M. Dose, M. F. L. De Volder, C. P. Grey and L. F. J. Piper, ACS Energy Lett., 2023, 8, 5025–5031 Search PubMed.
- G. J. Páez Fajardo, M. Belekoukia, S. Bolloju, E. Fiamegkou, A. S. Menon, Z. Ruff, Z. Shen, N. Shah, E. Björklund, M. J. Zuba, T.-L. Lee, P. K. Thakur, R. S. Weatherup, A. Aguadero, M. J. Loveridge, C. P. Grey and L. F. J. Piper, RSC Appl. Interfaces, 2024, 1, 133–146 RSC.
- W. M. Dose, I. Temprano, J. P. Allen, E. Björklund, C. A. O’Keefe, W. Li, B. L. Mehdi, R. S. Weatherup, M. F. L. De Volder and C. P. Grey, ACS Appl. Mater. Interfaces, 2022, 14, 13206–13222 CrossRef CAS PubMed.
- J. A. Gilbert, J. Bareño, T. Spila, S. E. Trask, D. J. Miller, B. J. Polzin, A. N. Jansen and D. P. Abraham, J. Electrochem. Soc., 2016, 164, A6054–A6065 CrossRef.
- S. Solchenbach, G. Hong, A. T. S. Freiberg, R. Jung and H. A. Gasteiger, J. Electrochem. Soc., 2018, 165, A3304–A3312 CrossRef CAS.
- L. Wang, A. Menakath, F. Han, Y. Wang, P. Y. Zavalij, K. J. Gaskell, O. Borodin, D. Iuga, S. P. Brown, C. Wang, K. Xu and B. W. Eichhorn, Nat. Chem., 2019, 11, 789–796 CrossRef CAS PubMed.
- S. Sallis, N. Pereira, P. Mukherjee, N. F. Quackenbush, N. Faenza, C. Schlueter, T. L. Lee, W. L. Yang, F. Cosandey, G. G. Amatucci and L. F. J. Piper, Appl. Phys. Lett., 2016, 108, 263902 CrossRef.
- W. Zhao, J. Zheng, L. Zou, H. Jia, B. Liu, H. Wang, M. H. Engelhard, C. Wang, W. Xu, Y. Yang and J.-G. Zhang, Adv. Energy Mater., 2018, 8, 1800297 CrossRef.
- J. K. Morzy, W. M. Dose, P. E. Vullum, M. C. Lai, A. Mahadevegowda, M. F. L. De Volder and C. Ducati, ACS Appl. Energy Mater., 2024, 7, 3945–3956 CrossRef CAS PubMed.
- C. Xu, K. Marker, J. Lee, A. Mahadevegowda, P. J. Reeves, S. J. Day, M. F. Groh, S. P. Emge, C. Ducati, B. Layla Mehdi, C. C. Tang and C. P. Grey, Nat. Mater., 2021, 20, 84–92 CrossRef CAS PubMed.
- D.-H. Cho, C.-H. Jo, W. Cho, Y.-J. Kim, H. Yashiro, Y.-K. Sun and S.-T. Myung, J. Electrochem. Soc., 2014, 161, A920 CrossRef CAS.
- A. Chen, K. Wang, J. Li, Q. Mao, Z. Xiao, D. Zhu, G. Wang, P. Liao, J. He and Y. You, Front. Energy Res., 2020, 8, 593009 CrossRef.
- J. A. Gilbert, I. A. Shkrob and D. P. Abraham, J. Electrochem. Soc., 2017, 164, A389 CrossRef CAS.
- J. Wandt, A. Freiberg, R. Thomas, Y. Gorlin, A. Siebel, R. Jung, H. A. Gasteiger and M. Tromp, J. Mater. Chem. A, 2016, 4, 18300–18305 RSC.
- H. Y. Asl and A. Manthiram, Science, 2020, 369, 140–141 CrossRef CAS PubMed.
- H. Liu, F. C. Strobridge, O. J. Borkiewicz, K. M. Wiaderek, K. W. Chapman, P. J. Chupas and C. P. Grey, Science, 2014, 344, 1252817 CrossRef PubMed.
- J. Park, H. Zhao, S. D. Kang, K. Lim, C.-C. Chen, Y.-S. Yu, R. D. Braatz, D. A. Shapiro, J. Hong and M. F. Toney, Nat. Mater., 2021, 20, 991–999 CrossRef CAS PubMed.
- W. E. Gent, K. Lim, Y. Liang, Q. Li, T. Barnes, S.-J. Ahn, K. H. Stone, M. McIntire, J. Hong and J. H. Song, Nat. Commun., 2017, 8, 2091 CrossRef PubMed.
- F. Zhang, S. Lou, S. Li, Z. Yu, Q. Liu, A. Dai, C. Cao, M. F. Toney, M. Ge and X. Xiao, Nat. Commun., 2020, 11, 3050 CrossRef CAS PubMed.
- L. Li, B. Ouyang, Z. Lun, H. Huo, D. Chen, Y. Yue, C. Ophus, W. Tong, G. Chen and G. Ceder, Nat. Commun., 2023, 14, 7448 CrossRef PubMed.
- L. Li, Z. Lun, D. Chen, Y. Yue, W. Tong, G. Chen, G. Ceder and C. Wang, Adv. Funct. Mater., 2021, 31, 2101888 CrossRef CAS.
- W. Zhang, D.-H. Seo, T. Chen, L. Wu, M. Topsakal, Y. Zhu, D. Lu, G. Ceder and F. Wang, Science, 2020, 367, 1030–1034 CrossRef CAS PubMed.
- A. J. Merryweather, C. Schnedermann, Q. Jacquet, C. P. Grey and A. Rao, Nature, 2021, 594, 522–528 CrossRef CAS PubMed.
- A. J. Merryweather, Q. Jacquet, S. P. Emge, C. Schnedermann, A. Rao and C. P. Grey, Nat. Mater., 2022, 21, 1306–1313 CrossRef CAS PubMed.
- C. Xu, A. J. Merryweather, S. S. Pandurangi, Z. Lun, D. S. Hall, V. S. Deshpande, N. A. Fleck, C. Schnedermann, A. Rao and C. P. Grey, Joule, 2022, 6, 2535–2546 CrossRef CAS.
- T. Liu, L. Yu, J. Lu, T. Zhou, X. Huang, Z. Cai, A. Dai, J. Gim, Y. Ren and X. Xiao, Nat. Commun., 2021, 12, 6024 CrossRef CAS PubMed.
- W. Xue, M. Huang, Y. Li, Y. G. Zhu, R. Gao, X. Xiao, W. Zhang, S. Li, G. Xu and Y. Yu, Nat. Energy, 2021, 6, 495–505 CrossRef CAS.
- J. Lee, A. Urban, X. Li, D. Su, G. Hautier and G. Ceder, Science, 2014, 343, 519–522 CrossRef CAS PubMed.
- Y. Fan, W. Zhang, Y. Zhao, Z. Guo and Q. Cai, Energy Storage Mater., 2021, 40, 51–71 CrossRef.
- R. Clément, Z. Lun and G. Ceder, Energy Environ. Sci., 2020, 13, 345–373 RSC.
- W. M. Dose, J. K. Morzy, A. Mahadevegowda, C. Ducati, C. P. Grey and M. F. L. De Volder, J. Mater. Chem. A, 2021, 9, 23582–23596 RSC.
- S. K. Jung, H. Gwon, J. Hong, K. Y. Park, D. H. Seo, H. Kim, J. Hyun, W. Yang and K. Kang, Adv. Energy Mater., 2014, 4, 1300787 Search PubMed.
- M. Zhang, D. A. Kitchaev, Z. Lebens-Higgins, J. Vinckeviciute, M. Zuba, P. J. Reeves, C. P. Grey, M. S. Whittingham, L. F. Piper and A. Van der Ven, Nat. Rev. Mater., 2022, 7, 522–540 Search PubMed.
- H. Zhang, B. M. May, F. Omenya, M. S. Whittingham, J. Cabana and G. Zhou, Chem. Mater., 2019, 31, 7790–7798 CrossRef CAS.
- S. Lee, L. Su, A. Mesnier, Z. Cui and A. Manthiram, Joule, 2023, 7, 2430–2444 CrossRef CAS.
- D.-H. Kwon, J. Lee, N. Artrith, H. Kim, L. Wu, Z. Lun, Y. Tian, Y. Zhu and G. Ceder, Cell Rep. Phys. Sci., 2020, 1, 100187 CrossRef.
- J. Cui, X. Ding, D. Luo, H. Xie, Z. Zhang, B. Zhang, F. Tan, C. Liu and Z. Lin, Energy Fuels, 2021, 35, 1842–1850 CrossRef CAS.
- S. S. Pandurangi, D. S. Hall, C. P. Grey, V. S. Deshpande and N. A. Fleck, J. Electrochem. Soc., 2023, 170, 050531 CrossRef CAS.
- M. Yoon, Y. Dong, J. Hwang, J. Sung, H. Cha, K. Ahn, Y. Huang, S. J. Kang, J. Li and J. Cho, Nat. Energy, 2021, 6, 362–371 CrossRef CAS.
- S. Kalluri, M. Yoon, M. Jo, H. K. Liu, S. X. Dou, J. Cho and Z. Guo, Adv. Mater., 2017, 29, 1605807 CrossRef PubMed.
- C. Li, H. Zhang, L. Fu, H. Liu, Y. Wu, E. Rahm, R. Holze and H. Wu, Electrochim. Acta, 2006, 51, 3872–3883 CrossRef CAS.
- M. Aykol, S. Kim, V. I. Hegde, D. Snydacker, Z. Lu, S. Hao, S. Kirklin, D. Morgan and C. Wolverton, Nat. Commun., 2016, 7, 13779 CrossRef CAS PubMed.
- F. Li, Z. Liu, J. Shen, X. Xu, L. Zeng, B. Zhang, H. Zhu, Q. Liu, J. Liu and M. Zhu, J. Mater. Chem. A, 2021, 9, 2830–2839 RSC.
- X. Li, Q. Wang, H. Guo, N. Artrith and A. Urban, ACS Appl. Energy Mater., 2022, 5, 5730–5741 CrossRef CAS.
- J. Burns and K. A. Persson, Chem. Mater., 2023, 35, 9127–9134 CrossRef CAS PubMed.
Footnotes |
| † Electronic supplementary information (ESI) available. See DOI: https://doi.org/10.1039/d5ee00267b |
| ‡ These authors contributed equally to this work. |
| This journal is © The Royal Society of Chemistry 2025 |