
 Open Access Article
 This Open Access Article is licensed under a
 Creative Commons Attribution 3.0 Unported Licence
Quantitative insights for diagnosing performance bottlenecks in lithium–sulfur batteries†
Saurabh Paraba,
Jonathan Leeb,
Matthew Miyagishima b,
Qiushi Miaob,
Bhargav Bhamwalab,
Alex Liub,
Louis Ahb,
Bhagath Sreenarayananb,
Kun Ryuc,
Mingqian Lic,
Neal Arakawad,
Robert Schmidte,
Mei Caie,
Fang Daie,
Ping Liuab,
Shen Wang*b and
Ying Shirley Meng*bc
b,
Qiushi Miaob,
Bhargav Bhamwalab,
Alex Liub,
Louis Ahb,
Bhagath Sreenarayananb,
Kun Ryuc,
Mingqian Lic,
Neal Arakawad,
Robert Schmidte,
Mei Caie,
Fang Daie,
Ping Liuab,
Shen Wang*b and
Ying Shirley Meng*bc
aMaterials Science and Engineering Program, University of California San Diego, La Jolla, CA, USA
bAiiso Yufeng Li Family Department of Chemical and Nano Engineering, University of California San Diego, La Jolla, CA, USA. E-mail: shw117@ucsd.edu
cPritzker School of Molecular Engineering, University of Chicago, Chicago, IL, USA. E-mail: shirleymeng@uchicago.edu
dEnvironmental and Complex Analysis Laboratory, University of California San Diego, La Jolla, CA, USA
eGeneral Motors Research and Development Center, Warren, MI, USA
First published on 23rd May 2025
Abstract
Lithium–sulfur (Li–S) batteries hold significant promise for electric vehicles and aviation due to their high energy density and cost-effectiveness. However, understanding the root causes of performance degradation remains a formidable challenge, as the interplay of multiple factors obscures key failure mechanisms. A major limitation has been the inability to quantify soluble sulfur species within practical detection limits accurately and to correlate electrochemical processes with associated physical inventory changes. Here, we introduce the high-performance liquid chromatography-ultraviolet spectroscopy and gas chromatography sequential characterization (HUGS) toolkit, capable of precisely quantifying seven distinct sulfur and polysulfide species at concentrations as low as 40 ppb. HUGS has been successfully applied to practical coin and pouch cells without requiring cell modification. Furthermore, our self-developed software, Dr HUGS, enhanced the data analysis speed by over 30 times, enabling multi-source data integration and delivering comprehensive analysis results within minutes. Using HUGS, we identify significant capacity losses from inactive lithium and sulfur during initial cycles and sulfide-rich solid–electrolyte interphase (SEI) formation on the anode during later cycles. Notably, our findings reveal that soluble polysulfides have minimal contributions to capacity loss, challenging long-standing assumptions. Moreover, HUGS demonstrates that constant-pressure setups in Li–S pouch cells improve compositional uniformity compared to constant-gap configurations. For sulfurized polyacrylonitrile (SPAN) cathodes, unique issues such as non-sulfide SEI formation and lithium pulverization are observed, which can be mitigated through localized high-concentration electrolytes to enhance lithium inventory retention. By enabling precise quantification of critical inventory components, HUGS provides transformative insights into failure mechanisms across various electrolytes and cathode chemistries, guiding rational design strategies for next-generation energy storage systems.
Broader contextThe development of lithium–sulfur (Li–S) batteries is pivotal for meeting the growing energy demands of transportation and grid storage due to their high theoretical energy density and reliance on abundant sulfur resources. However, their practical deployment is hindered by complex degradation pathways, including polysulfide shuttling, sulfur and lithium inventory loss, and solid–electrolyte interphase (SEI) growth, which significantly limits cycle life. This study introduces the high-performance liquid chromatography-ultraviolet spectroscopy and gas chromatography sequential characterization (HUGS) toolkit, providing a breakthrough in diagnosing these challenges by enabling quantitative analysis of sulfur and lithium species across diverse cell formats, from coin cells to pouch cells. By revealing distinct degradation mechanisms—such as inactive lithium formation, sulfide SEI buildup, and lithium pulverization—HUGS addresses long-standing limitations of conventional diagnostic techniques. Moreover, it demonstrates the impact of cell configurations, electrolyte compositions, and cathode chemistries on performance. This work exemplifies how advanced analytical chemistry can guide the rational design of next-generation Li–S batteries, facilitating their adoption in clean energy technologies. The insights gained extend beyond Li–S systems, offering methodologies that can influence broader energy storage and sustainable materials design research. |
Introduction
Lithium–sulfur (Li–S) batteries excel in energy storage due to their impressive theoretical specific capacity of 1675 mA h g−1 and over 500 W h kg−1 energy density.1–5 These attributes make them ideal for aviation, electric vehicles, and marine technologies. Sulfur as a cathode material has distinct advantages over traditional transition metal-based systems. Its abundance and ability to undergo multi-electron redox reactions significantly boost energy storage potential. Moreover, sulfur is widely accessible and often sourced as a byproduct of petrochemical processes. This technology reduces reliance on limited resources. With their unique electrochemical properties and sustainable material base, Li–S batteries represent a groundbreaking approach to the future of energy storage.6–8Despite their potential, Li–S batteries face numerous challenges, such as low sulfur conductivity, the polysulfide shuttle effect,9 inefficient polysulfide conversion, inactive lithium formation,10 and lithium metal pulverization.11 These conditions result in lithium or sulfur inventory loss, leading to poor cycling stability.12 Researchers have applied various strategies to treat these issues, such as nanostructured sulfur composites,13–15 localized high-concentration electrolytes (LHCE), protective anode coatings, and optimized electrode designs.16 However, with many factors influencing performance and an array of potential remedies, pinpointing the most critical failure mechanism for each specific Li–S battery system is essential to enable targeted and effective solutions.17,18
The key to understanding capacity fade in Li–S battery systems lies in accurately quantifying the inventories of Li and S and determining how and where specific chemical species store capacity after cycling. Precise analysis of the spatial distribution and relative concentrations of sulfur, lithium, and lithium polysulfides allows researchers to identify the dominant components and assess their contributions to capacity loss. This knowledge is fundamental to diagnosing and addressing capacity degradation in lithium–sulfur batteries. However, achieving this level of precision presents considerable challenges. Vacuum-based characterization techniques, such as X-ray photoelectron spectroscopy (XPS), scanning electron microscopy (SEM), and scanning transmission electron microscopy (STEM), often lead to sulfur sublimation, compromising the reliability of the measurements.19 Spectroscopic methods, including ultraviolet-visible spectroscopy (UV-Vis),20–24 Raman spectroscopy,15,25–30 and nuclear magnetic resonance spectroscopy (NMR),31–34 struggle to distinguish between polysulfides due to their similar functional groups and overlapping spectral features. Furthermore, the dynamic chemical equilibria among polysulfides complicate isolation efforts, as disproportionation or comproportionation reactions can alter their concentrations during separation. These limitations highlight the pressing need for advanced diagnostic techniques to unravel the mechanisms of capacity fade and pave the way for developing more robust and stable lithium–sulfur batteries.
A promising method for (semi-)quantifying sulfur or polysulfides is chemical modification combined with high-performance liquid chromatography (HPLC),31,35–39 which offers improved detection limits and feasibility for testing in more realistic battery systems. This approach stabilizes polysulfides by converting their reactive sulfur sites into chemically stable derivatives, such as methyl or methylbenzene compounds, effectively quenching their equilibrium transitions. Methyl trifluoromethanesulfonate (MeOTf) is particularly efficient, exhibiting reaction kinetics that is 104 times faster than common methylation agents, enabling the effective stabilization of polysulfides.40 Following derivatization, HPLC separates these sulfur species by retention time, and ultraviolet detection is used to estimate their relative concentrations. However, in previous attempts to quantify lithium–sulfur batteries using HPLC-based methods, conventional chromatographic columns have struggled with insufficient resolution, making it challenging to separate long-chain sulfur species effectively, thereby impacting the quantification of these components.37,39 Additionally, toluene-based derivatization methods, which rely on slower reaction kinetics, often cause shifts in the equilibrium of lithium polysulfides during the quenching process, leading to incomplete stabilization.
Furthermore, the lack of standard reference materials in most studies has prevented absolute quantification of sulfur species, limiting the analysis to semi-quantitative measurements based on peak area changes. This inability to precisely quantify sulfur content hampers efforts to correlate these changes with battery capacity. Finally, many studies modify the battery setup, using flow cells instead of standard coin or pouch cells for sampling, significantly restricting the applicability of these methods to practical battery systems.
In this work, we developed a sequential characterization method combining high-performance liquid chromatography with ultraviolet detection (HPLC-UV) and titration gas chromatography (TGC), referred to as HUGS, to diagnose failure mechanisms in lithium–sulfur (Li–S) batteries with high precision. This method accurately quantifies nine distinct sulfur and polysulfide species at concentrations as low as 40 ppb. HUGS has been successfully applied to practical coin and pouch cells without requiring cell modifications. By integrating analytical chemical data with battery cycling performance, HUGS provides critical insights into the underlying causes of degradation. Additionally, the process is streamlined using Dr HUGS©, a custom software solution designed to efficiently handle multiple raw data files, completing complex analyses in just minutes.
We investigated the sulfur distribution mechanisms in Li–S batteries across different systems and configurations using the HUGS method. In the carbon-stabilized sulfur (CS) system, where sulfur is physically adsorbed, we observed that the dominant factors contributing to capacity fade evolved with cycling. Initially, self-discharge played a major role, gradually transitioning to inactive lithium formation and, eventually, to the accumulation of Li2S on the anode. HUGS further revealed how sulfur species distribution in CS-based pouch cells is influenced by different testing configurations, highlighting the importance of setup parameters on the behavior of physically adsorbed sulfur. In contrast, the sulfurized polyacrylonitrile (SPAN) system, where sulfur is covalently bonded, exhibited distinct degradation mechanisms. During the early cycling stages, SPAN cathodes demonstrated the ability to recover dissolved polysulfides and sulfur species from the electrolyte, suggesting that sulfur immobilization in SPAN is not exclusively governed by covalent bonding, as traditionally assumed. As cycling progressed, the capacity fade was primarily attributed to lithium inventory loss at the anode. Importantly, replacing conventional ether-based electrolytes with localized high-concentration electrolytes (LHCE) significantly reduced lithium inventory loss, offering a promising strategy to enhance the stability of SPAN systems and improve long-term cycling performance.
This study demonstrates HUGS's unparalleled capability to analyze the depth and breadth of sulfur-related degradation in Li–S batteries. By enabling precise quantification of sulfur species across different sulfur chemical compositions, cell configurations, and testing conditions, HUGS provides a comprehensive platform for diagnosing failure mechanisms. This versatility paves the way for targeted solutions that address various challenges, accelerating the development of next-generation Li–S batteries with improved performance and stability.
Results and discussion
HUGS methodology and results interpretation
This study uses the HUGS method to investigate sulfur and lithium inventory losses in Li–S batteries, as shown in Fig. 1a. The method involves analyzing three samples from disassembled Li–S coin cells. Sample A, derived from the Li anode, is washed and titrated with ethanol to measure Li0 content. Sample B is prepared by soaking the remaining cell components in a methylation solution to quantify soluble polysulfides (Li2Sx, 3 ≤ x ≤ 8) and dissolved elemental sulfur (S(L)). Sample C extracts residual sulfur (S(S)) from the cathode using DME. | ||
| Fig. 1 HUGS method sample preparation and results interpretation. (a) Schematic of HUGS; (b) information output based on HUGS; (c) three capacity loss mechanism scenarios in Li–S battery derived from HUGS; (d) 3D scatter plot comparing bulk characterization methods based on the quantification of polysulfide species, their detection limits, and the system in which the method was tested. | ||
The HUGS method quantifies capacity retention and loss by analyzing these samples with GC and HPLC-UV. The HUGS method is validated, as detailed in the Methods, ESI,† under the ‘HUGS method validation’ session, Fig. S1–S4 and Tables S1–S3 (ESI†). GC measures Li0 in sample A, while HPLC-UV quantifies Li2Sx, S(L), and S(S) in samples B and C, respectively, to assess theoretical retained and lost capacities (Table S4, ESI†). Fig. S5 (ESI†) shows the HUGS capacity retention pie plot, which reflects the cathode's sulfur-trapping ability. Fig. 1b illustrates lithium inventory evolution using GC (sample A), while HPLC-UV (samples B and C) determines the contributions of different sulfur species. Capacity losses are further categorized using three vectors (Fig. 1c): α represents loss due to Li2Sx (3 ≤ x ≤ 8); β accounts for losses from sulfide SEI, including Li2S and Li2S2; and γ measures lithium inventory changes, reflecting discrepancies between charge capacity and Li mass changes.
These vectors describe three capacity loss scenarios: (1) γ > 0, where inactive Li or S results from SEI formation or particle isolation; (2) γ ≈ 0, dominated by sulfide SEI formation, where Li and S are fully consumed without contributing to capacity; and (3) γ < 0, indicating excessive Li loss due to non-sulfide SEI formation or Li pulverization. The final panel in Fig. 1c highlights how these vectors identify the dominant degradation mechanisms, providing insights for improving Li–S battery performance.
Fig. 1a and the ESI,† demonstrate that our method employs a semi-preparative chromatographic column to separate relevant components efficiently. The increased loading capacity enhances both the detection limits and sensitivity for sample analysis. Additionally, the sequential preparation of samples enables the quantitative analysis of both dissolved and solid sulfur species. By correlating these sulfur species with lithium quantification, we can directly link their contributions to battery capacity.
A key advantage of this method is its universality, as it requires no modifications to the battery, making it applicable to various Li–S battery testing systems. As shown in Fig. 1d, by comparing over 50 studies on Li–S battery characterization, the HUGS method is demonstrated to work across different formats, including coin and pouch cells. It achieves detection limits of 40 ppb for polysulfides (Me2Sx, 3 ≤ x ≤ 8) and sulfur and 10 ppb for lithium metal—orders of magnitude better than other available tools. The datasets used for comparing HUGS with other reported methods are provided in Table S5 (ESI†).
Given the complexity of HUGS, which integrates multiple analytical techniques and diverse data sources, Dr HUGS©, an automated software platform, was developed to enhance the efficiency and accuracy of data analysis. The reliability of the software was rigorously validated through comparison with conventional manual processing, as illustrated in Fig. S6 (ESI†). Dr HUGS© automates the correlation of results with the three diagnostic scenarios described in Fig. 1c, significantly expediting the identification of performance constraints in lithium–sulfur batteries. The supporting video titled “Dr HUGS© Demo” demonstrates the automated diagnostic workflow, with additional technical details outlined in the ESI,† under the “Dr HUGS© Software” section.
Quantifying factors affecting Li–S battery cycle life with CS cathodes in coin cells
The first case study examines the ‘classic’ Li–S coin cells comprising a CS cathode, a ‘baseline electrolyte’ (1 M lithium bis(trifluoromethane)sulfonimide (LiTFSI) in 1,3-dioxolane (DOL)![[thin space (1/6-em)]](https://www.rsc.org/images/entities/char_2009.gif) :DME (1:1 v/v) + 2 wt% LiNO3,), and lithium metal.6 The electrolyte to sulfur (E/S) ratio is 10 μL mg−1. Cycling behavior is divided into five regions (Fig. 2a): initial 24 hours rest (0), two formation cycles (IA), fast capacity decay (IB), stable cycles (II), and end-of-life (III). Increasing overpotential and capacity loss in charge–discharge curves (Fig. S7, ESI†) indicate growing resistance with cycling.
:DME (1:1 v/v) + 2 wt% LiNO3,), and lithium metal.6 The electrolyte to sulfur (E/S) ratio is 10 μL mg−1. Cycling behavior is divided into five regions (Fig. 2a): initial 24 hours rest (0), two formation cycles (IA), fast capacity decay (IB), stable cycles (II), and end-of-life (III). Increasing overpotential and capacity loss in charge–discharge curves (Fig. S7, ESI†) indicate growing resistance with cycling.
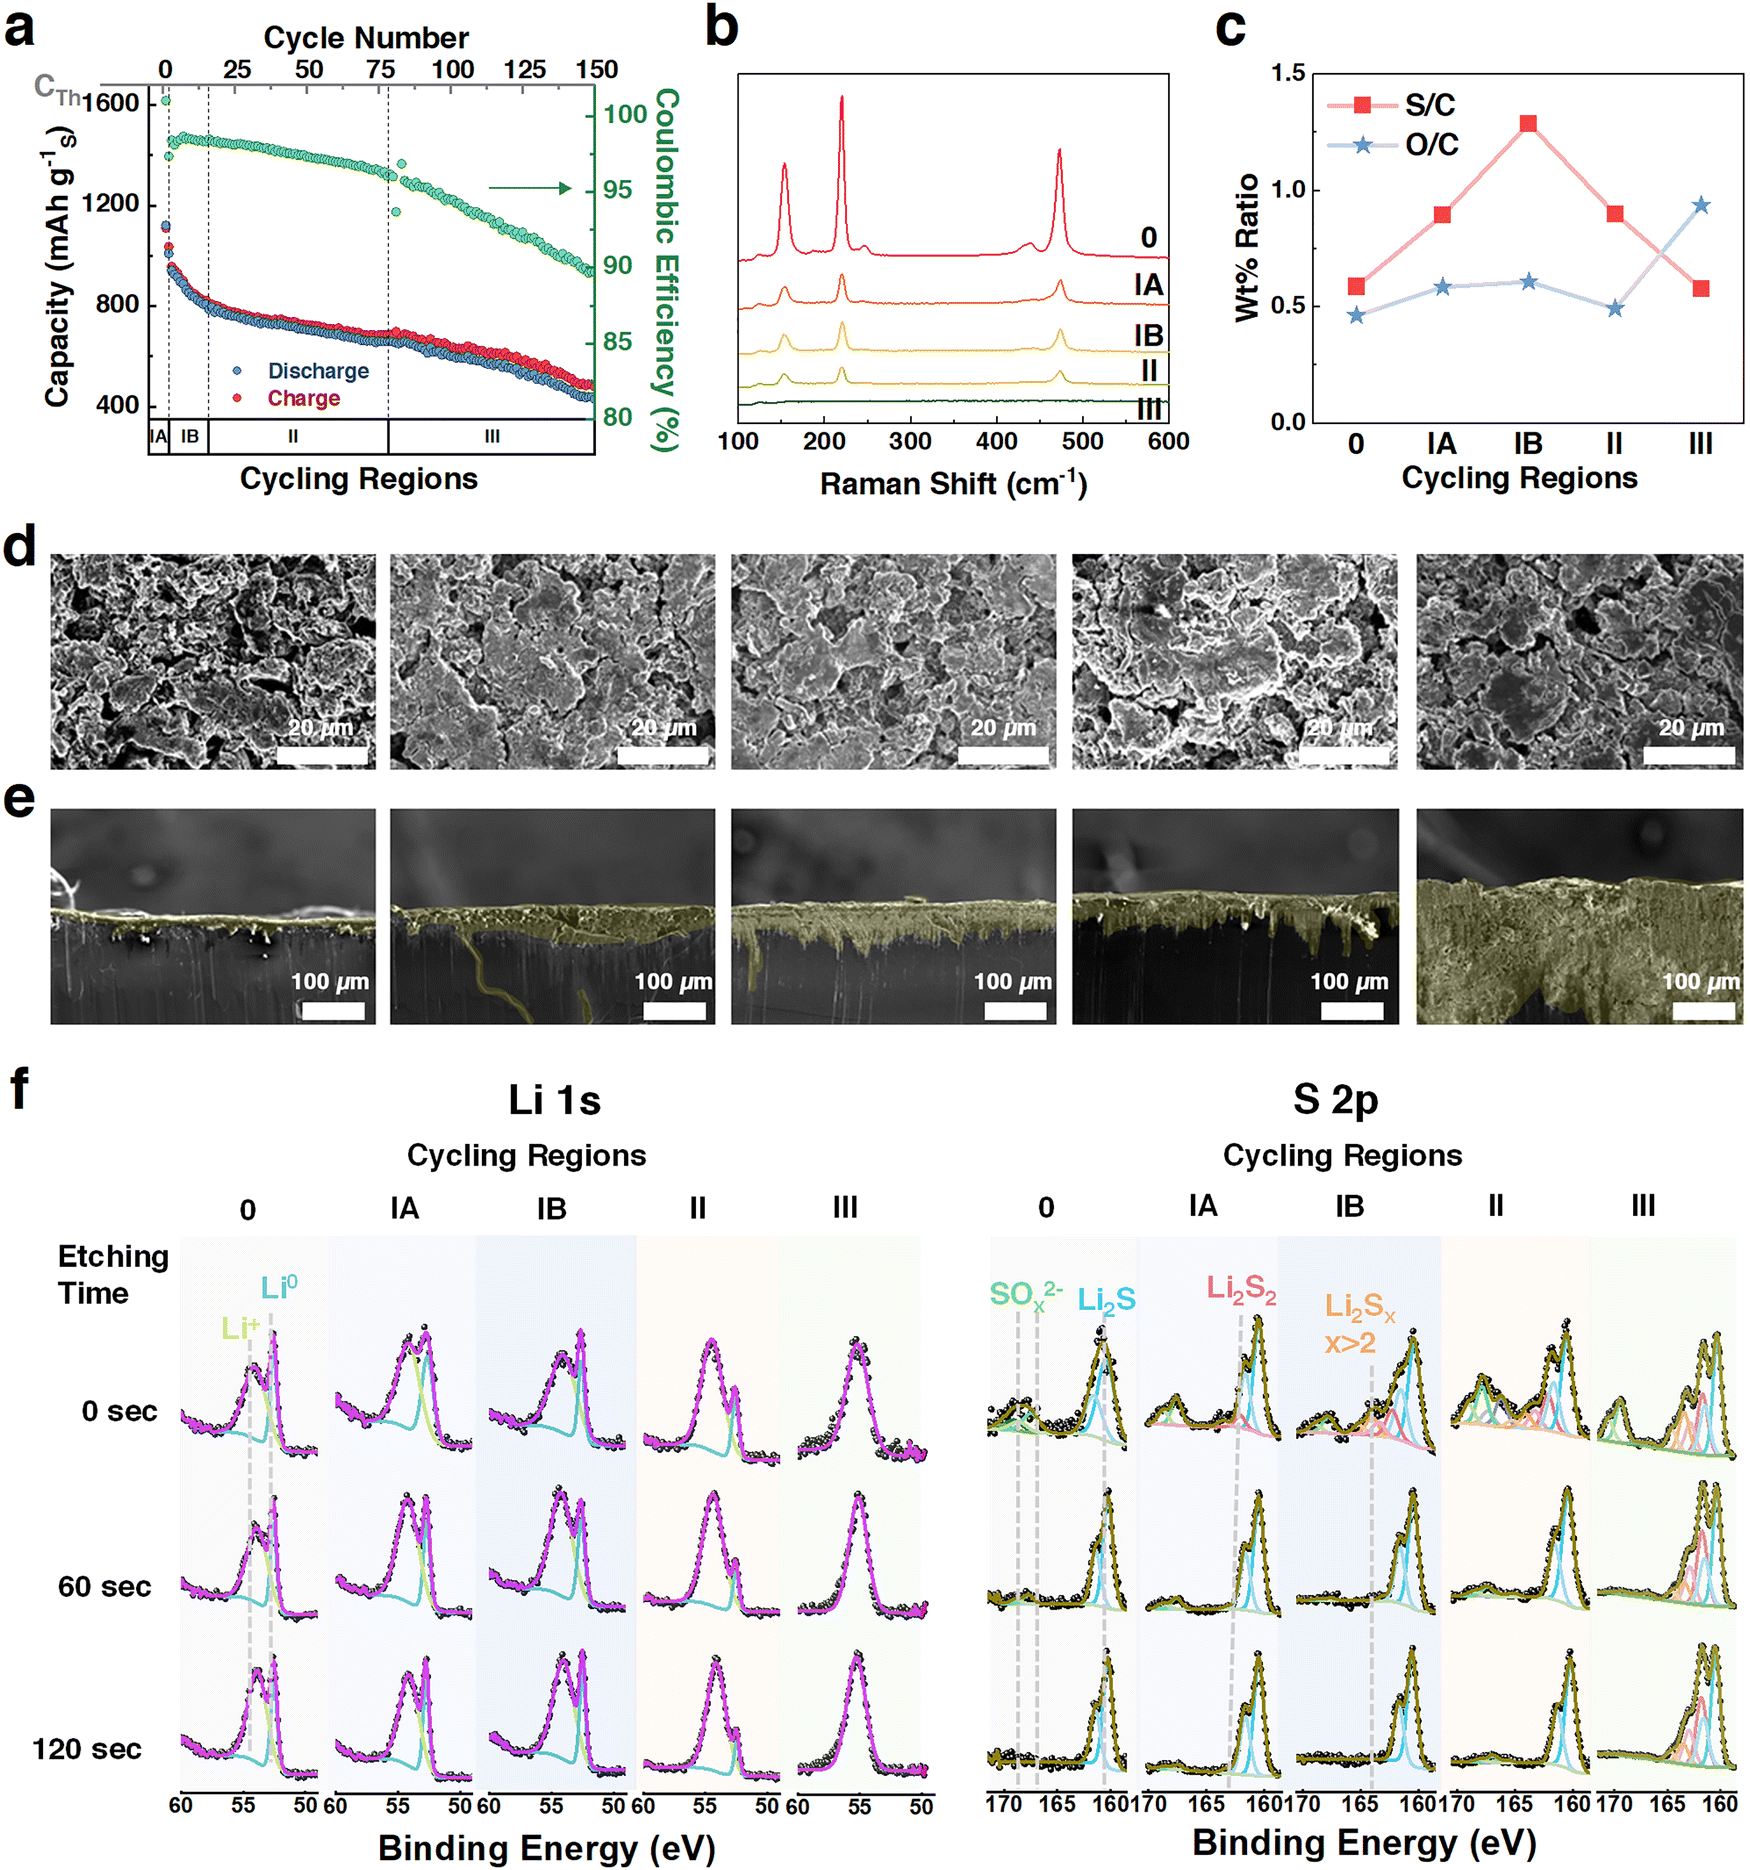 | ||
| Fig. 2 Li–S battery cycling and characterizations with CS cathodes in different cycling regions of a coin cell. (a) Defining cycling regions in CS battery (sulfur loading: 3.6 mg cm−2 with 10 wt% carboxymethyl cellulose (CMC) and Super-P (10 wt%), electrolyte: 1 M lithium bis(trifluoromethane)sulfonimide (LiTFSI) in 1,3-dioxolane (DOL):DME (1:1 v/v) + 2 wt% LiNO3, E/S = 10 μL mg−1, anode Li: 250 μm, cycling protocol: 24 hours resting, two cycles at 0.05C, then 0.1C); (b) Raman spectra of cathodes; (c) S/C, O/C weight ratios, obtained from cryo-SEM-EDX of cathodes; (d) top view cryo-SEM EDX images of cathodes; (e) cross-sectional SEM images of anodes; (f) depth profiling Li 1s and S 2p XPS spectra of anodes at different etching times (0, 60, and 120 seconds). | ||
Ex situ characterizations at the fully charged state (Fig. 2b–f and Fig. S8, S9, ESI†) provide qualitative insights. Raman spectroscopy of the cathode (Fig. 2b) shows declining S–S bond intensities, particularly from region 0 to IA, suggesting much of the adsorbed sulfur remains inactive early in cycling. Cryo-SEM-EDX mapping (Fig. 2c) reveals changes in the S:C and O:C ratios, indicating sulfur redistribution and the formation of an oxygen-rich cathode interface. These changes highlight the growth of cathode–electrolyte interface (CEI) layers and the shuttle effect, as soluble polysulfides react to form inactive species like Li2S and Li2SOx.
On the anode, SEM and XPS analyses (Fig. 2e and f) show the progression of SEI. Cross-sectional SEM images reveal moderate SEI growth from Region 0 to II, followed by a sharp increase in thickness in Region III, attributed to LiNO3 depletion (Fig. S10, ESI†).41–43 XPS spectra confirm the presence of Li2S and other sulfides in the SEI, which isolate Li0 and hinder reactivity. Li2SOx species, formed via LiNO3-mediated reactions, are observed on the surface before milling and decrease after etching, consistent with previous studies suggesting that the higher lithium gradient in the anode bulk drives the final conversion of all sulfides into Li2S.12,41
Overall, these results demonstrate sulfur species depletion on the cathode and significant SEI thickening on the anode due to LiNO3 consumption. However, qualitative characterizations leave key capacity loss mechanisms unresolved, underscoring the need for quantitative analysis via the HUGS method.
HUGS analysis was conducted on these batteries to diagnose the dominant capacity failure factors (Fig. 3a). For these cells, samples B and C results revealed the capacities retained in sulfur and polysulfides across each cycling region (Fig. 3a and Fig. S11, ESI†). Initially, a 24-hour rested battery showed a capacity loss of over 200 mA h g−1 due to self-discharge and sulfur dissolution from the cathode. This is because of DME's high solubility to polysulfides and elemental sulfur.44 Despite some solid-state S(S) increase in later cycles, soluble sulfur and sulfide species were predominantly retained, with almost no S(S) remaining in Region III due to LiNO3 depletion.41–43,45 Thus, the CS Li–S battery operates as a liquid sulfur-redox-dominated system.
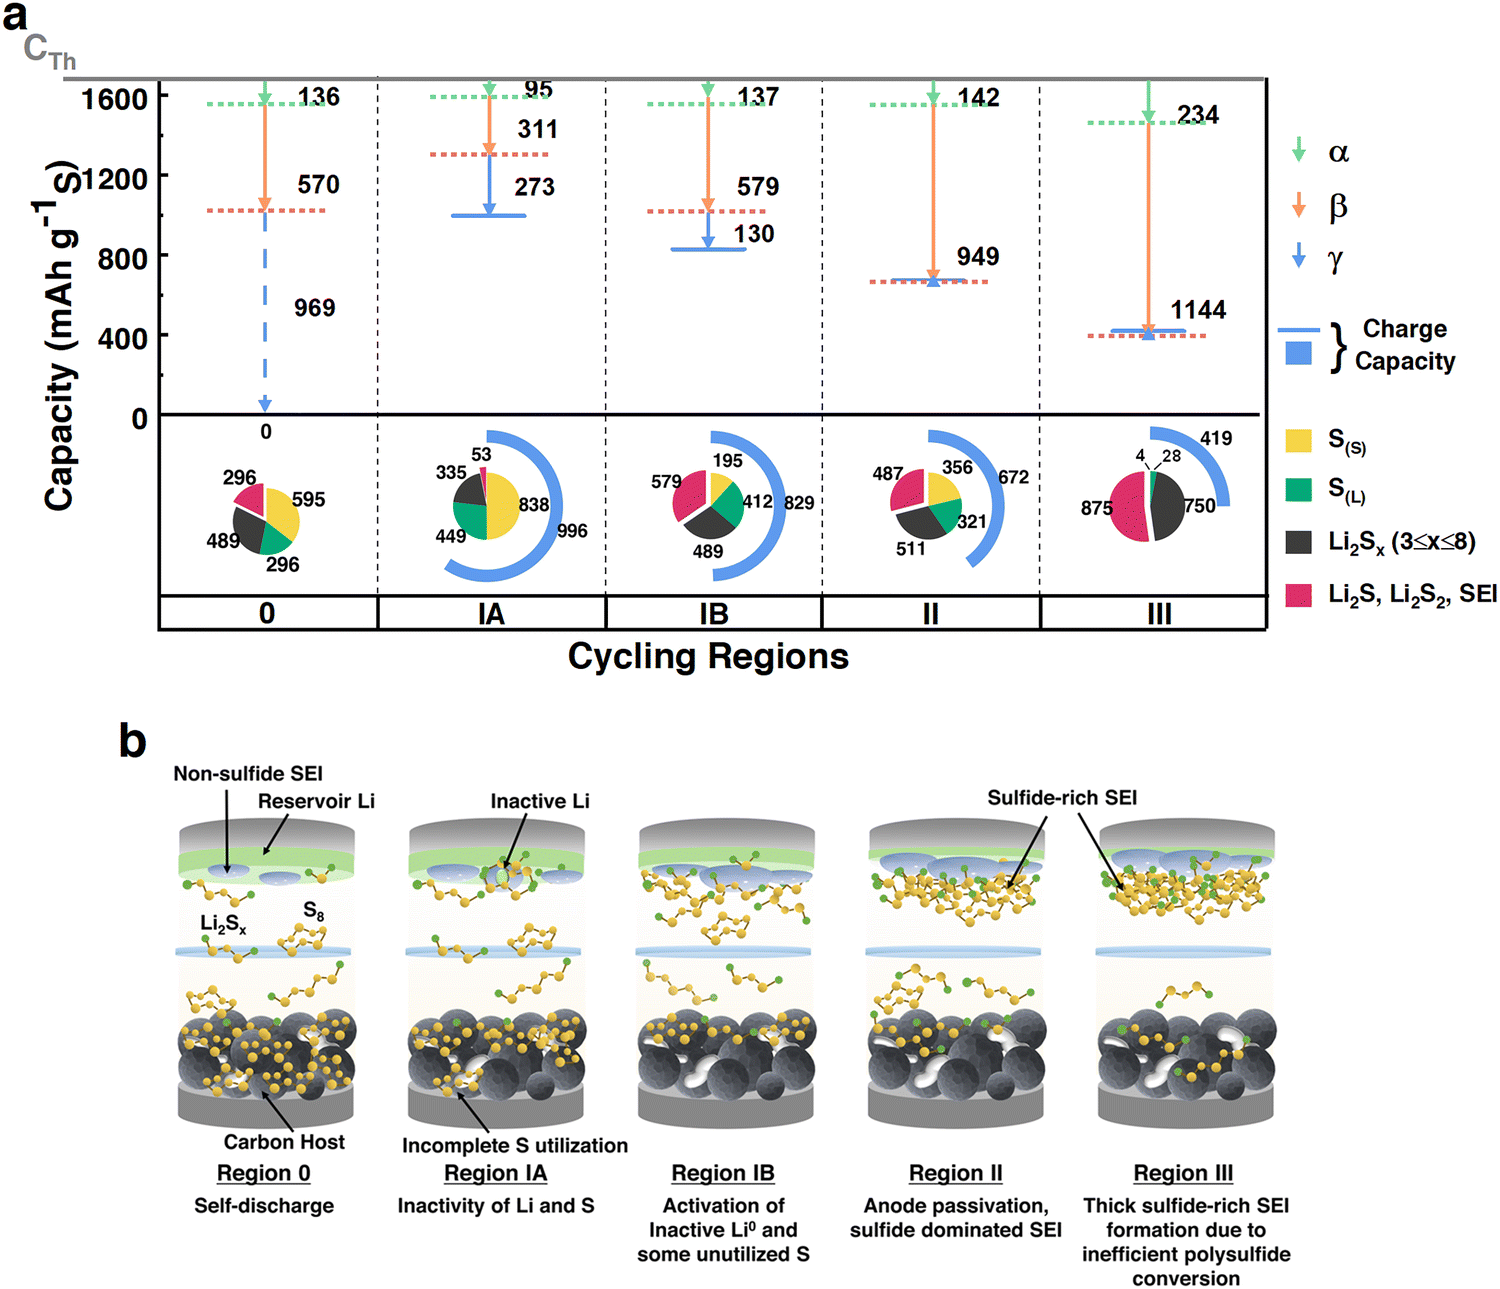 | ||
| Fig. 3 Proposed cycling behavior of Li–S batteries with CS cathodes in different cycling regions of a coin cell. (a) HUGS capacity loss vector plots and capacity retention pie charts for each cycling region; (b) proposed mechanism of cycling behavior with CS cathodes and baseline electrolyte. | ||
The HUGS capacity loss vector plot (Fig. 3a) showed that in Regions IA and IB, the behavior aligns with Case I in Fig. 1c, while Regions 2 and 3 correspond to Case II mainly. This indicates that inactive lithium formation and inefficient sulfur and polysulfide conversion primarily impact early cycles in a liquid sulfur-redox system. This inefficiency of sulfur conversion is even reflected as an idle or unutilized Li0, in 1st discharge HUGS in Fig. S12 (ESI†). A decreasing γ vector and increasing β vector from Region 1A to 1B suggest ‘reactivation’ of inactive (dead or idle) lithium and sulfur, possibly converting into polysulfides, consistent with previous study.10 In contrast, anode passivation due to sulfide-rich SEI formation/growth dominates the stable cycling in Region II. Due to the LiNO3 depletion at Region III, thick sulfides SEI growth (Fig. 2e and f) terminates the battery cycling. However, the capacity loss due to soluble polysulfides (α) remains considerably lower across the cycling. More cases are shown in ESI,† under ‘special cases in CS batteries’ and ‘HATN Cathode’ sessions and Fig. S13 and S14 (ESI†).
Overall, in the liquid sulfur redox-dominated coin cell system, the primary factors contributing to capacity fade vary across different cycling stages. Before cycling begins, self-discharge is the dominant factor affecting performance (Region 0). During the initial cycling phase, inactive lithium formation emerges as the primary contributor to capacity loss (Region I). As cycling progresses, the increasing dissolution of polysulfides into the electrolyte leads to the formation of a sulfide-rich passivating solid–electrolyte interphase (SEI) on the anode, which becomes the most significant factor driving capacity degradation in later stages (Regions II and III). These observations are summarized in Fig. 3b.
Quantifying spatial inventory distribution in Li–S single layer pouch cells with CS cathodes under different setup configurations
In addition to coin cells, HUGS was applied to CS pouch cells to quantitatively analyze the lateral distribution of lithium, sulfur, and sulfides, as shown in Fig. 4. Single-layer pouch cells were assembled using a CS cathode with similar areal loading and baseline electrolyte as previously discussed, with a cathode dimension of 3 × 3 cm2 (Fig. 4a). Compared to coin cells, the larger area of pouch cells leads to more complex pressure and electric field distributions, significantly affecting the compositional homogeneity during cycling.46 We selected three positions (A, B, and C) along the diagonal from the cathode's current collector tab to investigate the compositional homogeneity, as shown in Fig. 4a. Samples for HUGS analysis were taken from both the cathode and anode at these positions. Electrolyte samples were directly extracted from the pouch cells for analysis. Further details regarding the pouch cell setup can be found in the ESI,† under the ‘CS pouch cells’ session.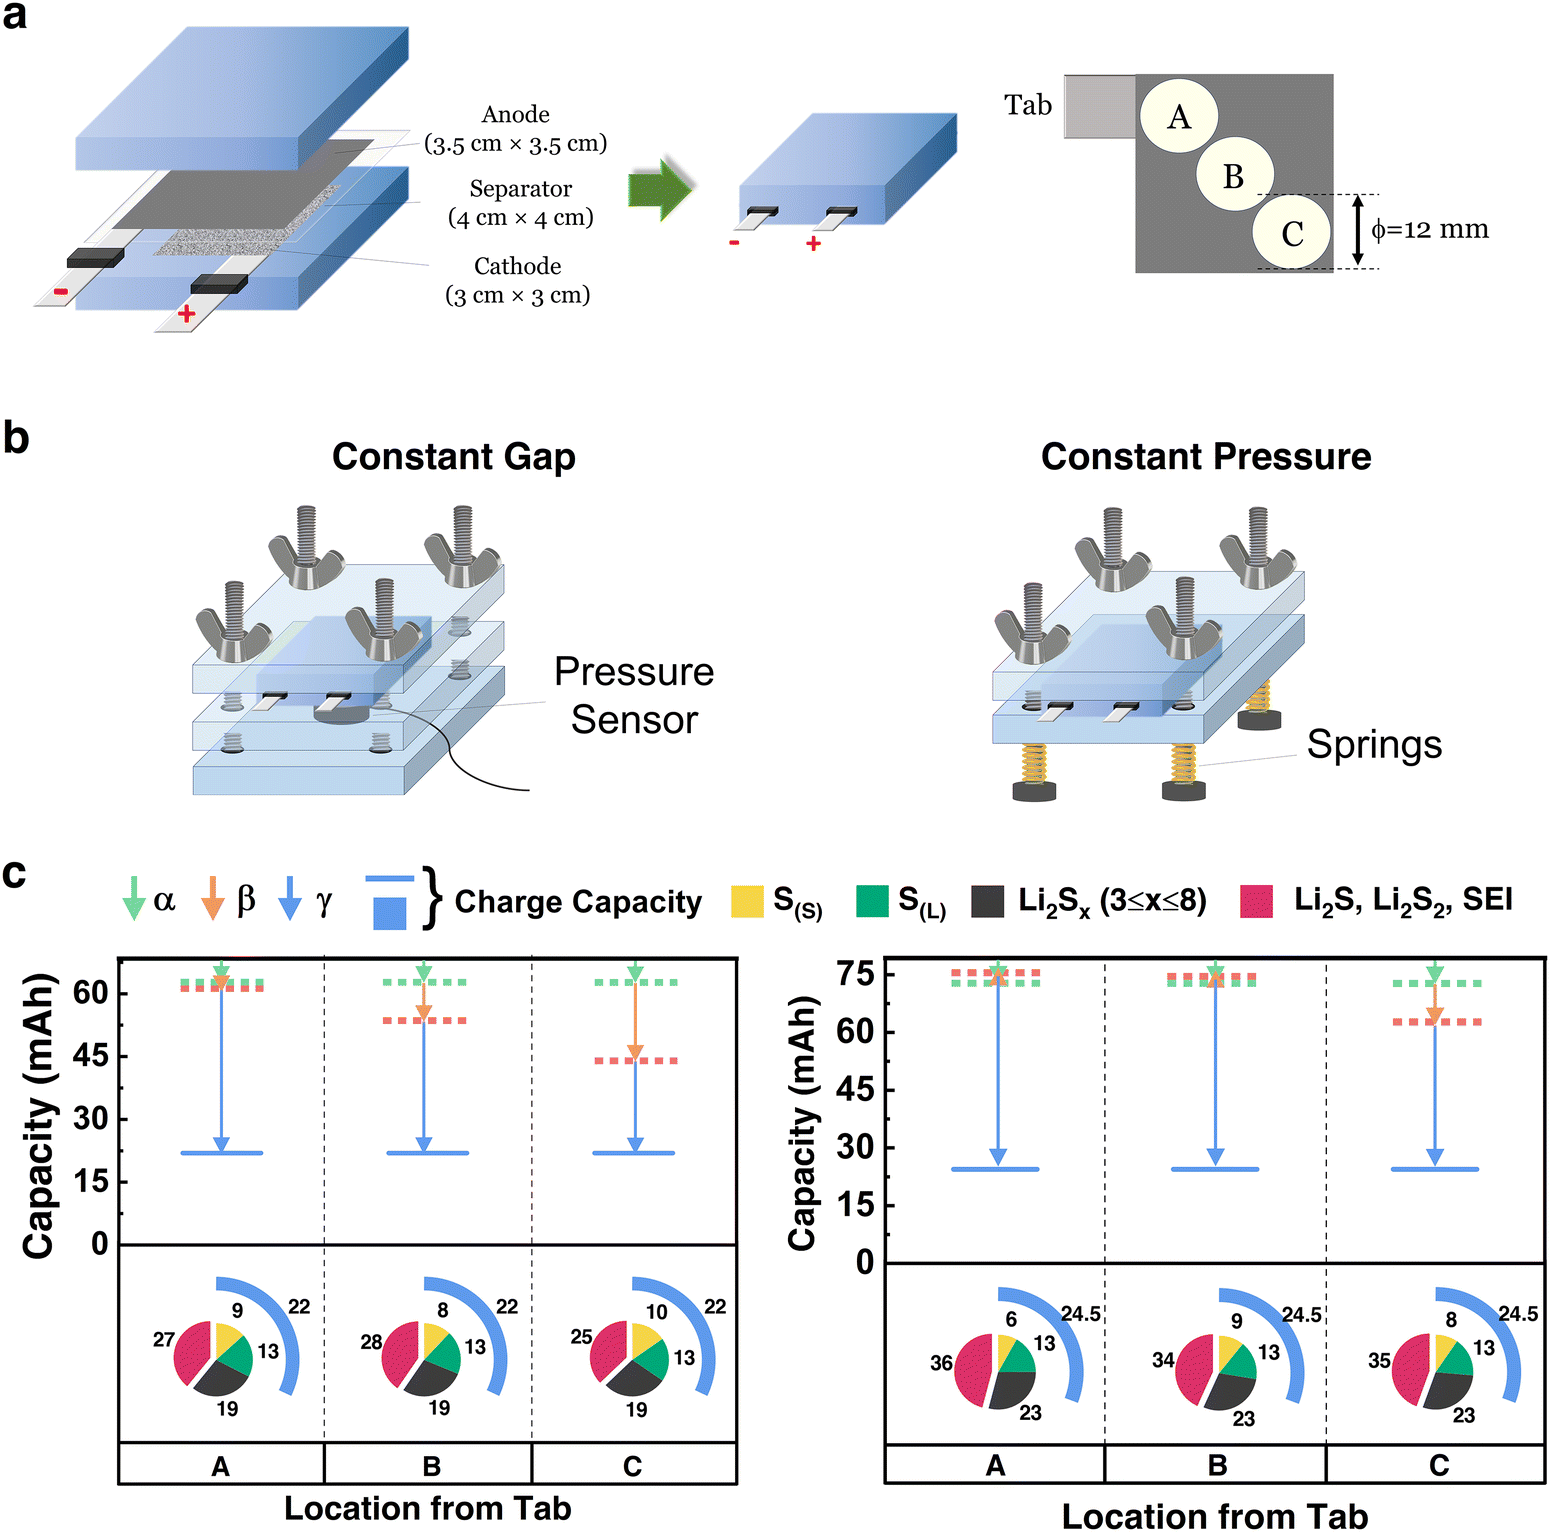 | ||
| Fig. 4 HUGS analysis of Li–S pouch cells with different testing configurations. (a) Dimensions of pouch cell components and regions (position A, B, and C.) selected for HUGS analysis; (b) schematics of testing configurations for the pouch cells: fixed gap (initial pressure 30 psi) and fixed pressure (30 psi); (c) HUGS capacity loss vector plots and capacity retention pie charts for a pouch cell under fixed pressure (left) and fixed gap (right) conditions at positions A, B, and C. | ||
Fig. 4b presents two testing configurations for the pouch cells: constant gap and constant pressure setups. In both configurations, an initial pressure of 30 psi was applied. The results of the HUGS analysis are shown in Fig. 4c, with the corresponding discharge–charge curves, cycling performance, and sulfur quantification analysis provided in Fig. S15 and S16 (ESI†).
From Fig. 4c, sulfur quantification across positions A, B, and C shows minimal variation for both testing configurations. This behavior may be attributed to the nature of the CS-baseline electrolyte system, which is driven by solid–liquid–solid reactions. Polysulfides can readily diffuse within the x–y plane in the liquid phase, resulting in uniform deposition and minimal compositional differences across positions. However, a higher solid sulfur (S(S)) content is observed in the constant gap setup compared to constant pressure. This is likely due to increased internal pressure caused by volume expansion during lithiation, which restricts the transition of sulfur from solid to liquid.47 In contrast, the constant pressure setup releases this internal pressure, resulting in a greater presence of polysulfides in the electrolyte. Nevertheless, the effect of the two configurations on sulfur distribution is relatively minor.
For lithium, significant differences are observed between the configurations. The constant gap setup has a pronounced variation in lithium inventory from positions A to C, whereas the constant pressure configuration shows a more uniform lithium distribution. This is reflected in the differences in the β and γ vectors, aligning with our previous findings.48,49 The more even pressure distribution in the constant pressure configuration facilitates uniform lithium deposition, which may explain why constant pressure setups are often associated with improved cycling performance in Li–S batteries.50 While constant pressure has a limited influence on the uniform distribution of sulfur across the x–y plane, it enhances the homogeneity of lithium deposition, thereby contributing to longer battery life. Furthermore, lithium inventory loss in both setups increases with distance from the current collector tab. This is likely caused by an uneven cell gap introduced by the tab as the cell size increases, leading to more complete reactions near the tab due to improved current collection efficiency and slightly higher pressure in that area.
The HUGS analysis of Li–S pouch cells effectively distinguishes lateral compositional variations between the cathode and anode across diverse testing configurations. Notably, while the observed compositional distributions are influenced by parameters such as initial pressure settings, cells with a constant pressure setup exhibit more uniform compositional distribution, suggesting improved performance. The relatively uniform sulfur distribution observed in Fig. 4c likely arises from sampling methodology differences: while solid-phase components (e.g., lithium residues) are extracted from spatially defined regions, dissolved sulfur species are recovered from the bulk electrolyte, representing an averaged chemical environment rather than fixed x–y positions. Nevertheless, in multilayer pouch cells, where each layer can be isolated, the current HUGS platform remains compatible with layer-resolved quantification of both solid and dissolved sulfur species.
Quantifying factors affecting Li–S battery cycle life in coin cells with SPAN cathodes and different electrolytes
Using HUGS, we discussed the cycling behavior of Li–S batteries with CS cathodes and an electrolyte with higher polysulfide solubility, where physical adsorption predominantly stabilizes the elemental sulfur within the cathode. We then analyzed the cathode, where the sulfur is covalently bonded within a polymer. A typical material in Li–S batteries we selected for this is SPAN.51 Due to covalently bonded sulfur, SPAN reduces polysulfide dissolution and the shuttle effect, improving the battery's cycle life and efficiency.52–54Despite its widespread application as a cathode material in Li–S batteries, the structure of SPAN has been debated for decades due to its high molecular weight, various synthesis procedures, and amorphous nature.16,54,55 Previous studies suggest that the main structure of SPAN consists of continuous pyridine polymer chains cross-linked by –S–S– bonds.54,56,57 This work used time-of-flight secondary ion mass spectrometry (ToF-SIMS) to validate the SPAN structure. As shown in Fig. 5a, the thio-pyridine structure was detected in the material, confirming the sulfur-cross-linked pyridine belt structure suggested by earlier studies. Additionally, the maximum sulfur chain length in SPAN was in the S3 format, indicating the absence of long-chain sulfur in the material. However, after soaking the SPAN electrodes in baseline electrolyte (DOL-DME LiTFSI electrolyte) or LDME electrolyte (bis(2,2,2-trifluoroethyl) ether: DME, and lithium bis(fluorosulfonyl)imide (LiFSI)), S8 species were observed in HPLC, as shown in Fig. 5b. This observation suggests that although the SPAN polymer matrix contains covalently bonded sulfur, it is usually considered non-soluble in organic solvents. It can also adsorb a small portion of other forms of short-chain sulfur. Upon exposure to DME, a solvent that dissolves sulfur and polysulfides, these short-chain sulfurs dissolve in the electrolyte and re-organize as S8. Based on our previous study,16 a proposed SPAN structure with adsorbed sulfur species re-organizing in the presence of electrolyte is demonstrated in Fig. 5c. To further support this mechanism, XPS analysis shown in Fig. S17 (ESI†) reveals that soaking SPAN in DME leads to a selective decrease in the intensity of the short-chain sulfur signal (∼161 eV). When normalized to the C![[double bond, length as m-dash]](https://www.rsc.org/images/entities/char_e001.gif) S component, this trend becomes even more pronounced. This indicates that the sulfur species released into the electrolyte are predominantly short-chain forms, consistent with the HPLC detection of S8 as a recombination product.
S component, this trend becomes even more pronounced. This indicates that the sulfur species released into the electrolyte are predominantly short-chain forms, consistent with the HPLC detection of S8 as a recombination product.
 | ||
| Fig. 5 SPAN structural analysis, cycling performance, HUGS analysis, and proposed mechanism of Li-SPAN battery at different cycling regions in a coin cell. (a) Time-of-flight secondary ion mass spectrometry (ToF-SIMS) analysis of pristine SPAN cathode with the peak assignment; (b) HPLC-UV chromatograms of only baseline and LDME electrolytes, with and without SPAN; (c) proposed SPAN structure and sulfur reorganization during the resting; (d) defining the cycling regions in Li-SPAN battery (SPAN loading: 5 mg cm−2 with CMC (10 wt%) and Super-P (10 wt%), baseline: 1 M LiTFSI in DME:DOL (1:1 v/v) + 2 wt% LiNO3 with E/S = 10 μL mg−1, LDME: 2 M lithium bis(fluorosulfonyl)imide (LiFSI) in 1,2-dimethoxyethane/bis(2,2,2-trifluoroethyl) ether (DME/BTFE) (1:4 by weight) with E = 30 μL, anode Li: 250 μm, cycling protocol: 24 hours resting, two cycles at 0.05C, then 0.1C for baseline and 0.2C for LDME; (e) HUGS capacity loss vector plots and capacity retention pie charts for each cycling region; (f) the proposed mechanism of cycling behavior with SPAN cathodes and baseline electrolytes. | ||
Furthermore, in Fig. 5d, we defined the cycling regions for SPAN batteries, like the CS system. These regions are: 0 – rested for 24 hours, I – two initial formation cycles (0.05C), II – stable cycles (0.1C for baseline and 0.2C for LDME electrolyte), III – end of life (0.1C for baseline and 0.2C for LDME electrolyte). Ex situ characterizations were conducted to study the cycling behavior of the SPAN battery with a baseline electrolyte, detailed in the ESI,† under the ‘Characterization of SPAN Cathode’ (Fig. S17–S22, ESI†) session. These analyses showed better sulfur retention and minimal morphological change in the SPAN cathode compared to the CS cathode. The anode contained minimal sulfur species until the end of life, unlike in the CS battery. Overall, the shuttle effect is limited in Li–S batteries with SPAN cathodes and baseline electrolytes, enabling stable cycling until LiNO3 depletion.
HUGS analysis was performed sequentially (Fig. 5e and Fig. S22, ESI†). Unlike the carbon-stabilized sulfur (CS) system, the HUGS capacity retention pie charts in Fig. 5e reveal significantly lower capacity retention attributed to polysulfides and dissolved sulfur in the electrolyte. This is because most sulfur in SPAN is stabilized by covalent bonds, which limit bond cleavage and sulfur dissolution. From Region 0 to Region I, even less sulfur capacity is detected in the electrolyte, suggesting that dissolved or reconstructed S8 is effectively “re-captured” by the cathode during cycling. This sulfur dissolution and subsequent re-capture behavior observed through HUGS characterization suggest that SPAN employs a dual short-chain sulfur adsorption mechanism dominated by covalent bonding with supplementary non-covalent interactions. Enhancing the relative contribution of non-covalent interactions could present a promising strategy to improve the capacity of SPAN-based systems further.
By the end of cycling, the electrolyte shows less than 100 mA h g−1 capacity retained due to soluble species. The HUGS capacity loss vector plot (Fig. 5e) shows that the α vector remains negligible, indicating that the shuttling effect does not drive the capacity loss in SPAN. Case III in Fig. 1e is consistently dominant from Region I to III, which suggests that non-sulfide SEI formation and Li pulverization are the main contributors to capacity loss. Cross-section FIB-SEM images of the Li-SPAN anode (Fig. S21, ESI†) confirm SEI growth and Li pulverization after cycling. Since the SEI primarily consists of organic-rich composites, its growth can lead to detached pulverized Li, increasing capacity loss as indicated by the γ vector.
Furthermore, as shown in Fig. 5e, we applied LDME electrolytes (2 M lithium bis(fluorosulfonyl)imide (LiFSI) in 1,2-dimethoxyethane/bis(2,2,2-trifluoroethyl) ether (DME/BTFE) (1:4 by weight)) to the Li-SPAN batteries to investigate its HUGS capacity loss vector plot further. The LDME electrolyte, a localized high-concentration ether-based electrolyte, can stable cycle Li-SPAN batteries over hundreds of cycles (Fig. 5d).58 Compared to the baseline electrolyte, as shown in Fig. 5e, it can further reduce the shuttling effect of the batteries. More importantly, in the Fig. 5e HUGS capacity loss vector plot, with LDME electrolyte, all β vectors are further decreased, demonstrating improved cycling stability. The capacity loss mechanism in this system still aligns with Case III, where non-sulfide SEI growth and Li pulverization dominate, leading to capacity loss and eventual failure. While LDME cannot fully prevent these issues, it can mitigate them. More cases are shown in ESI,† Fig. S23.
A proposed mechanism for the cycling behavior of Li-SPAN batteries is illustrated in Fig. 5f. During the resting phase, redistribution of short-chain sulfur species to form S8 molecules in the electrolyte is observed within the SPAN cathode. Once cycling begins, the SPAN battery exhibits significantly reduced shuttle effect-induced capacity loss, as the SPAN cathode effectively re-captures the dissolved or reconstructed S8 from the electrolyte. This behavior suggests that sulfur adsorption in SPAN is primarily dominated by covalent bonding, complemented by a minor contribution from non-covalently bonded short-chain sulfur species. Meanwhile, non-sulfide solid–electrolyte interphase (SEI) formation and lithium pulverization emerge as the dominant capacity loss mechanisms during cycling (Case III). While these issues persist in the LDME-based electrolyte system, forming a stable SEI in the LDME electrolyte extends cycling life by reducing anode SEI growth and mitigating lithium pulverization.
Conclusion
This study introduced the HUGS (high-performance liquid chromatography-ultraviolet spectroscopy and gas chromatography sequential characterization) toolkit, an automated and precise approach for diagnosing capacity degradation mechanisms in lithium–sulfur (Li–S) batteries. HUGS enables the quantification of nine distinct sulfur and polysulfide species at concentrations as low as 40 ppb while integrating these findings with lithium inventory analysis. The automation provided by the Dr HUGS© software streamlines multi-source data processing, completing complex analyses within minutes. This combination of precision and efficiency allows HUGS to address performance bottlenecks across various battery configurations and chemistries, significantly advancing diagnostic workflows.For carbon-stabilized sulfur (CS) systems, HUGS revealed that capacity loss factors evolve during cycling. Self-discharge dominates in the resting phase, transitions to inactive lithium formation during early cycles, and is ultimately driven by sulfide-rich SEI growth in later stages. Applying HUGS to pouch cells demonstrated that constant pressure setups enhance lithium distribution uniformity compared to constant gap configurations, improving cycling stability. In sulfurized polyacrylonitrile (SPAN) systems, HUGS uncovered a dual sulfur adsorption mechanism, where covalent bonding dominates but is supplemented by non-covalent interactions. These findings challenge traditional assumptions about SPAN's behavior. Capacity fade in SPAN systems was primarily attributed to non-sulfide SEI formation and lithium pulverization, partially mitigated by localized high-concentration electrolytes (LHCE). HUGS demonstrates versatility in analyzing molecular-level processes and practical battery formats, from coin to pouch cells. By linking sulfur and lithium inventory changes to electrochemical performance and leveraging automation, HUGS offers a powerful platform for guiding rational design strategies. This work highlights how advanced analytical chemistry, combined with automation, can accelerate the development of next-generation Li–S batteries with improved stability, efficiency, and scalability.
While the current framework provides an effective means to correlate material inventories with capacity loss, we recognize that the vector-based interpretation remains a conceptual simplification of the underlying chemical complexity. Future developments of the HUGS platform will focus on enhancing chemical specificity and spatial resolution, enabling deeper insight into degradation mechanisms under realistic cell conditions. These efforts will further expand the utility of HUGS as a quantitative diagnostic tool for next-generation battery systems.
Methods
Materials
Materials except lithium metal chips (250 μm thick) (MTI Corp.), methanol and water (HPLC grade) (Fisher Scientific), and bis(2,2,2-trifluoroethyl)ether (BTFE, 99%) (Synquest Laboratories) were all purchased from Sigma Aldrich without further purification.TGC calibration curve
Five pieces of Li metal chips weighing 0.28 mg, 1.59 mg, 3.73 mg, 4.96 mg, and 8.61 mg were taken in 250 mL Erlenmeyer flasks and sealed within an Argon environment with a rubber stopper. Later, they were titrated with ethanol to form hydrogen gas. The intensity of the hydrogen gas peak observed in GC was correlated with the Li masses to get the calibration curve.Polysulfides calibration curves
A polysulfide mixture was made by targeting the stoichiometry of 16 mM Li2S6 by dissolving 12.8 mg sulfur and 3.676 mg Li2S in 5 mL of DME. The chemical reaction is as follows: Li2S + (5/8) S8 = Li2S6. Five different concentrations of polysulfide mixtures were prepared by derivatizing 25 μL, 50 μL, 100 μL, 200 μL, and 250 μL of Li2S6 with 25 μL of methyl triflate (MeOTf). 25 μL of benzene was added as an internal standard in all HPLC samples, including these standard solutions. Then, these solutions were diluted by adding DME to prepare 600 μL HPLC samples. Me2Sx (4 ≤ x ≤ 8) species were then separated by semi-preparative HPLC-UV to prepare the fractions. The peak positions were confirmed using HPLC-APCI-MS Fig. S1 (ESI†). As shown in Fig. S2a (ESI†), these samples were digested. Inductively coupled plasma-mass spectroscopy (ICP-MS) – O2 reaction mode can quantify sulfur as [SO] in each sample. Based on Beer–Lambert's Law, the concentration of polysulfides (or sulfur) should be proportional to the area of the polysulfide peak in the HPLC-UV chromatogram (Fig. S2b–d, ESI†). A linear relation with R2 > 0.96 was achieved for all, as mentioned in Table S1 (ESI†). The detection limits for each species are up to 40 ppm, as seen in Fig. S2c (ESI†). The precision and accuracy were validated by taking a known sample of sulfur in DME, repeating it four times with HPLC-UV, and quantifying sulfur using the calibration curve, as seen in Table S2 (ESI†) with an error <5%.Me2S3 calibration curve
1 μL of Me2S3 was transferred to 5 mL of DME through Hamilton syringe to make 1.904 mM of Me2S3, which was further diluted into one mM, 0.5 mM, 0.1 mM, and 0.01 mM. Chromatograms and calibration curves based on these samples are shown in Fig. S3a and b (ESI†).HUGS method sample information
For the CS battery, the Li anode chip was washed with 2 mL DME + 25 μL MeOTf. Li chip is then taken to do TGC (sample A). 1 mL DME is then used to wash the Li metal chip to remove all derivatized species remaining on it. The entire solution (3.025 mL) containing derivatized species from the anode is then used to collect all cell components to prepare sample B. Sulfur cathode is then washed with 10 mL DME using magnetic stirring for 15 minutes to prepare sample C.Sample A: Li metal chip titrated in 250 mL Erlenmeyer flasks with 2 mL ethanol.
Sample B: 575 μL solution from 3.025 mL of derivatized species + 275 μL DME + 25 μL benzene (internal standard).
Sample C: 575 μL solution from 10 mL of DME solution containing residual sulfur (S(S)) + 275 DME + 25 μL benzene.
For the CS pouch cell, the Li foil was washed with 30 mL DME + 250 μL MeOTf. The punched portion of Li was then taken to do TGC (sample A). The entire solution (30.25 mL) containing derivatized species from the anode is then used to collect all cell components to prepare sample B. Punched sulfur cathode is then washed with 10 mL DME using magnetic stirring for 15 minutes to prepare sample C.
For the SPAN battery, except for 2 mL DME + 25 μL MeOTf solution), we used 1 mL DME + 25 μL MeOTf as the concentration of polysulfide was lower. So, the overall dilution was reduced by preparing only 2.025 mL of the solution for sample B. No sample C was prepared for SPAN; soluble species (including S(S)) were very small.
Sample B and C, 600 μL each, had fixed concentrations of benzene, which was used as the internal standard in both calibration curves and the samples to remove instrumental errors.
Characterizations
Analytical high-performance liquid chromatography-ultra violet (analytical HPLC-UV) spectroscopy and high-performance liquid chromatography-atmospheric pressure chemical ionization-mass spectrometry (HPLC-APCI-MS)
The Thermo Scientific Vanquish quaternary pump F (VF-P20-A) coupled with the Thermo Scientific Split Sampler FT (VF-A10-A) autosampler was utilized to deliver a mobile phase through a ZORBAX Extend-C18 Column (from Agilent, 80 Å, 4.6 × 50 mm, 5 μm) at a flow rate of 0.70 mL min−1. The sample injection volume was 5 μL. A binary gradient mobile phase was employed with the following gradient profile: 0 min, 25% methanol (75% water); 20 min, 100% methanol; 25 min, 100% methanol; 26 min, 25% methanol; 30 min, 25% methanol. UV absorbance data was collected at 210 nm (LiNO3) and 230 nm (polysulfides and sulfur) wavelengths and analyzed using the Thermo Scientific Chromeleon Chromatography Data System Software. APCI-MS data was recorded for m/z = 50 to 600 with Orbitrap Elite and analyzed using Xcalibur.Semi-preparative high-performance liquid chromatography-ultra violet spectroscopy (semi-preparative HPLC-UV)
The Thermo Scientific Vanquish quaternary pump F (VF-P20-A) coupled with the Thermo Scientific Split Sampler FT (VF-A10-A) autosampler was utilized to deliver a mobile phase through a Luna C18(2) (from Phenomenex, 100 Å, 10 × 250 mm, 10 μm) at a flow rate of 5 mL min−1. The sample injection volume was 100 μL. A binary gradient mobile phase was employed with the following gradient profile: 0 min, 25% methanol (75% water); 20 min, 100% methanol; 25 min, 100% methanol; 26 min, 25% methanol; 30 min, 25% methanol. UV absorbance data was collected at 230 nm (polysulfides and sulfur) wavelength and analyzed using the Thermo Scientific Chromeleon Chromatography Data System Software.Inductively coupled plasma-mass spectroscopy (ICP-MS)
Samples used to prepare calibration curves for derivatized polysulfide species were prepared by collecting fractions (around 2 mL) and digesting them individually at 180 °C for 3 hours in a highly acidic 4 mL HNO3 + H2O2 (1:1 v/v) solution. An open system was considered for the removal of methanol. ICP matrix solution (1% nitric acid) was added continuously to compensate for losses due to evaporation. 200 μL scandium (200 ppb) was used as the internal standard in 10 mL ICP samples. O2 or oxygen gas reaction mode was used to convert S into [SO] molecule, and its intensities were used for ICP analysis.
X-ray photoelectron spectroscopy (XPS)
XPS was performed with a Kratos AXIS Supra. Samples were rinsed by DOL inside of Ar glove box and dried. All samples were loaded in the XPS through an N2 glove box with <0.1 ppm water and oxygen without air exposure. The chamber pressure was <10−8 torr during all measurements. XPS spectra were fitted with Casa XPS. All spectra were calibrated using the C 1s peak at 284.6 eV.Cryogenic focused ion beam scanning electron microscopy (Cryo-FIB SEM/EDX)
The cathodes and anodes were rinsed by DOL in an Argon environment to remove the salts while retaining polysulfides. The samples were mounted on the SEM sample holder in the glovebox and then transferred to a FEI Scios NanoLab Dualbeam. The stage was cooled with liquid nitrogen to −180 °C or below. Sample cross-sections were exposed using a 1 nA ion beam current and cleaned at 0.5 nA and 0.1 nA, respectively, at 5 kV. All energy-dispersive X-ray spectra (EDX) results are collected in the same instruments at 10 kV.Time-of-flight secondary ion mass spectrometry (ToF-SIMS)
The ToF-SIMS analyses were conducted using the ION TOF M6 instrument with 30 keV Bi+ primary ions. The ion beam, pulsed at 14 ns, had an emission current of 0.8 μA. The mass resolution (m/Δm) of the peaks of interest typically ranged from 7000 to 9000, with a minimum of 5000 and a maximum of 13000. The analytical depth was approximately 5 nm, and the best lateral resolution was around 100 nm. Dual-beam depth profiling was employed, using a 500 eV Cs+ ion beam (50 nA) for sputtering. Bi+ primary ion analyses covered a 50 μm × 50 μm area (256 × 256 pixels) within a 200 μm × 200 μm sputtered area. Secondary ions were analyzed over an m/z range of 0 to 400.
Raman spectroscopy
The samples for Raman were sealed by a glass cover (sample side) and Keptone tape (substrate side) to prevent air exposure. Samples were tested by a Renishaw inVia Raman Microscope. The green laser (532 nm wavelength) was applied as the light source.Electrochemical testing
Sulfur and Ketjen black composite-based cathodes (CS cathodes) were obtained from General Motors (USA). 12 mm cathodes with an average loading of 3.6 mgS cm−2 were punched.SPAN was synthesized according to the previously reported procedure. The cathode was made by mixing active material (80% SPAN) with 10% Super-P and 10% CMC binder, and a water-based slurry was cast onto the aluminum foil. A 12 mm cathode with an average loading of 5 mgSPAN cm−2 was punched.
The cathodes, lithium discs (MTI, 250 μm thickness), and a 2325 Celgard separator (Celgard, USA) were assembled into a 2032-coin cell. 1 M LiTFSI in DME/DOL (1:1 v/v) with 2 wt% LiNO3 (Baseline) and 2 M lithium bis(fluorosulfonyl)imide (LiFSI) in 1,2-dimethoxyethane/bis(2,2,2-trifluoroethyl) ether (DME/BTFE) (1:4 by weight) (LDME) electrolyte is used according to our previous study.16 The electrolyte amount was 38 μL for the baseline electrolyte and 30 μL for the LDME electrolyte. Electrolytes were added to each coin cell to guarantee complete wetting of the separator and electrodes. With hundreds of coin cells used in this study, for each new variable (Ex. electrolyte, cycle number, etc.) in the coin cell, electrochemical data was reproduced two or more times, including post-martem analysis (Ex. HUGS) to verify the data reproducibility and consistency in the trends. All assembly was performed in an argon-filled glovebox.
The electrochemical test was conducted on a Neware battery tester (China). All batteries were rested for 24 hours before cycling. Galvanostatic charge/discharge was performed at room temperature on a CS battery in a voltage range of 1.8–2.8 V vs. Li/Li+ at 0.15 mA (0.05C equivalent, C = 1000 mA h gS−1) current during the 2 formation cycles and in 1.7–2.8 V vs. Li/Li+ at 0.30 mA (0.1C equivalent) during later cycling.
The SPAN battery's voltage range was fixed at 1–3 V, and two formation cycles were performed at 0.15 mA (0.05C equivalent, 1C = 600 mA h gSPAN−1). But in baseline electrolyte, later cycling was done at 0.3 mA (0.1C equivalent), and in LDME electrolyte, it was done at 0.6 mA (0.2C equivalent).
For the pouch cell testing, the sulfur–carbon composite was mixed with super P, CMC binder in an 8:1:1 ratio, and water-based slurry was made with a 1:3 solid–liquid ratio. The slurry was cast on carbon-coated Al foil with 5 mg cm−2 sulfur loading. The cathode with Al tab welded and Celgard C2325 separators were dried overnight at 60 °C. 100 μm lithium foil was cut and attached to an etched nickel tab under the Argon environment. Based on an electrolyte-to-sulfur ratio (E/S) of 10 μL mg−1, the baseline electrolyte (1 M LiTFSI in DME/DOL (1:1 v/v) with 2 wt% LiNO3) was injected and vacuum sealed. Galvanostatic charge/discharge was carried out at room temperature in a voltage range of 1.8–2.8 V vs. Li/Li+ at 0.05C equivalent (C = 1000 mA h gS−1) current during the 2 formation cycles and in 1.7–2.8 V vs. Li/Li+ at 0.1C during 15 cycles. Two uniaxial pressure setups were used for testing in the pouch cell: (1) constant gap and (2) constant pressure.
(1) Constant gap:
For the constant gap setup, a calibrated load cell was used to apply uniaxial pressure of 30 lbs inch−2 on the pouch cell before testing, as depicted in Fig. 4b. In this setup, the gap remains constant during cycling.
(2) Constant pressure:
For the constant pressure setup, precision compression springs with a spring constant of 200 lbs inch−1 were used to apply uniaxial pressure of 30 lbs inch−2 on the pouch cell before testing, as shown in Fig. 4b. Four springs were used in the setup. The compressed length was calculated using an equation and measured with a vernier caliper. In this configuration, the pressure remains constant during cycling.

Author contributions
Saurabh Parab: conceptualization, methodology, investigation, formal analysis, software, writing – original draft; Shen Wang: conceptualization, investigation, formal analysis, writing – original draft, writing – review & editing, supervision; Matthew Miyagishima: investigation, software; Jonathan Lee, Qiushi Miao, Mingqian Li, Bhargav Bhamwala: investigation; Kun Ryu: methodology (ToF-SIMS); Neal Arakawa: investigation (ICP-MS, HPLC-APCI-MS); Alex Liu, Louis Ah, Bhagath Sreenarayanan: resources (Cryo-FIB); Bhargav Bhamwala: methodology (GC calibration); Ping Liu, Qiushi Miao, Shen Wang: resources (SPAN electrodes); Robert Schmidt, Fang Dai, Mei Cai: resources (CS cathodes); Ying Shirley Meng: conceptualization, supervision, writing – review & editing, funding acquisition; All authors reviewed and approved the final version of the manuscript.Data availability
The data that support the findings of this study are available from the corresponding author upon reasonable request.Conflicts of interest
A provisional patent application (US Provisional Application serial number 63709904) for this work has been filed by Y. S. M., S. P., S. W., and M. M. through UC San Diego's Office of Innovation and Commercialization. This patent application contains claims related to HUGS methodology and Dr HUGS automation software for metal–sulfur batteries’ analysis. The remaining authors declare no competing interests.Acknowledgements
This work was supported by the U.S. Department of Energy Office of Vehicle Technologies under award DE-EE0009648 and by the Advanced Battery Materials Research (BMR) Program (Battery500 Consortium) under contract DE-EE0007764. Arbin Battery Testing Facility and Shimadzu Gas Chromatography machine from UC San Diego were used. FIB and TEM characterizations were performed at the San Diego Nanotechnology Infrastructure (SDNI) of UC San Diego, a member of the National Nanotechnology Coordinated Infrastructure supported by the National Science Foundation (Grant ECCS1542148). NSF supported using the Raman facility through the UC San Diego Materials Research Science and Engineering Center (UC San Diego MRSEC), grant DMR-201192. The authors acknowledge using facilities and instrumentation at the UC Irvine Materials Research Institute (IMRI), which the National Science Foundation partly supports through the UC Irvine Materials Research Science and Engineering Center (DMR-2011967). XPS experiments were performed using instrumentation funded in part by the National Science Foundation Major Research Instrumentation Program under grant CHE-1338173. This work made use of the Keck-II facility of Northwestern University's NUANCE Center, which has received support from the SHyNE Resource (NSF ECCS-2025633), the IIN, and Northwestern's MRSEC program (NSF DMR-2308691). ICP-MS (Thermo iCAP RQ single-quadrupole ICP-MS system), HPLC-UV, and HPLC-APCI-MS measurements were taken at the Environmental and Complex Analysis Laboratory (ECAL) at the UC San Diego. S. P. thanks Gita Singh, for suggestions on the manuscript. S. P. thanks S. W. for helping with figure designs.References
- S.-H. Chung and A. Manthiram, Adv. Mater., 2019, 31, 1901125 CrossRef PubMed.
- A. Bhargav, J. He, A. Gupta and A. Manthiram, Joule, 2020, 4, 285–291 CrossRef.
- P. G. Bruce, S. A. Freunberger, L. J. Hardwick and J.-M. Tarascon, Nat. Mater., 2012, 11, 19–29 CrossRef CAS PubMed.
- S.-H. Chung, C.-H. Chang and A. Manthiram, Adv. Funct. Mater., 2018, 28, 1801188 CrossRef.
- N. Nakamura, S. Ahn, T. Momma and T. Osaka, J. Power Sources, 2023, 558, 232566 CrossRef CAS.
- X. Ji, K. T. Lee and L. F. Nazar, Nat. Mater., 2009, 8, 500–506 CrossRef CAS PubMed.
- R. Liu, Z. Wei, L. Peng, L. Zhang, A. Zohar, R. Schoeppner, P. Wang, C. Wan, D. Zhu, H. Liu, Z. Wang, S. H. Tolbert, B. Dunn, Y. Huang, P. Sautet and X. Duan, Nature, 2024, 626, 98–104 CrossRef CAS PubMed.
- D. Wang, L.-J. Jhang, R. Kou, M. Liao, S. Zheng, H. Jiang, P. Shi, G.-X. Li, K. Meng and D. Wang, Nat. Commun., 2023, 14, 1895 CrossRef CAS PubMed.
- J. Akridge, Solid State Ionics, 2004, 175, 243–245 CrossRef CAS.
- M. A. Weret, S.-K. Jiang, K. N. Shitaw, C.-Y. Chang, T. M. Tekaligne, J.-C. Chiou, S.-C. Yang, N. T. Temesgen, Y. Nikodimos, S.-H. Wu, C.-C. Wang, W.-N. Su and B. J. Hwang, ACS Energy Lett., 2023, 8, 2817–2823 CrossRef CAS.
- H. Hong, N. A. R. Che Mohamad, K. Chae, F. Marques Mota and D. H. Kim, J. Mater. Chem. A, 2021, 9, 10012–10038 RSC.
- Y.-S. Su, Y. Fu, T. Cochell and A. Manthiram, Nat. Commun., 2013, 4, 2985 CrossRef PubMed.
- X. Liang, C. Hart, Q. Pang, A. Garsuch, T. Weiss and L. F. Nazar, Nat. Commun., 2015, 6, 5682 CrossRef PubMed.
- Y. Yang, G. Zheng, S. Misra, J. Nelson, M. F. Toney and Y. Cui, J. Am. Chem. Soc., 2012, 134, 15387–15394 CrossRef CAS PubMed.
- B. P. Vinayan, T. Diemant, X.-M. Lin, M. A. Cambaz, U. Golla-Schindler, U. Kaiser, R. Jürgen Behm and M. Fichtner, Adv. Mater. Interfaces, 2016, 3, 1600372 CrossRef.
- S. Wang, B. Lu, D. Cheng, Z. Wu, S. Feng, M. Zhang, W. Li, Q. Miao, M. Patel, J. Feng, E. Hopkins, J. Zhou, S. Parab, B. Bhamwala, B. Liaw, Y. S. Meng and P. Liu, J. Am. Chem. Soc., 2023, 145, 9624–9633 CrossRef CAS PubMed.
- X. Yu and A. Manthiram, Adv. Funct. Mater., 2020, 30, 2004084 CrossRef CAS.
- W. Yao, K. Liao, T. Lai, H. Sul and A. Manthiram, Chem. Rev., 2024, 124, 4935–5118 CrossRef CAS PubMed.
- B. D. A. Levin, M. J. Zachman, J. G. Werner, R. Sahore, K. X. Nguyen, Y. Han, B. Xie, L. Ma, L. A. Archer, E. P. Giannelis, U. Wiesner, L. F. Kourkoutis and D. A. Muller, Microsc. Microanal., 2017, 23, 155–162 CrossRef CAS PubMed.
- M. U. M. Patel, R. Demir-Cakan, M. Morcrette, J.-M. Tarascon, M. Gaberscek and R. Dominko, ChemSusChem, 2013, 6, 1177–1181 CrossRef CAS PubMed.
- M. U. M. Patel and R. Dominko, ChemSusChem, 2014, 7, 2167–2175 CrossRef CAS PubMed.
- Q. Zou and Y.-C. Lu, J. Phys. Chem. Lett., 2016, 7, 1518–1525 CrossRef CAS PubMed.
- Q. He, A. T. S. Freiberg, M. U. M. Patel, S. Qian and H. A. Gasteiger, J. Electrochem. Soc., 2020, 167, 080508 CrossRef CAS.
- C. Barchasz, F. Molton, C. Duboc, J.-C. Leprêtre, S. Patoux and F. Alloin, Anal. Chem., 2012, 84, 3973–3980 CrossRef CAS PubMed.
- J.-J. Chen, R.-M. Yuan, J.-M. Feng, Q. Zhang, J.-X. Huang, G. Fu, M.-S. Zheng, B. Ren and Q.-F. Dong, Chem. Mater., 2015, 27, 2048–2055 CrossRef CAS.
- M. Hagen, P. Schiffels, M. Hammer, S. Dörfler, J. Tübke, M. J. Hoffmann, H. Althues and S. Kaskel, J. Electrochem. Soc., 2013, 160, A1205–A1214 CrossRef CAS.
- S.-Y. Lang, Y. Shi, Y.-G. Guo, D. Wang, R. Wen and L.-J. Wan, Angew. Chem., Int. Ed., 2016, 55, 15835–15839 Search PubMed.
- W. Zhu, A. Paolella, C.-S. Kim, D. Liu, Z. Feng, C. Gagnon, J. Trottier, A. Vijh, A. Guerfi, A. Mauger, C. M. Julien, M. Armand and K. Zaghib, Sustainable Energy Fuels, 2017, 1, 737–747 Search PubMed.
- J. D. McBrayer, T. E. Beechem, B. R. Perdue, C. A. Apblett and F. H. Garzon, J. Electrochem. Soc., 2018, 165, A876 Search PubMed.
- J. Hannauer, J. Scheers, J. Fullenwarth, B. Fraisse, L. Stievano and P. Johansson, ChemPhysChem, 2015, 16, 2755–2759 CrossRef CAS PubMed.
- A. Kawase, S. Shirai, Y. Yamoto, R. Arakawa and T. Takata, Phys. Chem. Chem. Phys., 2014, 16, 9344–9350 RSC.
- L. A. Huff, J. L. Rapp, J. A. Baughman, P. L. Rinaldi and A. A. Gewirth, Surf. Sci., 2015, 631, 295–300 CrossRef CAS.
- H. Wang, N. Sa, M. He, X. Liang, L. F. Nazar, M. Balasubramanian, K. G. Gallagher and B. Key, J. Phys. Chem. C, 2017, 121, 6011–6017 CrossRef CAS.
- M. U. M. Patel, I. Arčon, G. Aquilanti, L. Stievano, G. Mali and R. Dominko, ChemPhysChem, 2014, 15, 894–904 Search PubMed.
- A. Kamyshny, A. Goifman, J. Gun, D. Rizkov and O. Lev, Environ. Sci. Technol., 2004, 38, 6633–6644 Search PubMed.
- D. Zheng, X. Zhang, C. Li, M. E. McKinnon, R. G. Sadok, D. Qu, X. Yu, H.-S. Lee, X.-Q. Yang and D. Qu, J. Electrochem. Soc., 2015, 162, A203–A206 CrossRef CAS.
- D. Zheng, X.-Q. Yang and D. Qu, ChemSusChem, 2016, 9, 2348–2350 CrossRef CAS PubMed.
- D. Zheng, X. Zhang, J. Wang, D. Qu, X. Yang and D. Qu, J. Power Sources, 2016, 301, 312–316 Search PubMed.
- D. Zheng, D. Liu, J. B. Harris, T. Ding, J. Si, S. Andrew, D. Qu, X.-Q. Yang and D. Qu, ACS Appl. Mater. Interfaces, 2017, 9, 4326–4332 CrossRef CAS PubMed.
- P. J. Stang, M. Hanack and L. R. Subramanian, Synthesis, 2002, 85–126 Search PubMed.
- M. M. Rahman, A. Ronne, N. Wang, Y. Du and E. Hu, ACS Energy Lett., 2024, 9, 2024–2030 CrossRef CAS.
- D. Aurbach, E. Pollak, R. Elazari, G. Salitra, C. S. Kelley and J. Affinito, J. Electrochem. Soc., 2009, 156, A694 CrossRef CAS.
- C. Yan, H.-R. Li, X. Chen, X.-Q. Zhang, X.-B. Cheng, R. Xu, J.-Q. Huang and Q. Zhang, J. Am. Chem. Soc., 2019, 141, 9422–9429 CrossRef CAS PubMed.
- H. A. Adeoye, M. Dent, J. F. Watts, S. Tennison and C. Lekakou, J. Chem. Phys., 2023, 158, 064702 CrossRef CAS PubMed.
- S. S. Zhang, J. Power Sources, 2016, 322, 99–105 Search PubMed.
- X. Huang, J. Xue, M. Xiao, S. Wang, Y. Li, S. Zhang and Y. Meng, Energy Storage Mater., 2020, 30, 87–97 CrossRef.
- L. Shi, S.-M. Bak, Z. Shadike, C. Wang, C. Niu, P. Northrup, H. Lee, A. Y. Baranovskiy, C. S. Anderson, J. Qin, S. Feng, X. Ren, D. Liu, X.-Q. Yang, F. Gao, D. Lu, J. Xiao and J. Liu, Energy Environ. Sci., 2020, 13, 3620–3632 RSC.
- Y.-T. Chen, J. Jang, J. A. S. Oh, S.-Y. Ham, H. Yang, D.-J. Lee, M. Vicencio, J. B. Lee, D. H. S. Tan, M. Chouchane, A. Cronk, M.-S. Song, Y. Yin, J. Qian, Z. Chen and Y. S. Meng, Adv. Energy Mater., 2024, 14, 2304327 CrossRef CAS.
- C. Fang, B. Lu, G. Pawar, M. Zhang, D. Cheng, S. Chen, M. Ceja, J.-M. Doux, H. Musrock, M. Cai, B. Liaw and Y. S. Meng, Nat. Energy, 2021, 6, 987–994 CrossRef CAS.
- F. Schmidt, A. Korzhenko, P. Härtel, F. S. Reuter, S. Ehrling, S. Dörfler, T. Abendroth, H. Althues and S. Kaskel, JPhys Energy, 2022, 4, 014004 CrossRef CAS.
- J. Wang, J. Yang, J. Xie and N. Xu, Adv. Mater., 2002, 14, 963–965 Search PubMed.
- D. Kuai, S. Wang, S. Perez-Beltran, S. Yu, G. A. Real, P. Liu and P. B. Balbuena, ACS Energy Lett., 2024, 9, 810–818 CrossRef CAS PubMed.
- S. Tan, M. M. Rahman, Z. Wu, H. Liu, S. Wang, S. Ghose, H. Zhong, I. Waluyo, A. Hunt, P. Liu, X.-Q. Yang and E. Hu, ACS Energy Lett., 2023, 8, 2496–2504 CrossRef CAS.
- W. Wang, Z. Cao, G. A. Elia, Y. Wu, W. Wahyudi, E. Abou-Hamad, A.-H. Emwas, L. Cavallo, L.-J. Li and J. Ming, ACS Energy Lett., 2018, 3, 2899–2907 CrossRef CAS.
- S. Wei, L. Ma, K. E. Hendrickson, Z. Tu and L. A. Archer, J. Am. Chem. Soc., 2015, 137, 12143–12152 CrossRef CAS PubMed.
- M. S. Ahmed, S. Lee, M. Agostini, M.-G. Jeong, H.-G. Jung, J. Ming, Y.-K. Sun, J. Kim and J.-Y. Hwang, Adv. Sci., 2021, 8, 2101123 CrossRef CAS PubMed.
- J. Fanous, M. Wegner, J. Grimminger, Ä. Andresen and M. R. Buchmeiser, Chem. Mater., 2011, 23, 5024–5028 CrossRef CAS.
- H. Liu, J. Holoubek, H. Zhou, A. Chen, N. Chang, Z. Wu, S. Yu, Q. Yan, X. Xing, Y. Li, T. A. Pascal and P. Liu, Mater. Today, 2021, 42, 17–28 CrossRef CAS.
Footnote |
| † Electronic supplementary information (ESI) available. See DOI: https://doi.org/10.1039/d5ee00618j |
| This journal is © The Royal Society of Chemistry 2025 |