Localized regional environmental risk in mountainous urban areas of Southwest China: identification, assessment, and management strategies in Kunming†
Wei
Jin
ab,
Qianwen
Mo
b,
Guihong
Li
b,
Gang
Wang
a,
Binqiang
Zhu
b,
Xing
Wan
a,
Peng
Lin
b,
Bin
Huang
 *a and
Xuejun
Pan
*a
aFaculty of Environmental Science and Engineering, Kunming University of Science and Technology, Kunming 650500, China. E-mail: huangbin@kust.edu.cn; xjpan@kust.edu.cn
bKunming Ecological Environmental Engineering Assessment Center, Kunming 650200, China
First published on 2nd September 2024
Abstract
In recent decades, the escalating frequency of environmental risk events, arising from sources such as industrial accidents, chemical spills, or other anthropogenic activities, has intensified threats to the ecological environment. The targeted identification of high-risk areas, formulation of control lists for key risk sources within regions, and the implementation of differentiated management strategies remain significant challenges. This study employed an administrative region environmental risk assessment and gridded environmental risk analysis method to comprehensively evaluate the environmental risks in the city of Kunming, China. The results indicated a fourfold increase in the number of environmental risk sources from 2012 to 2022. The sources were found to be widely distributed across the entire region but exhibited localized clustering. The environmental risk receptors were primarily concentrated around a local lake, in densely populated counties, and near rivers and drinking water sources. Risk hotspot areas within the target region were identified using the gridded environmental risk analysis method. A list of 29 key control areas was proposed, including nine industrial parks and 20 streets. Measures were proposed for handling unexpected incidents. The findings provide data useful for policy formulation and environmental management in similar regions of mountainous cities.
Environmental significanceIn recent decades, escalating environmental risk events have heightened ecological threats. The targeted identification of high-risk areas and the formulation of control lists for key risk sources pose significant challenges. Our study, focusing on Kunming, a western plateau mountain city in China, aims to assess its environmental risk status, identify hotspots, and propose a control list. With implications for biodiversity conservation in Yunnan Province, our work offers a scientific basis for risk supervision and control strategies in similar regions. Key contributions include identifying distributions of environmental risk sources and environmental risk receptors, combining administrative region and gridded environmental risk analysis methods, proposing a list of key risk sources, and offering suggestions for managing unexpected incidents. |
1 Introduction
With the advancement of reforms and opening-up in China, remarkable achievements have been made in economic and social development. However, this progress has brought about increasingly prominent challenges, such as land resource scarcity, population expansion, and environmental degradation. In addition, rapid industrialization and urbanization, essential components of economic growth, often contribute to higher levels of environmental pollution.1,2 Consequently, the risk of sudden environmental pollution incidents in regions has inevitably increased. When the environmental risk level reaches a critical threshold, the consequences can become unacceptable, potentially leading to a bottleneck in economic growth. Environmental issues have now emerged as a critical bottleneck in sustainable economic development. Due to the rapid increase in the number of industrial enterprises,3 their impact on the environment has attracted widespread attention.4,5 China is now witnessing tens of thousands of environmental incidents annually, a trend that is increasingly capturing the attention of the Chinese government and the public alike.6,7Environmental incidents are sudden events such as pollutant emissions, natural disasters, or industrial accidents that inject toxic substances into the air, water, or soil, impairing and causing a rapid deterioration in environmental quality.8,9 Such incidents not only threaten human health and property, but they may also disrupt ecosystems, potentially exerting an impact on social stability.10 Therefore, urgent actions are typically required in response to such events. Environmental incidents typically manifest with spontaneity, unfold rapidly, and exhibit a notable level of unpredictability, thereby presenting substantial risks to the environment, production, and the overall fabric of society.11,12 For example, in 2015, an incident involving the explosion of dangerous chemicals in the Tianjin Coastal New Area resulted in the tragic loss of over 100 lives and inflicted direct economic damages amounting to 6.866 billion yuan.13 Additional incidents include the Jinan asphalt pool deflagration, the Yichun Luming mining “March 28” tailings pond leakage, the ammonium nitrate explosion at the port of Beirut, Lebanon, and the LG styrene gas leakage.14 Such serious events typically involve various forms of environmental pollution, including air, water, soil, and radiation, primarily originating from major industries, such as petroleum refining, coking, chemicals, electroplating, non-ferrous metal extraction, and smelting.6,15 Defining the characteristics of environmental events is crucial for environmental risk management. Such definitions allow a more comprehensive understanding of the threats and how to handle them for the authorities and the public. Good definitions lay the foundation for good decision-making about prevention and control. However, formulating them is often costly and time-consuming, so such investigations are typically limited in scope.16 Places considered as potential pollution sites or those currently undergoing or having completed polluting activities are typically in the early stages of pollution.17,18 Establishing a priority list for industrial sites and confirming locations that may be subject to pollution can significantly help reduce the costs associated with detailed investigations and sampling.19–21 That makes it advisable to conduct preliminary risk assessments of industrial enterprises to identify priority areas and determine potential pollution sites.
Regional ecological risk assessment involves evaluating the likelihood and extent of harm to the structure and functioning of ecosystems at the regional scale due to human activities and natural disasters.13,22 Its purpose is to provide a scientific basis for ecological risk management. Since the first application of ecological risk assessment on a regional level in 1990,23 regional ecological risk assessments have gradually evolved from dealing with individual sources of risk to treating multiple sources impacting multiple recipients on a small or a larger regional scale.24 Research in this field has gradually shifted from the impacts of single influences to more comprehensive risk assessment encompassing social, natural, and ecological dimensions.25–27 Some scholars have conducted risk assessments on potentially contaminated areas in Poland, determining their risk levels using source-pathway-receptor and multi-attribute decision-making methods.28 Similarly, other researchers have applied multi-attribute decision-making methods to conduct preliminary risk assessments of potential pollution sites on a regional scale.29 However, despite these efforts, in a given region, quantifying the risks, exploring the changes of those risks temporally and spatially, and proposing a control list for key risk sources remain challenging.
Mountainous urban areas face unique challenges that differ from those of coastal cities on flatlands, making regional environmental risk assessment particularly important. The topography of mountainous cities often leads to specific environmental vulnerabilities, such as increased susceptibility to landslides, erosion, and flash floods. These physical characteristics can exacerbate the impact of environmental pollution incidents, making it more difficult to effectively manage and mitigate risks.30 Furthermore, the limited availability of flat land in mountainous regions often results in urban development and industrial activities within narrow valleys and along steep slopes. This can heighten the potential for environmental contamination, as pollutants from industrial activities and urban runoff have less space to disperse and are thus more likely to accumulate in confined areas.31,32 Mountains are also among the most ecologically functional areas and provide a wide range of ecosystem services to the adjoining populations. However, mountainous ecosystems are highly vulnerable due to land use and land cover changes, as well as climate change, even though the biodiversity in these areas can be rich.33 In summary, due to the complexity of mountainous urban areas, a localized risk assessment method is needed to accurately identify high-risk areas and provide practical risk prevention and control strategies.
This study focused on the western plateau mountain city of Kunming, aiming to: (i) systematically investigate and comprehensively assess the current environmental risk status; (ii) identify environmental risk hotspots by combining administrative area risk assessment with grid partition methods, proposing a control list for key risk sources; (iii) develop practical risk prevention and control strategies for vulnerable areas in environmental control. The study has valuable implications for the conservation of biodiversity in Yunnan Province, providing a scientific basis for risk source supervision and control in Yunnan and similar regions.
2 Methods
2.1 Framework and study area
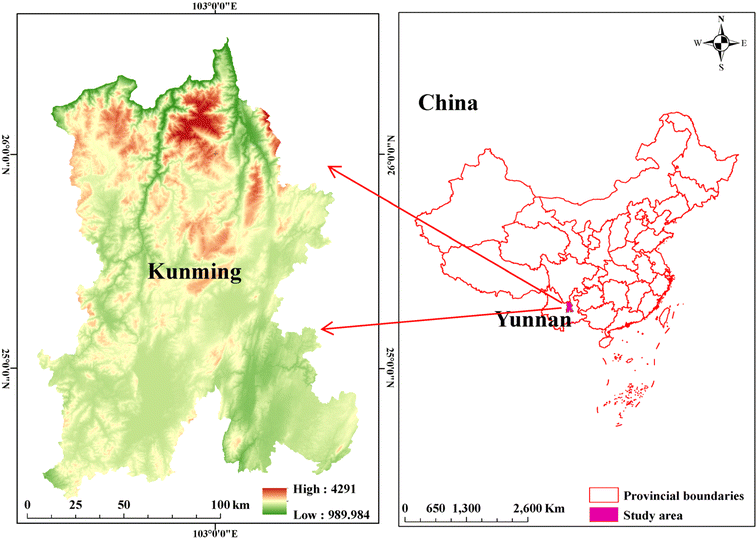
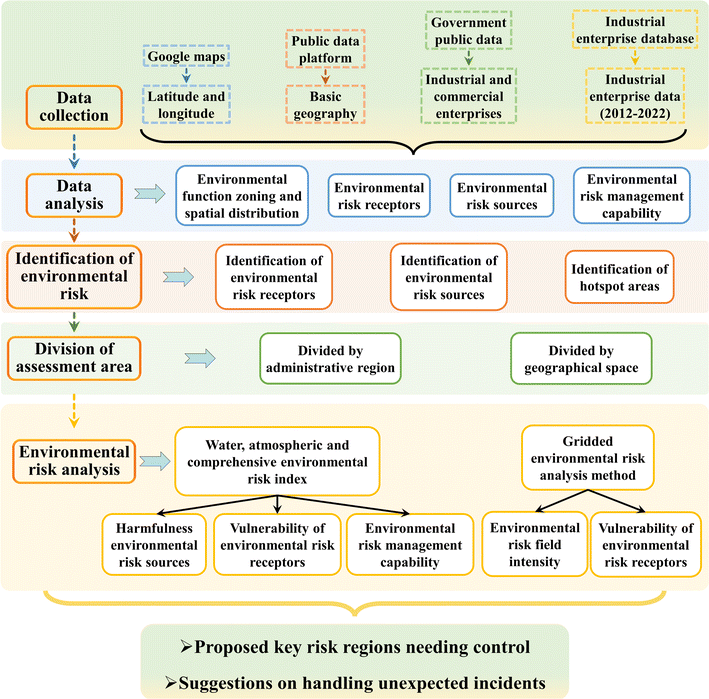
Kunming is the capital of China's Yunnan Province. It has enjoyed rapid economic development, but that has created latent environmental hazards and structural environmental risks.34,35 Quantifying those risks has remained elusive, and there are also deficiencies in the city's environmental emergency response capabilities and an incomplete environmental emergency management system. The interactive dynamics relating the sources of environmental risk and those threatened are not yet clear. In-depth research is therefore called for to gain a better understanding of the complex environmental challenges facing Kunming.Fig. 1 shows Kunming set at the heart of the Yunnan–Guizhou Plateau in southwestern China. The city's general topography features higher elevations in its northern part, gradually descending step-wise to lower elevations in the south. The central region is elevated, while the eastern and western sides are lower. Most of the city lies at altitudes ranging from 1500 to 2800 m above sea level. Administratively, Kunming comprises seven districts, one county-level city, and six counties (Fig. 1). Fig. 2 shows the system framework for the environmental risk assessment applied in this study.
2.2 Sources of risk and those at risk
The environmental risk sources (ERSs) treated were mainly tailings ponds, enterprises involved in hazardous chemicals (such as gas stations) and hazardous waste (such as hospitals), road transportation, centralized sewage treatment and garbage disposal operations, and oil and gas extraction facilities.14The primary environmental risk receptors (ERRs) in the context of water and atmospheric environments were considered in Kunming. Drinking water sources, major rivers, reservoirs, transboundary flows, and areas with a sensitive natural water ecology were considered as water environmental risk receptors (WERRs).36 On the other hand, the atmospheric environmental risk receptors (AERRs) were ordinary residents, those in institutions, cultural, and educational institutions, administrative agencies, enterprises, research organizations, railway stations, bus stations, shopping centers, parks, and other key population centers and protection units.37
2.3 Index system
 | (1) |
 | (2) |
 | (3) |
| Environmental risk index (RW,RA, RC) | Environmental risk |
|---|---|
| ≥50 | High |
| (40, 50) | Relatively high |
| (30, 40) | Medium |
| <30 | Low |
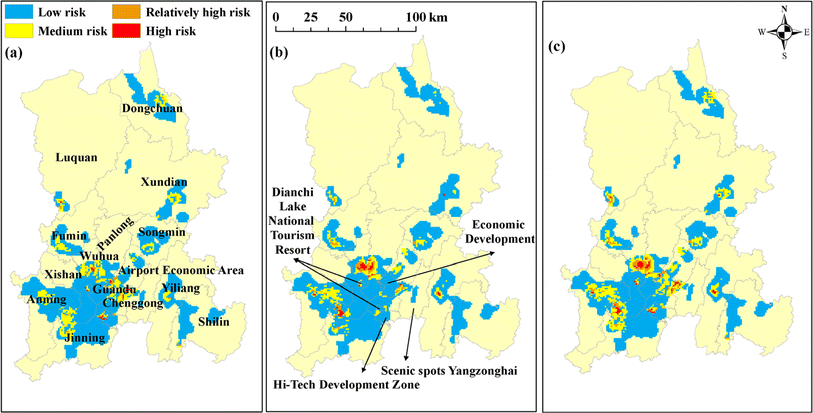
A gridded environmental risk analysis method was applied to those identified hotspots. This involved dividing the city into a grid of 1 km squares and then quantifying the environmental risk field intensity and the ERRs vulnerability index in each square of the grid. Doing so involved applying the principles of environmental risk field theory and environmental risk receptor vulnerability theory.38 Subsequently, the environmental risk value for each grid was computed. The calculation formula for the environmental risk values (Rx,y) for each grid is outlined below,
 | (4) |
The Rx,y values were used to define another set of four risk levels: high-risk (R > 80), relatively high-risk (60 < R ≤ 80), moderate risk (30 < R ≤ 60), and low-risk (R ≤ 30).38 Moreover, the environmental risk value for a specific assessment area can be calculated as the average of the corresponding grid risk values.
A linear decay function was assumed in calculating the water risk intensity fields. Assuming a maximum influence range of 10 km, the Ex,y for a specific grid square can be expressed as eqn (5).38
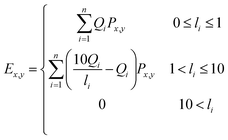 | (5) |
| Description | Value |
|---|---|
| The grid square is located within a national or provincial prohibited development zone | 100 |
| The grid square is located within the ecological red line outside a national or provincial prohibited development zone | 80 |
| The grid square is located outside any ecological red line | 40 |
Turning to the atmospheric pollution risk, although the overall elevation in the study area varies significantly, the specific research grids have relatively consistent elevations. This allows for the application of the region-growing method for determining the impact range of each risk source. Thus, the intensity of atmospheric environmental risk in a specific grid square can be represented as the following,
 | (6) |
 | (7) |
 | (8) |
3 Results
3.1 Distribution of ERSs and ERRs
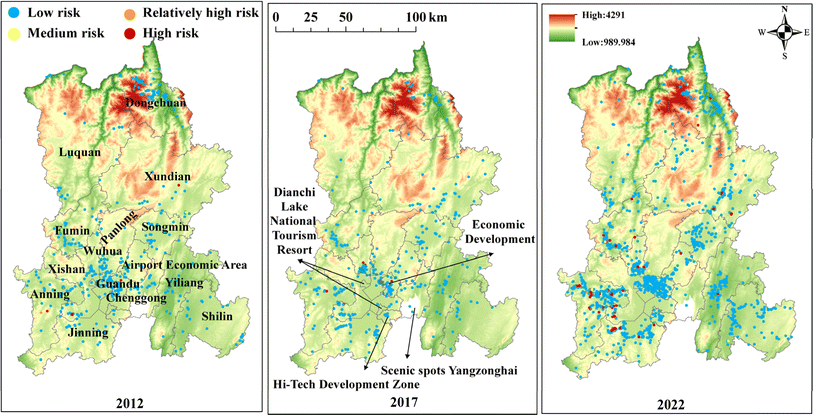
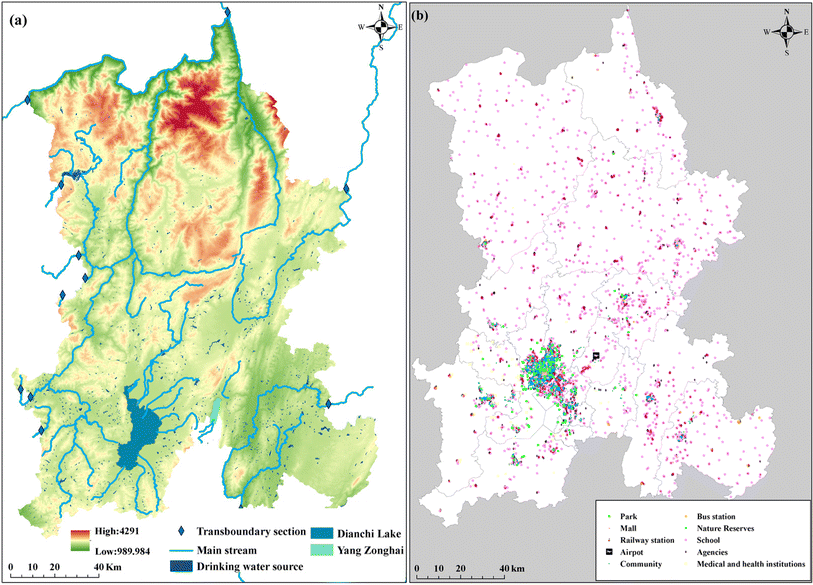
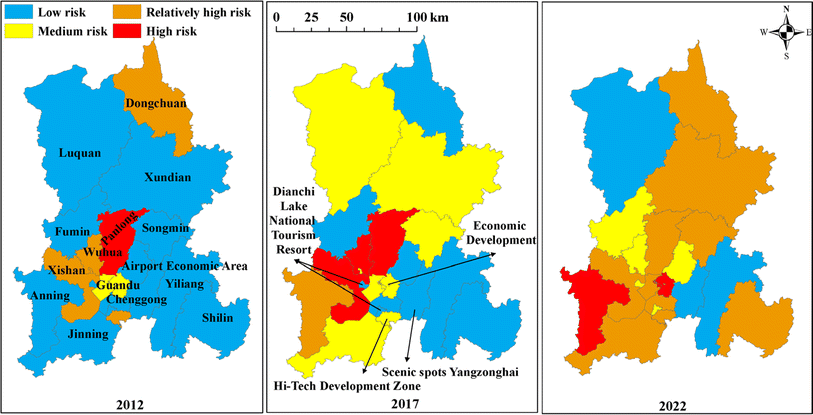
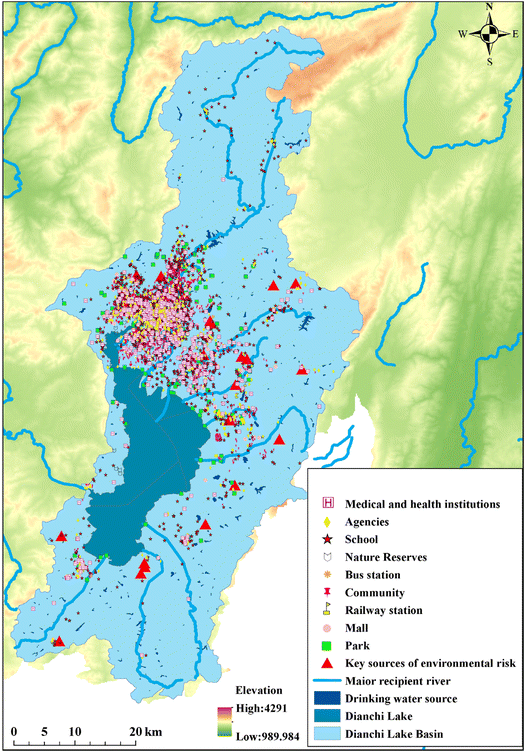
A five-year interval was chosen to capture significant trends and shifts over the period from 2012 to 2022. Fig. 3 presents the changes in the number and distribution of ERSs in Kunming from 2012 to 2022. Between 2012 and 2017, the ERSs were predominantly low-risk and concentrated mostly in the south-central part of Kunming. There was a major focus around Dianchi Lake and in northeastern Kunming. In 2022, 2467 ERSs in Kunming were confirmed, including 83 tailings ponds, 520 refueling (gas) stations, 62 sewage treatment plants, and 18 garbage disposal facilities (such as landfills). Compared to 2012, the number of ERSs had approximately quadrupled from 591 to 2467 in ten years. In the last decade, the increasing number of enterprises has also driven a continuous rise in the intensity of the environmental risk sources. During these years, the sources were widely distributed across the region but in clusters. Low-risk ERSs predominated, but high-risk areas, albeit smaller in size, exhibited annual growth. The high-risk zones are primarily characterized by their concentrations of industry, as in Anning, Dongchuan, and the Jinning Industrial Park.In Kunming, there are now a total of 985 WERRs, which includes 150 drinking water sources catering to around 9.6 million people, 56 major recipient rivers, 766 reservoirs and hydropower stations, 11 cross-city sections, and two ecologically red-lined areas (Dianchi Lake and Yangzonghai Lake) (Fig. 4a). There is a total of 11![[thin space (1/6-em)]](https://www.rsc.org/images/entities/char_2009.gif) 172 AERRs in the city, which comprise 3874 residential communities, 608 medical institutions, 2819 cultural and educational institutions, 235 shopping malls, 230 parks, 48 infrastructure facilities, including airports and passenger stations, and 3358 administrative agencies and enterprises (Fig. 4b).
172 AERRs in the city, which comprise 3874 residential communities, 608 medical institutions, 2819 cultural and educational institutions, 235 shopping malls, 230 parks, 48 infrastructure facilities, including airports and passenger stations, and 3358 administrative agencies and enterprises (Fig. 4b).
The WERRs and AERRs are mostly distributed around Dianchi Lake, in densely populated districts, and adjacent to rivers and drinking water source protection zones. This gives those areas heightened vulnerability. Overall, the vulnerability of the ERRs in Kunming tends to be greater in the south.
3.2 Regional risk ranking
Fig. S2† presents the atmospheric and water environmental risk ranking for Kunming's 19 administrative regions. In 2022, the distribution of comprehensive environmental risks was relatively dispersed. Three regions were categorized as having “Low” atmospheric pollution risk, 10 as “Medium”, 5 as “Relatively High”, and one as “High”. In terms of the water environmental risk ranks, one region was labeled as “Low” risk, 15 as “Medium”, and three as “Relatively High”. In terms of comprehensive environmental risk, 3 regions were classified as “Low”, with five as “Medium”, and nine as “Relatively High”. Additionally, two regions were identified as “High” risk. The high-risk areas were predominantly concentrated in Anning and Kunming's economic and technology development zones. They host a dense presence of high-risk industries, and a significant population, and are near ecology protection red lines. This underscores the necessity, in urban development, of prioritizing environmental risk management in areas with a concentration of industries and high population density.A detailed analysis at five-year intervals was performed to comprehensively assess the evolution of the environmental risks across Kunming's various administrative regions from 2012 to 2022. The specific analytical findings are presented in Fig. 5. Over that decade, Kunming's comprehensive environmental risks fluctuated, initially increasing, and subsequently decreasing. The number of high-risk areas rose from 1 in 2012 to 4 in 2017, while the relatively high-risk areas decreased from 2 in 2012 to 1 in 2017. The distribution of areas at risk shifted from an initially dispersed pattern to a concentration in industrial zones. Despite an annual increase in the number of risk sources due to the construction and tightening of environmental policies, the number of high-risk areas remained constant at four from 2017 to 2022, with the number of relatively high-risk areas increasing by four. In contrast, the number of medium-risk areas saw a significant decline, dropping from 6 in 2012 and 5 in 2017 to only 1 in 2022. Despite the rise in environmental risk sources, the increase in risk prevention capabilities led to a rise in low-risk areas. The number of low-risk areas increased from 7 in 2012 to 8 in 2017 and further to 9 in 2022. Those low-risk areas were mainly located in Konggang, Chenggong, Xundian, Yiliang, and Shilin, where there are few risk sources, low receptor vulnerability, and good prevention capabilities. In summary, the comprehensive environmental risk in Kunming has shown a dynamic change over the past decade, influenced by various factors.
3.3 Regions needing control
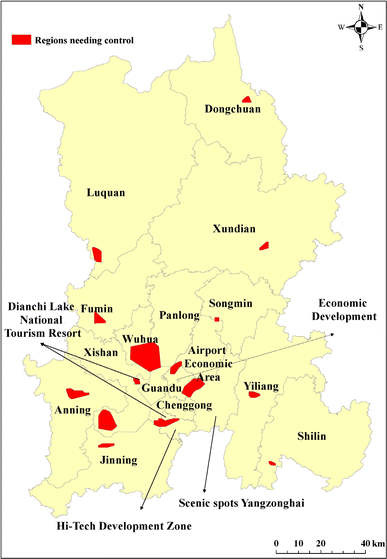
Based on the ERSs, ERRs, and hotspot areas identified in Kunming combined with the on-site data collection and the gridding, a list of 29 key control areas has been proposed. They take in nine industrial parks with a concentration of high-risk enterprises and 20 densely populated streets (Fig. 7). Most are within the Dianchi Lake basin.
Turning specifically to the Dianchi Lake basin, Dianchi Lake is one of the nine plateau lakes situated south of Kunming's main urban area. The basin has an area of 2920 km2, and 35 rivers flow into the lake. It is the site of two towns separate from the city of Kunming and five city drinking water sources. The basin's key environmental risk sources and places at risk are mapped in Fig. 8. The study identified Kunming's Wuhua, Panlong, Guandu, Xishan, and Jinning districts as particular water environmental risk receptors. They are the sites of the Songhuaba Reservoir, the Hongpo Village water source, the Dahe Reservoir, the Chaihe Reservoir, and some other drinking water sources. Additionally, rivers entering the lake, such as the Panlong River, must be included. The density of enterprises in the basin's five districts and counties is relatively high, including enterprises posing significant environmental risks. Also within the basin are businesses along the rivers, agricultural non-point sources, and routes for the transport of hazardous chemicals. In thus evaluating the key lakes and rivers, categorizing the environmental risks, and proposing location-specific prevention and control measures, the study can contribute to protecting Dianchi Lake more scientifically and accurately. This approach can contribute to the construction of an effective emergency prevention system for water pollution incidents.
3.4 Suggestions for handling unexpected incidents
These risk assessments allow proposing recommendations for managing environmental risk in the region. In areas at high environmental risk, the layout of regional industries should be optimized. Risky activities in the main urban and residential areas or environmentally sensitive areas should be relocated. Also, there should be a centralized control of the regional environmental risks. Firms in high-risk regions might be brought under central risk management and required to upgrade their production processes to minimize the use of environmentally hazardous substances. For medium risky activities, the industrial layout should be planned to prevent creating areas of greater environmental risk. For organizations in low-risk areas, environmental emergency plans and emergency situation drills may be enough. This proposed comprehensive framework should improve both the prevention and the control of environmental risks, thereby fostering sustainable development.Further, the following measures are recommended for the classification and management of WERRs like Dianchi Lake: establish a monitoring and early warning system in high-risk areas and environmentally sensitive targets under a regional framework; implement intensive monitoring during flood seasons, extreme weather, and major events. The early warning system should be able to identify risk factors in advance, manage them effectively, and mitigate the effects of any incidents that do occur. There should be regular joint emergency drills to test the operability and effectiveness of the collaborative prevention and control mechanisms and the emergency plans for sudden environmental events. This will also testing the emergency coordination, emergency monitoring, and emergency response plans. Advanced technologies and equipment, such as satellite remote sensing and drones, should be applied where applicable. Innovation in environmental emergency response lays a strong foundation for the proper management of sudden water and air pollution incidents.
4 Discussion
Ecological risk assessment is a potent instrument for managing risks by quantifying and mapping the risk levels across various regions and time periods.13 This methodology enables decision-makers to identify critical ecological risk areas and devise targeted strategies to address them.8 In mountainous urban areas, the challenge is to develop a localized risk assessment method that can accurately identify high-risk zones and provide effective risk prevention and control strategies. This study aimed to optimize the existing ecological risk assessment method to examine the western plateau mountain city of Kunming, systematically evaluate environmental risk from 2012 to 2022, and formulate practical risk prevention and control measures for vulnerable areas.As a critical node in the Yangtze River Economic Belt and an ecological safeguard for the upper Yangtze River, Kunming bears significant responsibilities and faces considerable challenges in environmental protection. These challenges are particularly pronounced in some areas, such as phosphate chemical pollution, phosphogypsum contamination, chemical environmental risk management, and the environmental risk management of multi-level water transfer basins.39 Additionally, both industrial manufacturing and road transportation are recognized as high-risk ERSs, each having experienced over 300 related incidents.6,40 The accuracy of spatial difference analysis is enhanced through the segmentation and overlay analysis of grid and administrative units in the evaluation process. Some scholars argue that since the 2008 financial crisis local governments have inadvertently created latent risks by reducing entry barriers for certain industries, such as chemicals, in an effort to stimulate economic development.41
The spatial clustering of environmental risk levels in administrative regions is not random but results from the interplay of various factors. Socioeconomic factors, such as population, GDP, and industrial development, play a crucial role in determining regional environmental risk levels (Fig. S3†). Population density and industrial output are positively correlated with the risk intensity (p ≤ 0.05, p ≤ 0.001, respectively). The correlation between GDP and environmental risk is weaker (correlation coefficient of 0.34), likely because higher GDP regions possess stronger economic capabilities to mitigate risks. From 2012 to 2022, Kunming's risk prevention capacity exhibited an upward trend. In 2017, Kunming's per capita GDP was significantly higher than in 2012. Although the per capita GDP in 2022 was lower than in 2017 due to the COVID-19 pandemic, Kunming has vigorously promoted “ecological civilization” since 2017. With successive water, air, and soil policies,42–45 Kunming's risk prevention capacity has rapidly improved. This improvement has played a crucial role in reducing the overall regional risk level.
Moreover, with the development of the economy, technology, and the improvement of relevant laws and regulations on water source protection areas in Kunming, residential areas near water sources are gradually expanding outward.46 This too has contributed to the increasing density of ERSs and ERRs around Dianchi Lake and their gradual spread into the surrounding regions over time. Areas like Jinning and Songming, despite their lower population density and GDP, have higher environmental risk levels due to the inherent fragility of the natural ecosystems.47,48 Therefore, it is essential to consider the interactions among multiple driving factors when formulating environmental risk management measures.
The improvement of risk prevention capacity can significantly reduce the overall regional risk level, but it is not the only approach. In the 1990s, the United States explicitly advocated for the development of a “green chemical industry” in the Pollution Prevention Act. This approach promotes the use of modern science and management methods to prevent pollution and enhance the safety of chemical production through source control models.49 Currently, the traditional chemical industry faces issues such as outdated technology, weak safety regulation systems, low concentration, and irrational park planning. Additionally, the progress in China's chemical industry is primarily driven by technological advancements rather than efficiency improvements, with low management efficiency remaining a negative factor in the development of green chemistry.50
“Green chemistry” can significantly reduce risks and ensure high-quality development in the chemical industry through source prevention, process control, and the integrated management of clean production technologies in traditional industries.51 The Chinese central government mandates a graded management approach to control environmental risks.52 For enterprises with lower environmental risks, raising public awareness, educating employees on risk prevention, and implementing self-regulation are sufficient. For higher-risk enterprises, self-regulation should be supplemented with regular reviews and evaluations by ecological and environmental departments. From the perspective of this study, an environmental risk zoning control system should be implemented. For high-risk areas, an environmental access list should be established to strictly control the addition and expansion of high-risk enterprises involving hazardous chemicals, hazardous waste, and tailings ponds. Existing high-risk enterprises should be systematically relocated or phased out. Additionally, regional emergency material reserves and emergency drills should be strengthened to enhance the emergency response capacity for managing environmental incidents.
5 Conclusions
This study integrated environmental risk assessment with grid-based risk analysis methods to prepare a comprehensive evaluation of the environmental risks pertinent to one Chinese city, namely Kunming. The results showed a fourfold surge in the number of sources of environmental risk over the last decade. They also showed that the sites most vulnerable to pollution are in the city's southern regions. Interestingly, in the decade from 2012 to 2022, comprehensive environmental risks relevant to Kunming initially increased and subsequently decreased. A comparative analysis of the risk levels of all environmental risk sources and the maximum storage capacity of hazardous substances in hotspot areas identified 136 enterprises and 29 key areas requiring closer regulation. Three measures for handling unexpected incidents and an emergency response process were proposed. The study's results provide a more scientific basis for the supervision and control of sources of risk in similar cities and regions.Data availability
The data supporting this article have been included as part of the ESI.†Conflicts of interest
The authors have no relevant financial or non-financial interests to disclose.Acknowledgements
This research was supported by the Foundation for Distinguished Young Talents of Yunnan Province (grant 202101AV070006), and the Yunnan Major Scientific and Technological Projects (grant 202302AG050001).References
- C. J. Rao and B. J. Yan, Study on the interactive influence between economic growth and environmental pollution, Environ. Sci. Pollut. Res., 2020, 27, 39442–39465 CrossRef.
- D. Juma, H. T. Wang and F. T. Li, Impacts of population growth and economic development on water quality of a lake: Case study of Lake Victoria Kenya water, Environ. Sci. Pollut. Res., 2014, 21, 5737–5746 CrossRef CAS.
- W. J. Du and M. J. Li, Assessing the impact of environmental regulation on pollution abatement and collaborative emissions reduction: Micro-evidence from Chinese industrial enterprises, Environ. Impact Assess., 2020, 82, 106382 CrossRef.
- H. Ling, X. Sun, X. Zhu, H. Wang and Y. Li, Ecological risk early warning under the pressure of rapid development of chemical industry: A case study of Lianyungang, J. Saf. Environ., 2010, 10, 111–116 Search PubMed.
- R. Y. Yin, X. Sun, W. W. Xu and X. D. Zhu, Spatial pattern of rapid chemical industrialization, environmental response, and macro-management strategies in coastal areas of Jiangsu, Acta Sci. Circumstantiae, 2011, 31, 1105–1114 CAS.
- G. Z. Cao, L. Yang, L. X. Liu, Z. W. Ma, J. N. Wang and J. Bi, Environmental incidents in China: Lessons from 2006 to 2015, Sci. Total Environ., 2018, 633, 1165–1172 CrossRef CAS.
- Y. Lei, X. Q. Zhou and L. Xie, Emergency monitoring and disposal decision support system for sudden pollution accidents based on multimedia information system, Multimed. Tools Appl., 2019, 78, 11047–11071 CrossRef.
- G. Z. Cao, Y. Gao, J. N. Wang, X. F. Zhou, J. Bi and Z. W. Ma, Spatially resolved risk assessment of environmental incidents in China, J. Clean. Prod., 2019, 219, 856–864 CrossRef.
- Y. R. Kim, M. Lee, J. Y. Jung, T. W. Kim and D. Kim, Initial environmental risk assessment of hazardous and noxious substances (HNS) spill accidents to mitigate its damages, Mar. Pollut. Bull., 2019, 139, 205–213 CrossRef CAS.
- L. W. Du, H. Z. Wang and H. Xu, Analysis of spatial-temporal association and factors influencing environmental pollution incidents in China, Environ. Impact Assess., 2020, 82, 106384 CrossRef.
- Q. Liu, X. Chen, J. Liu, L. Zhuo, F. Cai, X. Yan, L. Hu and Y. Shi, Characteristics and risk assessment of priority-controlled chemicals in water environment of chemical industrial parks, J. South China Normal Univ. Nat. Sci. Ed., 2019, 51, 58–65 Search PubMed.
- J. a. Wiens and K. R. Parker, Analyzing the effects of accidental environmental impacts: Approaches and assumptions, J. Appl. Ecol., 1995, 5, 1069–1083 CrossRef.
- H. X. Zhao, T. Y. Zhu, X. L. Luo, M. J. Niu, L. Zhang and B. J. Gu, Regional ecological risk assessment of chemical industry stress under China's coastal development strategy, J. Clean. Prod., 2022, 375, 134085 CrossRef.
- M. Yang, L. Y. Shi and B. Q. Liu, Risks assessment and driving forces of urban environmental accident, J. Clean. Prod., 2022, 340, 130710 CrossRef.
- Q. H. Zhang, Y. D. Xie, Y. Tian, M. Dzakpasu and X. C. Wanga, Acceptable risk assessment and management of environmental pollution emergency events base on distance model, Sci. Total Environ., 2023, 866, 161298 CrossRef CAS.
- C. Mahammedi, L. Mahdjoubi, C. A. Booth and T. E. Butt, Framework for preliminary risk assessment of brownfield sites, Sci. Total Environ., 2022, 807, 151069 CrossRef CAS PubMed.
- G. B. Rampanelli, A. B. Braun, C. Visentin, A. W. D. Trentin, R. da Cruz and A. Thomé, The process of selecting a method for identifying potentially contaminated sites-a case study in a municipality in Southern Brazil, Water, Air, Soil Pollut., 2021, 232, 26 CrossRef CAS.
- Y. F. Jiang, M. X. Huang, X. Y. Chen, Z. G. Wang, L. J. Xiao, K. Xu, S. Zhang, M. M. Wang, Z. Xu and Z. Shi, Identification and risk prediction of potentially contaminated sites in the Yangtze River Delta, Sci. Total Environ., 2022, 815, 151982 CrossRef CAS.
- M. Marzocchini, F. Tatàno, M. S. Moretti, C. Antinori and S. Orilisi, Proposal and application of a regional methodology of comparative risk assessment for potentially contaminated sites, Environ. Technol., 2019, 40, 3578–3592 CrossRef CAS PubMed.
- M. G. Andrisani, Relative risk assessment in support of the management of potentially contaminated megasites, Rend. Lincei Sci Fis., 2019, 30, 389–398 CrossRef.
- Y. F. Jiang, Q. H. You, X. Y. Chen, X. L. Jia, K. Xu, Q. Q. Chen, S. C. Chen, B. F. Hu and Z. Shi, Preliminary risk assessment of regional industrial enterprise sites based on big data, Sci. Total Environ., 2022, 838, 156609 CrossRef CAS.
- W. R. Munns, Assessing risks to wildlife populations from multiple stressors: Overview of the problem and research needs, Ecol. Soc., 2006, 11, 23 CrossRef.
- C. T. Hunsaker, R. L. Graham, G. W. Suter, R. V. O'Neill, L. W. Barnthouse and R. H. Gardner, Assessing ecological risk on a regional scale, Environ. Manag., 1990, 14, 325–332 CrossRef.
- X. G. Xu, H. P. Lin and Z. Y. Fu, Probe into the method of regional ecological risk assessment: A case study of wetland in the Yellow River Delta in China, J. Environ. Manag., 2004, 70, 253–262 CrossRef PubMed.
- H. Q. Wang, H. Ye, L. Liu and J. X. Li, Evaluation and obstacle analysis of emergency response capability in China, Int. J. Environ. Res. Publ. Health, 2022, 19, 10200 CrossRef.
- Y. Z. Zhai, X. B. Zhao, Y. G. Teng, X. Li, J. J. Zhang, J. Wu and R. Zuo, Groundwater nitrate pollution and human health risk assessment by using HHRA model in an agricultural area, NE China, Ecotoxicol. Environ. Saf., 2017, 137, 130–142 CrossRef CAS.
- J. S. Wu, Q. L. Zhu, N. Qiao, Z. Y. Wang, W. Sha, K. Y. Luo, H. L. Wang and Z. Feng, Ecological risk assessment of coal mine area based on "source-sink" landscape theory – A case study of Pingshuo mining area, J. Clean. Prod., 2021, 295, 126371 CrossRef.
- L. Pizzol, A. Critto, P. Agostini and A. Marcomini, Regional risk assessment for contaminated sites Part 2: Ranking of potentially contaminated sites, Environ. Int., 2011, 37, 1307–1320 CrossRef PubMed.
- S. Bartke, S. Martinat, P. Klusacek, L. Pizzol, F. Alexandrescu, B. Frantal, A. Critto and A. Zabeo, Targeted selection of brownfields from portfolios for sustainable regeneration: User experiences from five cases testing the Timbre Brownfield Prioritization Tool, J. Environ. Manag., 2016, 184, 94–107 CrossRef PubMed.
- Y. Liu, W. Z. Yue, P. L. Fan, Z. T. Zhang and J. N. Huang, Assessing the urban environmental quality of mountainous cities: A case study in Chongqing, China, Ecol. Indicat., 2017, 81, 132–145 CrossRef.
- J. G. Liu and J. Diamond, China's environment in a globalizing world, Nature, 2005, 435, 1179–1186 CrossRef CAS.
- P. L. Fan, J. Q. Chen and R. John, Urbanization and environmental change during the economic transition on the Mongolian Plateau: Hohhot and Ulaanbaatar, Environ. Res., 2016, 144, 96–112 CrossRef CAS.
- M. Das, A. Das and R. Pandey, A socio-ecological and geospatial approach for evaluation of ecosystem services to communities of the Eastern Himalayan Region, India, Environ. Sci. Pollut. Res., 2023, 30, 116860–116875 CrossRef PubMed.
- S. Zhang, Y. Q. Zhou, R. Yu, X. B. Xu, M. Xu, G. Li, W. J. Wang and Y. F. Yang, China's biodiversity conservation in the process of implementing the sustainable development goals (SDGs), J. Clean. Prod., 2022, 338, 130595 CrossRef.
- X. L. Shen, M. Z. Liu, J. O. Hanson, J. Y. Wang, H. Locke, J. E. M. Watson, E. C. Ellis, S. Li and K. P. Ma, Countries' differentiated responsibilities to fulfill area-based conservation targets of the Kunming-Montreal Global Biodiversity Framework, One Earth, 2023, 6, 548–559 CrossRef.
- L. R. R. Williams and L. A. Kapustka, Ecosystem vulnerability: A complex interface with technical components, Environ. Toxicol. Chem., 2000, 19, 1055–1058 CAS.
- A. Baklanov, A. Aloyan, A. Mahura, V. Arutyunyan and P. Luzan, Evaluation of source-receptor relationship for atmospheric pollutants using approaches of trajectory modelling, cluster, probability fields analyses and adjoint equations, Atmos. Pollut. Res., 2011, 2, 400–408 CrossRef CAS.
- Ministry of Ecology and Environment of the People's Republic of China, Recommended Method for Risk Assessment of Sudden Environmental Incidents in Administrative Regions, Standard, 2018, 000014672/2018-00150 Search PubMed.
- J. Zeng, G. L. Han, Q. X. Wu, Q. Ma, S. J. Mao, X. Ge, Z. J. Wang and C. Yang, Evolution and determinants of precipitation chemistry in a plateau city, China: Insight from the pollutants source identification and environmental effect, Urban Clim., 2024, 55, 101872 CrossRef.
- J. Yang, F. Y. Li, J. B. Zhou, L. Zhang, L. Huang and J. Bi, A survey on hazardous materials accidents during road transport in China from 2000 to 2008, J. Hazard. Mater., 2010, 184, 647–653 CrossRef CAS PubMed.
- J. Li, S. Hu, D. Chen, X. Song, Q. Zhang, J. Fan, G. Li, S. Ma and Y. Jin, An analysis of industrial linking technologies and the development direction for the green chemical industry, Strateg. Study CAE, 2017, 19, 72–79 Search PubMed.
- Yunnan Provincial Committee of the Communist Party of China, Yunnan Province's Leading Plan for Ecological Civilization Construction (2021-2025), Standard, 2022, 53000014/202205915 Search PubMed.
- General Office of Yunnan Provincial People's Government, Yunnan Province Water Pollution Prevention and Control Work Plan, Standard, 2016, 53000002/202008333 Search PubMed.
- General Office of Yunnan Provincial People's Government, Implementation Plan for Air Pollution Prevention and Control Action in Yunnan Province, Standard, 2014, 53000000102201611044 Search PubMed.
- General Office of Yunnan Provincial People's Government, Yunnan Province Soil Pollution Prevention and Control Work Plan, Standard, 2017, 53000000102201710028 Search PubMed.
- People's Government of Yunnan Province, Notice on Issuing the Three Year Action Plan for Promoting the Integration of Urban and Rural Water Supply in Yunnan Province, Standard, 2022, 53000000207/202200103 Search PubMed.
- U. M. Mörtberg, B. Balfors and W. C. Knol, Landscape ecological assessment: A tool for integrating biodiversity issues in strategic environmental assessment and planning, J. Environ. Manag., 2007, 82, 457–470 CrossRef.
- J. Bai, J. L. Li, A. M. Bao and C. Chang, Spatial-temporal variations of ecological vulnerability in the Tarim River Basin, Northwest China, J. Arid Land, 2021, 13, 814–834 CrossRef.
- Y. F. Li, J. H. Qiu, B. Zhao, M. Pavao-Zuckerman, A. Bruns, S. Qureshi, C. Zhang and Y. Li, Quantifying urban ecological governance: A suite of indices characterizes the ecological planning implications of rapid coastal urbanization, Ecol. Indicat., 2017, 72, 225–233 CrossRef.
- Y. J. Zhang, Y. Song and H. Zou, Transformation of pollution control and green development: Evidence from China's chemical industry, J. Environ. Manag., 2020, 275, 111246 CrossRef CAS.
- Q. Hao, J. P. Tian, X. Li and L. J. Chen, Using a hybrid of green chemistry and industrial ecology to make chemical production greener, Resour. Conserv. Recycl., 2017, 122, 106–113 CrossRef.
- The State Council of the People's Republic of China, 13th Five Year Plan for Ecological Environment Protection, Standard, 2016, 000014349/2016-00234 Search PubMed.
Footnote |
| † Electronic supplementary information (ESI) available. See DOI: https://doi.org/10.1039/d4em00449c |
| This journal is © The Royal Society of Chemistry 2025 |

