
 Open Access Article
 This Open Access Article is licensed under a Creative Commons Attribution-Non Commercial 3.0 Unported Licence
Emerging investigator series: identification and transformation of per/polyfluoroalkyl substances (PFASs) in residential wastewater and effluent from alternative treatment systems†
Rachel
Smolinski
a,
Meghan
Oates
b,
Arjun K.
Venkatesan
 c,
Christopher J.
Gobler
bd and
Carrie A.
McDonough
*a
c,
Christopher J.
Gobler
bd and
Carrie A.
McDonough
*a
aDepartment of Chemistry, Carnegie Mellon University, Pittsburgh, PA, USA. E-mail: cmcdonou@andrew.cmu.edu
bNew York State Center for Clean Water Technology, Stony Brook University, Stony Brook, NY, USA
cDepartment of Civil and Environmental Engineering, New Jersey Institute of Technology, Newark, NJ, USA
dSchool of Marine and Atmospheric Sciences, Stony Brook University, Stony Brook, NY, USA
First published on 9th June 2025
Abstract
Onsite wastewater treatment systems (OWTSs) are designed for the removal of pathogens and nutrients from septic effluent. However, many other contaminants are widespread in wastewater including pharmaceuticals, personal care products, and other trace organic chemicals. We analyzed per/polyfluoroalkyl substances (PFASs) in residential septic effluent and investigated their fate in nitrogen-removing biofilters (NRBs), an innovative and alternative type of OWTS. We measured concentrations of 22 targeted PFASs in septic effluent pre- and post-NRB treatment in nine residential OWTSs. We measured total PFAS in septic effluent ranging from 42 to 9795 ng L−1 and in NRB effluent ranging from 72 to 2575 ng L−1, corresponding to estimated effluent loads of 39 to 1423 mg PFASs per household per year. Perfluoroalkyl carboxylates (PFCAs) were generally enriched in NRB effluent versus influent while perfluoroalkyl sulfonates appeared to be partially removed during NRB treatment. Grab sampling results were highly variable but passive sampling (microporous polyethylene tubing containing WAX sorbent) consistently showed greater PFAS levels post-NRB treatment. High-resolution mass spectrometry screening of composited grab samples using two different workflows (suspect screening and untargeted analysis with ion mobility spectrometry) resulted in tentative identifications of 40 additional PFASs not included on the target list. The average mass defect of features identified as potential PFASs was significantly lower (p = 0.014) in post-NRB samples. This, along with increasing concentrations of PFCAs in effluent, suggested transformation of precursors to end products with greater fluorinated character in the NRB.
Environmental significancePer/polyfluoroalkyl substances (PFASs) are highly persistent water pollutants that are now ubiquitous in global water resources. Some PFASs (such as perfluorooctanoate (PFOA) and perfluorooctane sulfonate (PFOS) are known to be toxic and bioaccumulative. Municipal wastewater is a known source of PFASs but the role of decentralized residential septic systems as sources of PFASs has not been described in detail. This study reports on the occurrence of known and tentatively-identified novel PFASs in residential wastewater, demonstrating the use of three different analytical workflows for PFAS characterization in environmental samples. Further, our data suggest the likely transformation of PFAS precursors to more highly fluorinated products such as perfluoroalkyl acids in nitrogen-removing biofilters used as post-septic treatment, consistent with literature describing municipal treatment facilities. |
1. Introduction
Per/polyfluoroalkyl substances (PFASs) are highly persistent pollutants linked to numerous adverse health effects in humans and wildlife.1,2 Due to their widespread applications and recalcitrance, PFASs are ubiquitous in the environment. There are numerous household sources of PFASs including textiles,3,4 food packaging,5 and personal care products,3,6,7 raising concerns about residential wastewater contributions of PFASs to water resources.8,9 PFASs have been detected in all corners of the world and are often detected in groundwater and private drinking water wells.8,10,11 With drinking water as one of the major routes of human PFAS exposure,12 there is marked interest in reducing PFAS loads to aquifers.13,14PFASs have been detected in municipal wastewater treatment plants (WWTPs) around the world15–19 with reports of total PFASs in treated effluent ranging from 15–1500 ng L−1,20 well above recent US EPA maximum contaminant levels (MCLs). Levels of perfluorinated alkyl acids (PFAAs) often increase as a result of wastewater treatment as they are generated via precursor (pre-PFAA) transformation.16,20,21 In traditional targeted analyses, the majority of pre-PFAAs are overlooked due to the lack of available reference standards and poor amenability of some pre-PFAAs to traditional analytical methods.22 Total pre-PFAA levels can be inferred using the total oxidizable precursor (TOP) assay,23 which pairs targeted LC-MS/MS analysis with sample oxidation, which is expected to break down the majority of precursors to measurable PFAAs. These methods can help to determine total amount of PFASs present in samples, though in most cases the specific structures remain unknown.24–26 Extractable organofluorine (EOF) typically does not vary greatly between wastewater influent and effluent, though observations have shown the percentage of explained organofluorine to increase in effluent, providing additional evidence of likely transformation of unidentified pre-PFAAs.27
Despite 25% of the United States population being served by onsite wastewater treatment systems (OWTSs) rather than municipal WWTPs, knowledge is lacking concerning the occurrence and fate of trace organic compounds (TOrCs) such as PFASs in these systems. In traditional OWTSs, raw wastewater flows from a home, business, or small cluster of buildings to a septic tank where solids settle and decompose over time. Effluent then flows into a drain field or cesspool and is dispersed into the receiving soil environment. Subedi et al. (2015) measured PFASs in septic tank effluent (ND – 99 ng L−1) with high detection frequencies, indicating that PFASs are introduced to the environment via residential use.28 However, collecting representative samples from highly variable, household-specific systems is challenging.29 Grab samples from OWTSs provide only a snapshot of wastewater fluctuations at a given time. Furthermore, grab sampling for influent and effluent are often done on the same day, which does not account for the residence time of the treatment system.30 Passive sampling has been demonstrated to monitor pharmaceuticals, pesticides, hormones, and PFASs in wastewater and groundwater.11,31–33 Kinetic passive samplers consist of a stationary phase in which compounds of interest can accumulate on the order of weeks, providing a means to determine a time-averaged TOrC abundance over a given deployment period.31 They offer improved sensitivity and typically result in more representative samples in highly variable systems, making them a promising tool for monitoring PFASs and other TOrCs in OWTSs.
Significant efforts have been underway to reduce nutrient loads to surface waters on Long Island (NY) using innovative and alternative OWTSs (I/A OWTSs); however, information is limited with respect to the fate of TOrCs in I/A OWTSs. PFASs have been detected in Long Island groundwater which feeds municipal drinking water treatment facilities for residents,34,35 and despite the presence of more than 350![[thin space (1/6-em)]](https://www.rsc.org/images/entities/char_2009.gif) 000 OWTSs across Suffolk County,36 the role OWTSs play in contributing PFASs to groundwater has yet to be directly assessed. One type of I/A OWTS being evaluated on Long Island is the nitrogen removing biofilter (NRB), a soil-based treatment unit designed to remove reactive nitrogen from septic tank effluent.30,37,38 While NRBs have been studied primarily for the purpose of nitrogen removal, they are also reported to remove some TOrCs including several pharmaceuticals and 1,4-dioxane.37,39,40 In this study, we investigated the presence and fate of PFASs in nine residential NRBs and estimated PFAS loads entering groundwater from OWTS effluent to inform future OWTS development.
000 OWTSs across Suffolk County,36 the role OWTSs play in contributing PFASs to groundwater has yet to be directly assessed. One type of I/A OWTS being evaluated on Long Island is the nitrogen removing biofilter (NRB), a soil-based treatment unit designed to remove reactive nitrogen from septic tank effluent.30,37,38 While NRBs have been studied primarily for the purpose of nitrogen removal, they are also reported to remove some TOrCs including several pharmaceuticals and 1,4-dioxane.37,39,40 In this study, we investigated the presence and fate of PFASs in nine residential NRBs and estimated PFAS loads entering groundwater from OWTS effluent to inform future OWTS development.
2. Materials and methods
2.1 Sample collection
:50 v:v).37 The lined configuration includes a liner encasing the sand:woodchip layer to maintain saturation, and the woodchip box system consists of a sand layer which flows into a woodchip-containing box prior to dispersal.37 Sites 1, 3, and 5 were lined NRBs; sites 4, 6, and 7 were woodchip box systems; sites 8, 9, and 11 were unlined NRBs.
Grab samples were collected using a peristaltic pump from the septic tank effluent (NRB influent) and NRB effluent reservoirs at each site. Samples were collected directly into clean, prelabeled 15 mL polypropylene centrifuge tubes. Field blanks of deionized water were passed through the sampling pump and collected on each sampling date during the October–November 2022 sampling trip for a total of three field blanks. One set of duplicate samples was also collected during each October–November sampling trip for a total of three field duplicate samples. Neither field blanks nor duplicates were collected during June 2022 sampling. All collected samples were stored at −30 °C until extraction.
2.2 Sample extraction
:1 water:methanol. Each sample was spiked with 0.2 ng (2 μL) of a mixture of 23 mass-labelled PFASs (Wellington Laboratories, Table S1†), vortexed for two minutes, then centrifuged at 1400×g for 20 minutes to remove suspended particulates. The resulting supernatant was filtered with 0.2 μm polyether sulfone (PES) membrane syringe filters and concentrated to near-dryness under nitrogen. Final samples were reconstituted with 300 μL of 0.1% v/v acetic acid in 1:1 water:methanol. Injection standard (0.2 ng M4PFOA) was added to each sample right before analysis. Laboratory extraction blanks and matrix spikes were prepared in triplicate using LCMS-grade Optima water as the matrix match. Average matrix spike recoveries of all target PFASs fell between 68 and 135%. Matrix spike recoveries and laboratory blank concentrations are detailed in Table S1 and Fig. S1.†
:1 water:methanol, and injection standard (4 ng M4PFOA) was spiked into each prior to analysis.
Due to differences in NRB influent and effluent water quality, there was concern that passive sampling rates may be significantly different in influent and effluent, potentially posing a challenge in direct comparisons of influent and effluent concentrations. To evaluate relative mPE sampling rates in influent and effluent, we also analyzed sucralose and ibuprofen signals in the mPEs. Sucralose is a known conservative tracer in wastewater studies42,43 while ibuprofen is expected to be effectively removed.44 Given that mPEs should represent time-averaged concentrations, we reasoned that sucralose would be expected to remain at similar levels in influent and effluent mPEs, while ibuprofen would decrease from influent to effluent, assuming that sampling rates were similar in both groups of samplers. Extracted peak areas of sucralose and ibuprofen were normalized to the mass-labeled PFASs with the closest retention time to minimize analytical matrix effects, as we did not spike labeled analogs for sucralose and ibuprofen prior to extraction.
2.3 Data acquisition and analysis
The limit of quantitation (LOQ) was defined for each analytical run by choosing the greater value between (i) the lowest calibration point falling within ±30% of its known value and having an S/N ≥ 10 or (ii) the field blank average concentration plus three times the standard deviation. LOQs for grab samples (Table S1†) ranged from 0.74 ng L−1 (PFOS and PFHxS in all grab samples) to 282 ng L−1 (PFOS in site 3 grabs taken during mPE sampling). LOQs in mPEs ranged from 0.02 ng per sampler for several PFASs to 50 ng per sampler for 6:2 FTS.
Values below the detection limit (<DL; no peak observed with S:N > 10:1) were replaced with 0 and values <LOQ were replaced with LOQ/2 in all visualizations and calculations. All calibration curves were linear with 1/x weighting and included at least four calibration points except PFDS in one instance (June grab samples). All LOQs and calibration curve statistics are in Table S1.† Chromatographic peaks outside of ±0.20 minutes of expected retention time or ±10.0 ppm mass error were rejected and defined as <DL. Analytes with detection frequency <50% for a given sample set (e.g., all grab samples, site 3 grab samples, passive samplers) were excluded from further analysis, interpretation, and visualizations unless otherwise noted. Raw, uncensored concentrations for all grab samples are provided in Table S3.† Two data points were extrapolated based on the calibration curve as their measured concentrations were greater than the highest calibration level (site 3 (PFBA) and site 5 (6:2 FTS) influent, June 2022).
The first set of grab samples (June 2022) was not analyzed with a calibration curve, thus were quantified using a representative calibration curve from a separate batch. Samples could not be re-analyzed with a curve as sample volume was limited. The external quantitation was validated by determining the accuracy of method spikes that were analyzed with the June 2022 grabs. The average method spike recoveries (Table S1†) fell within 60–140% for all compounds. Field blanks were not collected alongside the first set of grab samples, therefore field blank LOQs determined from the October–November grab samples were used for the June grab samples. All remaining sample batches were analyzed in the same analytical run as a calibration curve.
First, data was acquired for mass-to-charge (m/z) ratios between 100 and 1700 Da using data-dependent acquisition (DDA) to collect MS/MS fragmentation spectra for the two most abundant ions per cycle at three collision energies (0, 15, and 35 eV). In a second injection, samples were analyzed using All Ions mode with 4 bit multiplexing, without fragmentation, and the drift cell was turned on for ion mobility spectrometry (IMS) to collect drift time measurements for all features with m/z 55–1700 Da. To convert drift times to collision cross section (CCS), a CCS calibration file was acquired with identical MS parameters at the beginning of the analytical run, using a QTOF LC/MS ESI tuning mix (Agilent Technologies).
Suspect screening was completed following the workflow outlined in Fig. 1. Samples were binned into their respective groups (influent, effluent, blanks) and features were matched using formulas listed in the NORMAN S89 PFAS database46 in MassHunter Profinder software. Suspect screening matches were filtered as follows: ion count >2, mass error <10.0 ppm, retention time (RT) alignment across sample files within 0.5 minutes, peak height >1000, and detection in 3/3 triplicate injections for at least one sample type (e.g., influent). Resulting peaks were then subject to RT filtering. Data from all target analytes was used to establish a linear relationship between m/z and RT. Predicted RTs were then calculated for each m/z based on the observed relationship and compared to the observed RTs. Because all PFAS standards fell within 4.0 minutes of the line of best fit, ±4.0 minutes was considered a reasonable threshold for differences between predicted and observed RTs. Suspect matches with RTs outside of the predicted value ±4.0 minutes were discarded. Suspects with sample peak areas <10× the average peak area in field blanks were also discarded. The remaining identifications were subject to structural elucidation by fragmentation (MS/MS) analysis when possible and identification confidence levels were assigned as recommended by Charbonnet et al. (2022).47
 | ||
| Fig. 1 Qualitative data analysis workflow. Data were acquired using two approaches, data-dependent acquisition (DDA) and ion mobility QTOF-MS for nontarget analysis (NTA). | ||
Data acquired with the second approach (All Ions with drift time measurements) were processed using Agilent Mass Profiler and FluoroMatch IM to prioritize potential PFASs based on homologous series detection. Data processing details are described in the Text S1.† Similarly to suspect screening, suspected PFASs were required to have a signal greater than 10× the field blank average and be present in 3/3 of the replicate injections. An m/z vs. CCS filter was then applied to filter out features unlikely to be PFASs. Similar approaches have been demonstrated by Foster et al. 2022 and Kirkwood-Donelson et al. 2023, where an upper threshold was defined to prioritize likely PFASs in CCS vs. m/z space. Here, a CCS vs. m/z linear relationship was first determined for target PFASs (Fig. S2†). CCS values for the remaining extracted features were then compared to values predicted based on the observed relationship. It was determined that 96% of FluoroMatch IM library values (n = 194) fell within a ±10% deviation of the linear regression, thus ±10% of the predicted value was considered an appropriate range for CCS values of likely PFASs, and these features were retained for further characterization. Confidence levels for all PFASs identified by suspect and nontarget analysis were assigned based on the PFAS Confidence Scale47 and are reported in Table S4.†
3. Results and discussion
3.1 Concentrations and composition of PFASs in wastewater across nine NRBs
The average effluent discharge from OWTSs was estimated to be 1.07 mg PFAS per household per day, or 390 mg per household per year based on discharge of 400 gallons (1514 L) of water per day (average household use in the United States (US EPA, 2017)). Of 26 targeted PFASs, 22 were detected in at least one grab sample and 19 were detected in at least one influent/effluent pair (Table S5†). Six of these PFASs were >DL but never measured >LOQ. Concentrations of the 11 frequently-detected (DF >50% in influent and/or effluent samples) PFASs are in Table 1. PFCAs were generally the most abundant PFAS subclass contributing to total wastewater loads, with average percent contributions of 46 ± 40% in influent and 58 ± 36% in effluent samples. Median concentrations of most PFCAs (5 out of 7 in Table 1) were higher post-NRB, which is consistent with numerous WWTP studies, including one Australian study in which both average and median concentrations of C6–C11 PFCAs increased during treatment.17 Increasing PFCAs are often indicative of transformations of pre-PFAAs during treatment,16,27 though grab sampling itself also likely contributes to this variability.48 Detection frequencies of the majority (9 out of 11) of frequently detected PFASs were greater in effluent, consistent with several other studies of PFASs in municipal WWTPs,15,17,19,49 providing additional evidence suggesting pre-PFAA transformation across systems.| Influent concentration (ng L−1) | Effluent concentration (ng L−1) | Detection frequency | ||||||
|---|---|---|---|---|---|---|---|---|
| Median | Minimum | Maximum | Median | Minimum | Maximum | Influent | Effluent | |
| PFBA | 29 | 4.6 | 8400 | 20 | <DL | 1800 | 100% | 94% |
| PFPeA | 3.7 | <DL | 89 | 15 | <DL | 89 | 63% | 94% |
| PFHxA | 14 | <DL | 78 | 21 | 2.0 | 96 | 94% | 100% |
| PFHpA | 0.8 | <DL | 160 | 25 | 0.5 | 25 | 69% | 100% |
| PFOA | 6.7 | <DL | 65 | 7.6 | 6.9 | 46 | 81% | 100% |
| PFNA | 0.4 | <DL | 8.8 | 0.7 | <DL | 8.5 | 56% | 53% |
| PFDA | <DL | <DL | 69 | <DL | <DL | 360 | 44% | 53% |
| PFBS | 0.3 | <DL | 850 | 5.2 | 0.4 | 170 | 56% | 100% |
| L-PFHxS | 0.5 | <DL | 130 | 2.0 | <DL | 14 | 69% | 94% |
| L-PFOS | 2.1 | <DL | 1400 | 2.0 | 0.4 | 420 | 75% | 100% |
| 6:2 FTS |
58 | <DL | 3600 | 159 | ND | 1600 | 56% | 76% |
Short-chain PFAAs (PFHxA, PFHpA, and PFBS) were >DL in 100% of effluent samples (n = 17), as were long-chain PFOA and PFOS. PFBA and PFHxA were the most frequently detected PFASs in influent samples (100% and 94%, respectively), followed by PFOA (DF = 81%) and PFOS (DF = 75%). Studies of municipal WWTPs in China,50 Australia,19 and Canada15 also observed frequent detection of PFBA, PFHxA, PFHpA, PFOA, and PFOS, and these PFAS are frequently detected in consumer products.4
Median PFAS concentrations in effluent from this study were similar to average concentrations measured in effluent collected from six municipal WWTPs discharging into San Francisco Bay in Fall 2014 (avg = 111.8 ng L−1),21 and the contribution of short-chain PFCAs (<C8) was higher here (96%; median) than average short-chain contributions in some previous studies (37%,51 45%,19 59%,21 64%17), possibly reflecting continued effects from the phase-out of longer-chain PFASs.21 Median influent and effluent concentrations reported here were also fairly similar to those reported for 19 Australian WWTPs by Coggan et al.17 and for 27 Canadian WWTPs in 2021 by Gewurtz et al.,15 showing agreement in relative concentrations to WWTPs.
3.2 Changes in PFAS mixture composition during NRB treatment
Maximum concentrations at individual sites were much greater than typical municipal WWTP studies. The largest individual contributors were 6:2 FTS (47%) and PFBA (25%) and the remaining PFASs in NRBs each accounted for less than 10% of total effluent concentrations, despite municipal WWTP studies reporting PFHxA, PFOA, and PFOS as the largest contributors to total wastewater concentrations.17 In individual systems, ∑22PFAS ranged from 42 to 9795 ng L−1 pre-NRB treatment and from 72 to 2575 ng L−1 in treated NRB effluent (Fig. S3 and Table S3†). The composition of PFASs in influent and effluent from each system is shown in Fig. 2. Site 3 had the highest ΣPFAS concentrations in both influent and effluent at both time points, where PFBA was the largest contributor in June and PFOS was the largest contributor from October–November. Influent concentrations were over 2000 ng L−1 at both time points, well over median ΣPFAS influent concentrations of 741 ng L−1 and 80 ng L−1 in June and October–November, respectively. June influent and effluent concentrations were dominated by 6:2 FTS in the summer samples (>50% in 12/18 measurements) and influent concentrations of 6:2 FTS were over 1000 ng L−1 at sites 1, 4, and 5.
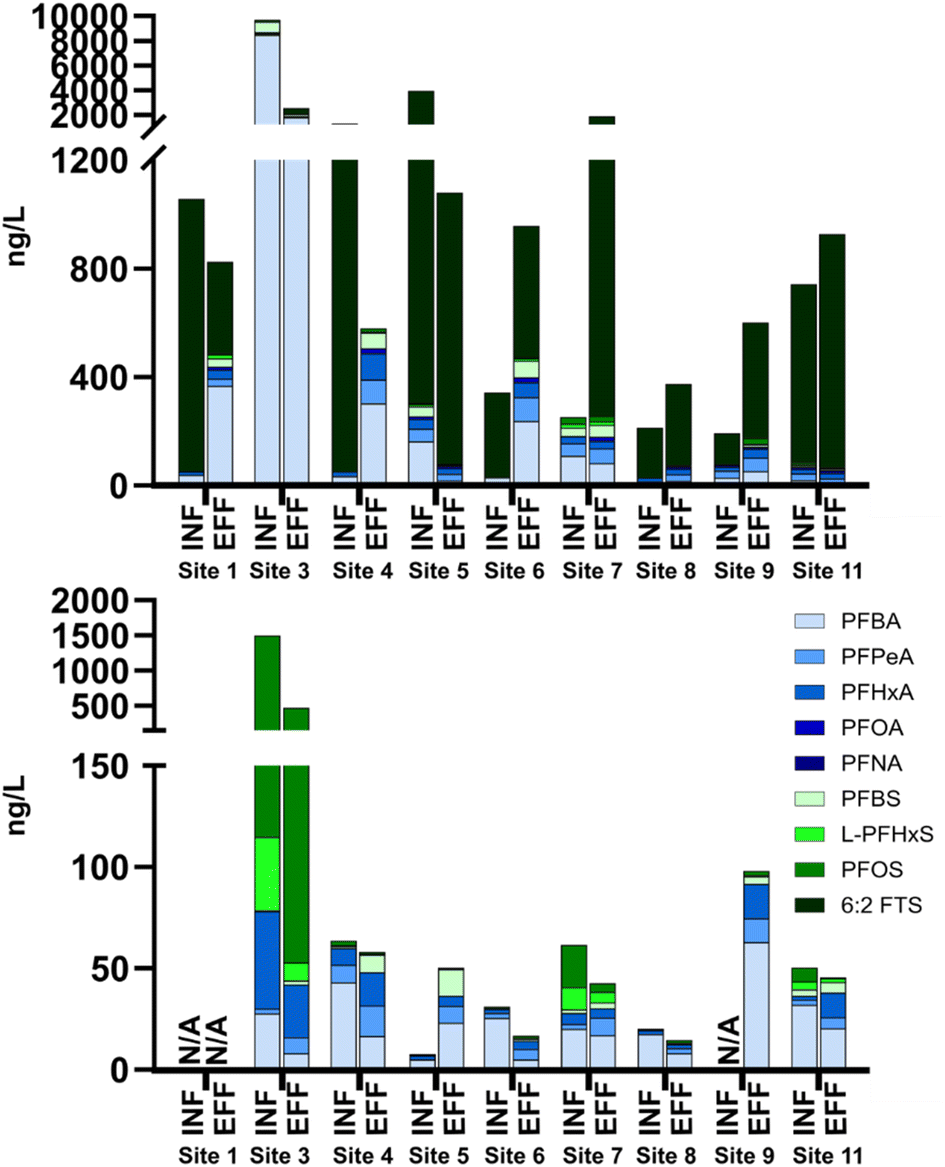 | ||
| Fig. 2 PFAA concentrations in influent and effluent of nine NRBs from grab sampling in June (upper) and October–November (lower). Branched isomers were not differentiated during the analysis of June grab samples. N/A indicates a sample that was not collected. | ||
Interestingly, similar observations have been made in other recent studies of municipal WWTPs. In some cases, 6:2 FTS is the most abundant PFAS, though levels are highly variable. Coggan et al.17 noted high contributions from 6:2 FTS with maximum concentrations of 61 ng L−1 in influent, similar to the median influent concentration (58 ng L−1) in this study but much lower than the maximum concentration observed here (3600 ng L−1). In samples collected in 2021, Gewurtz et al. reported median 6:2 FTS in influent and effluent that were below limits of quantitation in all wastewater influent and effluent samples.15 However, they measured maximum 6:2 FTS concentrations of 222 ng L−1 and 171 ng L−1 in influent and effluent, respectively, in 2019,15 similar to median levels here (58 ng L−1 influent; 159 ng L−1 effluent). In samples collected from 2018 to 2019, Gewurtz et al. measured maximum 6:2 FTS at 1060 ng L−1 in influent and 589 ng L−1 in effluent, attributed to inputs from landfill leachate.15 Gobelius et al. reported a median 6:2 FTS concentration of 110 ng L−1 and noted a dominance of 6:2 FTS in a wastewater treatment plant, potentially originating from a PFAS-contaminated site.18 In a 2016 study of 6 WWTPs, one plant was found to have elevated concentrations of 6:2 FTS, but was attributed to contributions from an airport.21 The wide range of concentrations measured and episodic occurrence of elevated 6:2 FTS levels likely points to rapid changes in inputs and source contributions over time, as well as temporal shifts in PFAS manufacturing. For example, some WWTPs receive influent from manufacturing facilities while others receive primarily residential waste.20,21,52 The high 6:2 FTS levels in this study compared to previous work on municipal wastewater could be due to the lack of community dilution in septic systems relative to WWTPs. Ultimately, an explanation for elevated 6:2 FTS observed in NRB wastewater collected in June cannot be deduced without further investigation but is of note for future work.
In five of the 16 influent-effluent pairs, PFASs appeared to be removed (>20% lower concentration) during NRB treatment, while eight of the 16 pairs exhibited >20% greater total PFASs post-treatment. Several sites showed PFAS removal during one season and formation in another (e.g., site 4), highlighting the variability of these systems, potentially due to grab sampling approaches and household use patterns that could not be directly surveyed at the time. Percent removals of individual PFASs were calculated for all sites at both timepoints (Fig. 3) by subtracting the effluent concentration from the influent concentration and dividing the difference by the influent concentration. Negative median percent removals are observed for 7/11 PFCAs and 2/11 PFSAs, generally agreeing with overall observations described in Table 1 and pointing toward likely pre-PFAA transformation. While negative median percent removals were observed, positive removals were observed for some PFAS as well, notably so for L-PFHxS and L-PFOS in both sampling campaigns. Previous studies have shown that PFOS sorbs to solids more than short-chain PFAAs and tends to accumulate in biosolids,16 indicating that there is likely sorption to NRB media of longer-chain PFAAs such as PFOS.
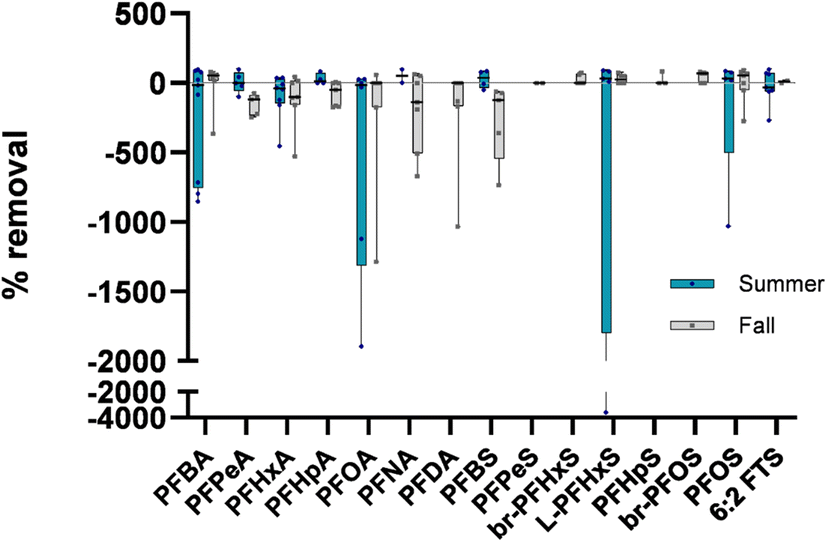 | ||
| Fig. 3 Percent removal of PFASs in nine NRBs at two time points. All censored values were replaced with LOQ/2. All raw data are also shown in Fig. S4.† Each point represents the percent removal at each site and horizontal bars represent the median value for a specific PFAS across all sites in a given season. | ||
3.3 PFASs in passive samplers
Site 3 from the grab sampling series was selected for the deployment of passive samplers, as it had the greatest abundances of PFASs in pre-NRB and post-NRB samples across all sites based on June 2022 grab sampling. The four sets of grab samples collected from site 3 exhibited variable influent-effluent relationships over time (Fig. 4). At some timepoints, PFCAs and PFSAs increased in effluent while at other times they appeared to be removed. ∑11PFCA ranged from 27 to 337 ng L−1 and ∑11PFSA ranged from 169 to 6500 ng L−1. Time-series variability was greatest for PFSAs in influent, with changes up to 3700% between sequential time points. PFCA concentrations were also quite variable, changing by up to 318% between sequential time points. A product containing high concentrations of PFHpS and PFOS may have been disposed of shortly prior to the October 13th sampling date though this cannot be confirmed.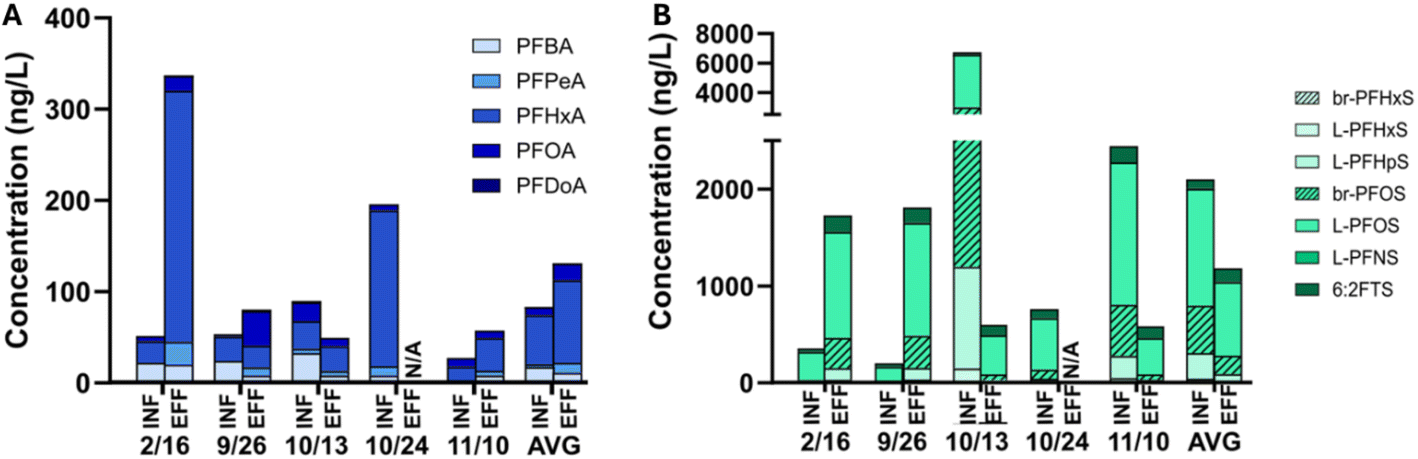 | ||
| Fig. 4 Concentration of PFASs in influent (INF) and effluent (EFF) grab samples at site 3. Values below INF/EFF labels note the date of sample collection. Panel (A) shows concentrations of PFCAs, panel (B) shows concentrations of PFSAs. NA represents sample that was not analyzed. | ||
Week 2 estimates of water concentration were much lower than the average concentration of PFASs in grab samples during the deployment period, suggesting that passive sampling rates were much lower in onsite wastewater than previously observed in groundwater studies.11 The relative abundance of sucralose appeared unchanged between influent and effluent at week 2 while ibuprofen was much lower in effluent relative to influent (Fig. 6A). These results suggest that the influent-effluent relationship observed for PFASs likely was not an artifact caused by higher sampling rates in effluent versus influent.
Concentrations of detected PFASs at week 2, 4, and 6 in the mPEs are displayed in Fig. 5 along with estimated wastewater PFAS concentrations based on literature sampling rates. All mPE values are presented in Table S6.† Greater levels of PFAAs were consistently observed in effluent samplers relative to influent samplers, which is what one might expect due to pre-PFAA transformation during treatment. This consistency in passive sampling results compared to the high variability of grab sampling indicates that passive sampling may be more representative of the overall time-averaged PFAS influent-effluent relationship in NRBs. L-PFOS accounted for the largest percentage of PFASs in both the passive sampler (19% ± 7%) and the grab sample series (53% ± 5%) from site 3, and PFHxA was the most abundant PFCA in both cases (8% ± 9%, passives; 6% ± 5%, grabs), demonstrating consistent relative composition in grab samples and passive samplers.
 | ||
| Fig. 5 Target PFAS detected in mPEs (A), and estimated time-weighted average water concentrations derived from mPE concentrations based on estimated passive sampling rates (B). | ||
Eleven (nine shown, >50% detection frequency) PFASs were detected >LOQ in mPEs and 23 PFASs (12 shown, >50% detection frequency) were detected in the grab sample series collected at site 3. PFHpA and PFNA were <DL in grab samples, but were >DL in mPEs collected from effluent. Several compounds, including PFHpA, PFNA, and branched PFHxS were detected in >1 mPE from effluent but were <DL in mPEs from influent, suggesting pre-PFAA transformation. Conversely, PFPeA, L-PFNS, and 6:2 FTS were detected in grab samples but not captured in mPEs suggesting that brief pulses of more variable PFASs may not be captured by passive samplers.
It was expected that PFASs would accumulate linearly over the entire deployment11 but this was not the case (Fig. 6). The linear uptake phase of the passive samplers appeared to last only for four weeks followed by a drop-off in concentrations between weeks 4 and 6. This may have been due to preferential uptake of organic matter over time53 or clogging of the polyethylene pores reducing sampler extraction efficiencies. The duration of the linear uptake phase did not appear to be the same for all PFASs or sample types (influent vs. effluent). However, all mPE-derived estimated concentrations (Fig. 5B) decreased from week 2 to week 4. This has previously been observed in samplers containing weak anion exchange (WAX) sorbent deployed at a WWTP, potentially due to competitive sorption,53 but was not observed in similar studies using Strata-X sorbent for the uptake of pharmaceuticals in wastewater over a 30 day period.31 Sampler configuration and sorbent selection should be optimized in the future for PFASs in wastewater.
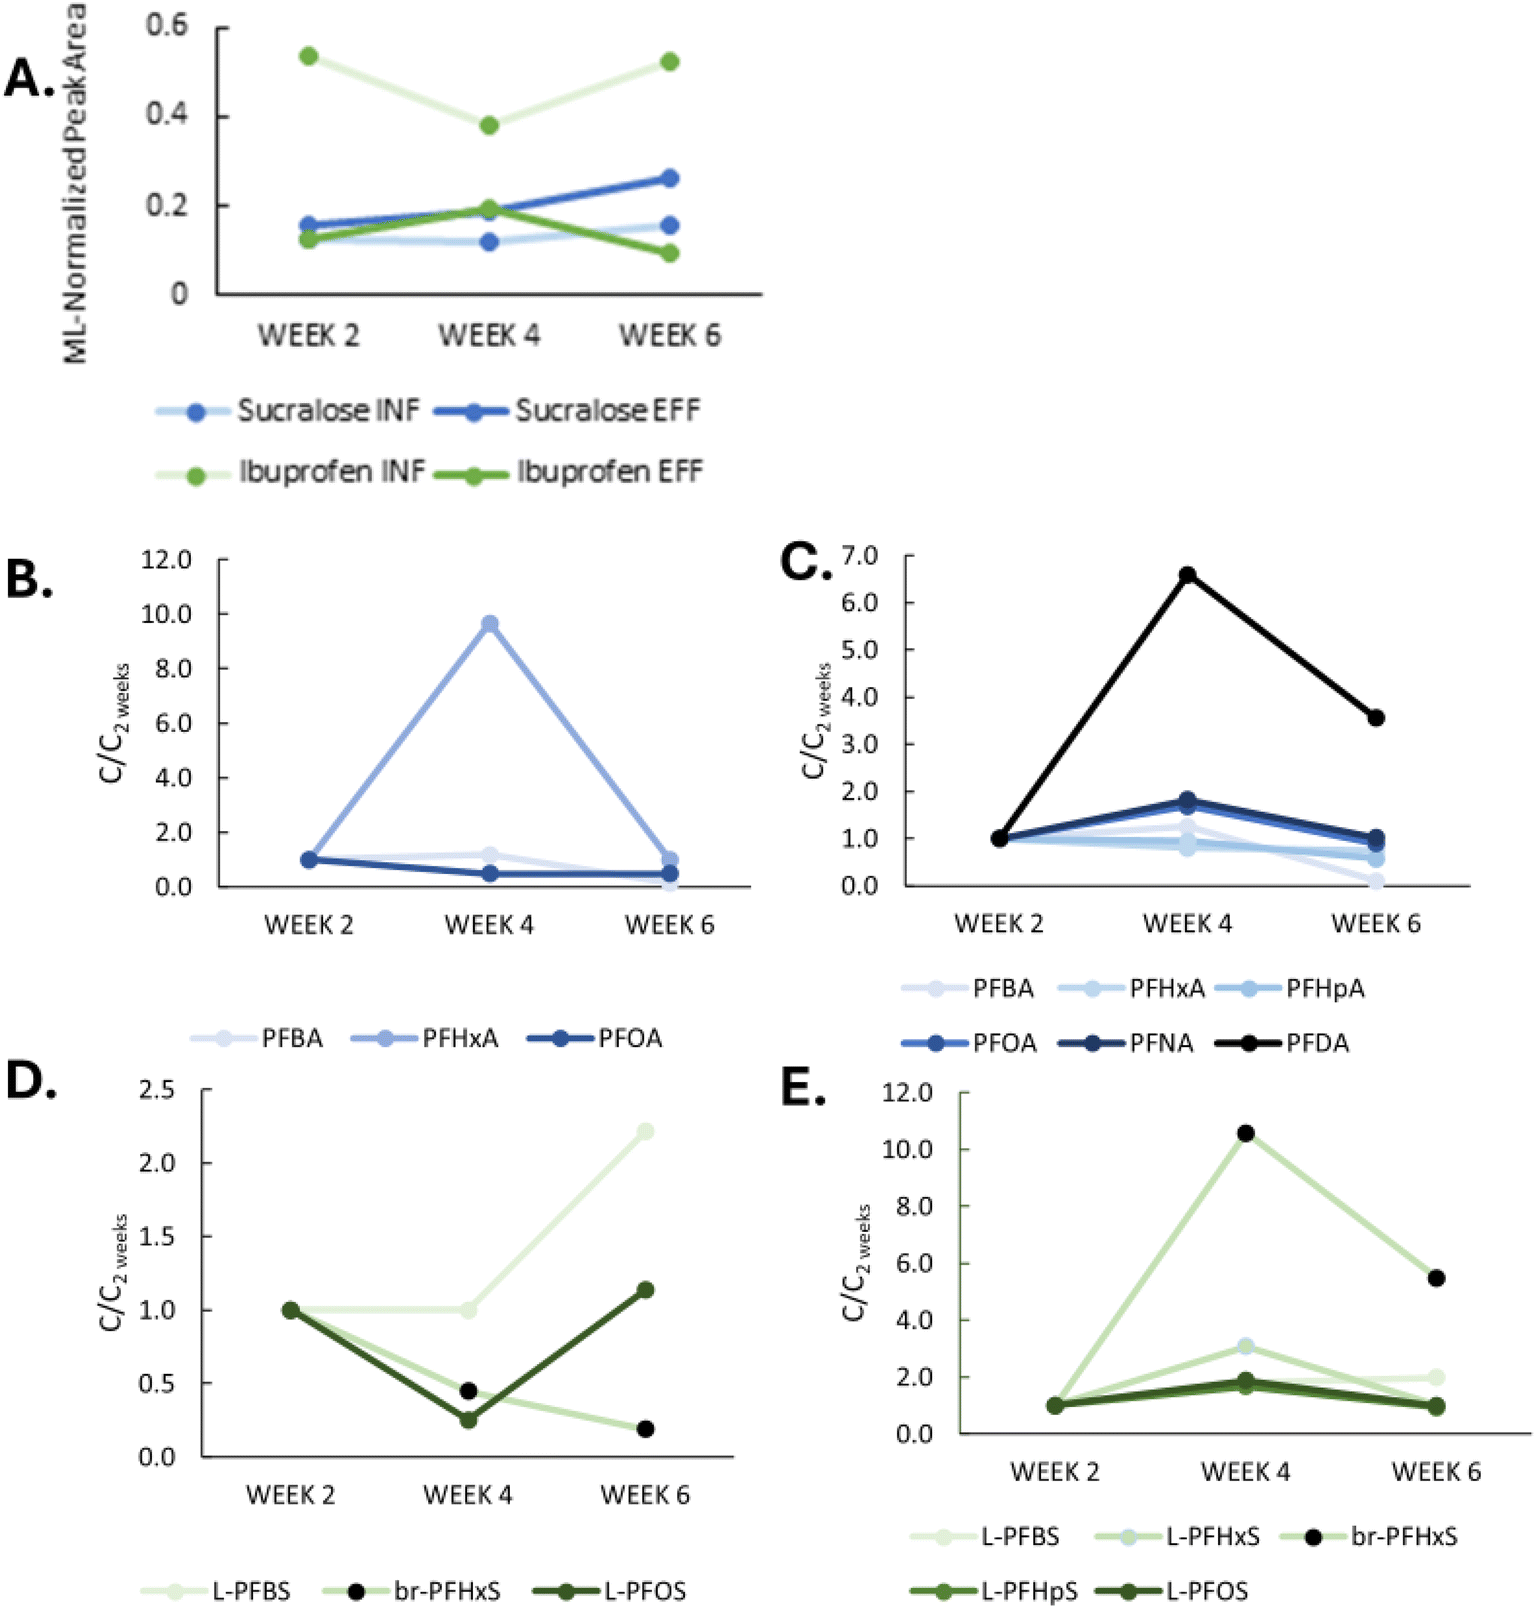 | ||
| Fig. 6 Uptake curves of measured PFAS and two representative compounds; ibuprofen and sucralose. Panel (A) shows the normalized peak areas of sucralose and ibuprofen in influent and effluent. Panels (B) and (C) show total PFCA mass in influent (B) and (C) effluent samplers. Panels D and E show total PFSA mass in (D) influent and (E) effluent samplers. | ||
3.4 Suspect screening and nontarget analysis
 | ||
| Fig. 7 Left: results of suspect screening (SS) and nontarget analysis (NTA) and right: the number of features remaining after each fileting step (described in detail in Section 3.4). In the left panel, SS represents all initial suspect matches (n = 624) and NTA represents all features extracted in the non-target workflow (n = 7889). SS final (n = 37) and NTA final (n = 30) are the features that remained after all filtering steps. Targets are PFASs included on the target analyte list. | ||
Of the 18 features from FluoroMatch (Table S8†), only one was detected in both the influent and effluent composite sample (m/z = 710.9312). Nine features were detected only in influent, suggesting removal during treatment due to transformation or sorption. Eight features were detected only in effluent, suggesting these may be compounds formed during treatment.
Quantitative measurements could not be completed for tentatively identified PFASs with no defined response factors. However, to better understand the total contribution of pre-PFAAs to final effluent PFASs, the peak area of each tentatively identified PFAS with an unequivocal or tentative molecular formula were normalized to the peak area of the mass-labeled PFASs with the closest retention time to evaluate relative abundance in influent and effluent. Five suspects were unique to the effluent composite, including tentative annotation of two substituted aromatics, one sulfonamide-based pre-PFAS (N-methyl perfluorobutane sulfonamido acetic; N-MeFBSAA), and two fluorotelomers (4:2 fluorotelomer thio acetic acid; 4:2 FTSEA and 8:2 polyfluoroalkyl phosphate ester; 8:2 PAP). Detections of species only in effluent may be due to formation but could also be due to fluctuations in wastewater composition over time or enhanced detection in effluent extracts, which generally have somewhat less matrix interference than influent. Four features were present at greater relative abundance in effluent compared to influent, including tentatively identified perfluorobutyl sulfinate (PFBSi), a known intermediate product formed from sulfonamide-based pre-PFAAs. Other features that increased in effluent included two short-chain (C3) carboxylic acids and one fluorotelomer sulfonyl pre-PFAA. These increased abundances could be due to formation, though changes in contaminant composition over time and matrix effects could also play a role, so results should be interpreted cautiously. Overall, these tentatively identified structures were predominantly short-chain, with all but two containing C4 or shorter perfluorinated moieties, and the remaining two containing 6:2 and 8:2 fluorotelomers.
Ten formulas with perfluorinated chain-length C3 to C5 were unique to the influent composite sample, suggesting removal by transformation or sorption. Most (9 out of 10) proposed structures unique to influent contain secondary amine groups, suggesting they may have been labile to microbial transformation.20,55 Four additional suspects were detected at 2–5× lower intensities in effluent than influent, also suggesting removal. All were short-chain (C1–C3) structures, with two (C7H3F77N2OS and C11H16F7NO) containing secondary amine groups, suggesting removal via transformation. The other two structures (chlorinated perfluoropropane sulfonate (Cl-PFPrS) and 1:2 fluorotelomer phosphate diester (1:2 diPAP)) may have been transformed, or may be fragments of larger precursors that did not remain intact during analysis.
There are likely many other precursors present in these samples that were not amenable to our analytical methods such as neutral volatile PFASs (e.g., fluorotelomer alcohols). Targeted quantitation suggested formation of C4–C6 PFCAs and C4 PFSA during NRB treatment, which is fairly consistent with the tentative identification of short-chain (C3–C6) fluorotelomer and sulfonamide-based pre-PFAAs. No precursors with 7–9 perfluorinated carbons were identified in influent; however, there were 8.4, 7.0, and 3.9-fold increases in PFOA, PFNA, and PFDA observed in the passive sampler series at site 3, suggesting that longer-chain pre-PFAAs may have been present but missed by our analytical methods. It is also important to consider that grab sample composites may not encompass all pre-PFAAs that may be contributing at any individual site due to dilution. The composite approach used prioritizes PFASs with high detection frequency.
There are a few potential explanations for the lack of overlap between the two workflows. The applied NTA workflow (FluoroMatch IM) prioritizes CF2 homologous series; therefore, the NTA workflow is much more likely to reveal PFASs that are present as homologous series, rather than single suspects that lack series members within the same sample(s). Conversely, the SS workflow may not cover all possible PFAS (i.e. novel compounds) as it is limited to the formulas in the screening list selected for the workflow. This demonstrates the potential of utilizing complementary approaches for comprehensive PFAS analysis. Suspect screening included a retention time filtering step while the NTA workflow included a CCS filtering step, leveraging the available data acquired. Each step potentially rejected features in one workflow that were not rejected by the other. For example, five features passed through the filtering steps in the FluoroMatch workflow that are at lower retention times than expected based on mass vs. RT trends and so were filtered out of the suspect screening results. These could be conjugated products, which exhibit lower RTs but greater masses than their parent PFASs.56 Such compounds may be preserved by a CCS filtering approach where molecular size rather than solubility (RT) is related to m/z.
Confidence levels were also improved here by combining features from different workflows for final identifications. Table S4† lists all identifications in the grab sample composites from suspect screening and NTA workflows in addition to acquired parameters (CCS, RT, m/z) of all PFASs regardless of detection frequency. Inclusion in CF2 homologous series increased the confidence level of seven features: FBSAA, Cl-substituted PFPrS, N-MeFBSAA, 1:2 FTS, 1:2 diPAP, 5:2 PAP, and 3:2 PAP, highlighting the advantage of combining HRMS workflows despite minimal overlap in the workflow results.
4. Conclusions
In this study, we demonstrate that like conventional WWTPs, residential wastewater released from septic treatment is a source of PFASs to the environment and these PFASs do not appear to be significantly removed by NRB treatment. A total of 22 targeted PFASs were detected in wastewater samples and ∑22PFAS ranged from 42 to 9795 ng L−1 in septic tank effluent and 72 to 2575 ng L−1 in NRB effluent. The total effluent load corresponds to approximately 39–1423 mg PFASs per household per year. The largest contributions to ∑22PFAS totals were from 6:2 FTS and PFBA, while the most frequently detected PFASs were PFBA and PFHxA. Comparisons of influent and effluent suggest precursor transformation during NRB treatment, as well as potential loss of some PFASs due to sorption in the NRB system. Effluent concentrations are still of environmental concern based on EPA guidelines, similarly to WWTP effluent.
Passive sampling techniques may be more representative of PFAS fate in highly variable systems like onsite septic systems when evaluating the efficacy of treatment, though sampler optimization is warranted for future experimentation. Even so, PFAS concentrations consistently increased during NRB treatment, which was not always the case for grab samples collected at the same time. Grab sampling provides a snapshot of water concentrations at the time that the samples were collected, while passive samplers slowly take up compounds from the surrounding water, providing a time-weighted average. PFASs that are detected in relatively low concentrations sporadically are less likely to be captured by passive samplers, but passive samplers showed consistent trends and captured the most abundant PFASs over time.
Beyond targeted analysis, a total of 22 PFASs were tentatively identified via suspect screening and 18 by nontarget analysis using FluoroMatch IM. The average mass defect of features identified as potential PFASs in NRB effluent was lower than in the average mass defect of influent-only PFASs, suggesting that precursor transformations are occurring during NRB treatment similarly to WWTPs. It is recommended that future developments of wastewater treatment systems that directly release effluent into the environment should take into consideration the removal of PFASs, and that OWTSs be considered as a source of PFASs to groundwater and subsequent surface waters and private wells.
Data availability
Data acquired by LC-IMS-QTOF-MS from composite pre- and post-NRB wastewater samples are available through the MassIVE repository (http://massive.ucsd.edu; https://doi.org/doi:10.25345/C5TB0Z73K). Data acquired from samples collected at individual private residences are not available to access in interest of confidentiality. The database used in HRMS suspect screening (NORMAN S89 PFAS database) is publicly available via the NORMAN network (https://norman-network.com/nds/susdat).Conflicts of interest
The authors declare no competing financial interest.Acknowledgements
We would like to acknowledge Caitlin Asato (Stony Brook University) for assistance and facilitation of field sampling. We would also like to thank Sarit Kaserzon (University of Queensland) for providing microporous polyethylene passive samplers and for guidance on their usage, and Jeremy Koelmel (Innovative Omics; Yale University) for assistance with FluoroMatch IM workflow optimization and visualization. This work was supported by the New York State Department of Environmental Conservation, award number NYS-DEC01-C00366GG-3350000.References
- S. E. Fenton, A. Ducatman, A. Boobis, J. C. DeWitt, C. Lau, C. Ng, J. S. Smith and S. M. Roberts, Per- and polyfluoroalkyl substance toxicity and human health review: current state of knowledge and strategies for informing future research, Environ. Toxicol. Chem., 2021, 40(3), 606–630, DOI:10.1002/etc.4890
.
- Z. Wang, J. C. DeWitt, C. P. Higgins and I. T. Cousins, A never-ending story of per- and polyfluoroalkyl substances (PFASs)?, Environ. Sci. Technol., 2017, 51(5), 2508–2518, DOI:10.1021/acs.est.6b04806
- P. Dewapriya, L. Chadwick, S. G. Gorji, B. Schulze, S. Valsecchi, S. Samanipour, K. V. Thomas and S. L. Kaserzon, Per- and polyfluoroalkyl substances (PFAS) in consumer products: current knowledge and research gaps, J. Hazard. Mater. Lett., 2023, 4, 100086, DOI:10.1016/j.hazl.2023.100086
- M. Kotthoff, J. Müller, H. Jürling, M. Schlummer and D. Fiedler, Perfluoroalkyl and polyfluoroalkyl substances in consumer products, Environ. Sci. Pollut. Res. Int., 2015, 22(19), 14546–14559, DOI:10.1007/s11356-015-4202-7
- L. A. Schaider, S. A. Balan, A. Blum, D. Q. Andrews, M. J. Strynar, M. E. Dickinson, D. M. Lunderberg, J. R. Lang and G. F. Peaslee, Fluorinated compounds in U.S. Fast Food packaging, Environ. Sci. Technol. Lett., 2017, 4(3), 105–111, DOI:10.1021/acs.estlett.6b00435
- K. J. Harris, G. Munoz, V. Woo, S. Sauvé and A. A. Rand, Targeted and suspect screening of per- and polyfluoroalkyl substances in cosmetics and personal care products, Environ. Sci. Technol., 2022, 56(20), 14594–14604, DOI:10.1021/acs.est.2c02660
- H. D. Whitehead, M. Venier, Y. Wu, E. Eastman, S. Urbanik, M. L. Diamond, A. Shalin, H. Schwartz-Narbonne, T. A. Bruton, A. Blum, Z. Wang, M. Green, M. Tighe, J. T. Wilkinson, S. McGuinness and G. F. Peaslee, Fluorinated compounds in North American cosmetics, Environ. Sci. Technol. Lett., 2021, 8(7), 538–544, DOI:10.1021/acs.estlett.1c00240
- L. A. Schaider, J. M. Ackerman and R. A. Rudel, Septic systems as sources of organic wastewater compounds in domestic drinking water wells in a shallow sand and gravel aquifer, Sci. Total Environ., 2016, 547, 470–481, DOI:10.1016/j.scitotenv.2015.12.081
- L. Schaider, R. Rudel, J. Ackerman, S. Dunagan and J. Brody, Pharmaceuticals, perfluorosurfactants, and other organic wastewater compounds in public drinking water wells in a shallow sand and gravel aquifer, Sci. Total Environ., 2014, 9(468–469C), 384–393, DOI:10.1016/j.scitotenv.2013.08.067
- C. A. McDonough, S. Choyke, K. E. Barton, S. Mass, A. P. Starling, J. L. Adgate and C. P. Higgins, Unsaturated PFOS and other PFASs in human serum and drinking water from an AFFF-impacted community, Environ. Sci. Technol., 2021, 55(12), 8139–8148, DOI:10.1021/acs.est.1c00522
- S. L. Kaserzon, S. Vijayasarathy, J. Bräunig, L. Mueller, D. W. Hawker, K. V. Thomas and J. F. Mueller, Calibration and validation of a novel passive sampling device for the time integrative monitoring of per- and polyfluoroalkyl substances (PFASs) and precursors in contaminated groundwater, J. Hazard. Mater., 2019, 366, 423–431, DOI:10.1016/j.jhazmat.2018.12.010
- A. O. De Silva, J. M. Armitage, T. A. Bruton, C. Dassuncao, W. Heiger-Bernays, X. C. Hu, A. Kärrman, B. Kelly, C. Ng, A. Robuck, M. Sun, T. F. Webster and E. M. Sunderland, PFAS exposure pathways for humans and wildlife: a synthesis of current knowledge and key gaps
in understanding, Environ. Toxicol. Chem., 2021, 40(3), 631–657, DOI:10.1002/etc.4935
- V. Rafiei and A. P. Nejadhashemi, Watershed scale PFAS fate and transport model for source identification and management implications, Water Res., 2023, 120073, DOI:10.1016/j.watres.2023.120073
- M. Islam, K. Thompson, E. Dickenson, O. Quiñones, E. Steinle-Darling and P. Westerhoff, Sucralose and predicted de facto wastewater reuse levels correlate with PFAS levels in surface waters, Environ. Sci. Technol. Lett., 2023 DOI:10.1021/acs.estlett.3c00185
- S. B. Gewurtz, A. S. Auyeung, A. O. De Silva, S. Teslic and S. A. Smyth, Per- and polyfluoroalkyl substances (PFAS) in Canadian municipal wastewater and biosolids: recent patterns and time trends 2009 to 2021, Sci. Total Environ., 2023, 168638, DOI:10.1016/j.scitotenv.2023.168638
- J. Kim, X. Xin, B. T. Mamo, G. L. Hawkins, K. Li, Y. Chen, Q. Huang and C.-H. Huang, Occurrence and fate of ultrashort-chain and other per- and polyfluoroalkyl substances (PFAS) in wastewater treatment plants, ACS EST Water, 2022 DOI:10.1021/acsestwater.2c00135
- T. L. Coggan, D. Moodie, A. Kolobaric, D. Szabo, J. Shimeta, N. D. Crosbie, E. Lee, M. Fernandes and B. O. Clarke, An investigation into Per- and polyfluoroalkyl substances (PFAS) in nineteen Australian wastewater treatment plants (WWTPs), Heliyon, 2019, 5(8), e02316, DOI:10.1016/j.heliyon.2019.e02316
- L. Gobelius, L. Glimstedt, J. Olsson, K. Wiberg and L. Ahrens, Mass flow of per- and polyfluoroalkyl substances (PFAS) in a Swedish municipal wastewater network and wastewater treatment plant, Chemosphere, 2023, 336, 139182, DOI:10.1016/j.chemosphere.2023.139182
- C. Gallen, G. Eaglesham, D. Drage, T. H. Nguyen and J. F. Mueller, A Mass estimate of perfluoroalkyl substance (PFAS) release from australian wastewater treatment plants, Chemosphere, 2018, 208, 975–983, DOI:10.1016/j.chemosphere.2018.06.024
- S. P. Lenka, M. Kah and L. P. Padhye, A Review of the occurrence, transformation, and removal of poly- and perfluoroalkyl substances (PFAS) in wastewater treatment plants, Water Res., 2021, 199, 117187, DOI:10.1016/j.watres.2021.117187
- E. F. Houtz, R. Sutton, J.-S. Park and M. Sedlak, Poly- and perfluoroalkyl substances in wastewater: significance of unknown precursors, manufacturing shifts, and likely AFFF impacts, Water Res., 2016, 95, 142–149, DOI:10.1016/j.watres.2016.02.055
- C. A. McDonough, W. Li, H. N. Bischel, A. O. De Silva and J. C. DeWitt, Widening the lens on PFASs: direct human exposure to perfluoroalkyl acid precursors (Pre-PFAAs), Environ. Sci. Technol., 2022, 56(10), 6004–6013, DOI:10.1021/acs.est.2c00254
- M. Ateia, D. Chiang, M. Cashman and C. Acheson, Total oxidizable precursor (TOP) assay-best practices, capabilities and limitations for PFAS site investigation and remediation, Environ. Sci. Technol. Lett., 2023 DOI:10.1021/acs.estlett.3c00061
- J. R. Gauthier and S. A. Mabury, Noise-reduced quantitative fluorine NMR spectroscopy reveals the presence of additional per- and polyfluorinated alkyl substances in environmental and biological samples when compared with routine mass spectrometry methods, Anal. Chem., 2022, 94(7), 3278–3286, DOI:10.1021/acs.analchem.1c05107
- R. Aro, U. Eriksson, A. Kärrman, K. Jakobsson and L. W. Y. Yeung, Extractable organofluorine analysis: a way to screen for elevated per- and polyfluoroalkyl substance contamination in humans?, Environ. Int., 2022, 159, 107035, DOI:10.1016/j.envint.2021.107035
- A. Kärrman, L. W. Y. Yeung, K. M. Spaan, F. Thomas Lange, M. Anh Nguyen, M. Plassmann, C. A. de Wit, M. Scheurer, R. Awad, P. Benskin and J. Can, Determination of extractable organofluorine (EOF) be standardized? first interlaboratory comparisons of EOF and fluorine mass balance in sludge and water matrices, Environ. Sci. Process. Impacts, 2021, 23(10), 1458–1465, 10.1039/D1EM00224D
- V. Müller, A. Kindness and J. Feldmann, Fluorine mass balance analysis of PFAS in communal waters at a wastewater plant from Austria, Water Res., 2023, 244, 120501, DOI:10.1016/j.watres.2023.120501
- B. Subedi, N. Codru, D. M. Dziewulski, L. R. Wilson, L. R. Wilson, J. Xue, S. Yun, E. B. Braun-Howland, C. Minihane and K. Kannan, A pilot study on the assessment of trace organic contaminants including pharmaceuticals and personal care products from on-site wastewater treatment systems along skaneateles lake in New York State, USA, Water Res., 2015, 72, 28–39, DOI:10.1016/j.watres.2014.10.049
- K. R. Hayden, H. E. Preisendanz, K. R. Elkin, L. B. Saleh, J. Weikel, T. L. Veith, H. A. Elliott and J. E. Watson, Comparison of POCIS and grab sampling techniques for monitoring PPCPs in vernal pools in central Pennsylvania, Sci. Total Environ., 2022, 806, 150607, DOI:10.1016/j.scitotenv.2021.150607
- S. Waugh, X. Mao, G. Heufelder, H. Walker and C. J. Gobler, Nitrogen transformations and microbial characterization of soils from passive nitrogen removing biofilters, J. Sustainable Water Built Environ., 2020, 6(2), 04020009, DOI:10.1061/JSWBAY.0000907
- S. McKay, B. Tscharke, D. Hawker, K. Thompson, J. O'Brien, J. F. Mueller and S. Kaserzon, Calibration and validation of a microporous polyethylene passive sampler for quantitative estimation of illicit drug and pharmaceutical and personal care product (PPCP) concentrations in wastewater influent, Sci. Total Environ., 2020, 704, 135891, DOI:10.1016/j.scitotenv.2019.135891
- A. Škodová, R. Prokeš, Z. Šimek and B. Vrana,
In situ calibration of three passive samplers for the monitoring of steroid hormones in wastewater, Talanta, 2016, 161, 405–412, DOI:10.1016/j.talanta.2016.08.068
- E. Bailly, Y. Levi and S. Karolak, Calibration and Field evaluation of polar organic chemical integrative sampler (POCIS) for monitoring pharmaceuticals in hospital wastewater, Environ. Pollut., 2013, 174, 100–105, DOI:10.1016/j.envpol.2012.10.025
- Long Island: Where Does Our Water Come From?, The Nature Conservancy, https://www.nature.org/en-us/about-us/where-we-work/united-states/new-york/stories-in-new-york/long-island-water-quality/where-does-our-water-come-from-/, accessed 28 August 2024 Search PubMed.
-
I. J. Fisher; P. J. PhillipsOccurrence of Per- and Polyfluoroalkyl Substances, U.S. Geological Survey data release, Long Island and New York City, New York, 2019, DOI:10.5066/P9CJ22DU
- H. Wool, New Septic Systems to Reduce Nitrogen Pollution into Long Island Sound, Long Island Sound Study, https://longislandsoundstudy.net/2023/11/new-septic-systems-to-reduce-nitrogen-pollution-into-long-island-sound/, accessed 04 September 2024 Search PubMed.
- J. G. Christopher, C. J. Gobler, S. Waugh, C. Asato, P. M. Clyde, S. C. Nyer, M. Graffam, B. J. Brownawell, A. K. Venkatesan, J. A. Goleski, R. E. Price, M. Xinwei, X. Mao, F. M. Russo, G. Heufelder, H. W. Walker, H. W. Walker and W. W. Harold, Removing 80%–90% of nitrogen and organic contaminants with three distinct passive, lignocellulose-based on-site septic systems receiving municipal and residential wastewater, Ecol. Eng., 2021, 161, 106157, DOI:10.1016/j.ecoleng.2021.106157
- K. Langlois, C. J. Gobler, H. W. Walker and J. L. Collier, Microbial communities in partially and fully treated effluent of three nitrogen-removing biofilters, J. Sustainable Water Built Environ., 2020, 6(2), 04020010, DOI:10.1061/JSWBAY.0000912
-
P. M. Clyde, Occurrence and Fate of Pharmaceuticals and Personal Care Products in Nitrogen Removing Biofilters, Ph.D., State University of New York at Stony Brook, United States, New York, 2021, https://www.proquest.com/dissertations-theses/occurrence-fate-pharmaceuticals-personal-care/docview/2544246110/se-2?accountid=9902 Search PubMed
- C.-S. Lee, C. Asato, M. Wang, X. Mao, C. J. Gobler and A. K. Venkatesan, Removal of 1,4-dioxane during on-site wastewater treatment using nitrogen removing biofilters, Sci.
Total Environ., 2021, 771, 144806, DOI:10.1016/j.scitotenv.2020.144806
- US EPA, O. SW-846 Test Method 3512: Solvent Dilution of Non-Potable Waters, https://www.epa.gov/hw-sw846/sw-846-test-method-3512-solvent-dilution-non-potable-waters, accessed 04 September 2024 Search PubMed.
- J. Oppenheimer, A. Eaton, M. Badruzzaman, A. Haghani and J. G. Jacangelo, Occurrence and suitability of sucralose as an indicator compound of wastewater loading to surface waters in urbanized regions, Water Res., 2011, 45(13), 4019–4027, DOI:10.1016/j.watres.2011.05.014
- K. Troxell, B. Ng, I. Zamora-Ley and P. Gardinali, Detecting water constituents unique to septic tanks as a wastewater source in the environment by nontarget analysis: south florida's deering estate rehydration project case study, Environ. Toxicol. Chem., 2022, 41(5), 1165–1178, DOI:10.1002/etc.5309
- J. Wu, Z. Liu, Q. Ma, L. Dai and Z. Dang, Occurrence, removal and risk evaluation of ibuprofen and acetaminophen in municipal wastewater treatment plants: a critical review, Sci. Total Environ., 2023, 891, 164600, DOI:10.1016/j.scitotenv.2023.164600
- R. Smolinski, J. P. Koelmel, P. Stelben, D. Weil, D. Godri, D. Schiessel, M. Kummer, S. M. Stow, S. Mohsin, L. Royer, A. McKenzie-Coe, T. Lubinsky, D. DeBord, O. Chevallier, E. E. Rennie, K. J. Godri Pollitt and C. McDonough, FluoroMatch IM: an interactive software for PFAS analysis by ion mobility spectrometry, Environ. Sci. Technol., 2025 DOI:10.1021/acs.est.4c13846
-
K. Ng; N. Alygizakis; J. S. Slobodnik, 89 | PRORISKPFAS | List of PFAS Compiled from NORMAN SusDat, 2021, DOI:10.5281/zenodo.5769583
- J. A. Charbonnet, C. A. McDonough, F. Xiao, T. Schwichtenberg, D. Cao, S. Kaserzon, K. V. Thomas, P. Dewapriya, B. J. Place, E. L. Schymanski, J. A. Field, D. E. Helbling and C. P. Higgins, Communicating confidence of per- and polyfluoroalkyl substance identification via high-resolution mass spectrometry, Environ. Sci. Technol. Lett., 2022, 9(6), 473–481, DOI:10.1021/acs.estlett.2c00206
- D. Szabo, J. Marchiandi, S. Samandra, J. M. Johnston, R. A. Mulder, M. P. Green and B. O. Clarke, High-resolution temporal wastewater treatment plant investigation to understand influent mass flux of per- and polyfluoroalkyl substances (PFAS), J. Hazard. Mater., 2023, 447, 130854, DOI:10.1016/j.jhazmat.2023.130854
- C. Zhang, H. Yan, F. Li and Q. Zhou, Occurrence and fate of perfluorinated acids in two wastewater treatment plants in Shanghai, China, Environ. Sci. Pollut. Res., 2015, 22(3), 1804–1811, DOI:10.1007/s11356-013-2044-8
- Y. Lu, J. Gao, H. T. Nguyen, S. Vijayasarathy, P. Du, X. Li, H. Yao, J. F. Mueller and P. K. Thai, Occurrence of per- and polyfluoroalkyl substances (PFASs) in wastewater of major cities across China in 2014 and 2016, Chemosphere, 2021, 279, 130590, DOI:10.1016/j.chemosphere.2021.130590
- M. Lorenzo, J. Campo, M. Morales Suárez-Varela and Y. Picó, Occurrence, distribution and behavior of emerging persistent organic pollutants (POPs) in a mediterranean wetland protected area, Sci. Total Environ., 2019, 646, 1009–1020, DOI:10.1016/j.scitotenv.2018.07.304
- S. B. Gewurtz, R. Lazar and G. Douglas Haffner, Comparison of polycyclic aromatic hydrocarbon and polychlorinated biphenyl dynamics in benthic invertebrates of Lake Erie, USA, Environ. Toxicol. Chem., 2000, 19(12), 2943–2950, DOI:10.1002/etc.5620191215
- S. Cheng, C. Li, S. Liu, H. Zou, G.-G. Ying and C.-E. Chen, Development of ceramic filter tube for passive sampling of PFAS in waters, Environ. Technol. Innovations, 2024, 34, 103608, DOI:10.1016/j.eti.2024.103608
- Y. Liu, L. A. D'Agostino, G. Qu, G. Jiang and J. W. Martin, High-resolution mass spectrometry (HRMS) Methods for nontarget discovery and characterization of poly- and per-fluoroalkyl substances (PFASs) in environmental and human samples, TrAC, Trends Anal. Chem., 2019, 121, 115420, DOI:10.1016/j.trac.2019.02.021
- B. Xu, S. Liu, J. L. Zhou, C. Zheng, J. Weifeng, B. Chen, T. Zhang and W. Qiu, PFAS and their substitutes in groundwater: occurrence, transformation and remediation, J. Hazard. Mater., 2021, 412, 125159, DOI:10.1016/j.jhazmat.2021.125159
- D. A. Dukes and C. A. McDonough,
N-Glucuronidation and excretion of perfluoroalkyl sulfonamides in mice following ingestion of aqueous film-forming foam, Environ. Toxicol. Chem., 2024 DOI:10.1002/etc.5939
Footnote |
| † Electronic supplementary information (ESI) available. See DOI: https://doi.org/10.1039/d5em00134j |
| This journal is © The Royal Society of Chemistry 2025 |