
Development of a powdered activated charcoal sodium alginate hydrogel bead concentration method for detecting viruses in wastewater†
Madison
Gouthro
 a,
Emalie K.
Hayes
a,
Naomi
Lewis
a,
Megan
Fuller
a,
Jamileh
Shojaei
b,
John
Frampton
b,
Amina K.
Stoddart
a and
Graham A.
Gagnon
*a
a,
Emalie K.
Hayes
a,
Naomi
Lewis
a,
Megan
Fuller
a,
Jamileh
Shojaei
b,
John
Frampton
b,
Amina K.
Stoddart
a and
Graham A.
Gagnon
*a
aCentre for Water Resources Studies, Department of Civil & Resource Engineering, Dalhousie University, 1360 Barrington Street, Halifax, Nova Scotia B3H 4R2, Canada. E-mail: Graham.gagnon@dal.ca
bDepartment of Biomedical Engineering, Dalhousie University, Halifax, B3H 4R2 NS, Canada
First published on 12th June 2024
Abstract
Existing techniques for concentrating viruses from wastewater are often time consuming, costly, and usually involve cumbersome laboratory methods, limiting their practical application for routine use. As such, the need for simpler concentration methods that do not forfeit efficacy are crucial for permitting more accessible detection of viruses from wastewater. This study introduces a rapid concentration method using powdered activated charcoal sodium alginate (PAC-NaA) hydrogel beads, optimized for capturing viruses from wastewater. Through scanning electron microscopy and bench-scale experiments, we optimized hydrogel bead formulation and identified a Tween®20-based buffer as the most effective elution buffer for recovering SARS-CoV-2 from the hydrogel beads. Kinetic adsorption parameters were also evaluated, establishing a 5 min exposure duration for maximum viral recovery. Model fitting of the experimental data indicated that the adsorption process adheres to a non-linear pseudo-second-order model, indicative of physiochemical adsorption mechanisms likely facilitating viral capturing from wastewater. Additionally, successful detection of endogenous SARS-CoV-2 and Adenovirus was achieved using the PAC-NaA hydrogel concentration method. The advantages of this approach lie in its adaptability and simplicity, as hydrogel beads can be modified to enhance viral adsorption efficiency in various environmental contexts.
Water impactBy utilizing PAC-amended sodium alginate-based hydrogel beads, our study offers a simplified method for recovering SARS-CoV-2 from wastewater, while avoiding the common complexities of existing virus concentration techniques. Through systematic evaluation of elution buffers and kinetic models, we enhance the efficiency of virus detection, advancing our understanding of wastewater-based epidemiology and its potential implications for public health surveillance. |
1. Introduction
During the COVID-19 pandemic, wastewater surveillance (WWS) emerged as an important tool for the early detection and monitoring of viral infections within communities. By measuring the presence of virus in communities without relying on community members to self-administer rapid antigen tests and report their results, WWS stands out as a timely indicator of viral activity in communities that may inform public health decision making.1,2 The ability of WWS to test and monitor entire populations served by the sampled wastewater infrastructure is particularly valuable in resource-constrained regions where clinical testing may be limited.3 Recent research highlights the efficacy of WWS in providing a community-level understanding of viral prevalence and enabling proactive public health interventions.4–6 This shift towards wastewater monitoring reflects a transformative change in viral surveillance and highlights the need for robust methodologies to evaluate and address public health risks.Traditional virus concentration methods from environmental waters, such as ultrafiltration,7,8 ultra-centrifugation9,10 and adsorption–elution methods,11,12 often exhibit drawbacks, including high costs, and cumbersome laboratory procedures. These limitations impede their practical application, especially in resource-constrained settings. In response, there has been a push to explore alternative approaches, including the use of sodium alginate hydrogel beads, known for their versatility in wastewater treatment13,14 and environmental remediation.15,16
This study introduces an innovative virus concentration technique employing powdered activated charcoal (PAC) sodium alginate (NaA) hydrogel beads. The use of hydrogel beads offers high surface area and macropore volume necessary to retain viruses (free and particle-bound) in wastewater. Prior investigations have demonstrated that the incorporation of charcoal into hydrogel formulations holds the potential for effective adsorption of targeted contaminants,17–19 and that utilizing glutaraldehyde as a crosslinking agent increases the overall crosslinking density and durability of the hydrogel, affecting the degradation resistance of hydrogel beads.20 The objective of this study was to develop a simple viral concentration method using hydrogel beads, which was achieved through the following sub-objectives; 1) determining the optimal hydrogel bead formulation through scanning electron microscopy and bench-scale integrity analysis in wastewater; 2) assessing the optimal elution technique for the recovery of SARS-CoV-2 from PAC-NaA hydrogel beads; 3) evaluating the minimum exposure duration required for the hydrogel beads to reach maximum adsorption capacity and 4) investigate the use of PAC-NaA hydrogel concentration method for detecting endogenous SARS-CoV-2 and Adenovirus in wastewater.
2. Materials and methods
2.1. Chemical reagents
Alginic acid sodium salt from brown algae, powdered activated charcoal, and glutaraldehyde solution Grade II, 25% in H2O were purchased from Sigma-Aldrich, USA. Calcium chloride dihydrate and 1 N hydrochloric acid solution were purchased from Fisher Scientific, CA.Viral recovery and kinetic adsorption experiments were performed using heat-inactivated SARS-CoV-2 (HI-SCV-2) surrogate purchased from the American Type Culture Collection (ATCC®, Virginia, USA) at a stock concentration of ∼3.8 × 10⁵ copies per μL. The surrogate, consisting of a whole-genome sequenced preparation for SARS-CoV-2 strain 2019-n-CoV/USA-WA1/2020, was heat-inactivated at 65 °C for 30 min. For experiments that utilized deionized water, samples were produced by a Milli-Q system (Reference A+, Millipore, resistivity of 18.2 MΩ cm and total organic carbon concentration < 5 μg L−1). Prior to each experiment, the system was regularly maintained and validated to maintain water quality within acceptable limits.
2.2. Preparation of hydrogel beads
2.3. Characterization of hydrogel formulations
The surface features of the hydrogel beads were characterized by scanning electron microscopy (SEM) with a Zeiss SIGMA 300 VP scanning electron microscope with an acceleration voltage of 5 kV and working distances of 12 and 15 mm. The hydrogel beads underwent critical point drying (LEICA EM CPD 300), were fixed to aluminum stubs, and then sputter-coated with a Leica ACE600 sputter coater with a current of 30 mA until a thickness of 12 nm was achieved. The exterior surface and the cross-sectional area of both hydrogel formulations were characterized through SEM. PAC-NaA hydrogel beads were analyzed using ImageJ/Fiji (version 1.54d, National Institutes of Health, Bethesda, MD, USA).2.4. Bench-scale evaluation of SARS-CoV-2 in wastewater for spiked experiments
For bench-scale studies, 24 hour composite influent samples were sourced from a local wastewater treatment plant (WWTP) in Nova Scotia, Canada (Plant A). The raw wastewater sample was placed in high-density polyethylene 1 L bottles and transported at 4 °C to the laboratory. These samples were incubated at room temperature for an extended period of time, resulting in the degradation of endogenous SARS-CoV-2 beyond detectable levels within the sample.21 To confirm the absence of SARS-CoV-2 RNA prior to spiked experiments, 40 mL of wastewater was directly extracted with the use of the Promega TNA extraction kit, resulting in negative detection of SARS-CoV-2 in samples. The average physiochemical and flow information of the influent stream of WWTPs can be found in Table S1.†2.5. Bench-scale assessment of hydrogel bead integrity
To evaluate the structural integrity of both formulations of hydrogel beads, a bench-scale assessment was conducted involving agitation in wastewater. Initially, one gram of each hydrogel type was precisely weighed in duplicate. Given that hydrogel beads were stored in deionized (DI) water for hydration, any excess water on the external surface of the hydrogel beads was carefully removed using Kimwipes prior to agitation. Subsequently, the pre-weighed hydrogel beads were submerged in 50 mL of wastewater and then agitated by inverting the sample every 30 s for two min. After each 30 s interval, the alginate beads were separated from the wastewater, and their weights were recorded using a Sartorius Entris Analytical Balance (Fisher Scientific, Ottawa, CA). Prior to recording the hydrogel mass, residual wastewater was removed from the surface of the microbeads.2.6. Comparison of elution buffers and agitation techniques for the desorption of HI-SCV-2 from PAC-NaA hydrogel beads
To assess the desorption efficiency of different elution buffers from PAC-NaA hydrogel beads in spiked wastewater with heat-inactivated SARS-CoV-2, two elution buffers were compared: 1) a 0.05 M KH2PO4, 1 M NaCl, 0.1% Tween®80 (v/v), and 2) a Tween®20-based elution buffer composed of 75 μL of Tween®20 and 250 μL of a 0.1 M Tris-HCl intermediate sourced from Sigma Aldrich (Ottawa, ON, CA). The buffers were prepared in DI water for a total volume of 100 mL. These elution buffers have often been used to elute viruses in previous studies.10,22,23 Two desorption techniques were also compared: manual agitation and vortexing, each for 1 min following the addition of elution buffer.A 50 mL aliquot of wastewater, spiked with heat-inactivated SARS-CoV-2 at a concentration of 1 × 10⁵ genomic copies per mL of wastewater (GC mL−1). The hydrogel beads were introduced into the spiked wastewater, shaken for 1 min and left to absorb for 2 min. The solution and beads were then centrifuged for 10 minutes at 1190 RCF. Following the centrifuge period, the hydrogel beads were separated from the wastewater, and 40 mL of elution buffer was added to the beads. Upon the addition of the elution buffer, a desorption technique was performed to facilitate the release of any adsorbed virus into the solution (Fig. S4†). Biological duplicates were performed for all experimental conditions evaluated in the study. Subsequently, viral RNA was extracted from the elution buffer using the Promega TNA extraction kit (section 2.9) and analyzed using RT-qPCR (section 2.10).
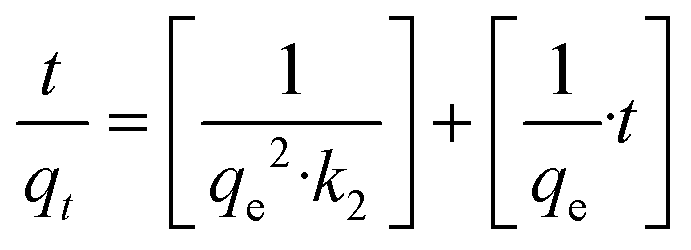
2.7. Kinetics experiment
To understand kinetic adsorption, 1 g of PAC-NaA hydrogel beads were exposed to 50 mL of wastewater for various time intervals. An initial concentration of 1.0 × 10⁵ GC mL−1 heat-inactivated SARS-CoVGU-2 was used in each sample vessel. The kinetic adsorption samples were evaluated at intervals of 30 s, 1, 2, 3, 4, 5 and 10 min.| ln(qe − qt) = ln(qe) − (k1·t) | (1) |
| qt = qe·[1 − exp(−k1·t)] | (2) |
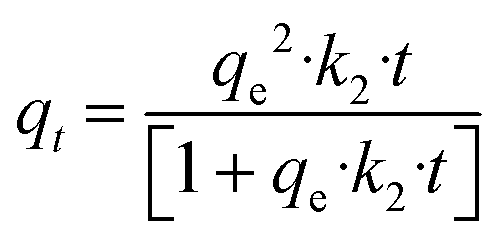
The LPSO kinetic model can be written as eqn (3). The nonlinear PSO (NLPSO) model was also assessed and can be written as eqn (4)
 | (3) |
 | (4) |
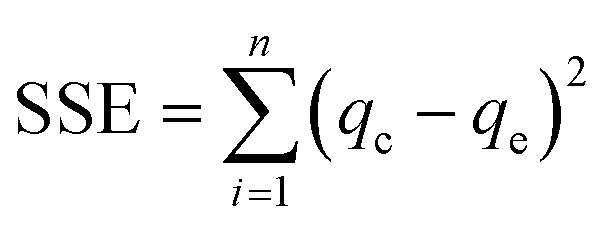
Error minimization techniques were employed between experimental results and the modelled data. In this work, the sum of square error (SSE) was calculated for both nonlinear models to minimize error at both high and low adsorbate concentrations. SSE can be calculated using eqn (5)
 | (5) |
2.8. Field-scale evaluation of PAC-NaA hydrogel concentration methods for the detection of SARS-CoV-2 and adenovirus in wastewater
To evaluate the efficacy of the PAC-NaA hydrogel bead-based method for concentrating endogenous SARS-CoV-2 and Adenovirus from wastewater, 1 L composite samples were collected from the influent streams of two WWTPs (Plant A and Plant B) by 24 h autosamplers. To concentrate viral RNA from wastewater, 1 g of the hydrogel beads were introduced into 50 mL of each wastewater sample, shaken for 1 min, left to incubate for 5 min, and then centrifuged for 10 min at 1190 RCF. Following centrifugation, the hydrogel beads were separated from the wastewater and 40 mL of Tween®20-based buffer was added to desorb viral particles from the hydrogel beads. Viral RNA was extracted and analyzed through RT-qPCR in biological and technical duplicates, respectively.2.9. Total nucleic acid extraction
Viral RNA was extracted using the Promega Wizard® Enviro TNA Kit (Promega Corp., United States) as the manufacturer's protocol for extracting viral RNA. In brief, the protocol started with the addition of 0.5 mL protease solution in 40 mL of sample that were placed into 50 mL sterile centrifuge tubes (Sarstedt, Germany) and were incubated for 30 min at room temperature. The samples were centrifuged at 3000 × g for 10 min and the supernatant (∼20 mL) was decanted into a clean sterile 50 mL centrifuge tube. To 20 mL of clarified supernatant, 6 mL of binding buffer 1, 0.5 mL of binding buffer 2 and 24 mL of isopropanol (Fisher Chemical, United Kingdom) were added and were mixed well. The mixture from each tube was poured in one PureYield Binding Column which was placed on the Vac-Man Laboratory Vacuum Manifold. The total nucleic acid (TNA) content was retained on the membrane of the PureYield Binding Column. Inhibitor Removal Wash (5 mL) and RNA Wash Solution (20 mL) were passed through the PureYield Binding Column by vacuum (at a vacuum pressure ≥60 kPa, and a flow rate of <2 mL min−1). Finally, 1 mL of preheated nuclease-free water (60 °C) was added into the columns and the TNA content was collected in 1.5 mL microcentrifuge tubes (Eppendorf, Germany).2.10. RT-qPCR analysis
The isolated RNA was utilized for viral detection of SARS-CoV-2 and Adenovirus (AdV) 40/41 genes by RT-qPCR analysis. Oligonucleotide sequences for both AdV and SARS-CoV-2 RT-qPCR assays are shown in Table 1. SARS-CoV-2 RT-qPCR reactions were composed of 20 μL volumes, comprising 15 μL of amplification mix and 5 μL of template, following the manufacturer's recommended protocol (Promega Corp., United States). AdV RT-qPCR reactions of 20 μL volumes contained 3 μL of isolated nucleic acid, 5 μL of TaqMan fast Virus 1-Step Master Mix, and appropriate volumes for primer and probe concentrations.24Samples were analyzed using the Gene Count Q-96 thermocycler instrument (LuminUltra Technologies, Ltd., Fredericton, NB, CA). The number of viral genome copies per qPCR reaction were determined from a standard curve. Serial dilutions (5.0 × 100–5.0 × 10⁴ copies per reaction) of Twist Bioscience SARS-CoV-2 RNA standard control and an AdV single stranded DNA standard control (gBlocks®) were used to produce standard curves. The SARS-CoV-2 calibration curve had an efficiency of ∼95%, an R2 value of 0.995, a y-intercept of 38.64, and a slope of −3.45. The AdV calibration curve had an efficiency of ∼102%, an R2 value of 0.990, a y-intercept of 39.22, and slope of −3.28. Nuclease-free water served as a non-template-control (NTCs) for each reaction. Thermal cycling reactions were carried out as follows for SARS-CoV-2 analysis: a reverse transcription step at 45 °C for 15 min followed by a second pre-denaturation step at 95 °C for 2 min. These steps were followed by 40 cycles of 95 °C for 15 s and 62 °C for 60 s. Thermocycling conditions for AdV analysis were as follows: 5 min at 50 °C, 20 s at 95 °C, 40 cycles of 3 s at 95 °C, and 30 s at 60 °C. Positive detections were indicated by cycle quantification (Cq) values under 40, and the RT-qPCR upper detection threshold for either assay ranges between ∼5–8 copies per reaction.
2.11. Quality assurance-quality control (QA-QC)
To ensure the reliability of our RT-qPCR results, guidelines outlined in the minimum information for publication of quantitative real-time PCR experiments (MIQE)27 and environmental microbiology minimum information (EMMI) were utilized.28 Quantitative outcomes were carefully reported, using a Cq value threshold of ≤40 cycles. Results which fell below this threshold were classified as non-detections. Negative controls, including negative nucleic acid extraction controls and negative RT-qPCR template controls, were integral to the experimental design. If process blanks showed any signs of amplification, those results were excluded from the analysis, and the experiments were repeated. Furthermore, to mitigate the risk of potential contamination, nucleic acid extraction and RT-qPCR preparation were performed in distinct laboratory settings. Specific zones were designated for sample processing, RNA extractions, preparation of RT-qPCR master mix, and amplification procedures. For nucleic acid extractions and spiked bench-scale experiments, work was conducted within a Thermo Scientific 1300 Series A2 biosafety cabinet, while a Mystaire MY Model PCR Prep Station Class 100 laminar flow enclosure was utilized to prevent sample contamination. RT-qPCR mastermix solutions utilized exclusive enzymes and formulations capable of withstanding reverse transcriptase and PCR inhibitors, such as humic acids, commonly present in nucleic acid samples purified from wastewater.2.12. Data analysis
RNA concentrations which reflect the amount of viral gene concentration per gram (GC g−1) of hydrogel were calculated using eqn (6). Average viral concentrations were calculated, and standard deviation among replicates was represented with error bars. The recovery of HI-SCV-2 RNA was calculated using eqn (7), where the total wastewater volume was 50 mL, and the spiked HI-SCV-2 concentrations were 1 × 10⁵ GC mL−1. Graphs were generated using RStudio (version 4.2.3) and packages including ggplot and tidyverse.29,30 Statistical analysis was conducted using the ANOVA single-factor test for the integrity study or the ANOVA two-factor with replication test, for the elution study. Both statistical analyses employed a significance level of α = 0.05. Microsoft Excel version 2401 (2024) by Microsoft was used for the analysis.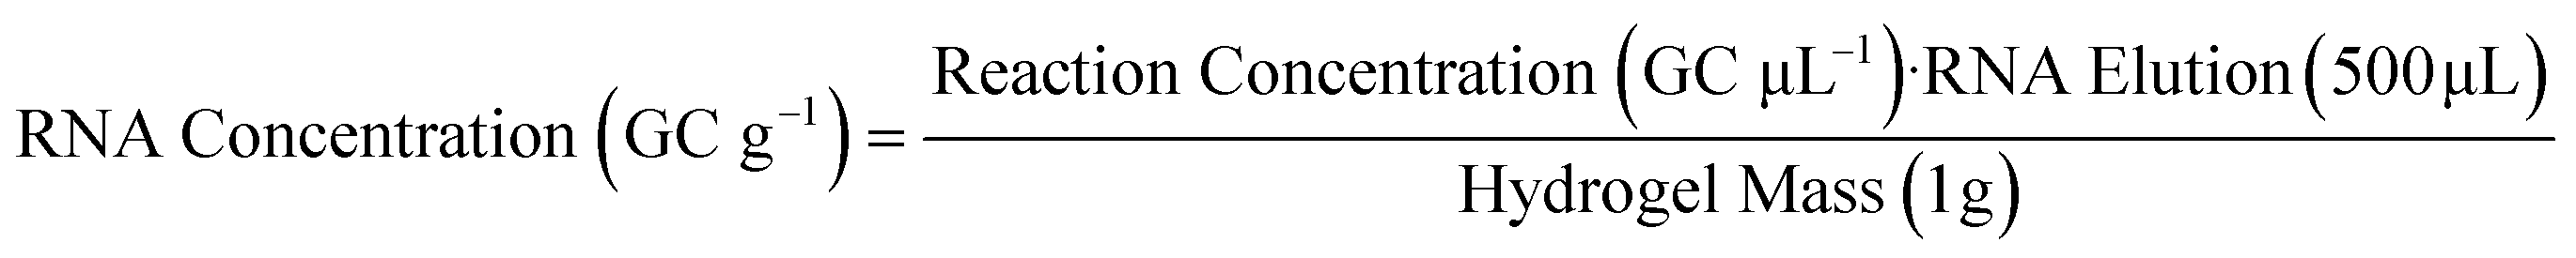 | (6) |
 | (7) |
3. Results and discussion
3.1. Characterization of hydrogel beads through scanning electron microscopy
The hydrogel beads were robust during fabrication, exhibiting minimal visual variations in morphology and no observable aggregation, suggesting a consistent and controlled process. However, SEM imaging unveiled distinct surface morphologies between bead formulations, revealing intricate microscopic differences not evident without microscopy. SEM imaging provided detailed examination of the surface morphology and structural intricacies of each of the hydrogel beads. Fig. 1 illustrates the varying morphologies of NaA (Fig. 1A and B) and PAC-NaA (Fig. 1C and D) beads. The SEM images of the outer surface of the NaA bead (Fig. 1A) reveal a notably rough texture with apparent striations, suggesting an irregular crosslinking density that may serve to increase surface area, thereby providing increased binding sites for viral targets. Conversely, the inner morphology (Fig. 1B) exhibits a smoother structure, suggesting a lower likelihood of viral absorption within the core of the bead. For the PAC-NaA hydrogel beads, the outer surface (Fig. 1C) is characterized by highly irregular crevices and protrusions, indicative of a varied pore distribution, which may influence the interactions of the beads with virus. The increased surface roughness of the PAC-NaA hydrogel beads may enhance virus attachment, as surface irregularities influence electrostatic interactions critical for adsorption.31 The inner surface (Fig. 1D) of the beads displayed a more uniform and porous structure with less pronounced features, but likely offers additional binding sites for effective pathogen capture throughout the bead.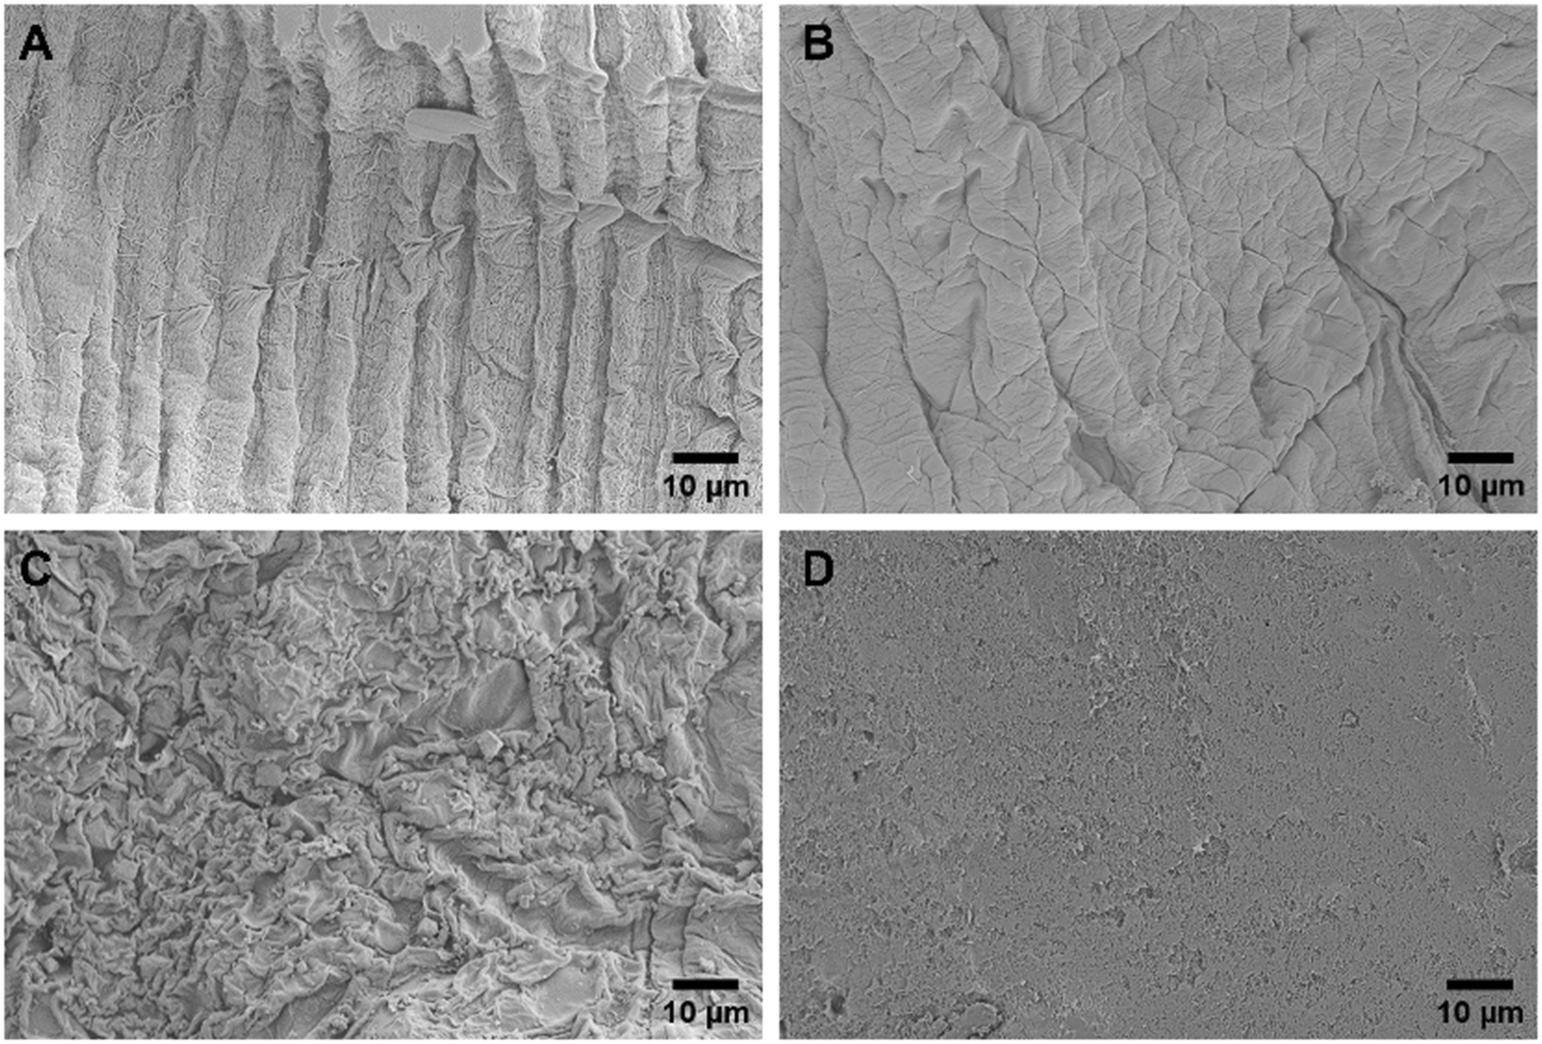 | ||
| Fig. 1 A) Outer NaA hydrogel bead B) inner NaA hydrogel bead C) outer PAC-NaA hydrogel bead D) inner PAC-NaA hydrogel bead. | ||
The contrast in surface morphology between the exterior and interior of the hydrogel beads surfaces may reflect their dual functionality in pathogen capture and release. The heterogeneous structure of the outer layers may maximize viral capture, while the relative uniformity of the interior may facilitate a controlled release of the viruses for subsequent analyses. In summary, the SEM examination of the NaA and PAC-NaA hydrogel beads offers valuable insight into the relationship between surface morphology and functional performance. This information may be used to further fine-tune the utility of hydrogel beads for the capture and detection of various pathogens.
3.2. Assessing the integrity of various hydrogel formulations in wastewater
The two hydrogel bead formulations were subjected to a comparative assessment of structural integrity in a wastewater matrix. Since alginate hydrogels are a primarily hydrophilic matrix, and highly porous due to their cross-linked polymetric network, they have a high capacity for water absorption therefore can swell and de-swell based on the external medium or sample matrix.32 Complex wastewater matrixes can cause hydrogels to swell and degrade depending on the number and strength of crosslinks. This was seen in the NaA hydrogel beads, which experienced a substantial decrease in weight, ∼15%, paired with visible degradation after a two-min agitation period. This degradation was characterized by diminished cohesion and stability, along with visible cracks and fractures on the surface of the beads (Fig. 2). This suggests that NaA hydrogel beads may be prone to rapid deterioration in harsh wastewater environments, potentially limiting their utility. In contrast, the PAC-NaA hydrogel beads demonstrated extended durability, maintaining their pre-agitation mass, and showing no visual signs of degradation following the full 2 min agitation period. The two hydrogel formulations presented significant differences in weights after all exposure times to wastewater (p < 0.05). | ||
| Fig. 2 Integrity of NaA hydrogel beads and PAC-NaA hydrogel beads in wastewater over time. The NaA and PAC-NaA hydrogel bead images were taken after 2 min of exposure. Error bars show the standard deviation of the mean. | ||
The durability exhibited by the PAC-NaA hydrogel beads in wastewater was anticipated, considering the well-documented properties of glutaraldehyde as a crosslinking agent, acknowledged for its ability to form stable crosslinks and enhance the mechanical strength of hydrogels.20 Additionally, the strategic incorporation of PAC into the hydrogel formulation greatly enhances the structural resilience and maintains the consistency of the bead mass over time. This increased stability, resulting from coupling glutaraldehyde with PAC, ensures the integrity of the hydrogel beads throughout the concentration and subsequent elution processes. The durability offered by this formulation positions these hydrogel beads as a promising tool for concentrating viruses from wastewater.
3.3. Comparison of viral recovery techniques for PAC-NaA hydrogel beads
Two physical desorption methods were combined with two elution buffers to determine the most suitable method for recovering HI-SCV-2 from the PAC-NaA hydrogel beads. Elution buffer 1 contained 0.05 M KH2PO4, 1 M NaCl, and 0.1% Tween®80, while elution buffer 2 consisted of 75 μL of Tween®20 and 250 μL of a 0.1 M Tris-HCl solution (100 mL total volume). The two physical desorption methods included 1 min agitation manually and by vortexing. The maximum recoveries for elution buffers 1 and 2 were 8% and 15%, for manual agitation and 0 to 6% for vortexing, respectively (Fig. 3). There was significant difference in virus recoveries between elution buffers, regardless of agitation technique (p < 0.05) and significant difference in virus recoveries between agitation techniques, regardless of elution buffer (p < 0.05).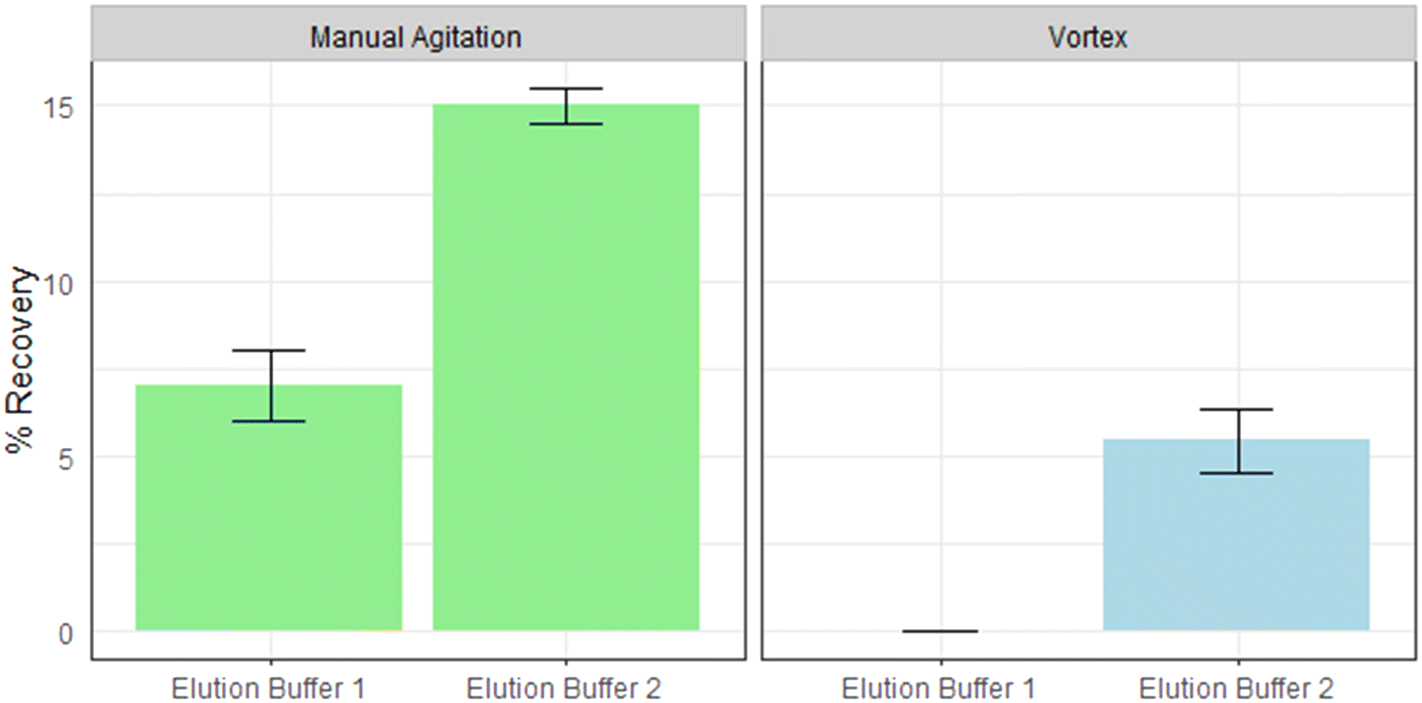 | ||
| Fig. 3 The mean recoveries of HI-SCV-2 from PAC-NaA hydrogel beads with the use of two different elution buffers and two methods of agitation. Error bars show the standard deviation of the mean. | ||
These results indicate that manual agitation in combination with elution buffer 2 was most efficient at recovering HI-SCV-2 from the PAC-NaA hydrogel beads. Elution buffer 2 contained a larger portion of surfactant (Tween®20) in comparison to elution buffer 1. Given its detergent properties, Tween®20 in elution buffer 2 not only facilitates the physical desorption of viral particles from hydrogel beads by weakening their physical bonds but also may disrupt the hydrophobic interactions at the bead surfaces, further enhancing overall viral desorption.33 These findings are supported by our modelled NLPSO results described below and by previous studies which have shown the efficacy of Tween®20-based buffers in microbial recovery.34–36 The lower recovery observed when applying vortexing may be due the potential shearing of viral RNA, which is particularly vulnerable to damage when exposed to overly harsh conditions, such as the high mechanical forces of vortexing.37
3.4. Assessing the kinetic adsorption of PAC-NaA hydrogel beads in wastewater
To investigate the adsorption of HI-SCV-2 by PAC-NaA hydrogel beads in spiked wastewater, our objective was to determine the duration of exposure required to reach maximum adsorption. Initial observations indicated rapid adsorption of HI-SCV-2 within a short exposure time, approaching an equilibrium plateau between 5 and 10 min (Fig. 4). The maximum HI-SCV-2 RNA concentration recovered was ∼2.7 × 10⁵ GC g−1 after 10 min, with a marginally lower concentration of ∼2.6 × 10⁵ GC g−1 after 5 min, suggesting a rapid initial adsorption followed by a gradual plateau as the adsorption sites became saturated and reach a presumed equilibrium.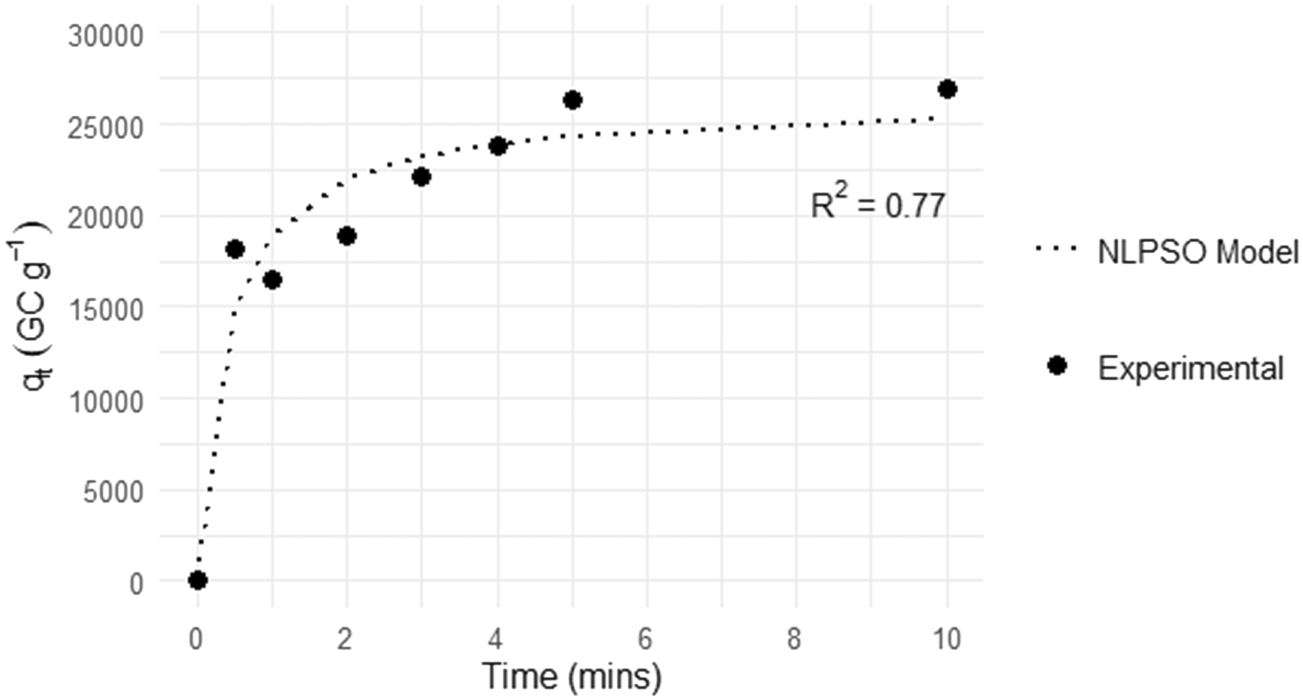 | ||
| Fig. 4 Kinetic adsorption of HI-SCV-2 on PAC-NaA hydrogel beads across several exposure times (0.5–10 min). Data shown is based on the viral concentrations recovered from hydrogel's exposed to wastewater spiked with 1 × 10⁵ GC mL−1 of HI-SCV-2. | ||
To evaluate the mechanisms that may drive adsorption in this system, we compared the experimental data collected across 0.5 to 10 min against LPFO, LPSO, NLPFO and NLPSO kinetic models (Table 2). The adsorption capacity at equilibrium (qe) and the rate constants (K1 and K2) were calculated for all models, revealing insights into the adsorptive interactions between HI-SCV-2 and PAC-NaA hydrogel beads in wastewater. The qe and R2 values obtained from the kinetic models were compared with the experimentally derived values to identify the model that best fit our data.38,39 Ultimately, the NLPSO had the overall best fit, demonstrated by its comparable qe values and an R2 closest to 1.0, indicating a strong correlation with the experimental data and an accurate representation of the possible adsorption processes occurring in the system. The rate constant of the NLPSO model (K2 = 1.0 × 10⁻⁴ GC g−1 min−1) indicates a moderately fast adsorption process where there is typically more available surface area at the start of a reaction.40 It is evident from the plotted data that initial adsorption occurs quickly and seems to slow as adsorption sites become saturated. The NLPSO model estimated that, at equilibrium, the hydrogels would achieve an adsorption capacity of ∼2.6 × 10⁴ GC g−1, which closely matched the results experimentally derived.
| Matrix | Reaction | Type | R 2 | q e (GC g−1) | K 1,2 (GC g−1 min−1) |
|---|---|---|---|---|---|
| Wastewater | PFO | Linear | 0.93 | 4.1 × 10⁴ | 9.7 × 10⁻¹ |
| PSO | Linear | 0.99 | 2.9 × 10⁴ | 5.0 × 10⁻⁵ | |
| PFO | Non-linear | 0.35 | 2.4 × 10⁴ | 1.9 × 100 | |
| PSO | Non-linear | 0.77 | 2.6 × 10⁴ | 1.0 × 10⁻⁴ |
The NLPSO model's kinetic parameters offer valuable insights for optimizing the performance of the hydrogel-based viral capture system. The PSO model assumes that the rate of adsorption and desorption processes (i.e., surface reactions) control the overall adsorption kinetics.41 Studies have theorized that these surface reactions involve the formation of chemical bonds, which are capable of maximizing their arrangement of the surface of the adsorbent.42–44 The ability of the NLPSO model to accurately predict these dynamics was crucial for refining our hydrogel-based viral capture method. Leveraging insights from the PSO model, we are able to define the optimal hydrogel exposure time as 5 min. The findings from this kinetic study may guide the future customization of other hydrogel-based capture methods.
3.5. Comparison of virus concentration methods
To benchmark the PAC-NaA concentration method developed in this study, we compared operational parameters and maximum recovery efficiencies between our method and common concentration practices documented in literature (Table 3). Common methods currently require in excess of one hour to process wastewater samples for virus concentration. Moreover, the recovery efficiency associated with these other methods exhibits a broad range, from a complete lack of recovery to upwards of ∼62%. This variability suggests a substantial inconsistency among the existing viral concentration methods, limiting their reliability for widespread and routine application. These findings highlight the need for dependable concentration methods that yield consistent results without requiring significant labour requirements. In contrast, our study revealed a maximum recovery of up to 15% in a notably truncated timeframe of ∼15 min. The PAC-NaA hydrogel method, noted for its rapid processing times and ease of use, is advantageous for routine sample processing. The methods simplicity and cost-effectiveness also make it an ideal solution for resource-limited settings, presenting a scalable solution for future WWS initiatives.| Conc. method | Pre-treatment | Conc. details | Total time (h) | % recovery | Ref. |
|---|---|---|---|---|---|
| Precipitation–elution | Filtration | Polyethylene glycol 6000, 8–12.5% (w/v) | 1–2 | 0%, 0% | 45, 46 |
| Precipitation–elution | Centrifugation | Polyethylene glycol 6000, 10% (w/v) | >3.5 | ∼10%, 10% | 47, 48 |
| Precipitation–elution | N/A | Polyethylene glycol 6000, 8–10% (w/v) | 2.5–3.75 | ∼24%, 62% | 47, 49 |
| Precipitation | N/A | 0.3 M AlCl3, 1% (v/v) | >1 | 11% | 49 |
| Ultracentrifugation | N/A | Centrifuge at 150![[thin space (1/6-em)]](https://www.rsc.org/images/entities/char_2009.gif) 000 × g for ∼60 min 000 × g for ∼60 min |
>1 | 12%, 25% | 49, 50 |
| Ultrafiltration | Centrifugation | Centrifuged of 4000–4500 × g for ∼15–30 min | 1–5 | ∼10%, 38% | 49, 51 |
| Direct extraction | N/A | N/A | 5 min | ∼4% | 52 |
| Adsorption–elution | Centrifuge | PAC-NaA hydrogels and Tween20®-based buffer | 15 min | 15% | This study |
3.6. Detection of endogenous SARS-CoV-2 and AdV from PAC-NaA hydrogel concentration method
Endogenous viruses in wastewater typically bind to solid particles, exhibiting different behaviours than dispersed viral particles often found when using viral surrogates.53 Consequently, viral surrogates may not accurately reflect partitioning behaviours in wastewater. To explore this, we evaluated the efficacy of our PAC-NaA hydrogel concentration technique to concentrate SARS-CoV-2 and AdV in composite wastewater samples collected from two WWTPs (Plant A and Plant B). Fig. 5 showcases the detection of SARS-CoV-2 in wastewater from Plant A and Plant B, with mean RNA concentrations of 7.4 × 10³ GC g−1 and 4.0 × 10³ GC g−1, respectively. In contrast, AdV was only detected in wastewater collected from Plant B, with a mean DNA concentration of 1.6 × 10⁴ GC g−1.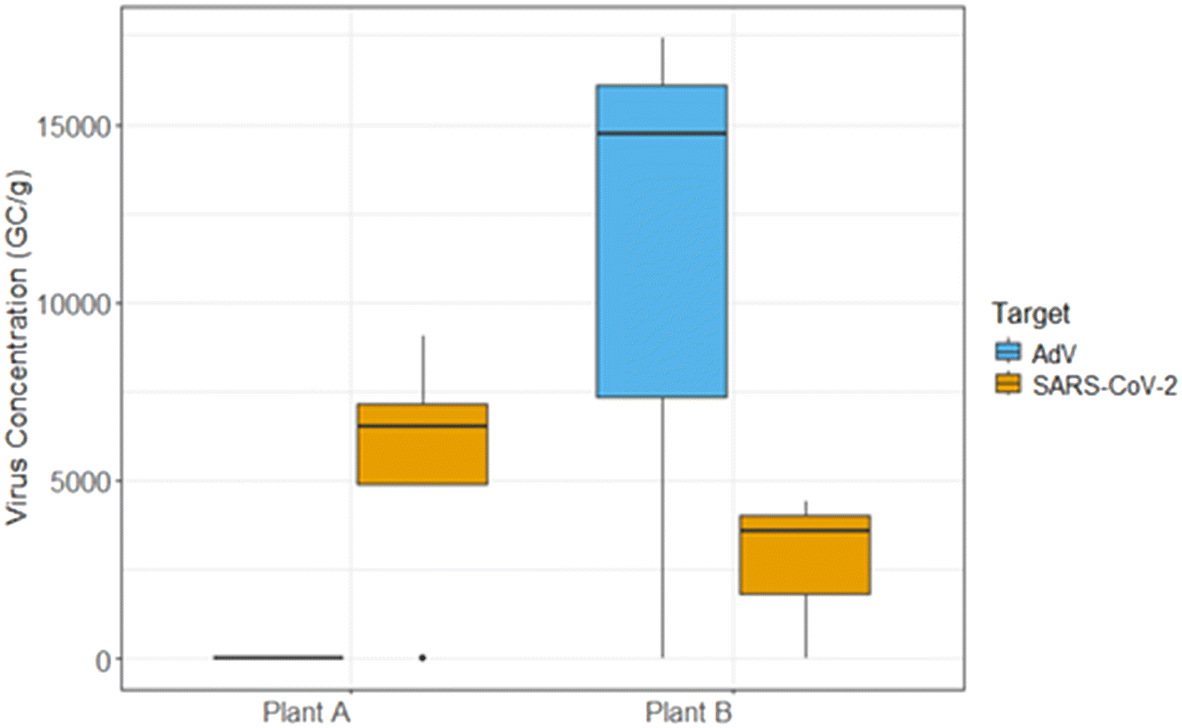 | ||
| Fig. 5 Boxplot showing the viral concentrations (GC g−1) for SARS-CoV-2 (yellow) and AdV (light blue). From composite wastewater samples collected at the influent stream of two WWTPs and concentrated using PAC-NaA hydrogel beads. Each bars range of viral concentrations is depicted by lower and upper bar regions, representing the 25th and 75th percentiles. The median value is marked by the horizontal line within each box. The error lines extending from each box illustrates the 10th and 90th percentiles for each group. | ||
The field-scale results highlight the effectiveness of the PAC-NaA hydrogel concentration method to concentrate an enveloped virus, SARS-CoV-2 and a non-enveloped virus, AdV, from two WWTPs with differing water quality parameters. Variations in viral concentrations observed in this study may be attributed to various factors, including the different influent compositions and flow rates at the two examined WWTPs. Plant A is characterized by a higher total suspended solids (TSS) (214 mg L−1) and a greater flow rate (32941 m3 per day), receiving water from non-domestic sources. The influx of non-domestic water contributes to the high flow rate, resulting in the dilution of viral signals which consequently leads to a reduced frequency of virus detection. This aligns with previous findings which suggest that high flow rates may reduce the concentration of viral particles available for capture.54,55 Higher TSS concentrations in wastewater have been associated with the potential for adsorption and binding of viruses, impacting the efficiency of downstream viral recovery and detection.56–58 In contrast, Plant B with a lower TSS (148 mg L−1) and a lower flow rate (10794 m3 per day) displayed increased virus detection frequencies. This may suggest a more favourable environment for the PAC-NaA hydrogel beads to concentrate viral particles, consistent with literature indicating that moderate TSS levels can improve viral recovery performance.57 While our methodology has demonstrated effectiveness in concentrating both enveloped and non-enveloped viruses in wastewater, future work should aim to consider the impact of virus type, viral loading and the composition of wastewater to method efficiency.
4. Conclusions
In conclusion, this study presents an innovative approach for concentrating viruses from wastewater using a simple PAC-NaA hydrogel bead-based method. The study met objectives through a sequence of bench-scale experiments, which involved identifying a suitable hydrogel bead formulation, evaluating kinetic models, and assessing different elution buffers. The PSO model played a crucial role in identifying optimal parameters for maximum viral capture, highlighting the significance of exposure duration and the choice of elution buffer. The kinetic model was used to establish the optimal exposure time of PAC-NaA hydrogel beads in wastewater, ensuring efficient adsorption while preventing saturation. As well, kinetic analysis was instrumental in validating the suitability of the Tween®20-based elution buffer for effective viral recovery from the hydrogel beads surface.Through a series of bench-scale experiments, it was established that the use of PAC-NaA hydrogel beads, exposed to wastewater for 5 min, coupled with a viral recovery of 1 min manual agitation, and a Tween®20-based elution buffer, yields the highest recovery rates. Employing this concentration step enabled the successful detection of endogenous SARS-CoV-2 and AdV in wastewater. The method's advantages lie in its adaptability and simplicity, as hydrogel beads can be modified to enhance viral adsorption efficiency for various environmental contexts. Future research should focus on scaling and reproducibility, tailoring hydrogel formulations for specific viruses, and further exploring modifications to improve affinity for target viruses in various matrices beyond wastewater, particularly in scenarios with low viral loads. By addressing these research areas, a hydrogel concentration and capture system may be optimized for broader applications in viral surveillance and environmental monitoring.
Conflicts of interest
There are no conflicts to declare.Acknowledgements
This study was funded with support from LuminUltra Technologies Ltd, Mantech Inc., AGAT Laboratories, Halifax Water, AquiSense Technologies, CBCL Limited, City of Moncton, Cape Breton Regional Municipality through a New Frontiers in Research Fund [Grant Number NFRFR-2021-00081], a Research Nova Scotia Special Initiatives Grant [Grant Number #1367], an NSERC Alliance Grant (ALLRP 568507 - 21), Canada Research Chairs Program (J. P. F.), and Natural Sciences and Engineering Research, Council of Canada (J. P. F., RGPIN-2023-03713).References
- D. G. Manuel, R. Delatolla, D. N. Fisman, M. Fuzzen, T. Graber, G. M. Katz, J. Kim, C. Landgraff, A. MacKenzie, A. Maltsev, A. Majury, R. M. McKay, J. Minnery, M. Servos, J. S. Weese, A. McGeer, K. B. Born, K. Barrett, B. Schwartz and P. Jüni, The Role of Wastewater Testing for SARS-CoV-2 Surveillance, Ontario COVID-19 Science Advisory Table, 2021 Search PubMed.
- S. E. Hrudey, D. S. Silva, J. Shelley, W. Pons, J. Isaac-Renton, A. H.-S. Chik and B. Conant, Ethics Guidance for Environmental Scientists Engaged in Surveillance of Wastewater for SARS-CoV-2, Environ. Sci. Technol., 2021, 55, 8484–8491 CrossRef CAS PubMed
.
- J. Calabria de Araujo, S. Gavazza, T. L. Leao, L. Florencio, H. P. da Silva, J. de O. Albuquerque, M. A. de Lira Borges, R. B. de Oliveira Alves, R. H. A. Rodrigues and E. B. dos Santos, SARS-CoV-2 sewage surveillance in low-income countries: potential and challenges, J. Water Health, 2020, 19, 1–19 CrossRef
- M. T. Flood, J. Sharp, J. Bruggink, M. Cormier, B. Gomes, I. Oldani, L. Zimmy and J. B. Rose, Understanding the efficacy of wastewater surveillance for SARS-CoV-2 in two diverse communities, PLoS One, 2023, 18, e0289343 CrossRef CAS PubMed
- J. S. McClary-Gutierrez, M. C. Mattioli, P. Marcenac, A. I. Silverman, A. B. Boehm, K. Bibby, M. Balliet, F. L. de los Reyes, D. Gerrity, J. F. Griffith, P. A. Holden, D. Katehis, G. Kester, N. LaCross, E. K. Lipp, J. Meiman, R. T. Noble, D. Brossard and S. L. McLellan, SARS-CoV-2 Wastewater Surveillance for Public Health Action, Emerging Infect. Dis., 2021, 27(9), e210753 CrossRef PubMed
- F. Hassard, M. Vu, S. Rahimzadeh, V. Castro-Gutierrez, I. Stanton, B. Burczynska, D. Wildeboer, G. Baio, M. R. Brown, H. Garelick, J. Hofman, B. Kasprzyk-Hordern, A. Majeed, S. Priest, H. Denise, M. Khalifa, I. Bassano, M. J. Wade, J. Grimsley, L. Lundy, A. C. Singer and M. Di Cesare, Wastewater monitoring for detection of public health markers during the COVID-19 pandemic: Near-source monitoring of schools in England over an academic year, PLoS One, 2023, 18, e0286259 CrossRef CAS PubMed
- G. Carvajal, A. Branch, S. A. Sisson, D. J. Roser, B. van den Akker, P. Monis, P. Reeve, A. Keegan, R. Regel and S. J. Khan, Virus removal by ultrafiltration: Understanding long-term performance change by application of Bayesian analysis, Water Res., 2017, 122, 269–279 CrossRef CAS
- G. J. Gentile, M. C. Cruz, V. B. Rajal and M. M. Fidalgo de Cortalezzi, Electrostatic interactions in virus removal by ultrafiltration membranes, J. Environ. Chem. Eng., 2018, 6, 1314–1321 CrossRef CAS
- E. Haramoto, H. Katayama, E. Utagawa and S. Ohgaki, Recovery of human norovirus from water by virus concentration methods, J. Virol. Methods, 2009, 160, 206–209 CrossRef CAS PubMed
- H. Shi, E. V. Pasco and V. V. Tarabara, Membrane-based methods of virus concentration from water: a review of process parameters and their effects on virus recovery, Environ. Sci.: Water Res. Technol., 2017, 3, 778–792 RSC
- M. Victoria, F. Guimarães, T. Fumian, F. Ferreira, C. Vieira, J. P. Leite and M. Miagostovich, Evaluation of an adsorption–elution method for detection of astrovirus and norovirus in environmental waters, J. Virol. Methods, 2009, 156, 73–76 CrossRef CAS
- D.-N. Wang, L. Liu, Z.-G. Qiu, Z.-Q. Shen, X. Guo, D. Yang, J. Li, W. Liu, M. Jin and J.-W. Li, A new adsorption-elution technique for the concentration of aquatic extracellular antibiotic resistance genes from large volumes of water, Water Res., 2016, 92, 188–198 CrossRef CAS PubMed
- Z. Zheng, A. Ali, J. Su, Y. Fan and S. Zhang, Layered double hydroxide modified biochar combined with sodium alginate: A powerful biomaterial for enhancing bioreactor performance to remove nitrate, Bioresour. Technol., 2021, 323, 124630 CrossRef CAS PubMed
- M. Ahmaruzzaman, P. Roy, A. Bonilla-Petriciolet, M. Badawi, S. V. Ganachari, N. P. Shetti and T. M. Aminabhavi, Polymeric hydrogels-based materials for wastewater treatment, Chemosphere, 2023, 331, 138743 CrossRef CAS PubMed
- S. Thakur, B. Sharma, A. Verma, J. Chaudhary, S. Tamulevicius and V. K. Thakur, Recent progress in sodium alginate based sustainable hydrogels for environmental applications, J. Cleaner Prod., 2018, 198, 143–159 CrossRef CAS
- X. Zhang, L. Yang, W. Wang, Y. Xiang, J. Liu, Y. An, J. Shi, H. Qi and Z. Huang, Sodium alginate/sodium lignosulfonate hydrogel based on inert Ca2+ activation for water conservation and growth promotion, Environ. Res., 2024, 118144 CrossRef PubMed
- S. S. Shah, B. Ramos and A. C. S. C. Teixeira, Adsorptive Removal of Methylene Blue Dye Using Biodegradable Superabsorbent Hydrogel Polymer Composite Incorporated with Activated Charcoal, Water, 2022, 14, 3313 CrossRef CAS
- B. Wang, Y. Wan, Y. Zheng, X. Lee, T. Liu, Z. Yu, J. Huang, Y. S. Ok, J. Chen and B. Gao, Alginate-based composites for environmental applications: a critical review, Crit. Rev. Environ. Sci. Technol., 2019, 49, 318–356 CrossRef CAS PubMed
- B. Wang, B. Gao, A. R. Zimmerman, Y. Zheng and H. Lyu, Novel biochar-impregnated calcium alginate beads with improved water holding and nutrient retention properties, J. Environ. Manage., 2018, 209, 105–111 CrossRef CAS PubMed
- S. P. Pilipchuk, M. K. Vaicik, J. C. Larson, E. Gazyakan, M.-H. Cheng and E. M. Brey, Influence of crosslinking on the stiffness and degradation of dermis-derived hydrogels, J. Biomed. Mater. Res., Part A, 2013, 101, 2883–2895 CrossRef PubMed
- A. Bivins, J. Greaves, R. Fischer, K. C. Yinda, W. Ahmed, M. Kitajima, V. J. Munster and K. Bibby, Persistence of SARS-CoV-2 in Water and Wastewater, Environ. Sci. Technol. Lett., 2020, 7, 937–942 CrossRef CAS PubMed
- W. Ahmed, N. Angel, J. Edson, K. Bibby, A. Bivins, J. W. O'Brien, P. M. Choi, M. Kitajima, S. L. Simpson, J. Li, B. Tscharke, R. Verhagen, W. J. M. Smith, J. Zaugg, L. Dierens, P. Hugenholtz, K. V. Thomas and J. F. Mueller, First confirmed detection of SARS-CoV-2 in untreated wastewater in Australia: A proof of concept for the wastewater surveillance of COVID-19 in the community, Sci. Total Environ., 2020, 728, 138764 CrossRef CAS PubMed
- I. A. Hamza, L. Jurzik, A. Stang, K. Sure, K. Überla and M. Wilhelm, Detection of human viruses in rivers of a densly-populated area in Germany using a virus adsorption elution method optimized for PCR analyses, Water Res., 2009, 43, 2657–2668 CrossRef CAS PubMed
- E. K. Hayes, M. T. Gouthro, M. Fuller, D. J. Redden and G. A. Gagnon, Enhanced detection of viruses for improved water safety, Sci. Rep., 2023, 13, 17336 CrossRef CAS PubMed
- D.-Y. Lee, K. T. Leung, H. Lee and M. B. Habash, Simultaneous Detection of Selected Enteric Viruses in Water Samples by Multiplex Quantitative PCR, Water, Air, Soil Pollut., 2016, 227, 107 CrossRef
- X. Lu, L. Wang, S. K. Sakthivel, B. Whitaker, J. Murray, S. Kamili, B. Lynch, L. Malapati, S. A. Burke, J. Harcourt, A. Tamin, N. J. Thornburg, J. M. Villanueva and S. Lindstrom, US CDC Real-Time Reverse Transcription PCR Panel for Detection of Severe Acute Respiratory Syndrome Coronavirus 2, Emerging Infect. Dis., 2020, 26, 1654–1665 CrossRef CAS PubMed
- S. A. Bustin, V. Benes, J. A. Garson, J. Hellemans, J. Huggett, M. Kubista, R. Mueller, T. Nolan, M. W. Pfaffl, G. L. Shipley, J. Vandesompele and C. T. Wittwer, The MIQE Guidelines: Minimum Information for Publication of Quantitative Real-Time PCR Experiments, Clin. Chem., 2009, 55, 611–622 CrossRef CAS
- M. A. Borchardt, A. B. Boehm, M. Salit, S. K. Spencer, K. R. Wigginton and R. T. Noble, The Environmental Microbiology Minimum Information (EMMI) Guidelines: qPCR and dPCR Quality and Reporting for Environmental Microbiology, Environ. Sci. Technol., 2021, 55, 10210–10223 CrossRef CAS PubMed
-
H. Wickham, in ggplot2: Elegant Graphics for Data Analysis, ed. H. Wickham, Springer International Publishing, Cham, 2016, pp. 189–201 Search PubMed
- H. Wickham, M. Averick, J. Bryan, W. Chang, L. McGowan, R. François, G. Grolemund, A. Hayes, L. Henry, J. Hester, M. Kuhn, T. Pedersen, E. Miller, S. Bache, K. Müller, J. Ooms, D. Robinson, D. Seidel, V. Spinu, K. Takahashi, D. Vaughan, C. Wilke, K. Woo and H. Yutani, Welcome to the Tidyverse, J. Open Source Softw., 2019, 4, 1686 CrossRef
- V. Rosa, D. Ho, R. Sabino-Silva, W. L. Siqueira and N. Silikas, Fighting viruses with materials science: Prospects for antivirus surfaces, drug delivery systems and artificial intelligence, Dent. Mater., 2021, 37, 496–507 CrossRef CAS
- E. M. Ahmed, Hydrogel: Preparation, characterization, and applications: A review, J. Adv. Res., 2015, 6, 105–121 CrossRef CAS PubMed
- V. D. Canh, T. T. V. Nga, N. T. Lien and H. Katayama, Development of a simple and low-cost method using Moringa seeds for efficient virus concentration in wastewater, Sci. Total Environ., 2023, 905, 167101 CrossRef CAS PubMed
- E. Hayes, C. Sweeney, L. Anderson, B. Li, G. Erjavec, M. Gouthro, W. Krkosek, A. Stoddart and G. Gagnon, A novel passive sampling approach for SARS-CoV-2 in wastewater in a Canadian province with low prevalence of COVID-19, Environ. Sci.: Water Res. Technol., 2021, 7, 1576–1586 RSC
- E. Forés, S. Bofill-Mas, M. Itarte, S. Martínez-Puchol, A. Hundesa, M. Calvo, C. M. Borrego, L. L. Corominas, R. Girones and M. Rusiñol, Evaluation of two rapid ultrafiltration-based methods for SARS-CoV-2 concentration from wastewater, Sci. Total Environ., 2021, 768, 144786 CrossRef
- M. Jang, S. Kim, J. Song and S. Kim, Rapid and simple detection of influenza virus via isothermal amplification lateral flow assay, Anal. Bioanal. Chem., 2022, 414, 4685–4696 CrossRef CAS PubMed
- S. A. Thatcher, DNA/RNA Preparation for Molecular Detection, Clin. Chem., 2015, 61, 89–99 CrossRef CAS PubMed
- E. C. Lima, F. Sher, A. Guleria, M. R. Saeb, I. Anastopoulos, H. N. Tran and A. Hosseini-Bandegharaei, Is one performing the treatment data of adsorption kinetics correctly?, J. Environ. Chem. Eng., 2021, 9, 104813 CrossRef CAS
- E. D. Revellame, D. L. Fortela, W. Sharp, R. Hernandez and M. E. Zappi, Adsorption kinetic modeling using pseudo-first order and pseudo-second order rate laws: A review, Clean. Eng. Technol., 2020, 1, 100032 CrossRef
-
G. W. Kajjumba, S. Emik, A. Öngen, H. K. Özcan and S. Aydın, in Advanced Sorption Process Applications, IntechOpen Limited, UK, 2018, p. 10, DOI:10.5772/intechopen.75857
- W. Plazinski, J. Dziuba and W. Rudzinski, Modeling of sorption kinetics: the pseudo-second order equation and the sorbate intraparticle diffusivity, Adsorption, 2013, 19, 1055–1064 CrossRef CAS
- S. Azizian, Kinetic models of sorption: a theoretical analysis, J. Colloid Interface Sci., 2004, 276, 47–52 CrossRef CAS PubMed
- W. Plazinski, W. Rudzinski and A. Plazinska, Theoretical models of sorption kinetics including a surface reaction mechanism: A review, Adv. Colloid Interface Sci., 2009, 152, 2–13 CrossRef CAS
- Y. Liu and Y.-J. Liu, Biosorption isotherms, kinetics and thermodynamics, Sep. Purif. Technol., 2008, 61, 229–242 CrossRef CAS
- H. Katayama, A. Shimasaki and S. Ohgaki, Development of a Virus Concentration Method and Its Application to Detection of Enterovirus and Norwalk Virus from Coastal Seawater, Appl. Environ. Microbiol., 2002, 68, 1033–1039 CrossRef CAS PubMed
- F. Wu, J. Zhang, A. Xiao, X. Gu, W. L. Lee, F. Armas, K. Kauffman, W. Hanage, M. Matus, N. Ghaeli, N. Endo, C. Duvallet, M. Poyet, K. Moniz, A. D. Washburne, T. B. Erickson, P. R. Chai, J. Thompson and E. J. Alm, SARS-CoV-2 Titers in Wastewater Are Higher than Expected from Clinically Confirmed Cases, mSystems, 2020, 5 DOI:10.1128/msystems.00614-20
- P. A. Barril, L. A. Pianciola, M. Mazzeo, M. J. Ousset, M. V. Jaureguiberry, M. Alessandrello, G. Sánchez and J. M. Oteiza, Evaluation of viral concentration methods for SARS-CoV-2 recovery from wastewaters, Sci. Total Environ., 2021, 756, 144105 CrossRef CAS PubMed
- G. D. Lewis and T. G. Metcalf, Polyethylene glycol precipitation for recovery of pathogenic viruses, including hepatitis A virus and human rotavirus, from oyster, water, and sediment samples, Appl. Environ. Microbiol., 1988, 54, 1983–1988 CrossRef CAS PubMed
- X. Zheng, Y. Deng, X. Xu, S. Li, Y. Zhang, J. Ding, H. Y. On, J. C. C. Lai, C. In Yau, A. W. H. Chin, L. L. M. Poon, H. M. Tun and T. Zhang, Comparison of virus concentration methods and RNA extraction methods for SARS-CoV-2 wastewater surveillance, Sci. Total Environ., 2022, 824, 153687 CrossRef CAS PubMed
- M. L. Wilder, F. Middleton, D. A. Larsen, Q. Du, A. Fenty, T. Zeng, T. Insaf, P. Kilaru, M. Collins, B. Kmush and H. C. Green, Co-quantification of crAssphage increases confidence in wastewater-based epidemiology for SARS-CoV-2 in low prevalence areas, Water Res.: X, 2021, 11, 100100 CAS
- D. Mailepessov, S. Arivalan, M. Kong, J. Griffiths, S. L. Low, H. Chen, H. C. Hapuarachchi, X. Gu, W. L. Lee, E. J. Alm, J. Thompson, S. Wuertz, K. Gin, L. C. Ng and J. C. C. Wong, Development of an efficient wastewater testing protocol for high-throughput country-wide SARS-CoV-2 monitoring, Sci. Total Environ., 2022, 826, 154024 CrossRef CAS
- Z. W. LaTurner, D. M. Zong, P. Kalvapalle, K. R. Gamas, A. Terwilliger, T. Crosby, P. Ali, V. Avadhanula, H. H. Santos, K. Weesner, L. Hopkins, P. A. Piedra, A. W. Maresso and L. B. Stadler, Evaluating recovery, cost, and throughput of different concentration methods for SARS-CoV-2 wastewater-based epidemiology, Water Res., 2021, 197, 117043 CrossRef CAS PubMed
- A. H. S. Chik, M. B. Glier, M. Servos, C. S. Mangat, X.-L. Pang, Y. Qiu, P. M. D'Aoust, J.-B. Burnet, R. Delatolla, S. Dorner, Q. Geng, J. P. Giesy, R. M. McKay, M. R. Mulvey, N. Prystajecky, N. Srikanthan, Y. Xie, B. Conant and S. E. Hrudey, Comparison of approaches to quantify SARS-CoV-2 in wastewater using RT-qPCR: Results and implications from a collaborative inter-laboratory study in Canada, J. Environ. Sci., 2021, 107, 218–229 CrossRef CAS PubMed
- S. G. Anekal, Y. Zhu, M. D. Graham and J. Yin, Dynamics of virus spread in the presence of fluid flow, Integr. Biol., 2009, 1, 664–671 CrossRef CAS PubMed
- A. Mitranescu, A. Uchaikina, A.-S. Kau, C. Stange, J. Ho, A. Tiehm, C. Wurzbacher and J. E. Drewes, Wastewater-Based Epidemiology for SARS-CoV-2 Biomarkers: Evaluation of Normalization Methods in Small and Large Communities in Southern Germany, ACS EST Water, 2022, 2, 2460–2470 CrossRef CAS PubMed
- M. Kostoglou, M. Petala, T. Karapantsios, C. Dovas, E. Roilides, S. Metallidis, A. Papa, E. Stylianidis, A. Papadopoulos and N. Papaioannou, SARS-CoV-2 adsorption on suspended solids along a sewerage network: mathematical model formulation, sensitivity analysis, and parametric study, Environ. Sci. Pollut. Res., 2022, 29, 11304–11319 CrossRef CAS PubMed
- E. K. Hayes, C. L. Sweeney, M. Fuller, G. B. Erjavec, A. K. Stoddart and G. A. Gagnon, Operational Constraints of Detecting SARS-CoV-2 on Passive Samplers using Electronegative Filters: A Kinetic and Equilibrium Analysis, ACS EST Water, 2022, 2, 1910–1920 CrossRef CAS PubMed
- M. Petala, D. Dafou, M. Kostoglou, Th. Karapantsios, E. Kanata, A. Chatziefstathiou, F. Sakaveli, K. Kotoulas, M. Arsenakis, E. Roilides, T. Sklaviadis, S. Metallidis, A. Papa, E. Stylianidis, A. Papadopoulos and N. Papaioannou, A physicochemical model for rationalizing SARS-CoV-2 concentration in sewage. Case study: The city of Thessaloniki in Greece, Sci. Total Environ., 2021, 755, 142855 CrossRef CAS PubMed
Footnote |
| † Electronic supplementary information (ESI) available. See DOI: https://doi.org/10.1039/d4ew00370e |
| This journal is © The Royal Society of Chemistry 2025 |