
 Open Access Article
 This Open Access Article is licensed under a Creative Commons Attribution-Non Commercial 3.0 Unported Licence
Unveiling rare ionic bonds in dissimilar 2D materials for selective ampere-level oxygen evolution reaction in seawater†
Muhammad Waqas
Khan‡
ab,
Suraj
Loomba‡
b,
Muhammad
Haris
b,
Kevin
Tran
 b,
Sharafadeen
Gbadamasi
b,
Kai
Xu
b,
Md
Mohiuddin
b,
Vasundhara
Nettem
a,
Azmira
Jannat
b,
Patrick D.
Taylor
b,
Lars
Thomsen
d,
Anton
Tadich
d,
Ravichandar
Babarao
a,
Jian Zhen
Ou
b,
Michelle J.S.
Spencer
c and
Nasir
Mahmood
*ab
b,
Sharafadeen
Gbadamasi
b,
Kai
Xu
b,
Md
Mohiuddin
b,
Vasundhara
Nettem
a,
Azmira
Jannat
b,
Patrick D.
Taylor
b,
Lars
Thomsen
d,
Anton
Tadich
d,
Ravichandar
Babarao
a,
Jian Zhen
Ou
b,
Michelle J.S.
Spencer
c and
Nasir
Mahmood
*ab
aSchool of Science, RMIT University, GPO Box 2476, Melbourne, Victoria 3000, Australia. E-mail: nasir.mahmood@rmit.edu.au
bSchool of Engineering, RMIT University, Melbourne, Victoria 3001, Australia
cARC Centre of Excellence in Future Low-Energy Electronics Technologies, School of Science, RMIT University, GPO Box 2476, Melbourne, Victoria 3001, Australia
dAustralian Synchrotron, ANSTO, 800 Blackburn Road, Clayton, Victoria 3168, Australia
First published on 19th March 2025
Abstract
Direct electrocatalytic seawater splitting is a potential sustainable solution for large-scale green hydrogen production. However, anode deactivation due to impurities and unwanted reactions in seawater hinders its long-term performance. Here, we present a stable ionically bonded metal–organic framework/iron oxide (MOF/Fe2O3) heterostructured catalyst constructed via solid–liquid interfacial chemistry at room temperature. The unique M–O–M (M = metal) ionic bonds at the two-dimensional interface enhance the individual material properties, introducing additional active sites and creating facile charge flow. Theoretical calculations reveal that this system favours hydroxyl ion adsorption and inhibits the chlorine reaction, preventing corrosion and making the catalyst functional for over 900 h in complex seawater. It achieves a current density of 1 A cm−2 at an overpotential of 410 mV, which is ∼200% higher than that of commercially used IrO2. The heterostructured catalyst demonstrated durable performance at a higher current density of ∼1.5 A cm−2 for more than 350 h due to selective anodic reaction and anti-corrosive behaviour against chlorine corrosion. This study provides a scalable strategy to modify the chemical states at heterointerfaces to develop robust catalysts for large-scale direct seawater splitting.
Broader contextConverting water to green hydrogen can relieve the environmental and energy crises. However, the scarcity of freshwater and treated seawater (desalination and deionisation) means that it is not sustainable due to the high investment and maintenance requirements for treatment plants. Direct seawater electrolysis is an ideal option for green hydrogen due to its easy coupling with offshore wind or solar systems, lower land space requirements and reduced cost. Besides these advantages, unwanted reactions and chlorine chemistry lead to the deactivation of the catalyst at the anode during direct seawater splitting, which is a bottleneck for its expansion. Therefore, efforts to construct a high-efficiency and stable catalyst for the oxygen-evolution reaction (OER) at ampere-level current densities in seawater are urgently required. This study proposes a simple and scalable approach for a selective and stable OER over unique ionic bonds harvested in two dissimilar materials at room temperature. Ionic bonds activate the OER and suppress chlorine corrosion, resulting in an ampere-level stable current density for hundreds of hours. This work establishes a practical method for developing an ionic bonded heterointerface for seawater electrolysis to achieve hydrogen production commercially and could inspire the utilisation of these catalysts for other environmental applications. |
Introduction
Producing renewable clean hydrogen fuels via electrolysis of seawater reduces the reliance on fresh or desalinated water supplies, which are limited.1,2 Desalination plants are also economically and operationally expensive, and in particular the huge capital investments required are a big hurdle in coupling them with electrolysers.3–7 Despite the benefits of using seawater, direct seawater electrolysis has many challenges, including limited catalyst activity and stability, the effect of bacteria, microbes and dissolved ions on the catalyst, as well as chloride corrosion and undesired side reactions.8,9 The critical hurdles for upscaling this technology are the unwanted chlorine oxidation reaction (which occurs at pH <7.5) and hypochlorite formation (occurring at pH >7.5). These reactions occur due to the presence of chloride ions and compete with the oxygen evolution reaction (OER).10,11 The chlorine reaction kinetics are dominant over the OER, producing hypochlorite by-products that corrode the system and cause deactivation of the catalyst active sites, resulting in reduced activity and stability.12–14 By carefully designing and optimising the OER catalyst to operate at a lower overpotential (η), as highlighted by the Pourbaix diagram, it is possible to attain stable OER operation.10Currently, the available precious metal oxides, such as RuO2 and IrO2, are considered benchmarks for the OER, but their scarcity, high cost and compromised performance in seawater are hampering their large-scale implementation.15,16 Recently, considerable effort has been focused on the use of non-noble metal-based compounds due to the easy tuning of their electronic structure via heteroatom modification, alloying, surface defects, interface engineering, the use of anti-corrosion/passive layers, and heterostructure construction, which can improve the OER kinetics to help realise direct seawater splitting.11,17–19 For example, doping with atoms like N, B, Se or S can be used to enhance hydroxide ion adsorption compared to that of chloride. However, the stability of the substrate is reduced in the presence of large quantities of Cl− ions. Likewise, penetration of Cl− ions into the catalyst can be avoided by coating the IrOx substrate with an anti-corrosion layer of manganese oxide, but this compromises the catalytic activity.20 Similarly, developing a phosphate layer on Ni–Fe layered double hydroxide (LDH) that repels the Cl− electrostatically enhanced the catalytic activity for a longer time compared to non-protected Ni–Fe LDH.21 However, this layer hindered OH− adsorption and created a high activation barrier for O2 generation. It is therefore of great interest to propose an approach that provides better catalyst stability in a corrosive environment while simultaneously lowering the overpotential.
Considering this, the catalyst should ideally be constructed as a single unit containing complementary features that effectively stop Cl− adsorption and penetration into the structure, improving the OER performance. By creating unique heterostructures that combine the features of the individual components in a single efficient catalyst, tuning of the charge transfer and optimisation of the adsorption/desorption of intermediates can be achieved.22,23 2D/2D (two-dimensional) heterostructures that are weakly bonded do not alter the chemical states sufficiently to create additional active sites. The weakly bonded interface is also not stable for a long time and hence cannot retain its performance for several hundred hours. Therefore, a strong ionically connected heterointerface is needed for higher catalytic activity and greater stability. Such heterostructures that are grown via easily scalable methods and can achieve ampere-level current densities and durable performance in complex seawater have not yet been realised.
To address these challenges, this work reports a 2D ionic bonded heterostructure, cobalt-based metal–organic framework/iron oxide (CoMOF/Fe2O3), using an interface-assisted synthesis technique at room temperature. The 2D Fe2O3 was synthesised using a salt-template scalable approach, with the 2D CoMOF grown on its surface to obtain a strongly connected heterostructure. The heterointerface is anchored via ionic bonds between the Co in the MOF and oxygen atoms in the substrate and results in a stable structure with improved electrocatalytic OER properties. The heterostructure-based catalysts achieved a 0.5 and 1 A cm−2 current density at an overpotential of 310 and 410 mV, respectively, in seawater. The strong ionic connections and the repulsion of Cl− at the heterosurface, supported by density functional theory (DFT) calculations, provide a catalyst that is stable for more than 900 hours. Thus, our hetero-interfacial strategy can be used to produce energy-efficient and stable OER catalysts for direct seawater splitting.
Experimental section
Preparation of 2D Fe2O3 sheets through the salt template method
In a typical synthesis process, 1 g of iron(III) nitrate nonahydrate is dispersed in 20 mL of ethanol followed by 30 min of magnetic stirring. For the precursor@template system, the obtained precursor solution was added dropwise to 310 g of NaCl salt (template) and mixed for ∼20 min at ∼80 °C on a hotplate. This precursor@template was annealed in a tube furnace under N2 at 400 °C for 2 hours to obtain the 2D α-Fe2O3 after filtration.24Growth of the 2D/2D CoMOF/Fe2O3 heterostructure and 2D-CoMOF
The ionically connected 2D/2D CoMOF/Fe2O3 heterostructure was constructed using a facile interface-assisted synthesis technique at room temperature. Typically, 48 mg of 2D α-Fe2O3 was dispersed in 192 mL of methanol/water mixed solution (2![[thin space (1/6-em)]](https://www.rsc.org/images/entities/char_2009.gif) :1 in volume) for 1.5 hours under sonication to obtain solution A. Then, 96 mL of methyl imidazole (25 mM) solution and 96 mL of cobalt nitrate hexahydrate (25 mM) solution were individually added to solution A. The obtained solution B features a 2D/2D heterostructure of CoMOF supported on α-Fe2O3 at room temperature. The product was centrifuged, followed by methanol/ethanol and water washes to remove the unreacted reagents, and vacuum dried. The synthesised catalysts were then drop-cast on Ni foam for electrocatalytic performance testing to prepare the working electrodes. To prepare the 2D CoMOF, the above procedure was followed, but α-Fe2O3 sheets were not added. Experimental details, including materials, preparation of different combinations of heterostructures, characterisation, and electrochemical measurements, are provided in the ESI.†
:1 in volume) for 1.5 hours under sonication to obtain solution A. Then, 96 mL of methyl imidazole (25 mM) solution and 96 mL of cobalt nitrate hexahydrate (25 mM) solution were individually added to solution A. The obtained solution B features a 2D/2D heterostructure of CoMOF supported on α-Fe2O3 at room temperature. The product was centrifuged, followed by methanol/ethanol and water washes to remove the unreacted reagents, and vacuum dried. The synthesised catalysts were then drop-cast on Ni foam for electrocatalytic performance testing to prepare the working electrodes. To prepare the 2D CoMOF, the above procedure was followed, but α-Fe2O3 sheets were not added. Experimental details, including materials, preparation of different combinations of heterostructures, characterisation, and electrochemical measurements, are provided in the ESI.†
Results and discussion
Synthesis and creation of ionic bonds at the interface of the 2D heterostructure
To develop ionically linked interfaces, Fe2O3 sheets (Fig. S1a, ESI†) are prepared using the salt-template method, which acts as a solid template support for the growth of the 2D CoMOF (Fig. S1b, ESI†). This facile solid–liquid interface strategy ionically connects the MOF to the Fe2O3 sheets, forming a heterostructure (Fig. 1a, b and Fig. S2, ESI†). The transmission electron microscopy (TEM) image in Fig. 1b reveals that the CoMOF is successfully grown on Fe2O3, creating a 2D heterostructure. The red dotted line in Fig. 1b highlights the heterointerface, and the arrows show the dissimilar sheets of the CoMOF and Fe2O3.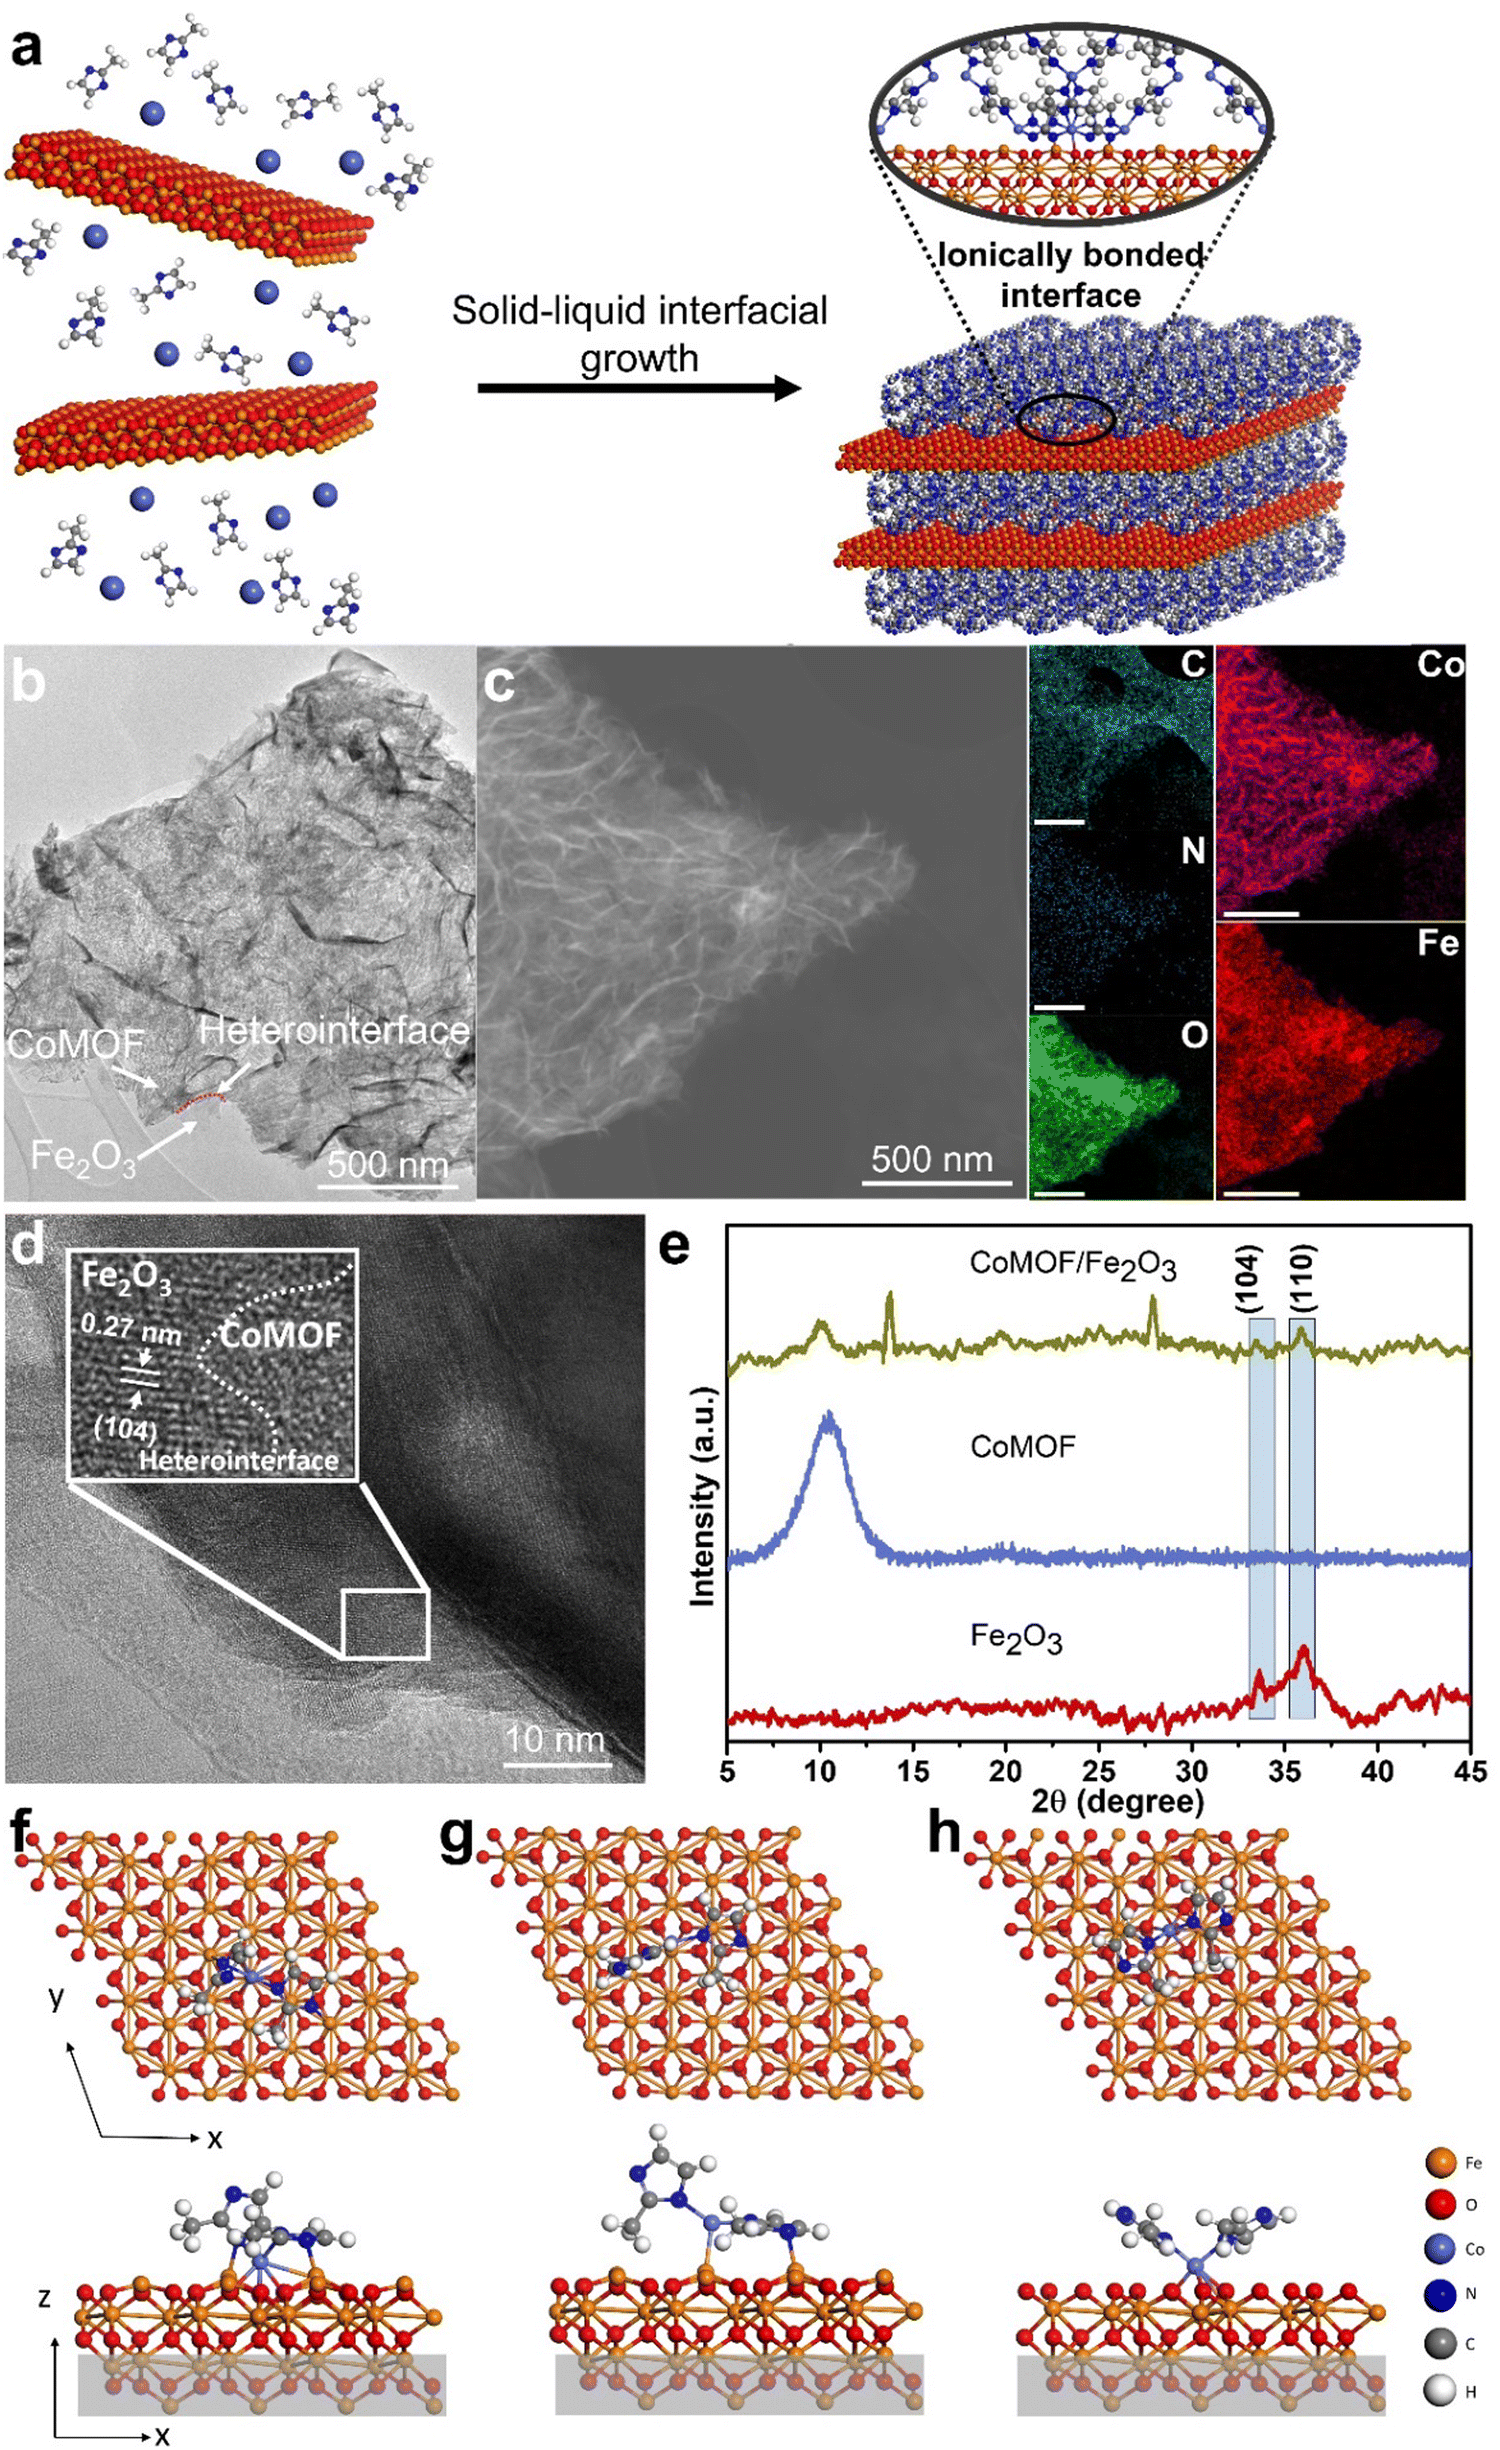 | ||
| Fig. 1 Formation of ionically anchored heterostructures. (a) Schematic representation of the synthesis of CoMOF/Fe2O3 by the solid–liquid interfacial growth technique at room temperature (b) TEM image of CoMOF/Fe2O3, (c) EDS elemental mapping using TEM of C, N, O, Co and Fe in CoMOF/Fe2O3, (d) HR-TEM image of CoMOF/Fe2O3, and (e) XRD patterns of Fe2O3, CoMOF and CoMOF/Fe2O3. Top and side views of the optimised CoMOF fragment on the (f) and (g) Fe-terminated and (h) O-terminated Fe2O3(001) surfaces. | ||
Energy-dispersive X-ray (EDS) images unveil the uniform distribution of C, Co, N, O and Fe throughout the heterostructure, confirming the successful coverage of the Fe2O3 solid template by the MOF (Fig. 1c and Fig. S3, S4, ESI†). The Fe and Co are homogeneously distributed in the heterostructure, indicating that the Fe2O3 and CoMOF sheets are grown on top of each other. The high-resolution TEM (HRTEM) image in Fig. 1d shows a lattice spacing of 0.27 nm, corresponding to the (104) plane of Fe2O3 in the heterostructure. The white dotted interface shows that one sheet belongs to Fe2O3, and the other to CoMOF, also confirming the creation of a heterointerface between the two dissimilar sheets.
The powder X-ray diffraction (XRD) pattern (Fig. 1e and Fig. S5, ESI†) indicates the formation of pure hematite (α-Fe2O3) (JCPDS 96-901-6458) and characteristics peaks of Fe2O3 are well-matched in the CoMOF/Fe2O3 heterostructure indicating the existence of Fe2O3 sheets that retain the same crystallographic features. The strong diffraction peak at 10.44° (002), characteristic of CoMOF sheets, is shifted to 9.95° in the heterostructure along with another two peaks of CoMOF at 13.89° (220) and 27.96° (521). The characteristics peaks at 33.4° and 35.84°, attributed to the (104) and (110) planes of Fe2O3 are present at the same place in the heterostructure. This confirms the presence of both CoMOF and Fe2O3 sheets after the formation of the heterostructure. Fourier transform infrared spectroscopy (FTIR) analysis was performed to identify the bonds formed between the MOF and Fe2O3 layers (Fig. S6, ESI†). The peaks in the range of 1000–1650 cm−1 in the case of the MOF are due to organic groups. The peak at 1350–1500 cm−1 is attributed to the stretching ring of 2-methylimidazole, also seen in the heterostructure. For CoMOF, the peak at 507.8 cm−1 shows the presence of a Co–N bond. For Fe2O3, the peaks at 717.7 and 538.3 cm−1 are ascribed to the Fe–O stretching. For the heterostructure, the presence of Fe–O, Co–O, and Co–N bonds is indicated through peaks between 715 to 430 cm−1 and shifting in the peak locations as compared to the pristine material shows the formation of new metal–oxygen and metal–nitrogen bonds.
To understand the nature of the bonding at the heterointerface, and specifically the initial stages of growth, density functional theory (DFT) calculations were performed. The relaxed structures of the CoMOF fragment on the Fe-terminated and O-terminated surfaces of the Fe2O3 substrate are shown in Fig. 1f–h. For the Fe-terminated CoMOF/Fe2O3 system, the fragment can adsorb in two different locations and orientations on the substrate, as shown in Fig. 1f and g. In Fig. 1f, the Co atom forms bonds with three surface O atoms, with the bond lengths calculated to be ∼2.10 Å (Table S1, ESI†), which is consistent with the Co–O bond length in bulk cobalt(II) oxide (2.13 Å), indicating the formation of ionic bonds.25 The N atoms in each methylimidazole group form bonds to a surface Fe atom. The methylimidazole ring that is oriented perpendicular to the surface has an N–Fe bond length of 2.05 Å, which is close to the N–Fe bond length in the nitrogen-doped Fe2O3 surface.26 The other methylimidazole ring lies parallel to the surface, resulting in a slightly longer N–Fe bond length of 2.23 Å.
For the Fe-terminated CoMOF/Fe2O3 system (Fig. 1g), the Co atom is bonded to one surface Fe atom, having a bond length calculated to be 2.35 Å. The only other direct bond to the surface is between one of the N atoms and a surface Fe atom, with an N–Fe bond length of 2.06 Å. The CoMOF fragment is more strongly bound in the first orientation due to the greater number of bonds formed with the surface, which correlates with the calculated binding energies (Table S2, ESI†). The presence of the Co–O bonds agrees with the experimental characterisation (Fig. 1h), where the main interactions observed between the CoMOF fragment and the substrate are between the Co atom and a surface O atom.
To experimentally confirm the bonding configuration of the MOF with the substrate as predicted by DFT, X-ray photoelectron spectroscopy (XPS) analysis was performed. The Co 2p deconvoluted spectra of Co-MOF and CoMOF/Fe2O3 are displayed in Fig. 2a. The peaks located at 781.6 eV and 797.4 eV for CoMOF and 783.3 eV and 796.8 eV for CoMOF/Fe2O3 are ascribed to the coordination of Co2+ to the N on the organic ligands, showing the successful formation of the CoMOF by coordination between the inorganic part and imidazole ligands. The comparison of the spectra (Fig. 2a) shows that the Co valence state changes in the case of CoMOF/Fe2O3 from Co2+ to Co3+, as new peaks appeared at 781.39 eV and 797.0 eV in the CoMOF/Fe2O3 due to the new Co–O bond formed between the MOF and the Fe2O3 sheet.27 When the MOF-based heterostructure forms, some Co–N peaks transform into Co–O peaks. This is clear by the positive shift of the Co–N peak, which is due to the loss of electrons and complex surroundings at the unique heterointerface. The electrons lost from the CoMOF structure result in the formation of new bonds as Co–O peaks, as indicated by the negative peak shift of the Co–O bond compared to the pristine material. Electron loss always happens when a highly electronegative element is introduced, which is oxygen. So, the presence of O creates an imbalance that forms a new M–O–M bond.
 | ||
| Fig. 2 Deconvoluted XPS spectra of (a) Co 2p, (b) N 1s, and (c) O 1s present in the Fe2O3, CoMOF and CoMOF/Fe2O3 (sat. = satellite peaks), and NEXAFS spectra of (d) Co L-edge, (e) N K-edge and (f) O K-edge. | ||
The deconvoluted N 1s (Fig. 2b) peaks at 399.4 eV (CoMOF/Fe2O3) and 399.3 eV (CoMOF) are attributed to the nitrogen in the organic ligand bonded to the metal centre.28 The reduced N 1s peak intensity in the heterostructures is due to the formation of the N–Fe bonds. The peaks in the O 1s XPS spectra (Fig. 2c) at 529.8 eV and 529.9 eV for CoMOF/Fe2O3 and Fe2O3, respectively, confirm the interaction of oxygen with the metal centre. Overall, the XPS data support the presence of Fe2O3 and CoMOF in the heterostructure, which maintains the characteristics of the individual 2D sheets. Formation of the heterointerface changes the oxidation state of the metal due to the formation of strong bonds with the CoMOF. The C1s deconvoluted spectrum of CoMOF/Fe2O3 (Fig. S7, ESI†) shows a negative peak shift due to the local environment. The doublet peaks of Fe 2p (Fig. S8, ESI†) at 710.9 eV and 724.5 eV for CoMOF/Fe2O3 and 710.8 eV and 724.4 eV for Fe2O3 indicate the presence of Fe–O/Fe–N and Fe–O, respectively. The surface site interaction with nitrogen at the heterointerface slightly shifts the binding energy. The satellite peak at 719.0 eV between Fe 2p3/2 and Fe 2p1/2 is assigned to Fe3+ in hematite Fe2O3.24
We further utilised synchrotron near edge X-ray absorption fine structure (NEXAFS) to extend the understanding of the local atomic and electronic structures of the metals and non-metals in the individual components and the CoMOF/Fe2O3 heterostructure (Fig. 2d–f and Fig. S9, S10, ESI†). The Co L-edge NEXAFS spectra (Fig. 2d) show the Co L3 and L2 spin–orbit split absorption edges with prominent peaks at 779.9 eV and 794.6 eV, respectively, for CoMOF/Fe2O3 and 779.9 eV and 794.8 eV, respectively, for CoMOF. These are due to the transition of the occupied 2p3/2 and 2p1/2 into vacant 3d orbital dipole transitions (Co2+) by coupling of the 2p core-electron spin-orbital, suggesting a change in the electronic state.29,30 The difference in split L3-edge characteristics of the 3d-electrons indicated the development of new bond formation (Co3+) of Co atoms by the disappearance of some peaks and shifting of the peak positions towards the high photon energy in the heterostructure, i.e., 777.1 eV and 779.0 eV, as compared to the pristine CoMOF, i.e., 776.8 eV and 778.8 eV, respectively.29 These changes are attributed to ligating new Co–O bonds in the heterostructure due to bridging between Fe2O3 and CoMOF.31 Moreover, in the case of the heterostructure, the intensity of the peaks changes due to new interactions of the Co metal with the O of Fe2O3 along with Co–N. These new ionic connections between dissimilar sheets ensure enhanced stability of the developed heterostructure.
The N K-edge NEXAFS spectra (Fig. 2e) depict that the 388.5 eV, 389.3 eV, 390.0 eV, 391.1 eV, 396.8 eV, and 397.4 eV peaks in both the heterostructure and CoMOF are almost at similar positions to each other, except for the reduction of the intensity due to bonding at the heterointerface. The 389.3 eV and 397.4 eV peaks result from residual second-order light from the beamline exciting the Co L3 and L2 edge, respectively.32 The other peaks below the photon energy of 400 eV can be ascribed to the π* resonance peak attributed to the presence of pyridinic nitrogen in the linker.33 The peaks after 400 eV are σ* peaks due to the pyrrolic N in the ligand structure and the interaction of N with metal atoms to form coordination between the organic and inorganic parts to develop the MOF structure.29,34 The peaks in the heterostructure were located at 401.5 eV and 405.2 eV, respectively. In contrast, the peaks of CoMOF were located at 401.4 eV and 405.0 eV, respectively. The positive shift in the peak positions is attributed to another interaction (Fe–N–Co) created between dissimilar sheets.
Furthermore, the O K-edge (Fig. S9, ESI†) shows two peaks at 530.6 eV and 531.8 eV, which, after the MOF growth, lead to broadening and a change in intensity, which might be due to the competition between the Co and Fe for the oxygen and the formation of new ionic connections of Co with the oxygen (Fe–O–Co).35 This supports the DFT findings of many Fe–O–Co ionic connections in the heterostructure. At the same time, the O K-edge in the case of the MOF shows a high-intensity peak compared to Fe2O3 due to loosely adsorbed adventitious oxygen from ambient exposure on the surface of the MOF. At the Fe L-edge spectra (Fig. 2f), there are mainly two regions, i.e., L3- and L2-edge, with prominent peaks at 709.6 eV and 722.9 eV owing to the electronic transition of the Fe 2p3/2 and Fe 2p1/2 core electrons corresponding to the interaction of ∼13.3 eV spin–orbit splitting. The overall resemblance in the L3- and L2-edge in Fe2O3 and the CoMOF/Fe2O3 heterostructure is due to the similarity in the 3d ground-state configuration, p–d Coulomb magnitude and interaction of the crystal-field.36 The lowering of the spectral intensity and splitting of the peak at 721.3 eV in Fe2O3 into two peaks, 721.2 eV and 721.4 eV in the CoMOF/Fe2O3 heterostructure, indicates the formation of new Fe–N–Co interactions along with the main Fe–O–Co interactions as well.
Selective OER performance of the heterostructure
The catalytic performance of the CoMOF/Fe2O3 heterostructure was tested in both deionised (DI) water and seawater (Altona Beach, Melbourne) to explore whether the presence of ionic bonds between the heterostructure layers assisted in the selective OER. The electrolytic OER performance of CoMOF, Fe2O3, CoMOF/Fe2O3, IrO2 and Ni-Foam was measured using linear scanning voltammetry (LSV). The CoMOF/Fe2O3 heterostructure displayed excellent performance compared to the pristine materials and IrO2 (see Fig. 3 and Fig. S11–S17, ESI†), which indicates that the synergistic coupling between the layers facilitates charge delivery and fast charge and mass transport. Interestingly, the heterostructure catalysts demonstrate exceptional oxygen evolution reaction activity by achieving a current density of 0.5, 0.8, 1 and 1.2 A cm−2 at an overpotential of 310, 370, 410 and 450 mV, respectively, in direct seawater electrolytes (Fig. 3a and b). The heterostructure can achieve ampere-level current densities at lower potentials in DI water and seawater electrolytes (Fig. 3a, b and Fig. S18, S19, ESI†). Fig. 3c compares the CoMOF, Fe2O3, CoMOF/Fe2O3, IrO2 catalyst and Ni-Foam overpotentials at 500, 800 and 1000 mA cm−2 current densities and the bar chart clearly shows that the heterostructure offers the best OER activity among these catalysts with low overpotentials. | ||
| Fig. 3 Electrocatalytic OER activity of Fe2O3, CoMOF, CoMOF/Fe2O3, IrO2 and Ni-Foam: (a) OER polarisation curves recorded by the back-sweep scan method in alkaline seawater electrolyte, (b) plot of the current densities vs. overpotentials of CoMOF/Fe2O3, (c) comparison of the overpotential of Fe2O3, CoMOF, CoMOF/Fe2O3, IrO2 and Ni-Foam, (d) corresponding Tafel plots, (e) plots showing the double-layer capacitance (Cdl) in alkaline seawater electrolyte of Fe2O3, CoMOF and CoMOF/Fe2O3, (f) linear sweep voltammetry curves before and after the stability test, (g) current–time (I–t) curve of the heterostructure in seawater electrolyte at 1.366 V (E vs. RHE) (*Power off and system started again on same setup), and top and side views of the optimised (h) CoMOF/Fe2O3(001)–Cl and (i) CoMOF/Fe2O3(001)–OH. (The cyan circle identifies Cl and OH adsorbates). | ||
The Tafel slope of the heterostructure (61.57 mV dec−1) is smaller than that of Fe2O3 (73.7 mV dec−1), CoMOF (101.51 mV dec−1), IrO2 (118.41 mV dec−1) and Ni-Foam (123.58 mV dec−1) as shown in Fig. 3d and Fig. S20 (ESI†), indicating its fast reaction kinetics. To understand the increase in the catalytic activity of the heterostructure, the electrochemical double-layer capacitance (Cdl) of the catalyst was obtained (Fig. 3e and Fig. S21, ESI†). The 2D MOF has a Cdl of 701 mF cm−2, which is higher than that of the 2D Fe2O3 (558 mF cm−2). On hybridisation of the CoMOF with the Fe2O3 sheets, the Cdl increased to 1221 mF cm−2. This may be because the Fe2O3 sheets provide flexible supports for the CoMOF layers to prevent them from agglomerating. In turn, this maximises the exposed active surface, resulting in fast access of the liquid electrolyte to the active sites and achieving higher current densities as compared to the individual catalyst materials. Moreover, we have performed electrochemical impedance spectroscopy (EIS) to investigate the charge transfer resistance of the samples through Nyquist plots (Fig. S22, ESI†). We also analysed the data by fitting the circuit models to calculate the resistance, as shown in Fig. S23–S26 (ESI†). The Nyquist plot of CoMOF/Fe2O3 shows a smaller semicircle diameter than CoMOF and IrO2. This indicates improved conductivity and less charge transfer resistance at the electrolyte–electrocatalyst interface than CoMOF after developing ionic bonds in the heterostructure. The analysis shows that the resistances of the electrolyte–electrocatalyst interface are 0.455, 3.82, 0.654 and 2.467 Ω for Fe2O3, CoMOF, CoMOF/Fe2O3 and IrO2, respectively.
Long-term stability is vital for an efficient catalyst, especially in a complex seawater environment, where it is challenging to avoid corrosion while maintaining performance for practical applications. The developed heterostructure shows durable performance even after 900 plus hours (Fig. 3f and g). The catalytic performance also remains stable, as displayed by the LSV testing before and after continuous operation for 900 hours (Fig. 3f). The ionically connected heterostructure depicts exceptional stability compared to the individual counterparts, even at current densities greater than 300 mA cm−2 over 180 hours (Fig. S27, ESI†). The faradaic efficiency was also calculated and it was found that CoMOF/Fe2O3 had an efficiency of 98.86% (ESI,† Note 1). The low energy requirement of the heterostructure and its durable performance at higher current densities make it suitable for commercial-scale seawater splitting. Interestingly, the isolated Fe2O3 sheets decay quicker than the MOF during seawater oxidation (Fig. S27, ESI†). This indicates that the ionic bonds formed in the heterostructure, together with the surface chemistry provided by the MOF, synergistically offer stability to the heterostructure.
To comprehensively determine how the ionically bonded MOF in the heterostructure can prevent the CER from competing with the OER, we performed DFT calculations by adsorbing Cl− and OH− on the heterostructure in different locations. To balance the charge, a Na+ ion was added to the supercell, whose position was fixed far enough from the surface to avoid interacting with it or with the anion. Fig. 3h and i show the relaxed structures of the CoMOF/Fe2O3 with adsorbed Cl− or OH−. For the CoMOF/Fe2O3–OH system (Fig. 3i), the OH− bonds, via the O atom, to a C atom on the methylimidazole group that is oriented perpendicular to the surface. The O–C bond length is 1.40 Å. For the CoMOF/Fe2O3–Cl system (Fig. 3h), the Cl− did not adsorb on the MOF fragment, but instead preferred to adsorb directly on the surface to an Fe atom, forming a Fe–Cl bond that is 2.20 Å. The Cl atom is 3.31 Å away from the CoMOF fragment. This indicates that the Cl− will unlikely bind to the ionically connected CoMOF, reducing the likelihood of the CER occurring in the heterostructure.
This suggests that the growth of the ionically connected CoMOF over the Fe2O3 provides Cl− corrosion resistance to the system. The calculated binding energies of both investigated systems (Table S3, ESI†) show that while Cl− is more strongly bound, it is bonded to the surface, not the CoMOF. As the experiments indicate, the CoMOF covers the surface, so that Cl− is unlikely to adsorb on the heterostructure. Therefore, CER cannot possibly occur, but, OH− is expected to adsorb and contribute to enhanced OER performance.
The durability of the catalyst at higher current densities and anti-corrosive behaviour were studied to confirm the OER selectivity and anti-corrosive nature of the heterostructure. According to the Pourbaix diagram, the alkaline seawater environment at lower potential thermodynamically supports the OER reaction compared to chlorine-related reactions at the anode. However, a higher potential (>1.72 V) kinetically favours hypochlorite formation.10 The chlorine-related reactions lead to the corrosion of the electrode and a decrease in the performance of the catalyst. The CoMOF/Fe2O3 was tested at ∼2 V to study the selectivity of the catalyst. The testing demonstrates the stable performance of the catalyst even at an ampere-level current density of about 1.5 A cm−2 for more than 360 hours (Fig. 4a and Fig. S28, ESI†). The catalytic performance of Fe2O3 and CoMOF was reduced by more than 49.9% and 22.9%, respectively, in less than 75 hours at higher current densities. The excellent stable performance of CoMOF/Fe2O3 compared to the individual counterparts and reported electrocatalysts (Table S4, ESI†) is attributed to the selective OER activity of the heterostructure, which avoids hypochlorite formation to produce continuous oxygen.
 | ||
| Fig. 4 (a) Current–time (I–t) curves of the heterostructure in seawater electrolyte at 1.966 V (E vs. RHE), CoMOF in seawater electrolyte at 1.82 V (E vs. RHE) and Fe2O3 in seawater electrolyte at 1.82 V (E vs. RHE), (b) optical images of the acetone solutions before and after gas was passed through to observe the OER selectivity, (c) optical image of the DPD test in seawater and electrochemically tested electrolyte, (d) open circuit potential (OCP) curves, (e) potentiodynamic polarisation curves, (f) TEM image, (g) HR-TEM image and EDS elemental mapping using TEM of Fe, Co, O, and N of CoMOF/Fe2O3 (scale bar line = 250 nm), NEXAFS Spectra of (h) Co L-edge, and (i) O K-edge, of CoMOF/Fe2O3, and deconvoluted XPS spectra of (j) Co 2p of CoMOF/Fe2O3 after electrochemical testing (sat. = satellite peaks). | ||
To further confirm the prevention of chlorine-related reactions, continuous gas is generated at the anode electrode and passed through an acetone solution at room temperature. If chlorine is present, the acetone turns instantly into chloroacetone and HCl, which can be detected by gas chromatography mass spectrometry (GC-MS). Fig. 4b shows that the colour of the acetone + gas solutions changed for the CoMOF (dark yellow) and Fe2O3 (light yellow) due to the presence of chloroacetone in the solution, indicating CER at the anode, but it remained unchanged for the CoMOF/Fe2O3 due to CER inhibition. Fig. S29 (ESI†) shows that there are only acetone peaks and no chloroacetone peaks in the acetone + gas mixture for the heterostructure, confirming the selectivity of the anode towards the OER and inhibition of the CER. Moreover, we performed a diethyl-p-phenylene diamine (DPD) test for natural seawater and electrochemically tested electrolyte. This test indicates the different forms of chlorine (chlorine/hypochlorite/chloride) via a change in the solution colour. Fig. 4c presents that there is no significant change in the colour of the natural seawater and tested electrolyte after the DPD test. This suggests that no new chlorine-related reactions took place in the system.
Additionally, we carried out chlorine corrosion studies to observe the anti-corrosive behaviour of the catalyst in 5% NaCl in DI water (w/w). Fig. 4d shows the change of the open circuit potential (OCP) over time for the catalysts to understand the development of the interfacial layer between the electrode and electrolyte. The OCP value of the CoMOF/Fe2O3 is ∼250 mV, which is much higher as compared to the values of CoMOF, Fe2O3 and IrO2. The stable and higher value of OCP indicates that the heterostructure requires less time to form the anti-corrosive protective layer between the electrolyte and electrode. Fig. 4e provides polarisation curves of all samples after 1700 s stabilisation, where CoMOF, Fe2O3 and IrO2 show more negative corrosion potential (Ecorr) than CoMOF/Fe2O3. This suggests that CoMOF, Fe2O3 and IrO2 are more prone to corrosion than the heterostructure. Moreover, the corrosion rates of the catalysts were calculated from the polarisation curves, as shown in Table S5 (ESI†). This demonstrates that the CoMOF/Fe2O3 has a lower corrosion rate of 0.631 mm year−1 as compared to CoMOF (1.023 mm year−1), Fe2O3 (0.656 mm year−1) and IrO2 (0.662 mm year−1). These results show that the selective OER reaction and better anti-corrosive properties of the heterostructure, even at higher current densities, make it a better catalyst than others by avoiding the CER and preventing the degradation of the catalyst.
To examine the effect of electrochemical testing on the morphology and structure of the catalyst, TEM, EDS, NEAXFS and XPS were performed. The TEM image (Fig. 4f) indicates that the 2D morphological structure is well maintained even after electrochemical testing. The MOF sheets still cover the 2D Fe2O3via strong ionic bonds while keeping their morphological features. The HR-TEM in Fig. 4g shows a lattice spacing of 0.25 nm, corresponding to the (110) plane of Fe2O3, which is interfaced with the CoMOF (highlighted by the white dotted lines between the Fe2O3 and CoMOF sheets). EDS analysis (Fig. 4g inset and Fig. S30, ESI†) of the heterostructure also confirms the presence of Fe2O3 and CoMOF-related elements. The elemental maps show a uniform distribution of Fe, Co, O, and N in the sample, indicating that the heterostructure features are retained, and the sheets are well intact even after electrochemical testing. The ex situ NEXAFS data indicate that the Co L-edge NEXAFS spectrum (Fig. 4h) of Co (L3 and L2 split edges) displays the same prominent peaks at 780.1 eV and 794.6 eV, respectively. The split L3-edges indicate the presence of a Co3+ state due to the Co–O–Fe bonds in the heterostructure, supporting the structural stability. The O-K edge spectra (Fig. 4i) show a similar peak at 542.3 eV, but changes in the peak below 535 eV occur due to the surface oxidation and adsorption of environmental oxygen. The XPS spectra of Co, O and Fe in Fig. 4j and Fig. S31–S33 (ESI†) also support the chemical stability of the heterostructure even after electrochemical testing, with the presence of both Co3+ and Co2+ oxidation states coming from metal–ligand and ionic connections within the heterostructure. Overall, the ex situ characterisation supports the evidence that electrochemical performance is maintained in the complex seawater system. The heterostructure is a stable catalyst that can operate at ampere-level current densities without the CER.
In summary, the durable performance of the heterostructure indicates the occurrence of the OER while suppressing the chlorine-related reactions. This is mainly due to the preferential adsorption of hydroxyl ions and the resistance of the heterointerface for chloride ions.37,38 The unique electronic structure favours OH− adsorption as the energy barrier for the chlorine-related reactions shifts the reaction pathway toward the OER. Moreover, experimental studies verify the absence of chlorine-related by-products to strengthen the DFT findings that Cl− is unlikely to adsorb on the heterostructure. So, the electronic modulation and interfacial features block the Cl− infiltration and favour the adsorption of hydroxyl ions to maintain the stability of the catalyst without corrosion of the catalyst.
Conclusion
In summary, the successful formation of an ionically bonded CoMOF/Fe2O3 heterostructure is demonstrated via liquid–solid interfacial growth at room temperature. Theoretical and experimental studies reveal that the growth of the 2D MOF over 2D Fe2O3 creates unusual ionic bonds at the heterointerface, leading to better electron transfer, new active sites and a stably bonded structure. Moreover, these unusual ionic bonds protect against Cl− attack and encourage preferential OH− adsorption, resulting in better catalytic activity and stability in seawater electrolysis than pristine CoMOF or Fe2O3. Therefore, the heterostructure demonstrates outstanding OER performance by achieving a current density of 1 A cm−2 at an overpotential of 410 mV in seawater electrolyte. The heterostructure displays stable performance at ampere-level current densities due to the selective OER and anti-corrosive properties supported by the theoretical and experimental results. This work highlights a scalable strategy for constructing ionically bonded heterostructures to develop a durable OER catalyst, which can be applied to develop different materials at a large-scale for various applications, such as catalysis, environment, sensing and energy applications.Author contributions
M. W. K: conceptualisation, writing – original draft, investigation, methodology, experimentation, formal analysis and characterisation. S. L: investigation, characterisation, methodology, experimentation and writing – review and editing; M. H, K. X, M. M, S. G, V. N: characterisation and formal analysis. K. T, P. D. T: DFT calculations and investigation. L. T, A. T: NEXAFS and Formal analysis. R. B: validation and writing – review and editing. J. Z. O: writing – review and editing, validation, conceptualisation and supervision. M. J. S. S: DFT calculations, formal analysis and writing – review and editing. N. M: conceptualisation, validation, writing – review and editing, and project supervision.Data availability
The data needed to evaluate the conclusions in the paper are present in the paper and/or the ESI.†Conflicts of interest
There are no conflicts to declare.Acknowledgements
The authors would like to acknowledge access to the RMIT Micro Nano Research Facility (MNRF) in the Victorian node of the Australian National Fabrication Facility (ANFF), the RMIT Microscopy and Microanalysis Facility (RMMF), and the financial support from the Vice-Chancellor fellowship scheme at RMIT University. Part of this research was undertaken on the soft X-ray beamline at the Australian Synchrotron, a part of ANSTO. This research was supported by the Australian Government's National Collaborative Research Infrastructure Strategy (NCRIS), with access to computational resources provided by the National Computational Infrastructure (NCI) Facility and the Pawsey Supercomputing Research Centre, through the National Computational Merit Allocation Scheme (M.J.S.S. grant y41). The authors would like to acknowledge RMIT University for their RMIT Research Stipend Scholarship award for students.References
- L. Hou, X. Gu, X. Cui, J. Tang, Z. Li, X. Liu and J. Cho, EES Catal., 2023, 1, 619 RSC
.
- R. Tang, P. Yan, Y. Zhou and X.-Y. Yu, EES Catal., 2024, 2, 932 RSC
- T. Sun, Z. Tang, W. Zang, Z. Li, J. Li, Z. Li, L. Cao, J. S. Dominic Rodriguez, C. O. M. Mariano, H. Xu, P. Lyu, X. Hai, H. Lin, X. Sheng, J. Shi, Y. Zheng, Y. R. Lu, Q. He, J. Chen, K. S. Novoselov, C. H. Chuang, S. Xi, X. Luo and J. Lu, Nat. Nanotechnol., 2023, 18, 763 Search PubMed
- W. Tong, M. Förster, F. Dionigi, S. Dresp, R. Sadeghi Erami, P. Strasser, A. J. Cowan and P. Farràs, Nat. Energy, 2020, 5, 367 CrossRef
- M. Chatenet, B. G. Pollet, D. R. Dekel, F. Dionigi, J. Deseure, P. Millet, R. D. Braatz, M. Z. Bazant, M. Eikerling, I. Staffell, P. Balcombe, Y. Shao-Horn and H. Schafer, Chem. Soc. Rev., 2022, 51, 4583 RSC
- B. Lee, L. Wang, Z. Wang, N. J. Cooper and M. Elimelech, Energy Environ. Sci., 2023, 16, 714 Search PubMed
- J. Guo, Y. Zheng, Z. Hu, C. Zheng, J. Mao, K. Du, M. Jaroniec, S.-Z. Qiao and T. Ling, Nat. Energy, 2023, 8, 264 CAS
- F. Zhang, Y. Liu, F. Yu, H. Pang, X. Zhou, D. Li, W. Ma, Q. Zhou, Y. Mo and H. Zhou, ACS Nano, 2023, 17, 1681 Search PubMed
- L. Wu, L. Yu, F. Zhang, B. McElhenny, D. Luo, A. Karim, S. Chen and Z. Ren, Adv. Funct. Mater., 2020, 31, 2006484 Search PubMed
- X. Liu, J. Chi, H. Mao and L. Wang, Adv. Energy Mater., 2023, 13, 2301438 CrossRef
- J. Liu, S. Duan, H. Shi, T. Wang, X. Yang, Y. Huang, G. Wu and Q. Li, Angew. Chem., Int. Ed., 2022, 61, e202210753 CrossRef PubMed
- L. Zhang, Z. Wang and J. Qiu, Adv. Mater., 2022, 34, e2109321 CrossRef PubMed
- J. Zhu, J. Chi, T. Cui, L. Guo, S. Wu, B. Li, J. Lai and L. Wang, Appl. Catal., B, 2023, 328, 122487 CrossRef
- H. Wang, N. Jiang, B. Huang, Q. Yu and L. Guan, EES Catal., 2024, 2, 1092 Search PubMed
- Z. Song, K. C. Wang, Q. Sun, L. Zhang, J. Li, D. Li, P. W. Sze, Y. Liang, X. Sun, X. Z. Fu and J. L. Luo, Adv. Sci., 2021, 8, 2100498 CrossRef PubMed
- C. Huang, Q. Zhou, D. Duan, L. Yu, W. Zhang, Z. Wang, J. Liu, B. Peng, P. An, J. Zhang, L. Li, J. Yu and Y. Yu, Energy Environ. Sci., 2022, 15, 4647 RSC
- M. Ning, F. Zhang, L. Wu, X. Xing, D. Wang, S. Song, Q. Zhou, L. Yu, J. Bao, S. Chen and Z. Ren, Energy Environ. Sci., 2022, 15, 3945 RSC
- S. Loomba, M. W. Khan, M. Haris, S. M. Mousavi, A. Zavabeti, K. Xu, A. Tadich, L. Thomsen, C. F. McConville, Y. Li, S. Walia and N. Mahmood, Small, 2023, 19, e2207310 Search PubMed
- A. A. H. Tajuddin, M. Wakisaka, T. Ohto, Y. Yu, H. Fukushima, H. Tanimoto, X. Li, Y. Misu, S. Jeong, J. I. Fujita, H. Tada, T. Fujita, M. Takeguchi, K. Takano, K. Matsuoka, Y. Sato and Y. Ito, Adv. Mater., 2023, 35, e2207466 Search PubMed
- J. G. Vos, T. A. Wezendonk, A. W. Jeremiasse and M. T. M. Koper, J. Am. Chem. Soc., 2018, 140, 10270 Search PubMed
- T. Li, X. Zhao, M. Getaye Sendeku, X. Zhang, L. Xu, Z. Wang, S. Wang, X. Duan, H. Liu, W. Liu, D. Zhou, H. Xu, Y. Kuang and X. Sun, Chem. Eng. J., 2023, 460, 141413 Search PubMed
- Z. Fang, L. Peng, Y. Qian, X. Zhang, Y. Xie, J. J. Cha and G. Yu, J. Am. Chem. Soc., 2018, 140, 5241 Search PubMed
- B. Xu, J. Liang, X. Sun and X. Xiong, Green Chem., 2023, 25, 3767 Search PubMed
- M. Mohiuddin, A. Zavabeti, F. Haque, A. Mahmood, R. S. Datta, N. Syed, M. W. Khan, A. Jannat, K. Messalea, B. Y. Zhang, G. Chen, H. Zhang, J. Z. Ou and N. Mahmood, J. Mater. Chem. A, 2020, 8, 2789 RSC
- J. Chen, X. Wu and A. Selloni, Phys. Rev. B:Condens. Matter Mater. Phys., 2011, 83, 245204 CrossRef
- M. Sun, Z. Wang, J. Ni and L. Li, Adv. Funct. Mater., 2020, 30, 1910043 Search PubMed
- L. Ma, X. Zhang, M. Ikram, M. Ullah, H. Wu and K. Shi, Chem. Eng. J., 2020, 395, 125216 Search PubMed
- V. K. Abdelkader-Fernández, D. M. Fernandes, S. S. Balula, L. Cunha-Silva and C. Freire, J. Mater. Chem. A, 2020, 8, 13509 Search PubMed
- P. Kumar, K. Kannimuthu, A. S. Zeraati, S. Roy, X. Wang, X. Wang, S. Samanta, K. A. Miller, M. Molina, D. Trivedi, J. Abed, M. A. Campos Mata, H. Al-Mahayni, J. Baltrusaitis, G. Shimizu, Y. A. Wu, A. Seifitokaldani, E. H. Sargent, P. M. Ajayan, J. Hu and M. G. Kibria, J. Am. Chem. Soc., 2023, 145, 8052 CrossRef PubMed
- Y. Wu, Z. Chen, W. C. Cheong, C. Zhang, L. Zheng, W. Yan, R. Yu, C. Chen and Y. Li, Chem. Sci., 2019, 10, 5345 RSC
- W. H. Choi, B. C. Moon, D. G. Park, J. W. Choi, K. H. Kim, J. S. Shin, M. G. Kim, K. M. Choi and J. K. Kang, Adv. Sci., 2020, 7, 2000283 CrossRef
- B. You, N. Jiang, M. Sheng, W. S. Drisdell, J. Yano and Y. Sun, ACS Catal., 2015, 5, 7068 CrossRef
- M. A. Raza, A. Wahab, A. H. U. Bhatti, A. Ahmad, R. Ahmad, N. Iqbal and G. Ali, Electrochim. Acta, 2022, 407, 139914 CrossRef
- Z. Li, Y. Chen, X. Lu, H. Li, L. Leng, T. Zhang and J. H. Horton, Nano Res., 2022, 15, 4023 Search PubMed
- D. K. Bora, X. Cheng, M. Kapilashrami, P. A. Glans, Y. Luo and J. H. Guo, J. Synchrotron Radiat., 2015, 22, 1450 CrossRef
- T. J. Park, S. Sambasivan, D. A. Fischer, W. S. Yoon, J. A. Misewich and S. S. Wong, J. Phys. Chem. C, 2008, 112, 10359 CrossRef
- Y. Liu, Y. Wang, P. Fornasiero, G. Tian, P. Strasser and X. Y. Yang, Angew. Chem., Int. Ed., 2024, 63, e202412087 Search PubMed
- S. Zhang, W. Xu, H. Chen, Q. Yang, H. Liu, S. Bao, Z. Tian, E. Slavcheva and Z. Lu, Adv. Mater., 2024, 36, e2311322 CrossRef
Footnotes |
| † Electronic supplementary information (ESI) available. See DOI: https://doi.org/10.1039/d4ey00151f |
| ‡ Contributed equally to this work. |
| This journal is © The Royal Society of Chemistry 2025 |