 Open Access Article
Electrochemical ozone production: from fundamental mechanisms to advanced applications
Jia
Liu†
,
Xiaoge
Peng†
,
Xiaosa
Wang
,
Xing
Zhong
 * and
Jianguo
Wang
 *
*
Institute of Industrial Catalysis, State Key Laboratory Breeding Base of Green-Chemical Synthesis Technology, College of Chemical Engineering, Zhejiang University of Technology, Hangzhou 310032, P. R. China. E-mail: zhongx@zjut.edu.cn; jgw@zjut.edu.cn
First published on 22nd November 2024
Abstract
Electrochemical ozone production (EOP) as an advanced ozone generation technology with good safety, simple equipment and high ozone concentration has sparked considerable interest among researchers. However, the unfavorable thermodynamics and sluggish kinetics have restricted EOP from widespread application. Developing low-cost and robust catalysts is crucial to solving the efficiency problem during the EOP process. Besides the catalyst aspect, the development of an advanced electrolyzer can further promote the large-scale utilization of the EOP process. However, there have been few systematic reviews that comprehensively elucidated the progress made in advancing the EOP process to date. In this review, we firstly summarize the recent progress in understanding the EOP mechanism. The latest advances and effective strategies for designing efficient catalysts are then introduced. Moreover, the standards to evaluate the activity and stability for different EOP catalysts are provided. The influence of EOP electrolyzer design and operating conditions on the overall operation, as well as the progress and prospects in large-scale EOP applications are also demonstrated. This review aims to comprehensively explore the EOP process, providing both theoretical and experimental insights, and this will help to facilitate the advancement of efficient EOP large-scale application.
Broader contextOzone is an environmentally friendly oxidizing agent with broad applications in water treatment, food processing, and healthcare, playing a crucial role in enhancing public health and safety. However, due to its rapid decomposition and unsuitability for long-term storage, ozone must be generated on-demand. Traditional ozone generation methods, primarily based on corona discharge technology, are associated with safety risks, operational complexity, and low ozone output. In light of the global COVID-19 pandemic, electrochemical ozone production (EOP) has gained significant attention as an advanced and safer alternative, offering simpler equipment and higher ozone concentrations. Although there have been published review works on the topic of EOP previously, a systematic review bridging the in-depth understanding of the EOP mechanism with its applications is still lacking. This review aims to fill this gap by exploring recent advancements in understanding the EOP mechanism, with particular attention to the ‘five-membered cycle’ mechanism proposed by our group. Furthermore, recent developments in EOP catalyst design and effective methodologies for evaluating and comparing the performance of electrocatalysts have been summarized. In addition, this review discusses the influence of electrolyzer design as well as the operating conditions on EOP efficiency. Finally, the remaining challenges and future prospects for large-scale applications have been highlighted. The aim of this review is to provide a comprehensive understanding of EOP from both theoretical and experimental perspectives, with the goal of facilitating the broader practical application of EOP technology. |
1. Introduction
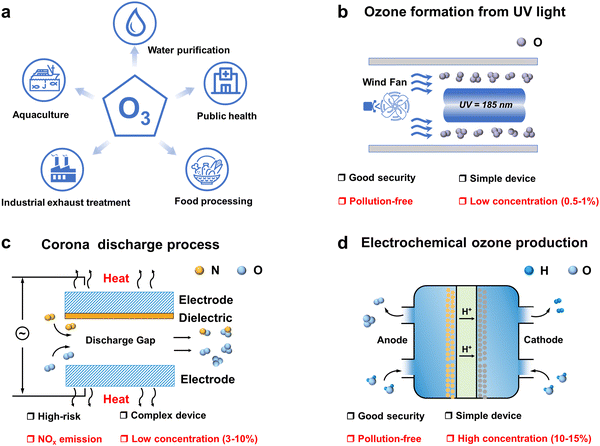
In the ongoing global energy transition driven by climate change, electrification has emerged as a key trend shaping the future of sustainable energy systems. This trend is steadily accelerating in response to geopolitical developments, favourable economic conditions and the need to meet the “twin carbon targets”.1 In addition to climate targets, the COVID-19 pandemic sweeping the globe has opened up new opportunities for electrification.2–4 One of the immediate impacts is the increased emphasis on disinfection and sanitization chemicals. The surge in demand for these products has fueled the development of advanced disinfection technologies. Among the many disinfection and sanitizing chemicals, ozone has demonstrated exceptional efficacy, safety, and cost-effectiveness as a disinfection and sanitization agent.5–7 Its applications span a broad spectrum, including water purification, industrial exhaust treatment, public health management, food processing, aquaculture disinfection, and the production of value-added compounds as shown in Fig. 1a.8–10 However, ozone is an unstable gas with a short half-life at room temperature and pressure, cannot be stored, and decomposes easily and naturally into oxygen, so it must be produced on-site as needed.11–13 Ozone generators are the most important components of ozone application systems. The ozone generator market size is expected to reach USD 2.04 billion by 2029, growing at a forecast CAGR of 8.55% during 2023–2029. Consequently, the utilization of O3 is poised to witness a pervasive expansion, paralleled by a surge in demand, driven by persistent apprehensions regarding energy sustainability, environmental conservation, and public health and safety considerations.Depending on the principle of operation, ozone generators mainly include UV irradiation (Fig. 1b), corona discharge (Fig. 1c) and electrolytic ozone generators (Fig. 1d).14–17 UV ozone generators are simple and easy to operate, but UV produces ozone at concentrations usually below 1 per cent by volume, and their application is still limited due to the fact that the low concentration of ozone gas has a low solubility in water, which is insufficient for most water treatment applications.18 Most industrial ozone generators produce ozone using corona discharge, a process that can produce ozone concentrations of up to 20 percent by volume and high ozone yields. However, this technology requires operation under high voltage, which is hazardous and requires a very clean, dry air/oxygen feed gas to operate reliably, with a high initial investment cost, and generates excess heat during operation that must be removed for the system to operate efficiently. This makes the plant complex and the use of air as a feedstock resulting in the formation of by-products such as nitrogen oxides.19,20 The use of electrolytic ozone generators can produce ozone directly in water, without the need for ultraviolet irradiation and the corona discharge ozone preparation process of ozone gas dissolved into the water required to contact the equipment, so the overall device design is compact, with technical and cost advantages. Compared with the corona discharge method, low voltage electrolysis is a simple process, the reaction voltage required is lower, and the electrolysis process does not produce secondary pollution, so this technology has been widely studied.21,22 The ozone generation reactions and standard electrode potentials for the direct electrolysis of water are as follows:
Anode:
| 2H2O → O2 + 4H+ + 4e− E0 = 1.229 V vs. SHE | (1) |
| 3H2O → O3 + 6H+ + 6e− E0 = 1.511 V vs. SHE | (2) |
| O2 + H2O → O3 + 2H+ + 2e− E0 = 2.075 V vs. SHE | (3) |
Cathode:
| 2H+ + 2e− → H2 E0 = 0 V vs. SHE | (4) |
At voltages above 1.511 V vs. SHE, ozone gas is formed via the six-electron reaction shown in eqn (2), accompanied by oxygen evolution.13,23 When the voltage is increased above 2.075 V vs. SHE, the O2 gas is also oxidized to O3 as shown in eqn (3). Given that the oxygen evolution reaction (OER) occurs at a lower potential than ozone evolution, the productivity and energy consumption associated with the OER are significantly higher compared to those of ozone generation. As a result, the improvement of ozone selectivity is the focus of EOP research, and the development of high activity anode catalysts has become a key factor in solving this problem.
A thorough understanding of the reaction mechanism of catalysts is the key to designing active and stable EOP catalysts for long-term use. Therefore, in this review, we first focus on the reaction mechanism of EOP catalysts and summarize the structural design advantages of catalyst materials with excellent EOP activity and stability, which we believe will draw more attention to this research direction and also provide more insights into the future design of EOP technologies. In addition, the key to successfully identifying optimal EOP catalysts lies in establishing an effective metric to quantitatively assess the activity and stability of a given catalyst. Therefore, this review focuses on identifying key performance evaluation parameters for rational standardized testing of EOP catalysts to guide the screening of high performing EOP catalysts. Furthermore, this review systematically summarizes recent developments in EOP catalysts with good activity and how different factors or components in the electrolyzers affect performance in practical EOP applications. Moreover, the latest developments in EOP applications are also discussed in detail in this review. We believe that this review will provide different perspectives and sound guidance for the development of EOP catalysts for practical applications and the improvement of EOP electrolyzers in the future.
2. Mechanism of electrochemical ozone production (EOP)
The sluggish kinetics of EOP, coupled with the limited availability of precious metal electrode materials, and the rapid decrease in catalytic activity under highly oxidative conditions are all crucial challenges that must be addressed to realize a highly efficient and stable EOP process.24–26 Hence, a profound comprehension of the EOP reaction mechanism and the underlying reasons for catalyst deactivation is crucial for the advancement of EOP catalysts with superior performance and cost efficiency, while also enhancing their long-term stability in real-world operational settings.The anodic reaction of electrolytic water primarily involves two processes: the 4-electron OER and the 6-electron EOP.27 Among these, the adsorbate evolution mechanism (AEM) and the lattice oxygen mechanism (LOM) stand out as the two most plausible mechanisms for the 4-electron OER process under acidic conditions, attracting extensive research attention.28–30 The mechanism path of the catalytic reaction, whether it follows a single-site or dual-site approach, is intricately linked to the electronic structure of the catalyst material itself. Highly crystalline oxides, characterized by minimal defects, tend to favor the AEM process. This mechanism can proceed via two distinct pathways: the acid–base pathway, which involves a single active metal site and an OOH* intermediate, or the O–O direct coupling pathway, which engages two adjacent metal sites with an O* intermediate.31–33 In amorphous metal oxides, characterized by abundant oxygen vacancies and, in some cases, strong metal–oxygen covalent bonds as seen in chalcogenides, the lattice oxygen mechanism tends to dominate. This mechanism involves a hydrophilic nucleophilic attack on a single reactive oxygen site or the direct coupling of two neighboring reactive lattice oxygen atoms. These reactions create oxygen vacancies that can be replenished by water molecules or numerous oxygen atoms. Simultaneously, the resulting unsaturated metal sites are more susceptible to dissolution.34,35 While the LOM has the potential to overcome the limitations of the conventional AEM and provide a more comprehensive explanation of the underlying factors contributing to the high activity of solid-phase catalysts, it also tends to introduce stability issues for the catalyst.36,37 Hence, comprehending the various EOP reaction mechanisms is pivotal for elucidating the fundamental factors underlying the superior performance of catalysts. This understanding serves as a crucial framework for designing viable EOP catalysts.
2.1. The adsorbate evolution mechanism (AEM)
In recent years, the EOP reaction mechanism has also been deeply investigated. The AEM mechanism in the OER process involves the adsorption and desorption of reactants, i.e., the OH* → O* → OOH* → O2* → O2 process.38–40 AEM in the EOP process also involves the additional combination of O2* and O* to form O3* and subsequent desorption to generate O3. This process requires a higher potential difference to facilitate the reaction.Gibson and his team endeavored to delve deeper into the EOP process from a theoretical computational perspective, as depicted in Fig. 2a.41 They employed density-functional theory (DFT) calculations to model a potential ozone formation pathway on the β-PbO2 (110) surface, subsequently verifying a favorable reaction mechanism. The modeled mechanism comprised four steps (Fig. 2a(i)): initially, H2O would decompose into O2* intermediates, followed by their interaction with surface O* to generate O3 (eqn (5)–(8)):
| H2O → OH* + H+ + e− | (5) |
| OH* → O* + H+ + e− | (6) |
| 2O* → O2* → O2 | (7) |
| O2* + O* → O3* → O3 | (8) |
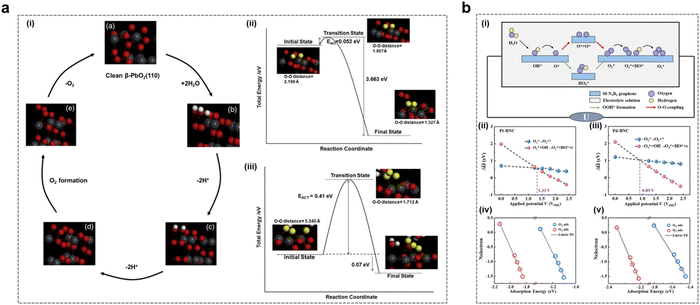 | ||
| Fig. 2 The AEM mechanism in the EOP process. (a) (i) Simulation of the mechanism of the first three EOP reaction steps on the β-PbO2(110) crystal surface. (ii) Schematic energy diagram of the third step: formation of surface O2 from two adsorbed oxygen atoms. (iii) Schematic energy diagram of the fourth step: conversion from O2 and O to O3. (Reprinted with permission from ref. 41. Copyright Elsevier 2016.) (b) (i) Schematic representation of the proposed reaction pathways for OER/EOP on M-BNC. (ii)–(v) Correlation between the adsorption energies of O2 and O3 with different surface electron distributions on Pt-BNC (ii) and (iv) and Pd-BNC (iii) and (v) (Reprinted with permission from ref. 25. Copyright American Institute of Physics 2022.) | ||
The first two steps occurred nearly simultaneously upon the application of a fixed potential to the anode surface in an acidic medium. The focus of this study is on reactions (3) and (4). Step 3 involved the generation of O2 (Fig. 2a(ii)), while step 4 entailed the formation of O3 from O2* produced in step 3, through further combination with surface O* (Fig. 2a(iii)). Theoretical calculations reveal a viable EOP pathway utilizing the β-PbO2 (110) surface as a model catalyst. This pathway involves the adsorption of H2O onto the catalyst surface, followed by its oxidation to form surface-bound OH*. This intermediate is then converted into O*, which subsequently reacts with surface-bridged O* to generate O2*. The O2* species further interacts with surface O* to ultimately produce O3. However, the final step of the mechanism, which involves the O3H* intermediate, has been identified as thermodynamically and kinetically less favorable across various reaction pathways. Therefore, it proceeded via Eley–Rideal interactions, wherein surface O2* desorbed and underwent attack by surface-bridged oxygen to form O3. This study offers a valuable case for comprehending the EOP process through the theoretical computational path.
Feng et al. designed a Pt/Pd single atom embedded on a B/N co-doped graphene (Pt/Pd-BNC) surface (Fig. 2b). They conducted a systematic investigation into the impact of applied potential on the electrocatalytic generation of O2/O3 selectivity in an alkaline medium, employing grand canonical density functional theory (GC-DFT) calculations.25 They utilized the reaction free energies of two crucial fundamental steps: the direct desorption of O2* and the subsequent reaction of O2* with OH− to form O2* + OH*, as key descriptors for O2/O3 selectivity (Fig. 2b(i)). As presented in Fig. 2b(ii–v), this theoretical calculation method predicted the potential crossings for O2/O3 selectivity in Pt/Pd-BNC catalysts to be 1.33 and 0.89 V vs.SHE, respectively. This study elucidated the potential influence on the selective generation of O2/O3 during the anodic reaction of electrolytic water on the surface of a two-dimensional material. It provides new insights into the reactivity and selectivity of electrode surfaces under real-world reaction conditions.
2.2. The lattice oxygen mechanism (LOM)
With the advancement of in situ characterization techniques and the development of theoretical calculation methods, researchers have observed that certain solid-phase oxides with weak metal–oxygen covalent bonding exhibit a tendency for the lattice oxygens of the catalysts to undergo oxidation at EOP test potentials, leading to subsequent O3 generation.24,42,43 The process follows the LOM route, a pathway that frequently transcends the conventional limitations of the AEM path, thereby providing a more comprehensive explanation for the high catalytic activity observed in these solid-phase catalysts.44 Therefore, in recent years, researchers have also explored the LOM mechanism in the EOP process in depth and used it as a guide to further develop highly active catalysts.Jiang and Wang et al. from our group investigated the mechanism of the facet effect and the role of lattice oxygen (Olatt) in the EOP process using β-PbO2-120 NRs as the electrocatalyst. This study utilized in situ18O isotope labelling in conjunction with differential electrochemical mass spectrometry (DEMS) experiments and density functional theory (DFT) calculations.45 As indicated in Fig. 3a(i), the DEMS test results indicate that the EOP process followed the LOM pathway, i.e. the generation of O3 by coupling of three lattice oxygens of the catalyst. The results of the DFT study showed that the β-PbO2 (101) surface was more active than the β-PbO2 (110) surface in terms of Olatt migration and O3 formation (Fig. 3a(ii–v)). It was found that Olatt on this surface exhibited extremely high migration and desorption reactivity during the EOP process. The β-PbO2 (101) surface exhibits a negative oxygen vacancy formation energy, which could be attributed to the weak covalent interaction between the Pb-6s/6p orbitals and the O-2p orbitals. The formation of surface oxygen vacancies further triggered H2O adsorption and splitting reactions, which refilled the oxygen vacancies and ensured the relative stability of the crystal structure. These research advances provide valuable insights into the LOM mechanism of metal oxide based electrocatalysts. In addition, the origin of the excellent EOP activity of Bi12PbO20 was also investigated by Shi et al. using in situ DEMS combined with DFT.46 As shown in Fig. 3b, the EOP process also followed the LOM pathway, as evidenced by in situ18O isotopic labelling combined with the DEMS test results, i.e. three lattice oxygen atoms in Bi12PbO20 were coupled together to form 48O3 (Fig. 3b(i)). Herein, the similarity of the electronic structures of both Pb and Bi provides a favourable pathway for modulating the local electronic environment of Pb, altering the electronic structure and modulating the metal–oxygen (M–O) binding energy of the oxygen intermediate. Theoretical calculations further showed that the restricted [Pb–O4] fragment was confined to the Bi–O bonding environment of Bi12PbO20, and the low oxygen vacancy formation energy generated by the weak Pb–O interactions significantly enhanced the EOP activity (Fig. 3b(ii–iii)). Moreover, our group synthesized a square-shaped lead oxide catalyst (PbOx-CTAB-120) with excellent EOP performance.4718O isotope labeling combined with in situ DEMS testing revealed that this electrocatalyst followed the LOM pathway during the EOP process (Fig. 3c(i)). The comparison of the two reaction pathways on the Pb3O4 (110) surface by theoretical calculations leads to the qualitative conclusion that the LOM reaction path is thermodynamically more favourable than the AEM reaction path (Fig. 3c(ii–iii)) because the involvement of exposed lattice oxygen during the reaction leads to the formation of oxygen vacancies, effectively stabilizing the OOH* and O2* reaction intermediates, thereby promoting the maintenance of superior EOP reaction activity and stability of the material.
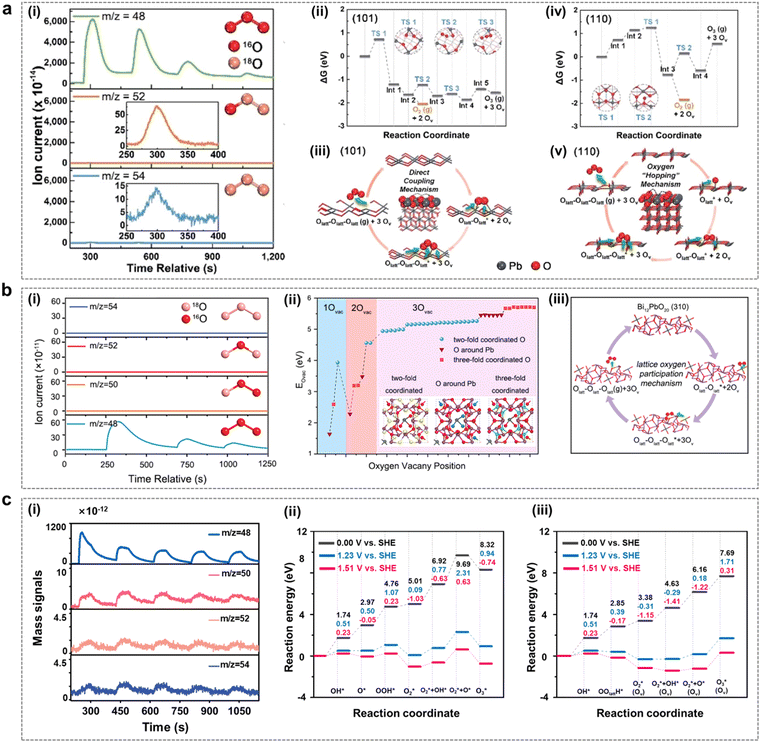 | ||
| Fig. 3 The LOM mechanism in the EOP process. (a) (i) Differential electrochemical mass spectrometry measurements of 48O3, 52O3 and 54O3 signals from the reaction products of β-PbO2-120 NRs (with 16O) in a H218O aqueous electrolyte. (ii) and (iv) Free energy diagrams at 298 K for lattice oxygen migration and coupling to O2/O3 on the (101) and (110) surfaces of β-PbO2, calculated using density functional theory. (iii) and (v) Proposed reaction network for electrocatalytic O2/O3 production originating from lattice oxygen on the (101) and (110) surfaces of β-PbO2. (Reprinted with permission from ref. 45. Copyright Royal Society of Chemistry 2021.) (b) (i) Constituent content of 48O3, 50O3, 52O3 and 54O3 through in situ DEMS measurements from reaction products for Bi12PbO20. (ii) Formation energies of 1Ov, 2Ov and 3Ov in Bi12PbO20. (iii) EOP reaction network of Bi12PbO20 by the LOM pathway. (Reprinted with permission from ref. 46. Copyright Royal Society of Chemistry 2022.) (c) (i) Constituent content of 48O3, 50O3, 52O3 and 54O3 through in situ DEMS measurements from the reaction products for PbOx-CTAB-120. (ii) and (iii) DFT-calculated potential energy diagram for the EOP process on Pb3O4 (110) via the AEM (ii) and LOM (iii) under various applied potentials (electro-neutral, 1.23 V vs. SHE and 1.51 V vs.SHE). (Reprinted with permission from ref. 47. Elsevier & ScienceDirect 2024.) | ||
2.3. The “five-membered cycle” mechanism
Through extensive investigation of the EOP mechanism, our group has revealed a significant finding: the presence of a stable “five-membered cycle” configuration, forged by O3* and the active site, actively promotes the generation of O3, which enables the catalyst to exhibit excellent EOP activity (Fig. 4).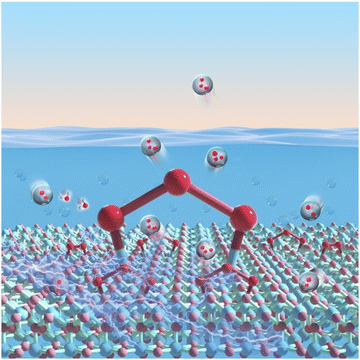 | ||
| Fig. 4 Schematic diagram of the “five-membered cycle” mechanism during the EOP process presented by our group. | ||
Yuan et al. designed and synthesized PtZn alloy nanoparticles (PtZn/Zn–N–C) embedded in an atomically dispersed porous carbon matrix (Zn–N–C) with precisely controlled size distribution.48 The strong coupling interactions between the PtZn bimetallic nanoparticles and the Zn–N–C matrix create favorable sites for hydrolysis dissociation and oxygen desorption. Specifically, the high O2 chemisorption and O–O coupling capacity at the PtZn–Zn–N–C interface facilitate the formation of O3 intermediates, thereby stabilizing the five-membered cyclic structure. This reflects the advantageous metal–support interactions (MSIs) between the PtZn nanoparticles and the Zn–N–C support (Fig. 5a).
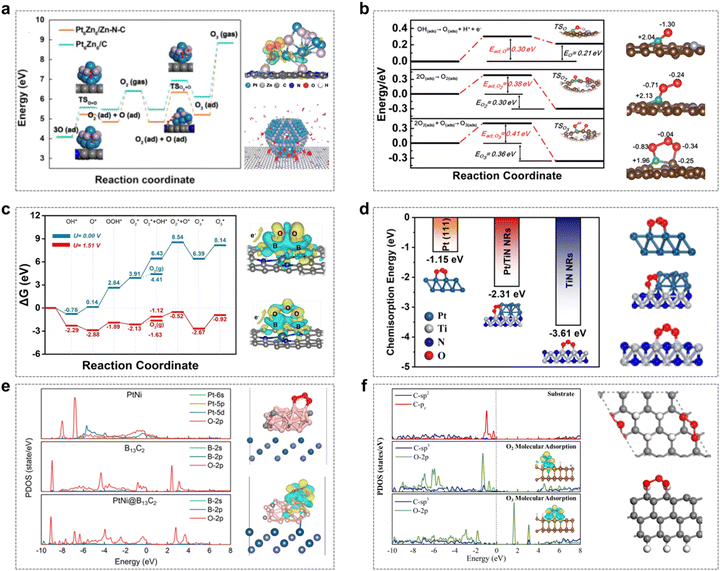 | ||
Fig. 5 The “five-membered cycle” mechanism in the EOP process. (a) Energy profiles for O3 formation on Pt6Zn6/Zn–N–C and Pt6Zn6/C; charge density difference for O3 on Pt6Zn6/Zn–N–C, and the reaction mechanism of O3 formation on PtZn/Zn–N–C. (Reprinted with permission from ref. 48. Copyright Elsevier 2020.) (b) Energy profile for O3 formation, including the formation of an O intermediate upon OH deprotonation, O2 molecule is adsorbed from two adsorbed oxygen atoms, and the transformation of O2* and O* into O3; optimized structures of O*, O2*, and O3* adsorbed onto D-BNC-1. (Reprinted with permission from ref. 14. Copyright Royal Society of Chemistry 2020.) (c) Proposed reaction network of the six-electron process leading to gaseous O3 generation, and charge density differences in O2/O3 adsorption on the Pt-SAs/BNC-3 surface. (Reprinted with permission from ref. 15. Copyright ACS publications 2021.) (d) Structure and energy of O3* adsorption in three systems. (Reprinted with permission from ref. 49. Copyright ACS Publications 2024.) (e) Projected electronic density of states (PDOS) for O3 adsorbed on three different surfaces; optimized structures and charge density differences for O3 adsorbed on PtNi@B13C2. (Reprinted with permission from ref. 50. Copyright ACS Publications 2023.) (f) PDOS and charge density differences for clean and O2/O3 adsorption on the 2D ND surface when sp3/sp2 = 5![[thin space (1/6-em)]](https://www.rsc.org/images/entities/char_2009.gif) : :![[thin space (1/6-em)]](https://www.rsc.org/images/entities/char_2009.gif) 3; DFT-calculated O3 adsorption on the 2D ND surface for sp3/sp2 = 4 3; DFT-calculated O3 adsorption on the 2D ND surface for sp3/sp2 = 4![[thin space (1/6-em)]](https://www.rsc.org/images/entities/char_2009.gif) : :![[thin space (1/6-em)]](https://www.rsc.org/images/entities/char_2009.gif) 5 (Upper and lower figures showing side and top views, respectively). (Reprinted with permission from ref. 51. Copyright ACS Publications 2023.) 5 (Upper and lower figures showing side and top views, respectively). (Reprinted with permission from ref. 51. Copyright ACS Publications 2023.) | ||
Zhang et al. developed a multifunctional site-deficient mesoporous carbon material co-doped with pyrrolidone N and B (D-BNC).14 As depicted in Fig. 5b, the high EOP activity observed in D-BNC can be attributed to the synergistic effects among pyrrolidone-N, B, adjacent C elements, and structural defects. Pyrrolidone-N facilitates the decomposition of H2O and OH into O intermediates, while B and nearby C atoms act as active sites for the O* and O2* intermediates, respectively. This results in the formation of a unique 'five-membered cycle' structure involving O3, the central B atom, and neighboring C atoms, which reduces the potential barriers for O3 formation and thus enhances the EOP process.
Gu et al. designed and synthesized a Pt-SAs/BNC catalyst, where Pt single atoms are embedded in B/N co-doped carbon nanotubes.15 To further elucidate the EOP mechanism of this catalyst, DFT calculations were employed to comprehensively investigate the possible reaction intermediates involved in the EOP process. The formation of gaseous O3 was found to involve eight fundamental steps, including six electron transfer steps, one O2–O coupling step, and one O3 desorption step. The synergistic interaction between Pt single atoms (Pt-SA) and B sites significantly enhanced the kinetics of O3 generation. As illustrated in Fig. 5c, the B site on the Pt-SA/BNC surface is responsible for trapping and stabilizing the O2* intermediate, while the adjacent Pt-SA site acts as the active site for H2O activation and O* formation. The exposed B site effectively slows the migration rate of O2* on the surface, ensuring its further coupling with O* to generate O3, thereby forming a specialized 'five-membered cycle' configuration. Additionally, Yu et al. demonstrated that mesoporous three-dimensional Pt/TiN nanorods (Pt/TiN NRs) exhibit excellent EOP performance.49 Theoretical calculations revealed that the metal–support interaction (MSI) between Pt and TiN alters the electronic structure of Pt nanoparticles, playing a crucial role in the adsorption of active intermediates during the EOP process. This interaction promotes the formation of the 'five-membered cycle' O3* configuration, contributing to the superior EOP performance (Fig. 5d).
Furthermore, a boron carbide-encapsulated platinum–nickel alloy material (PtNi@B13C2), which exhibits excellent EOP performance, has been prepared by Li et al.50 The synergistic effect between the encapsulated PtNi alloy nanoparticles and the B13C2 composites, as well as the enhanced electron penetration through the tuning of the electronic structure by the B13C2 layer, play an important role in promoting the electrocatalytic activity in the EOP process. Theoretical calculations indicate that the formation of the “five-membered cycle” structure with adsorbed O3 is favored by the appropriate distance between B atoms on the B13C2 (012) surface (Fig. 5e). Furthermore, the presence of PtNi creates favourable electronic interactions between the B13C2 surface and the adsorbed O3, which reduces the O 2p orbitals near the Fermi level, and therefore weakens the adsorption of O3, thus exhibiting excellent EOP performance.
Moreover, Yang et al. designed and prepared 2D nanodiamonds (2D NDs) with different sp3/sp2-C ratios and tested their EOP performance.51 The results showed that the 2D NDs with sp3/sp2 interfacial heterojunctions had excellent EOP performance. Theoretical calculations further showed that a high sp3/sp2 ratio effectively prevents the dissociation of O2*/O3* intermediates, in which case the “five-membered cycle” conformation O3* has a lower adsorption energy than the O2* conformation, suggesting that the material is highly selective for O3 (Fig. 5f).
Ding et al. observed a remarkable difference in the surface reactivity of Sb-doped SnO2 and Ni–Sb co-doped SnO2 towards the reaction intermediate O2*.52 In detail, O2* showed limited adsorption on the surface of Sb-doped SnO2, and its adsorption was significantly enhanced on Ni–Sb co-doped SnO2. This variation could be attributed to the different surface electronic states of Ni and Sn, which influenced the adsorption behavior of O2/O3 intermediates. This phenomenon results from the formation of Ni–O bonds and the consequent charge transfer between the surface of Ni–Sb–SnO2 and O2*. The electron transfer from the Ni site to the π* orbitals of the O3 molecule led to the formation of a conjugated structure, eventually culminating in the establishment of a stable “five-membered cycle” adsorption configuration. Similarly, Xue et al. constructed Ce–Ni–Sb–SnO2 four-component metal oxides to achieve excellent EOP performance by adding the lanthanide metal Ce to Ni–Sb–SnO2 oxides, which is attributed to the fact that Ce doping modulates the electronic structure of this catalytic material to exhibit favourable adsorption and desorption of O2* and O3* reaction intermediates.53
The catalysts mentioned above, which are involved in the “five-membered cycle mechanism”, include PtZn/Zn–N–C, D-BNC, Pt-SAs/BNC, Pt/TiN NRs, PtNi@B13C2, 2D NDs, Ni–Sb co-doped SnO2, and Ce–Ni–Sb–SnO2. Due to the metal–support interactions (MSIs) or the synergistic effects of elemental co-doping, as well as the presence of interfacial heterojunctions in these catalysts, the adsorption behavior of oxygen intermediates during the EOP process is favorably influenced. These factors provide active sites for O* and O2* intermediates, forming a unique “five-membered cycle” configuration, which contributes to enhanced EOP performance. Therefore, the design of catalysts incorporating the aforementioned structural features holds significant potential for achieving superior EOP performance.
3. Typical EOP catalysts
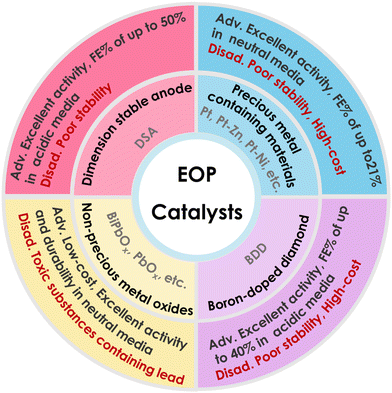
The catalyst is one of the key factors affecting the performance of electrolytic aqueous ozone production, and the search for efficient anode catalysts is key to improving the performance of EOP. As shown in Fig. 6 and Table 1, the catalysts with good EOP activity reported so far mainly include non-precious metal oxide catalysts (β-PbO2, Pb3O4, PbBiOx, etc.),45,46,54–61 precious metal-containing catalysts15,48–50,62 (Pt, PtZn-C, etc.), boron-doped diamonds (BDDs),51,63,64 and dimensionally stable anodes (DSA electrodes).52,53,65–68 Among these, catalysts containing precious metals (e.g. Pt) became some of the most widely used EOP catalysts in the early stages thanks to their high oxidation potential and excellent stability. However, the rarity and high cost of precious metals limited their large-scale application. DSA and BDD electrodes normally exhibit good EOP performance in acidic media, but BDD performs poorly in forming water flow channels, resulting in poor contact between ozone and water in the equipment, especially in neutral media, and its preparation process is more complex and costly to achieve. DSA electrode materials are complicated to prepare and usually have excellent activity in acidic media, but their stability is difficult to maintain, while the EOP performance of this material is limited in neutral media. β-PbO2 is a widely studied EOP catalyst, known for its high anodic oxidation potential, good electrical conductivity, and low cost. However, balancing its EOP activity and stability at industrially relevant high current densities remains a significant challenge.3.1. Precious metal containing catalysts
| Catalysts | Operation condition | Faraday efficiency (%) | Stability | Ref. | ||||
|---|---|---|---|---|---|---|---|---|
| Electrolyte | Current density/Potential | Temperature (°C) | Water flow rate (mL min−1) | Pressure (MPa) | ||||
| Pt mesh | Water | 1.25 A cm−2 | Room temperature | 690 mL min−1 | 0.8 MPa | 31.0 | — | 129 |
| Pt/TaOy | The imitation tap water | LSV: 1.0–2.2 V vs. Ag/AgCl | 25 °C | Under stirring conditions | Normal pressure | 19.3 | 60 h, 100 mA | 130 |
| Pt/Ti | 0.5 M H2SO4 | 5 V | — | — | — | 19.7 | — | 131 |
| PtZn/Zn–N–C | Saturated K2SO4 | 0.05 A cm−2 | Room temperature | Stationary solution | Normal pressure | 4.2 | 20 h, 2.61 V vs. Ag/AgCl | 48 |
| Pt-SA/BNC | Saturated K2SO4 | 0.05 A cm−2 | Room temperature | Stationary solution | Normal pressure | 21.0 | 100 h, 3 V vs. RHE | 15 |
| Pt/Ni@B13C | Saturated K2SO4 | 0.05 A cm−2 | Room temperature | Stationary solution | Normal pressure | 14.8 | 120 h, 2.8 V vs. RHE | 50 |
| Pt/TiN | Saturated K2SO4 | 0.05 A cm−2 | Room temperature | Stationary solution | Normal pressure | 13.0 | 70 h, 50 mA cm−2 | 49 |
| BDD | 0.85 M Na2SO4 | 2.2 V | — | — | — | 40.0 | — | 94 |
| p-BDD | 0.1 M Na2SO4 | 0.5 A/4 V | 19–30 °C | Stationary solution | Normal pressure | — | 40 h, 4 V | 63 |
| HPHT BDD | Distilled water | 0.77 A cm−2 | — | 193 ± 1 mL min−1 | — | 23.0 | 20 h, 0.3 A | 64 |
| 2D NDs | Saturated K2SO4 | 0.0625 A cm−2 | Room temperature | Stationary solution | Normal pressure | 10.0 | 40 h, 10 mA cm−2 | 51 |
| Ni–Sb–SnO2 | 0.1 M NaCl | 0.0125 A cm−2 | — | — | Normal pressure | 13.6 | — | 132 |
| Ni/Sb–SnO2 | Millipore water | 2.7 V | Room temperature | 200 mL min−1 | N2 flow:120 mL min−1 | 33.0 | — | 133 |
| Ni–Sb–SnO2 | 30 mM NaCl | 0.01 A cm−2 | — | — | — | 50.0 | — | 134 |
| Gd–Ni–Sb–SnO2 | 0.5 M H2SO4 | 2.7 V vs. RHE | — | — | — | 64.0 | — | 65 |
| Imp–Ni–Sb–SnO2 | 0.5 M H2SO4 | 0.25 A cm−2 | Room temperature | Stationary solution | Normal pressure | 48.1 | 200 h, 125 mA cm−2 | 52 |
| Ce–Ni–Sb–SnO2 | 0.5 M H2SO4 | 0.25 A cm−2 | Room temperature | Stationary solution | Normal pressure | 43.9 | 600 h, 250 mA cm−2 | 53 |
| β-PbO2/Ta2O5 NRs | Saturated K2SO4 | 0.025 A cm−2 | Room temperature | Stationary solution | Normal pressure | 16.4 | 100 h, 3 V vs. RHE | 54 |
| β-PbO2-120 NRs | Ultrapure water | 0.5 A cm−2 | Room temperature | Stationary solution | Normal pressure | 14.9 | 50 h, 0.5 A cm−2 | 45 |
| Commercial Pb3O4 | Ultrapure water | 1.0 A cm−2 | Room temperature | Stationary solution | Normal pressure | 12.0 | 950 h 1.0 A cm−2 | 17 |
| Commercial β-PbO2 | Ultrapure water | 1.0 A cm−2 | Room temperature | Stationary solution | Normal pressure | 16.4–7.5 | 950 h 1.0 A cm−2 | 17 |
| Bi12PbO20 | Saturated K2SO4 | 0.05 A cm−2 | Room temperature | Stationary solution | Normal pressure | 15.1 | 100 h, 2.8 V vs. RHE | 46 |
| Bi6Pb2Ox | Saturated K2SO4 | 0.075 A cm−2 | Room temperature | Stationary solution | Normal pressure | 13.5 | 50 h, 2.77 V vs. RHE | 109 |
| Pb2O3@Bi2O3-Tube | Saturated K2SO4 | 0.05 A cm−2 | Room temperature | Stationary solution | Normal pressure | 11.3 | 40 h, 1 mA cm−2 | 55 |
| Cubic-Pb3O4@SiO2 | Saturated K2SO4 | 0.1 A cm−2 | Room temperature | Stationary solution | Normal pressure | 16.8 | 400 h, 1 A cm−2 | 108 |
| PbOx-CTAB-120 | Saturated K2SO4 | 0.05 A cm−2 | Room temperature | Stationary solution | Normal pressure | 20.7 | 100 h, 10 mA cm−2 | 47 |
| T-400 catalyst | Saturated K2SO4 | 0.05 A cm−2 | Room temperature | Stationary solution | Normal pressure | 13.0 | 30 h, 10 mA cm−2 | 57 |
| ZnO/ZnS@C | Saturated K2SO4 | 0.05 A cm−2 | Room temperature | Stationary solution | Normal pressure | 11.0 | 30 h, 3 V | 56 |
It has been shown that the electronic structure of Pt can be modulated by modification of the catalyst composition, thereby improving its catalytic performance. As shown in Fig. 7a, the mesoporous three-dimensional Pt/TiN nanorods (Pt/TiN NRs) with excellent EOP performance were prepared by Yu et al.49 Theoretical calculations showed that the metal carrier interaction (MSI) between Pt and TiN was able to change the electronic structure of Pt nanoparticles, which played an important role in adsorbing active intermediates for the EOP process, thus contributing to achieving excellent EOP performance. Yuan et al. designed and prepared PtZn alloy nanoparticles (PtZn/Zn–N–C) embedded in an atomically dispersed porous carbon matrix (Zn–N–C) with well-controlled size dependence as shown in Fig. 7b.48 The strong coupling interactions between PtZn bimetallic nanoparticles and the Zn–N–C support provide favorable sites for hydrolysis dissociation and oxygen desorption. This synergy also leads to the reduction of the noble metal Pt and optimization of its intrinsic electronic structure, thereby enhancing EOP activity and durability while reducing material costs.
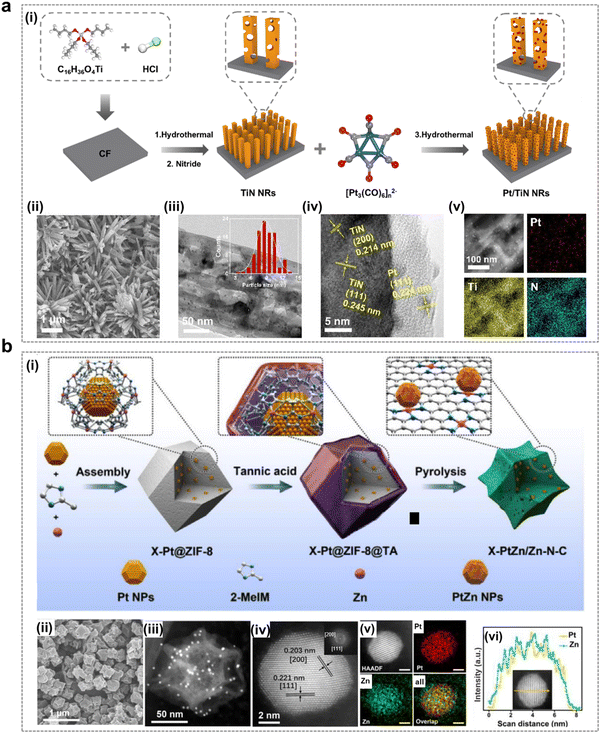 | ||
| Fig. 7 Pt-containing catalysts for the EOP process. (a) (i) Schematic illustration of the formation of Pt/TiN nanorods. (ii) and (iii) SEM and TEM images of Pt/TiN NRs-1 (with particle size distribution of Pt nanoparticles shown in the inset). (iv) and (v) HRTEM image and EDX elemental mapping of Pt, Ti, and N for Pt/TiN NRs-1. (Reprinted with permission from ref. 49. Copyright ACS Publications 2024.) (b) (i) Schematic synthesis route of X-PtZn/Zn–N–C electrocatalysts (where X denotes the size of PtZn nanoparticles). (ii) and (iii) SEM and HAADF-STEM images of 7.7-PtZn/Zn–N–C. (iv)–(vi) Elemental maps and line scan analysis of PtZn nanoparticles (scale bar: 2 nm). (Reprinted with permission from ref. 48. Copyright Elsevier 2020.) | ||
However, Pt-based alloys are still plagued by poor thermodynamic stability and a tendency towards surface segregation.69–72 As a result, maintaining catalytic stability in electrolytes is a critical issue for Pt-based alloys. To address this, encapsulating metal nanoparticles within a carbon shell to form a core–shell structure is an ideal strategy. The carbon shell not only protects the metal nanoparticles from electrochemical oxidation and physical agglomeration but also facilitates electron transfer, thereby enhancing electrocatalytic performance.73–75 Nevertheless, conventional carbon materials are susceptible to corrosion and oxidation, which compromise their stability under the high-potential conditions typical of EOP operation.
Boron doping in carbon materials has been identified as an effective strategy for enhancing catalyst stability under EOP operating conditions.14,15,50 Zhang et al. developed a multifunctional site-deficient mesoporous carbon material co-doped with pyrrolidone-N and B (D-BNC).14 It was found that the high EOP activity of D-BNC is attributed to the synergistic interactions among pyrrolidone-N, B, neighboring C elements, and structural defects. Pyrrolidone-N facilitates the decomposition of H2O and OH into O intermediates, while B and adjacent C atoms serve as active sites for the adsorption of O22* and O* intermediates. This interaction enables the formation of a unique “five-membered cycle” structure involving O3, the central B atom, and neighboring C elements, which reduces the reaction potential barriers for O3 formation, thereby promoting the EOP process.
As shown in Fig. 8a, Gu et al. created a local environment enriched with EOP reaction intermediates by combining Pt single atoms and B/N co-doped carbon nanotubes (CNTs), which ensured that the enriched exposure of the active sites gave full play to the catalytic effect and at the same time served to regulate the mass transport of the reaction process, achieving the enrichment of O2* and O* intermediates, thus effectively facilitating the selective O3 generation.15 Li et al. prepared a boron carbide-encapsulated PtNi alloy catalyst (PtNi@B13C2), in which the nano calcification effect of the B13C2 shell prevents surface segregation of PtNi nanoparticles and is able to effectively protect the internal PtNi from destruction during the EOP process (Fig. 8b). Finally, PtNi@B13C2 showed satisfactory EOP activity and stability thanks to the stabilization of the PtNi alloy B13C2 shell layer under harsh conditions and the unique electronic environment formed by the interaction of the two components.50
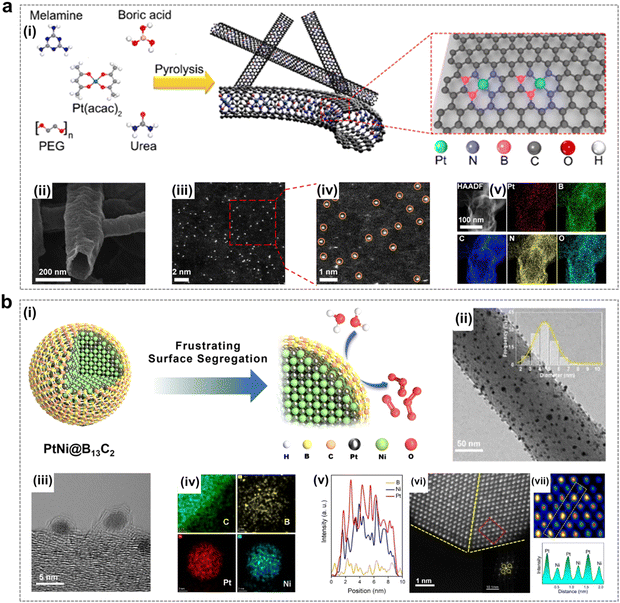 | ||
| Fig. 8 Pt-containing catalysts using for EOP process. (a) (i) Schematic illustration of the synthesis of Pt-SAs/BNCs. (ii)–(iv) Field-emission SEM, HAADF-STEM, and magnified images of Pt-SAs/BNC-3. (v) Elemental maps of Pt, B, C, N, and O for Pt-SAs/BNC-3. (Reprinted with permission from ref. 15. Copyright ACS Publications 2021.) (b) (i) Schematic representation of the PtNi@B13C2 structure and the EOP process. (ii) and (iii) TEM images of PtNi@B13C2-2. (iv) EDX elemental maps of C, B, Pt, and Ni for PtNi@B13C2-2. (v) EDX elemental line scan across a single PtNi@B13C2-2 nanoparticle. (vi) Enlarged HAADF-HRSTEM image of PtNi@B13C2-2. (vii) Enlarged view of the region marked by the yellow dotted rectangle in (vi), along with a profile of the atom columns as indicated in the rectangular area of the HAADF-HRSTEM image. (Reprinted with permission from ref. 50. Copyright ACS Publications 2023.) | ||
In summary, the novel Pt-based catalysts for EOP research have made great progress in recent years, but the focus has been mainly on testing under current density conditions at the laboratory level, and the actual application research at industrial current density still requires further exploration.
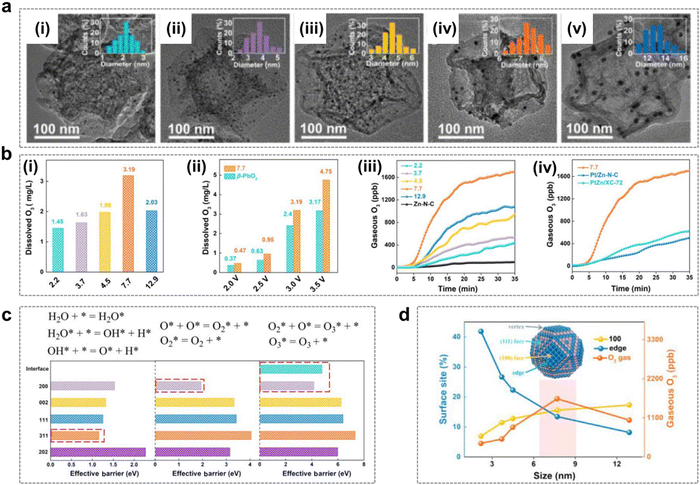 | ||
| Fig. 9 Catalyst size effects during the EOP process. (a) (i)–(v) TEM images and particle diameter histograms (insets) of PtZn particle size of X-PtZn/Zn–N–C with PtZn particle sizes of (i) 2.2 nm, (ii) 3.7 nm, (iii) 4.5 nm, (iv) 7.7 nm, and (v) 12.9 nm. (Reprinted with permission from ref. 48. Copyright Elsevier 2020.) (b) (i) Quantitative comparison of dissolved O3 concentrations at 3 V vs.RHE for X-PtZn/Zn–N–C. (ii) Quantitative comparison of dissolved O3 concentrations for 7.7-PtZn/Zn–N–C and commercial β-PbO2 as a function of the applied potential. (iii) Gaseous O3 productivity of X-PtZn/Zn–N–C at a current density of 50 mA cm−2. (iv) Gaseous O3 productivity of 7.7-PtZn/Zn–N–C, Pt/Zn–N–C and PtZn/XC-72 at a current density of 50 mA cm−2. (Reprinted with permission from ref. 48. Copyright Elsevier 2020.) (c) Elementary steps (top) of the O/O2/O3 formation process and the effective barrier for PtZn (200), PtZn (002), PtZn (111), PtZn (311), and PtZn (202). (Reprinted with permission from ref. 48. Copyright Elsevier 2020.) (d) Correlation between the percentage of surface sites and EOP activity for different sizes of the PtZn nanoparticles. (Reprinted with permission from ref. 48. Copyright Elsevier 2020.) | ||
3.2. Boron-doped diamond (BDD)
Diamond electrodes have electrochemical and structural stability,76–78 especially boron doped diamond (BDD) electrodes with a sp3-C structure. Meanwhile, BDD materials have high oxidation potentials of 2.1–2.8 V vs.RHE, which can generate a large number of reactive hydroxyl radicals during the EOP process, thus improving the efficiency of ozone generation.79–81 The key to an efficient EOP process is the simultaneous achievement of high ozone output, low energy consumption and long-term stable operation. In general, there are two feasible ways to improve the ozone production performance of BDD electrodes: first, the adsorption capacity of untreated BDD surfaces for oxygen-containing species is usually weak, and surface modification can be considered to improve its adsorption capacity for oxygen-containing species, thus improving the ozone production performance.82 In addition, due to the presence of stable covalent bonds formed by covalent electrons, the untreated BDD surface has fewer electrochemical active sites, so increasing the number of active sites can be considered to improve the catalytic performance. Therefore, excellent EOP performance of BDD electrodes can be achieved by improving their adsorption capacity for oxygenated species and increasing the electrochemically active surface area (ECSA) of the catalysts, such as by constructing porous structures and heat treatment.The fabrication of porous structures on BDDs includes bottom-up and top-down methods, based on the consideration of improving the EOP performance of BDD electrodes by increasing the ECSA. The bottom-up method is achieved by in situ deposition of BDDs on the surface of porous materials,83 whereas the top-down method is realised by high-temperature chemical etching or plasma etching techniques in the presence of catalysts such as nickel and iron.84 The plasma etching technique makes it possible to obtain a variety of porous structures and the internal structure of the material is not destroyed.85–87 This porous structure not only increases the specific surface area of BDD electrodes, but also improves the adsorption performance of BDD electrodes for oxygenated species such as hydroxyl.88 Meanwhile, plasma etched materials have higher electrical conductivity and EOP performance.89–91
As shown in Fig. 10a, Liu et al. reported the use of oxygen plasma etched microporous BDD electrodes (called p-BDDs) to improve the performance of electrochemical ozone generators.92 The p-BDD fabrication process uses the hot filament chemical vapor deposition (HFCVD) technique to grow BDDs on a silicon substrate, which is subjected to O2 plasma etching to form a microporous structure. The results showed that p-BDD electrodes exhibited better EOP performance than untreated BDD electrodes, as the increase in the ECSA was beneficial in promoting the EOP process to achieve charge transfer.
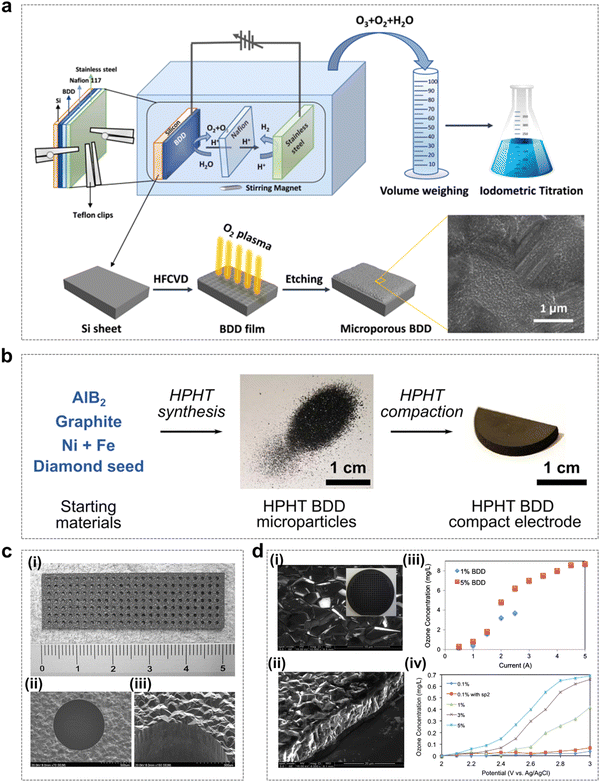 | ||
| Fig. 10 Boron-doped diamond (BDD) catalysts for the EOP process. (a) Schematic diagram of the microporous BDD preparation process and its application in the EOP process as an electrode material. (Reprinted with permission from ref. 92. Copyright Elsevier 2021.) (b) Step-by-step diagram of the high-pressure high-temperature (HPHT) BDD electrode preparation. (Reprinted with permission from ref. 92. Copyright Elsevier 2021.) (c) Photograph of a freestanding perforated diamond electrode (i) and SEM images of the perforated hole (ii) and (iii). (Reprinted with permission from ref. 93. Copyright IOPscience 2006.) (d) (i) and (ii) Typical SEM images of BDD films from upper and side views. (iii) Dependence of the ozone concentration on the applied current using systems with 1% and 5% BDD electrodes. (iv) Dependence of ozone concentration on applied potentials vs. Ag/AgCl using systems with various types of BDD electrodes. (Reprinted with permission from ref. 94. Copyright Elsevier 2013.) | ||
In recent years, as an alternative growth technique to chemical vapor deposition, high-pressure, high-temperature (HPHT) synthesis has been gradually applied to the fabrication of conductive BDD electrodes. As shown in Fig. 10b, Georgia and colleagues found that perforated electrodes could be fabricated by compressing BDD microparticles into free-standing solid electrodes for laser micromachining, and the compressed BDD microparticle electrodes were able to exhibit excellent EOP performance.64 In this study, the compressed microparticle electrodes were found to be robust enough to withstand laser micromachining and mechanical abrasion, and were able to produce dissolved ozone at a stable level for 20 h continuously. The novel conductive diamond electrode material proposed in this study has the advantage of potential high-volume production, which provides the possibility of EOP application in more areas. In addition, the application of free-standing perforated diamond electrodes is very promising for efficient EOP processes by pure water electrolysis, and further improvements in current efficiency can be achieved by fine-tuning the electrode configuration (including the number of holes, hole size, hole arrangement and electrode thickness) and optimizing the BDD boron/carbon ratio (Fig. 10c and d).93,94
In general, the relatively mature BDD electrode preparation process is still dominated by the use of HFCVD technology, which is subjected to harsh test conditions, and there is still much room for improvement regarding the consistency of the performance of the same batch of BDD electrodes produced. While BDD anodes have been used for a few years to produce O3 in electrolyte-free PEM water, this process requires high cell voltages and high energy consumption, which still limits its use in large scale industry. Therefore, the focus of future research should still be on the improvement of the performance of BDD electrodes and the reduction of operating costs.
3.3. Dimensionally stable anode (DSA) electrode-doped SnO2 catalysts
Ni and Sb co-doped tin oxide (Ni/Sb–SnO2) catalysts have been shown to be excellent active EOP catalysts, and these types of catalysts are capable of exhibiting significant EOP catalytic activity in acidic media. Chen et al. reported water oxidation to ozone in an acidic aqueous electrolyte using Ni–Sb–SnO2-coated titanium substrates with current efficiencies up to 36% at low current densities (≤40 mA cm−2).95,96 Afterwards, Christensen et al. measured Ni/Sb–SnO2 coatings corresponding to EOP current efficiencies of 50% at current densities up to 100 mA cm−2. Thus, Ni/Sb–SnO2 anodes are capable of operating at high EOP current efficiencies. Christensen and Zakaria et al. further found in their study that electrolysis of acidic electrolytes using Ni/Sb–SnO2 could result in EOP lifetimes of up to 600 h (current density: 100 mA cm−2, current efficiency: 50%), suggesting that this type of material has excellent EOP activity and durability in acidic media.97In recent years, researchers have deeply explored the corresponding EOP mechanisms of such catalysts by combining theoretical calculations. Ding et al. achieved a significant improvement in the EOP performance of the catalyst by adjusting the content of nickel active sites and oxygen vacancy defects on the surface of the Ni–Sb–SnO2 electrocatalyst (Fig. 11a).52 Theoretical calculations showed that the enrichment of Ni and oxygen vacancy defects on the surface of the material greatly improved the oxygen adsorption capacity and thus could promote O3 generation. Xue et al. constructed Ce–Ni–Sb–SnO2 multicomponent metal oxides by adding La-based metal Ce to Ni–Sb–SnO2 oxides (Fig. 11b).53 In an acidic medium, Ce–Ni–Sb–SnO2 exhibited excellent EOP activity and durability, which was attributed to the fact that the interactions between metal elements could effectively modulate their 3d orbital electronic structure and optimize the free energy of adsorption of oxygen-containing intermediates to achieve the enhanced EOP performance. In addition, Tang et al. found that the catalyst codoped with Ni and Gd (0.5Gd–0.5Ni–Sb–SnO2/Ti) increased ozone selectivity three times more than the catalyst doped with Ni alone (Ni–Sb–SnO2/Ti), further illustrating the potential of multi-element doped SnO2 materials for EOP applications (Fig. 11c).65
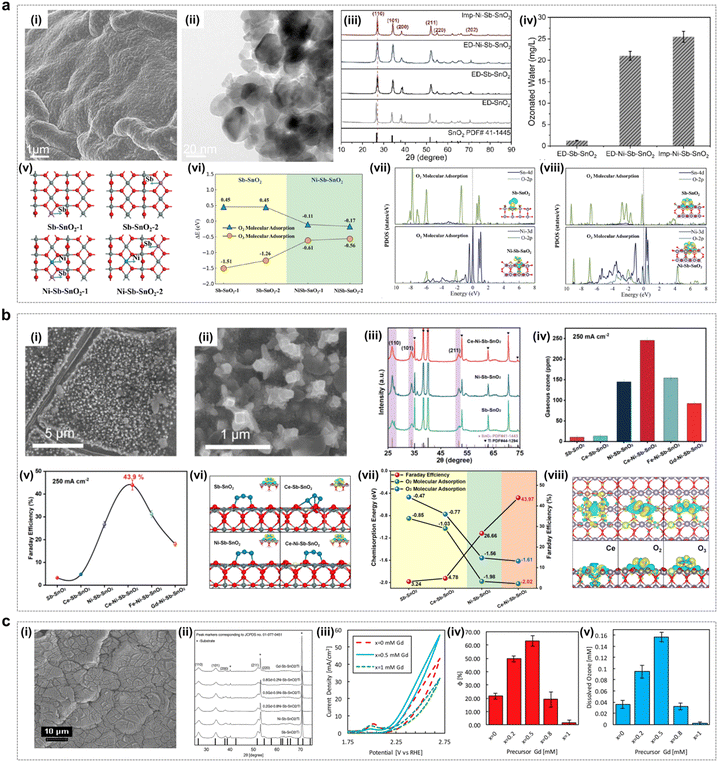 | ||
| Fig. 11 Doped SnO2 catalysts for the EOP process. (a) (i) and (ii) SEM and HRTEM images of Imp–Ni–Sb–SnO2. (iii) and (iv) XRD patterns and the ozonated water concentration of Imp–Ni–Sb–SnO2, ED–Ni–Sb–SnO2, ED–Sb–SnO2, and ED–SnO2 electrocatalysts. (v) and (vi) DFT-calculated structure and adsorption energy of Sb–SnO2-1, Sb–SnO2-2, Ni–Sb–SnO2-1, and Ni–Sb–SnO2-2. (vii) and (viii) Projected density of states (PDOS) and charge density differences for O2 (vii) and O3 (viii) adsorption on Sb–SnO2 and Ni–Sb–SnO2 surfaces. (Reprinted with permission from ref. 52. Copyright John Wiley and Sons 2024.) (b) (i) and (ii) SEM images of Ce–Ni–Sb–SnO2. (iii) XRD spectra of Ce–Ni–Sb–SnO2, Ni–Sb–SnO2, and Sb–SnO2. (iv) and (v) Gaseous ozone production and faradaic efficiency of the series of electrocatalysts. (vi) Geometric structures and charge density differences of O3 adsorbed on Sb–SnO2, Ce–Sb–SnO2, Ni–Sb–SnO2, and Ce–Ni–Sb–SnO2. (vii) Relationship between chemisorption energy of O2 and O3 and faradaic efficiency on the four surfaces. (viii) Charge density differences associated with Ce doping on Ce–Ni–Sb–SnO2; O2, and O3 adsorption on Ce–Ni–Sb–SnO2. (Reprinted with permission from ref. 53. Copyright Wiley 2023.) (c) (i) SEM image of the EOP electrocatalyst exhibiting a typical “cracked mud” morphology. (ii) XRD patterns of synthesized electrocatalyst thin films showing the cassiterite SnO2 bulk structure for all dopants. (iii) Representative cyclic voltammetry (CV) curves for Ni-only (x = 0), Gd-only (x = 1), and Ni–Gd (x = 0.5) samples. (iv) and (v) Faradaic efficiency of ozone production and concentration of dissolved ozone measured after 60 seconds at 2.7 V vs. RHE. (Reprinted with permission from ref. 65. Copyright John Wiley and Sons 2021.) | ||
Although Ni/Sb–SnO2 electrodes are increasingly being developed as a competitive alternative to other types of EOP catalysts, the electrodes still suffer from rapid deactivation at higher current densities, which still limits their large-scale application.97–101 In addition to the electrode deactivation factor, doped SnO2 catalysts are mainly used in acidic media in EOP processes. This limits the application scenarios and scope. In general, it is necessary for more ozone applications to be operated in a neutral system. Therefore, it is necessary to selectively apply the materials according to the different needs of the application scenarios.
3.4. Non-precious metal oxide catalysts
Non-noble metal oxide EOP catalysts have been extensively investigated owing to their advantages such as low cost, high stability and excellent EOP activity. These mainly include lead oxides and composite lead oxides doped with non-precious metal materials (e.g. PbBiOx) and other non-precious metal catalysts.To solve the dissolution problem of anodic β-PbO2 particles during the EOP process with a strong oxidative environment, Yan et al. successfully prepared a three-dimensional (3D) β-PbO2/Ta2O5 supported catalyst with a rod-like morphology, which was obtained by loading β-PbO2 particles on corrosion-resistant Ta2O5 nanorods (Fig. 12a). The catalyst was able to demonstrate significant EOP catalytic performance. Theoretical studies have shown that the synergistic interaction between β-PbO2 and Ta2O5 can modulate the electronic structure of the material and enhance oxygen adsorption, resulting in a lower activation energy required for EOP.54 Researchers usually improve the physicochemical properties of lead oxides through doping, loading and capping strategies to achieve their EOP activity and durability improvement. Amadelli and Andrade et al. found that doped lead oxide electrodes have excellent EOP performance, especially lead oxide electrodes doped with Fe3+ and F−, which have higher current efficiency.104,105 This conclusion was also confirmed by Velichenko et al. who found that low concentration Fe3+ doping can effectively inhibit the OER (where Fe3+ can replace Pb2+ or Pb4+ on the electrode surface). The experimental results showed that as the chemisorbed oxygen binding energy increases, the overpotential required for the oxygen precipitation process increases, thus favoring O3 generation.106,107 In addition, a superhydrophobic cubic Pb3O4@SiO2 has been synthesized by our group and used for EOP.108 The catalyst exhibited an encapsulated structure with a SiO2 layer of 50–100 nm thickness, as illustrated in Fig. 12b. Both experimental assessments and theoretical simulations demonstrated that the presence of Si–CH3 groups within the cubic-Pb3O4@SiO2 structure induces the formation of hydrophobic sites and establishes a hydrophobic–aerophilic microenvironment. This environment enhances the accumulation of oxygen at the electrode/electrolyte interface, thereby promoting ozone enrichment. Moreover, the Si–CH3-modified SiO2 capping layer mitigates the catalyst reconfiguration during EOP testing, allowing cubic-Pb3O4@SiO2 to maintain exceptional stability while preserving EOP activity. In addition, Shi et al. developed a Bi doped Pb–Bi bimetallic oxide (Bi12PbO20) that also shows excellent EOP activity and durability (Fig. 12c). It was shown that the restricted fragments (Pb–O4) were confined in a Bi–O bonding environment, and the low oxygen vacancy formation energy from the weak Pb–O covalent interactions significantly enhanced the EOP activity.46 This confined environment also plays a crucial role in inhibiting Pb loss and thus exhibits good EOP stability. Further optimization involved the construction of convex polyhedral Bi6PbnOx electrocatalysts, as depicted in Fig. 12d. The resulting micro-surface structure integrates unique microstructures and interfaces, leading to the exposure of more active sites and an accelerated electron transport rate during the EOP process. Density functional theory (DFT) calculations indicate that a high-index surface (443) exhibits superior EOP performance due to its lower oxygen vacancy formation energy.109
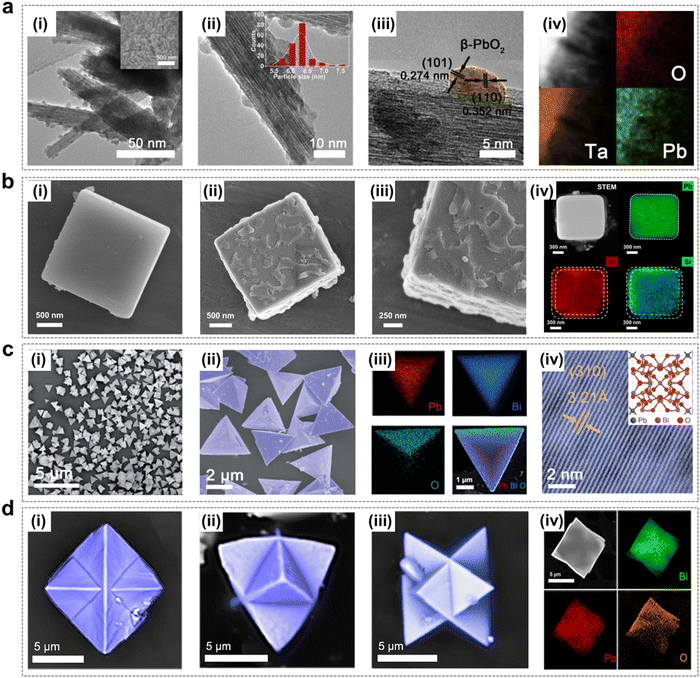 | ||
| Fig. 12 Lead-containing metal oxide catalysts using for the EOP process. (a) (i) and (ii) TEM and HRTEM images, (iii) and (iv) EDX elemental map of the β-PbO2/Ta2O5 NRs. Inset (i) SEM image of the β-PbO2/Ta2O5 NPs; Inset (ii) particle size distribution in the β-PbO2 NPs. (Reprinted with permission from ref. 54. Copyright Elsevier 2020.) (b) (i) SEM images of cubic-Pb3O4. (ii) and (iii) SEM images of cubic-Pb3O4@SiO2. (iv) STEM image of cubic-Pb3O4@SiO2 subjected to EDX maps and the EDX elemental maps of lead (green), oxygen (red), and silicon (blue). (Reprinted with permission from ref. 108. Copyright Elsevier 2023.) (c) (i) and (ii) SEM images of Bi12PbO20-3. (iii) Elemental map of Bi12PbO20-3. (iv) Scanning tunneling electron microscopy images of Bi12PbO20-3. Inset is the molecular structure of Bi12PbO20. (Reprinted with permission from ref. 46. Copyright Royal Society of Chemistry 2022.) (d) (i)–(iii) SEM images of Bi6Pb2Ox at different angles. (iv) HAADF image and the corresponding EDX elemental mapping. (Reprinted with permission from ref. 109. Copyright Elsevier 2023.) | ||
In general, the above lead-containing catalysts have the potential to replace commercial β-PbO2 and achieve stable operation for a certain period under industrial current densities. Nevertheless, the widespread application of such materials still faces several challenges. On the one hand, large-scale production of stable catalysts is challenging due to limitations in catalyst preparation methods. On the other hand, structural reconstruction of these catalysts still occurs during actual testing, which can affect their EOP performance to some extent. Therefore, future work could focus on further improving the stability of lead-based catalysts through structural design while reducing the lead content, thus accelerating the realization of an efficient and environmentally friendly EOP process.
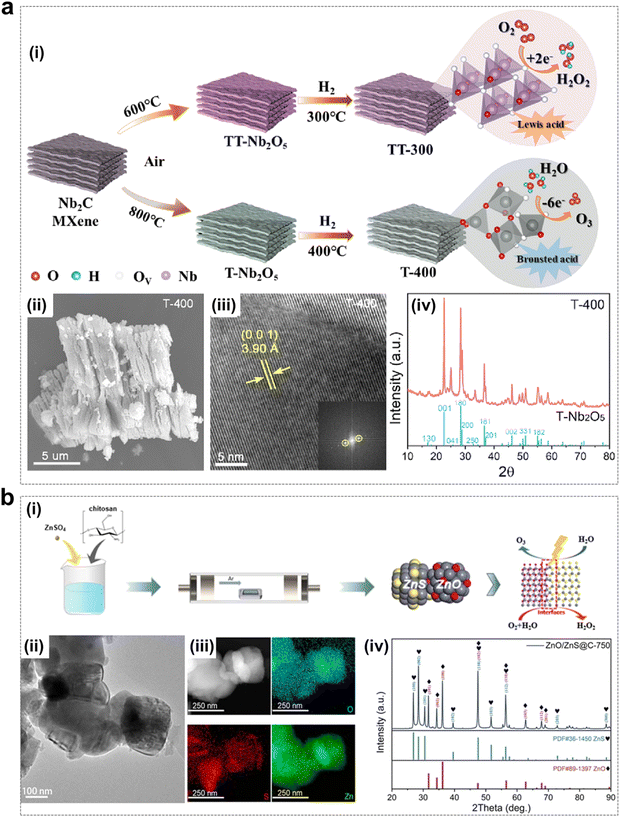 | ||
| Fig. 13 Non-lead metal oxide catalysts using for EOP process. (a) (i) Schematic of samples preparation. (ii)–(iv) SEM image, TEM image and XRD pattern of T-400 electrocatalyst. (Reprinted with permission from ref. 57. Copyright Elsevier 2023.) (b) (i) Schematic of preparation of ZnO/ZnS@C electrocatalyst. (ii) and (iii) TEM image and EDX elemental mapping of ZnO/ZnS@C-750. (iv) XRD pattern of ZnO/ZnS@C-750, ZnS and ZnO. (Reprinted with permission from ref. 56. Copyright Royal Society of Chemistry 2023.) | ||
The construction of heterojunctions is one of the effective strategies for the enhancement of electrocatalytic activity, as heterojunctions usually have better physical–chemical properties than single components. Various transition metals have been extensively studied for the formation of heterojunction strategies by combination with chromides, phosphides and oxides.111–113 As shown in Fig. 13b, Ding and colleagues synthesized a low-cost and highly active bifunctional heterojunction catalyst (ZnO/ZnS@C) by a one-step calcination method, which could achieve up to 90% selectivity for H2O2 and 11% Faraday efficiency corresponding to the EOP process. The main advantage of this bifunctionality is the acceleration of electron transfer at the interface.56
In addition, modulation of the local coordination environment at the active site of ABO3-type chalcogenide oxides by adjusting the hybridization of A and B elements and surface chemisorption are effective methods to improve their EOP properties.114–116 Herein, Zheng et al. explored ABO3-type chalcogenide oxides with excellent activity and stability by replacing the A-site with lanthanum, while Co was targeted as the B-site element owing to its high conductivity and weak d-electron binding.117,118 The results showed that the optimal PrCoO3 electrocatalyst exhibited significantly improved EOP activity and long-term durability during continuous operation.59 DFT calculations indicated that the excellent EOP activity of PrCoO3 was attributed to the strong interaction between Co and Pr, which effectively changed the d-band center of Co, resulting in the catalytic material demonstrating excellent EOP performance.
As shown in Fig. 14a, a series of β-PbO2 rod catalysts were synthesized by a surfactant-free hydrothermal method by Jiang et al.45 The β-PbO2 morphology was modulated and the crystalline facet ratio was varied by controlling the hydrothermal temperature. The test results showed that the β-PbO2-120 catalyst with the highest crystalline facet ratio (101) exhibited the most excellent EOP performance, which demonstrated the crystalline facet effect. In particular, with β-PbO2-120 as the anode, the ozone production at a current density of 1.00 A cm−2 could reach 422.1 mg h−1, which is more than 1.5 times that of the ozone production (288.0 mg h−1) of β-PbO2-CM (commercial), indicating that increasing the (101) crystalline facet ratio improves the EOP performance of the β-PbO2 catalyst. And at the same current density, the ozone generator with β-PbO2-120 as the anode has the lowest energy consumption. Meanwhile, the theoretical calculations also showed that the PbO2 (101) crystalline facets are more likely to generate O3 and have a crystalline effect.
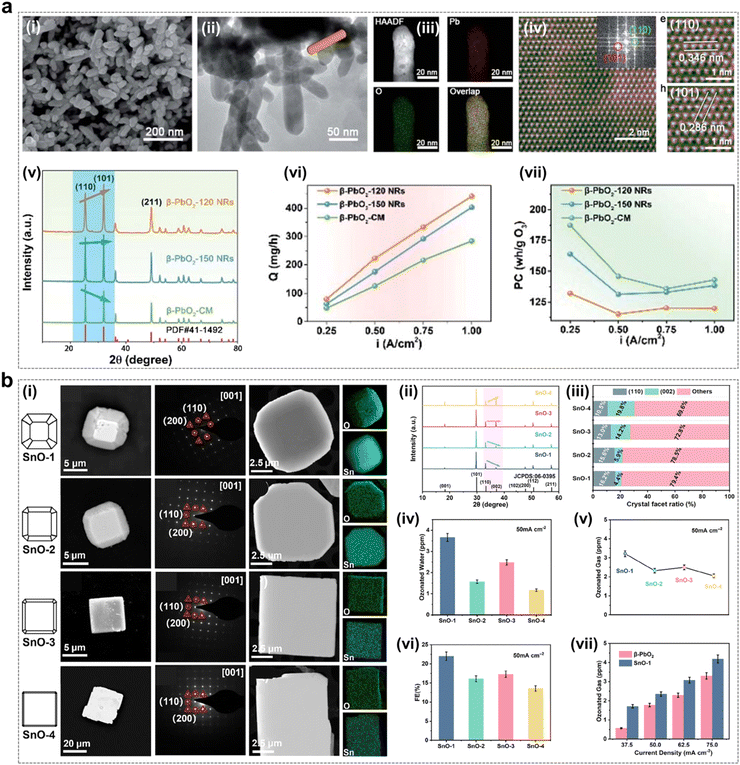 | ||
| Fig. 14 Facet effect of catalysts during the EOP process. (a) (i)–(iii) SEM, TEM, and EDX elemental map of β-PbO2-120 NRs, and (iv) colorized atomic-scale STEM image with the fast Fourier transform (FFT) pattern of the lattice image and an enlarged section. (v) XRD patterns of β-PbO2-120 NRs, β-PbO2-150 NRs, and β-PbO2-CM. (vi) and (vii) Ozone output and power consumption per unit ozone for the MEA electrolyzer using the three types of anodes electrocatalysts at a constant current density of 0.25–1.0 A cm−2. (Reprinted with permission from ref. 45. Copyright Royal Society of Chemistry 2021.) (b) (i) SEM image, HRTEM images and EDX elemental maps of SnO-n (n = 1, 2, 3, 4). (ii) XRD patterns of SnO-n (n = 1, 2, 3, 4) electrocatalysts. (iii) Crystal facet ratios of (110) and (002) facets as calculated from peak heights in XRD patterns. (iv) and (v) Ozonated water and gas concentrations of SnO-n (n = 1, 2, 3, 4) at 50 mA cm−2. (vi) FE of SnO-n (n = 1, 2, 3, 4) to produce O3 at 50 mA cm−2. (vii) Ozonated gas concentrations of SnO-1 and β-PbO2 at different current densities. (Reprinted with permission from ref. 58. Copyright John Wiley and Sons 2023.) | ||
Tin oxide is a versatile catalyst with wide applications in energy conversion and storage systems.123,124 As shown in Fig. 14b, tin oxide electrocatalysts with different (110) and (002) crystal facet ratios were synthesized by Wang et al. using a hydrothermal method.58 The experimental results showed that the catalyst materials with a high ratio of SnO (110) crystallite facets exhibited excellent performance in EOP. Theoretical calculations indicate that their excellent performance is attributed to the proper adsorption and desorption strength of O* and O2* on the SnO (110) crystal faces. In conclusion, exploiting the crystalline facet effect is a feasible way to achieve improved EOP performance of catalysts.
For both OER and EOP catalysts, water oxidation testing conditions are harsh. Therefore, during the reaction, most catalysts are adapted to the tested environment by changing their surface structure. It has been reported that most OER catalysts develop a more active surface structure by changing their surface structure during the reaction.125 The reasons for such changes can be attributed to the relatively unstable bulk phase chemistry of the catalyst material and the strong interaction between the oxygen-containing adsorbent on the surface of the material and the exposed surface during the reaction. The structural phase change of the catalyst is dependent on the potential applied during the OER process,30,126 and the potential difference drives the precatalyst to undergo surface oxidation/reduction, resulting in reconstruction to a new surface structure.127,128 Although the OER process is relatively well understood, there is a lack of investigation and understanding of the structural stability of EOP catalysts during the reaction process, which is crucial for understanding the EOP process and designing efficient catalysts.
Our group has systematically investigated the structural changes that occur in lead oxides during the EOP process and their effects on EOP performance. As shown in Fig. 15a–c, the XRD and HRTEM characterization results indicate that Pb3O4 gradually undergoes a complete transformation into β-PbO2 by phase change during the EOP process, and the reconstructed β-PbO2 has a more stable active crystalline surface area ratio ((101) and (110) surfaces). The results of the XAFS analyses show that the reconstructed β-PbO2 has a lower coordination Pb–O structure (Fig. 15d–f). The reconstruction of the catalyst enabled Pb3O4, used as a precatalyst, to demonstrate significantly enhanced EOP activity and reaction stability compared to commercial β-PbO2, as shown in Fig. 15g. Based on these findings, we introduce the concept of 'phase shuttling' within the EOP process. As illustrated in Fig. 15h, an external electric field facilitates the diffusion of lattice oxygen on the surface of Pb3O4, subsequently generating a more stable β-PbO2 phase—this is the phase shuttling mechanism. The weak covalent interaction of the Pb–O bond is the primary driver of phase shuttling in Pb3O4. The β-PbO2 phase obtained through Pb3O4 reconstruction exhibited outstanding EOP activity and stability during long-term EOP testing, which is attributed to its low Pb–O bond coordination structure and the stable presence of β-PbO2 (101) and β-PbO2 (110) active surfaces. This study presents a novel approach to designing high-performance EOP catalysts with potential industrial applications.
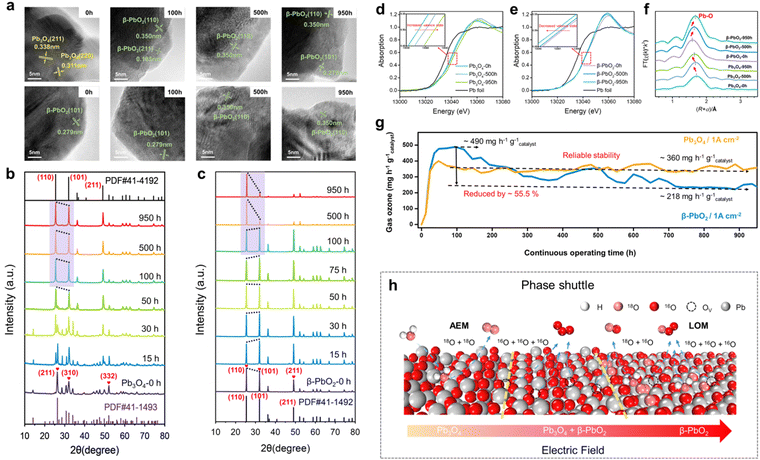 | ||
| Fig. 15 Catalyst reconstruction effect during the EOP process. (a)–(c) HRTEM images and ex situ XRD patterns of Pb3O4 and β-PbO2 during EOP testing under 1 A cm−2 current density operating conditions. (d)–(f) XAFS analysis, including the XANES Pb L3-edge spectra (d) and (e) and Pb L3-edge curve fits (lines) shown in R-space (f) of Pb3O4 and β-PbO2 during EOP testing at a current density of 1 A cm−2. (g) Comparison of EOP performances of Pb3O4 and β-PbO2 for more than 900 h at a constant current of 1 A cm−2. (h) Schematic illustration of the phase shuttle of Pb3O4 by the applied electric field.17 | ||
4. Evaluation approach of EOP catalysts
The key to successfully identifying the optimal catalyst lies in establishing an effective metric to quantitatively assess the activity and stability of a given catalyst. Herein, we summarize the key evaluation parameters for determining the EOP performance of a catalyst in order to perform a rational standardized test of EOP catalysts to guide the screening of high-performance EOP catalysts, where the test electrolyte discussed is neutral.4.1. Onset/overpotential
The most important factor in evaluating the performance of EOP catalysts is their onset potential, and since the OER is a competing reaction process for EOP, attention needs to be paid to the ability of the catalyst to exhibit a high anodic overpotential. The exact value of the onset potential is difficult to observe, so the value of the potential at a current density of 10 mA cm−2 (Ej=10) is more often used to compare the reaction overpotentials of catalysts.15,54 The overpotential is the potential difference between the potential at which a specific current density occurs and 1.51 V vs. SHE, and is usually measured in mV. In general, catalysts with higher overpotentials will have superior EOP activity, although this needs to be confirmed in relation to other evaluation parameters.4.2. Tafel slope
Tafel slope tests are widely used to investigate the EOP kinetics and mechanisms, as well as to evaluate the activity of different catalysts. Generally, the EOP process tends to show a two-step Tafel slope, where the reaction process is dominated by the OER at low current densities, and the EOP process occurs gradually as the current density increases.135 An inflection point in the Tafel slope implies a variation in the kinetics of water oxidation, which could be due to structural reconstruction of the electrode surface/interface structure under different potential conditions.17,108 Therefore, accurate analysis of the Tafel slope test results is essential for a thorough understanding of the overall reaction process.4.3. Electrochemical impedance spectrum (EIS)
Typically, the charge transfer resistance during EOP is measured by electrochemical impedance spectroscopy (EIS), which is also a method for assessing the electrocatalytic activity of materials. In general, the higher the catalytic charge transfer capability, the smaller the diameter of the kinetic semicircle of the catalyst detected by EIS.27,54 This means that when the lowest contact resistance (Rct) is shown in the EIS diagram, it indicates that the catalyst is favourable for promoting charge transfer during the EOP process, which in turn reduces the reaction energy barrier and promotes the reaction.4.4. O3 concentration measurement
Gaseous ozone concentration can be measured quantitatively with an ozone detector. A 2B Technologies Model 106-L ozone detector is typically used for low concentration (ppb) measurements. High ozone concentrations (g m−3) are usually measured using an ozone analyzer (UVIZ-1200) during operation of the EOP electrolyzer at high test current densities.17,45Typically, the iodometric method is employed for the quantification of dissolved ozone concentrations in water.48,54 Following the EOP test, the ozonated water is measured quantitatively in a conical flask, to which a starch indicator solution (2% by weight) and an excess of KI solution (2% by weight) are added. The mixture is stirred until a blue coloration develops. The concentration of dissolved ozone is then calculated through titration with a Na2S2O3 standard solution (0.4 mmol L−1) until the mixture becomes colorless. The calculation follows the formula 2n(Na2S2O3) = n(O3), where n represents the molar quantity of the substance. Alternatively, the semi-quantitative DPD method can be utilized to determine dissolved ozone concentrations.15,55 In this method, 2 mg of ozone detection powder is added to 15 mL of the post-test electrolyte and left to stand at room temperature for 30 seconds. The ozone content is then assessed semi-quantitatively by comparing the solution's color against a standard chart.
4.5. Faraday efficiency
The ozone concentration in the gas phase (g m−3) is typically measured using an ozone analyzer (UVIZ-1200), while the gaseous ozone flow rate (L min−1) is determined using a soap film flowmeter during the operation of the EOP electrolyzer. These measurements enable the calculation of the ozone production rate (Q, kg h−1), which is subsequently used to determine the faradaic efficiency (FE, %) under different constant current densities. The FE (%) for gaseous ozone evolution can be calculated using the following equation:17,45,47Where “M” represents the molecular weight of O3 (48 g mol−1), “I” denotes the applied current (A), “F” is Faraday's constant (9.6485 × 10⁴ C mol−1) and “Q” is the ozone production rate (kg h−1). This formula is also applicable for calculating FE (%) in a three-electrode test system.
4.6. Stability
Stability is another key parameter which is important for the evaluation of EOP catalysts for potential practical applications. To assess the stability of EOP catalysts, two electrocatalytic methods, constant current and constant potential electrolysis methods, are commonly used. The constant current (or constant potential) technique involves monitoring the variation in potential (or current density) of an electrocatalyst over time at a fixed current density (or overpotential).15,54 The current density applied in a three-electrode test system should be at least 10 mA cm−2. Industrial current densities (≥1 A cm−2) are usually set in EOP electrolysers. The longer the time without a change in potential (or current) during the test, the better the stability of the catalyst.5. Advances in the electrochemical ozone production (EOP) electrolyzer
5.1. Structural components of EOP electrolyzers
Ozone production by large-scale electrolysis of water is usually achieved using an electrolyzer unit and a reactor stack, so understanding the structural components of the electrolysis reactor is necessary to understand the process of electrolytic water generation and to achieve excellent EOP performance.136,137 For ozone production by water electrolysis, a PEM electrolyzer typically consists of membranes, an electrode material (catalyst layer), a gas diffusion/porous transport layer, bipolar plates and end plates (Fig. 18a).22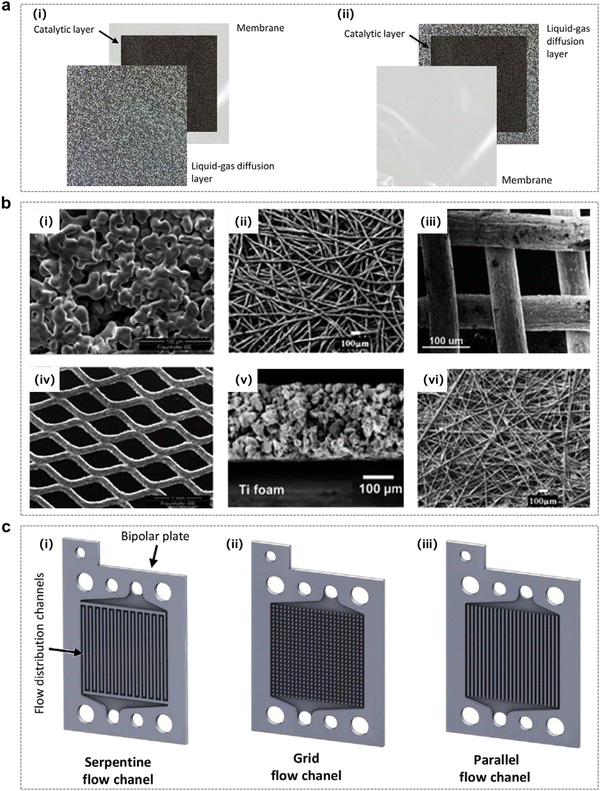 | ||
| Fig. 16 Fabrication methods of catalytic layers. (a) (i) and (ii) Schematic diagrams of the membrane electrode assembly (MEA) with the catalytic layer deposited on the membrane and the gas diffusion layer (GDL).138 (b) SEM images of typical materials used for GDLs: (i) sintered titanium powder, (ii) titanium felt, (iii) titanium mesh, (iv) expanded titanium mesh, (v) cross-sectional view of single-layered titanium GDL fabricated via freeze-casting, and (vi) carbon paper. (Reprinted with permission from ref. 139. Copyright Royal Society of Chemistry 2022.) (c) Bipolar plates and flow distribution channels in a PEM electrolyzer: (i) serpentine, (ii) grid, and (iii) parallel configurations.138 | ||
5.1.1.1. Electrode materials (catalyst layer). The main function of the electrode is to facilitate the contact of the electrolyte with the reaction sites. This requires facilitating the conduction of electrons and protons, the removal of gaseous products from the reaction and the access of water to the catalytic site. The electrocatalytic function depends on the catalyst materials used, which usually include carbon materials, metals and metal oxides. The slow kinetics of OER/EOP require highly active catalysts to facilitate O2/O3 formation, and the selection of electrode materials with the high oxidation potential is necessary to improve the efficiency of EOP production.
5.1.1.2. Proton exchange membrane (PEM). In a PEM electrolyzer, the membrane is a critical component, significantly influencing both the purity of the generated gas and the system's durability. Perfluorosulfonate (PFSA) polymer membranes, such as Nafion, Fumapem, Flemion, Aquivion, and Aciplex, are commonly employed in PEM cells. These membranes are well-suited as solid electrolytes due to their exceptional thermal and chemical stability, robust mechanical strength, and high proton conductivity. Among these, Nafion membranes (e.g., Nafion 115, 117, and 212) are the most extensively used in PEM electrolysis.140 However, these membranes have several limitations, including high cost, the presence of fluoride in the polymer structure (which can lead to pitting corrosion of metal components in the electrolyzer), increased thickness (resulting in higher ohmic resistance and reduced performance at high current densities), and potential degradation of mechanical properties at elevated temperatures.141 Some researchers are currently developing modified Nafion membranes to improve their thermal properties, including polybenzimidazole, polyetheretherketone and sulphonated polyphenylquinoxaline.
Moreover, metals with specific coatings are often employed as the BPP because of the need for corrosion resistant and highly conductive materials. The most popular material remains Pt-coated titanium with a Pt surface to prevent the formation of titanium dioxide, which makes the cost of BPP components almost half of the total cost of the electrolyzer.142 Although it is not easy to find a material that performs as well as Ti/Pt in terms of conductivity and durability at a lower cost, researchers have also been actively exploring Ti/Pt alternatives in recent years.145
5.2. Factors affecting EOP electrolyzer performance
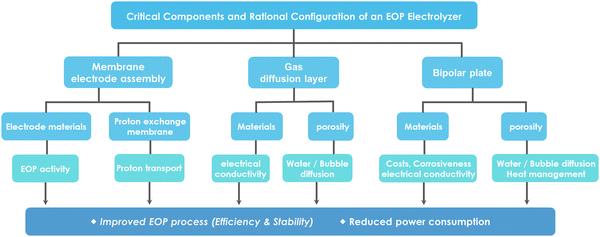 | ||
| Fig. 17 Critical components and rational configuration of an EOP electrolyzer for improved EOP process (efficiency and stability) and reduced power consumption. | ||
In terms of catalysts, both catalyst activity and stability are equally critical to the EOP performance. The progress made in EOP catalyst research has been discussed in detail in Section 4.
From the perspective of electrode reaction interfaces, the precise engineering of the two key interfaces—the proton exchange membrane/catalyst layer (PEM/CL) interface and the gas diffusion layer/catalyst layer (GDL/CL) interface—in EOP electrolyzers is critical for optimizing overall performance. The PEM/CL interface must maintain strong adhesion during operation; otherwise, delamination of the CL can lead to electrolyzer failure.146–148 The three-phase interface of the gas diffusion electrode serves as the primary site for electrochemical reactions, and its structure, composition, and surface properties are pivotal in determining EOP performance. The GDL/CL interface, along with the porous structure of the GDL, plays a significant role in guiding bubble evolution and the transport pathways during the EOP process. Gas diffusion electrodes with specific pore size distributions and wettability exhibit preferential oxygen channels, independent of the water flow rate, operating current density, and pressure.149,150 The generation of gas bubbles introduces complex effects on EOP performance, including activation losses, ohmic losses, and mass transfer losses. Activation losses arise from gas bubbles adhering to the electrocatalytic surface, thereby reducing the active surface area. Ohmic losses occur when ion transport channels in the electrolyte are obstructed by bubbles. Additionally, bubbles adhering to the CL surface cause an uneven distribution of current density, which negatively impacts charge transfer.151,152 Bubble evolution also decreases the concentration of dissolved gases near the catalytic active sites, resulting in mass transfer losses. Furthermore, convection induced by bubble diffusion can reduce the concentration gradient of dissolved oxygen. Therefore, a thorough investigation of bubble evolution and two-phase transport kinetics is essential, especially considering that in the EOP process, the high rate of bubble formation and the insufficient removal of bubbles due to buoyancy lead to mass transfer losses and overall performance degradation of the electrolyzer.
In addition, as a multi-functional component in the PEM electrolyzer, the BPP has flow field channels that can both ensure that water can be uniformly transported to the MEA interface for rapid removal of gaseous products generated by the reaction and provide mechanical support, as well as achieve smooth electron conduction in the electrolyzer and good heat transfer process through its flow channel paths.138,140,153,154
As shown in Fig. 18c, Georgia F. Wood et al. designed a 3D printed electrolyzer with perforated electrodes made by laser micromachining, which can achieve good water–gas separation during the EOP process.64 Furthermore, the EOP process particularly requires a good systematic heat transfer process to ensure that the ozone is not destroyed by high temperature conditions, in order to achieve stable ozone production. Our group designed a point-flow channel electrolyzer (Fig. 18e) and a parallel flow channel electrolyzer (Fig. 18f), respectively, and the test results showed that the parallel flow channel is more favourable to achieve efficient mass transfer of gaseous products (O2 + O3) and effective heat dissipation in the system.47 Therefore, it is important to enhance the mass and heat transfer in the EOP electrolyzer by optimizing the design and fabrication of the BPP flow field.
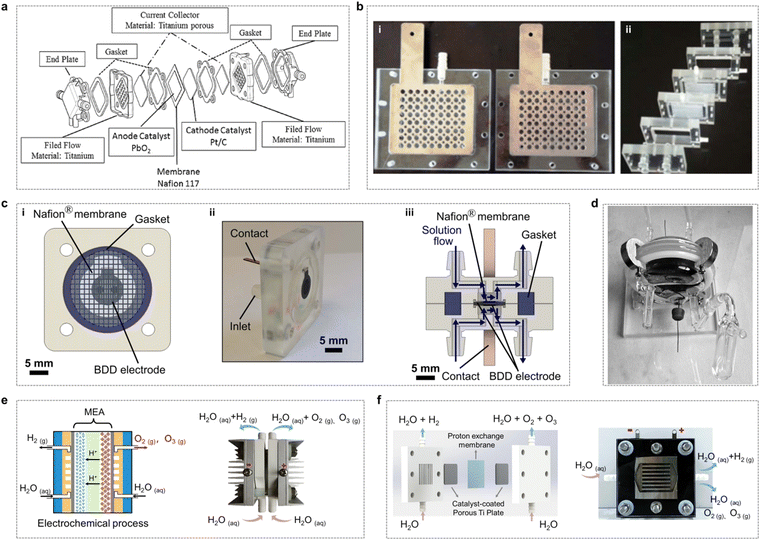 | ||
| Fig. 18 Different electrolyzers used for the EOP process. (a) Structure composition of the EOP electrolyzer. (Reprinted with permission from ref. 22. Copyright Elsevier 2018.) (b) Perforated planar electrodes used to generate ozone in the electrochemical reactors. (Reprinted with permission from ref. 155. Copyright Springer Nature 2009.) (c) Glass PEM electrolyzer for ozone production. (Reprinted with permission from ref. 64. Copyright IOP Publishing 2021.) (d) The 3D printed EOP electrolyzer. (i) Front view of the half-cell, (ii) actual view of the half-cell, and (iii) assembled cell section. (Reprinted with permission from ref. 156. Copyright Taylor & Francis 2009.) (e) Scheme of the MEA electrolyzer and physical picture of the electrolyzer. (f) Schematic diagram of the structure and working principle of the parallel flow field EOP electrolyzer and the real-life image of the electrolyzer. (Reprinted with permission from ref. 47. Copyright Elsevier 2024.) | ||
The Boodts group developed an electrochemical reactor for oxygen/ozone production, utilizing perforated planar electrodes, as illustrated in Fig. 18b.155 In this design, an electroformed β-PbO2 coating, deposited on a titanium-plated substrate, was employed as the anode, while the titanium-plated substrate itself functioned as the cathode. The study examined the effects of current density, temperature, and electrolyte composition on the EOP performance. The findings indicated that both the ozone current efficiency and the ozone production rate increased with a decrease in electrolyte temperature and an increase in current density.
As shown in Fig. 18d, Dyson et al. designed a glass electrolyser consisting of two Pyrex glass halves of elliptical cross-section separated by a Nafion 117 membrane, with each half of the cell having a volume of approximately 100 cm3. Electrochemical test results showed that increasing the electrolyte flow rate entrapped more ozone in the aqueous phase, while reducing ozone in the gaseous phase.156 It also appears that the current efficiency is reduced by the presence of ozone in the dissolution solution entering the electrochemical cell.
Furthermore, Hayashi et al. investigated the effect of pH on ozone production and showed that higher ozone concentrations could be achieved with sulfuric acid compared to Na2SO4, NaHCO3 and phosphate buffers.69 Regarding the type of acidic medium, Rahmani et al. investigated ozone production using different acids and found that the use of HClO4 had a higher potential compared to H2SO4, which improved the efficiency of ozone production.162 Overall, it was found that using acidic pH was preferable to using neutral or alkaline pH, as the process was able to achieve higher ozone concentrations and better stability. However, from the environmental point of view, neutral media are more suitable for large-scale EOP applications.
In recent years, Rodrigo and Reyna et al. have focused more on improving EOP performance by optimizing operating parameters, i.e., by setting the best conditions for the EOP electrolyser to perform optimally. Commercial EOP electrolysers, including CabECO®, CONDIAPURE® and Microzon®, were commonly used in their studies.160,163–165 It was further demonstrated that operational parameters such as temperature and electrolyte composition are crucial for enhancing the solubility and stability of dissolved ozone. Additionally, pressure plays a significant role in the overall yield, as it increases the solubility of oxygen and approximately doubles the ozone concentration.
6. EOP applications
Ozone has a wide range of applications owing to its strong oxidizing properties. These include food processing, air and water treatment, health care, aquaculture and the textile industry.166 The use of ozone in food processing results in safer food, with lower levels of bacteria and longer shelf life.167 When used in air treatment, ozone can improve the quality of the air and clean the air of harmful gases, odors and bacteria in order to meet technical and hygienic requirements.168 Ozone is highly effective in water treatment applications, often serving as a superior alternative to traditional disinfectants such as chlorine (Cl2), chlorine dioxide (ClO2), potassium permanganate (KMnO4), ultraviolet light (UV), hydrogen peroxide (H2O2), and oxygen (O2). Beyond water treatment, ozone is extensively used in the healthcare sector, where it plays a crucial role in sterilizing and disinfecting medical equipment and surgical instruments that come into contact with patient tissues, mucous membranes, or skin, thereby preventing infection and the transmission of pathogens.169,170 Furthermore, the use of ozone in aquaculture improves water quality, pathogen reduction and water treatment system efficiency. In the textile industry, ozone can also be applied in various ways to different fiber types to bleach fabrics and remove stains. This review focuses on ozone applications in disinfection, sterilisation and water treatment from the point of view of scale of application and future prospects.6.1. Sterilization and disinfection
Since the global coronavirus pandemic in late 2009, ozone has further demonstrated its advantages in sterilisation and disinfection. It is generally accepted that ozone can achieve viral inactivation by diffusion through the protein envelope to the nucleic acid core, destruction of viral RNA and disruption of the outer protein layer by oxidation.171 Because of ozone's direct oxidative capacity, pathogens cannot become immune to ozone as they are eliminated, as they become immune to other chemical disinfectants and germicides, greatly reducing the risk of resistance and making it a very beneficial form of germicidal disinfection. The most common method of pathogen reduction using ozone is to dissolve ozone gas in water.162,172,173 Water-based ozone is relatively stable, safe and easy to administer. Ozone is usually dissolved in water using an ozone injection system and then sprayed onto the surface to be disinfected. Such surfaces can be hard equipment surfaces or food surfaces. It is also possible to use gaseous ozone to kill pathogens. The effectiveness of gaseous ozone application depends on the operating temperature, humidity, contact time and ozone concentration.174,175 The ability of gaseous ozone to reduce and inactivate pathogens has been demonstrated in the literature. However, as the reaction rates of ozone gas can vary depending on these factors, such applications usually require stricter control of room temperature and humidity.Wang et al. investigated the potential of ozonated water as a disinfectant to eliminate environmental contamination by SARS-CoV-2. The experimental setup, depicted in Fig. 19a (i), involved mixing a virus solution with ozonated water and incubating it for varying durations (0, 1, 5, or 10 min).176 The results demonstrated that no viral genomic RNA or viral plaques were detected after just 1 minute of treatment with ozonated water (Fig. 19a(ii–iii)), indicating the effectiveness of ozonated water in inactivating SARS-CoV-2 within this timeframe. The study also identified the minimum concentration of ozonated water required for complete inactivation of the virus, finding that even at a concentration as low as 18 mg L−1, SARS-CoV-2 could be fully inactivated within 1 minute (Fig. 19a(iv)). In a related study, our research group utilized ozonated water generated from an EOP electrolyzer, with Pb3O4 as the anode catalyst, to inactivate SARS-CoV-2 (Fig. 19b(i)).17 The concentration of ozonated water reached its peak after 40 minutes of ozonated gas infusion into a saline solution, maintaining stability at approximately 2.12 mg L−1 for 60 minutes (Fig. 19b(ii)). The results showed that more than 99.99% of the virus was inactivated after just 30 s of treatment, with 100% inactivation achieved by extending the contact time to 5 minutes (Fig. 19b(iii)). Furthermore, microscopic analysis (Fig. 19b(iv)) of Vero cells treated with ozonated water compared to untreated infected cells clearly demonstrated the excellent inactivation effect of ozonated water on SARS-CoV-2. Thus, the disinfection method outlined in this research offers a highly effective solution for mitigating the spread of SARS-CoV-2.
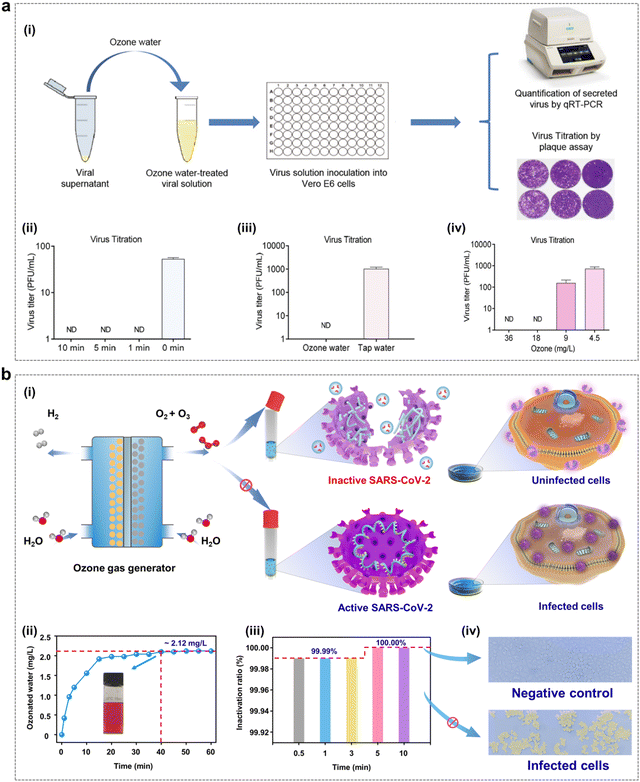 | ||
| Fig. 19 Sterilization through the EOP process. (a) (i) Schematic of the experiment evaluating the inactivation of SARS-CoV-2 using ozonated water. (ii) Contact time required for the inactivation of SARS-CoV-2 by ozonated water. (iii) Disinfection efficacy of ozonated water. (iv) Ozone concentration necessary for the inactivation of SARS-CoV-2 by ozonated water. (Reprinted with permission from ref. 176. Copyright Springer Nature 2021.) (b) Inactivation of SARS-CoV-2 using ozonated water. (i) Schematic diagram of the inactivation procedure. (ii) Concentration of ozonated water in 15 mL of normal saline under standard temperature and pressure conditions (inset: qualitative analysis of the ozonated water concentration). (iii) Inactivation ratio of SARS-CoV-2 by ozonated water. (iv) Microscopy images comparing negative control cells and SARS-CoV-2 infected cells.17 | ||
The widespread use of chlorine-based disinfectants in drinking water treatment has led to the emergence of chlorine-resistant bacteria (CRB), which pose a significant public health risk. In a study by Wang et al., the inactivation effects of ozone on seven strains of chlorine-resistant bacteria and spores were investigated (Fig. 20a).177 The findings demonstrated that ozone disinfection effectively disrupted both the cell structure and genetic material of chlorine-resistant spores, indicating that ozone is a promising method for inactivating chlorine-resistant bacteria and spores in drinking water. Additionally, Rahimi and colleagues developed a fully integrated system that combines gaseous ozone with antibiotics for topical adjuvant therapy (Fig. 20b(i)). The system involves applying a patch directly to the wound site (Fig. 20b(ii)), where biodegradable polymer fibers disintegrate upon contact with the wound, releasing the antibiotic locally (Fig. 20b(iii)).178 Simultaneously, gaseous ozone from a portable external ozone generator is delivered through the patch to the wound surface, providing additional antimicrobial action and enhancing the antibiotic's effectiveness by increasing diffusion across the oxidized bacterial membrane (Fig. 20b(iv)). Once the wound has healed, the patch can be easily removed (Fig. 20b(v)). This combination of ozone and antibiotic therapy holds significant potential for accelerating healing by effectively treating antibiotic-resistant infections and preventing the development of new infections.
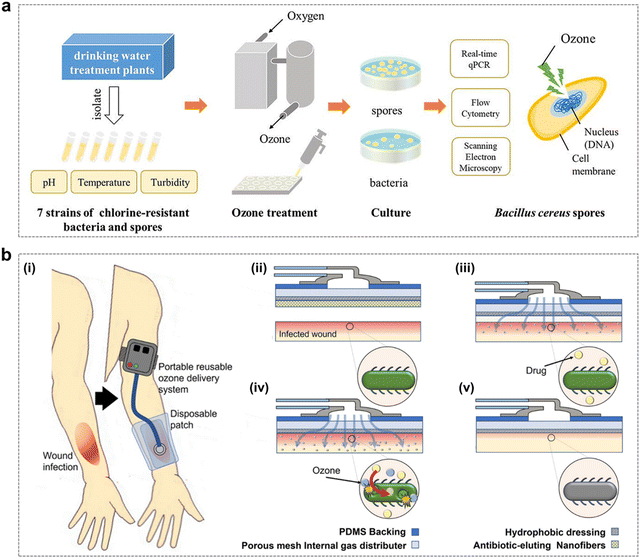 | ||
| Fig. 20 Disinfection through the EOP process. (a) Schematic illustration of research on the effectiveness of ozone disinfection in inactivating seven strains of chlorine-resistant bacteria and spores isolated from drinking water. (Reprinted with permission from ref. 177. Copyright Elsevier 2019.) (b) Wearable adjunctive ozone and topical antibiotic therapy system. (i) Adjuvant ozone and antibiotic therapy as an alternative treatment for skin and soft tissue infections resistant to conventional therapies. The process includes: (ii) application of an integrated wound patch composed of a drug-eluting nanofiber mesh (NFM) and a breathable membrane to the skin wound. (iii) Dissolution of NFs and release of topical antibiotics. (iv) Continuous ozone application during the treatment period, with combined action of ozone and antibiotics to eradicate infection as the antibiotic is fully released from NFs. (v) Removal of the wound patch once healing is achieved. (Reprinted with permission from ref. 178. Copyright Springer Nature 2022.) | ||
6.2. Wastewater treatment
Efficient green treatment technologies for wastewater purification are crucial for the protection of water resources.179,180 Among these, EOP technology is recognized as one of the most effective green methods for water pollution remediation. In the process of wastewater treatment, wastewater treatment plants usually use a variety of water purification methods to achieve the desired purification effect, including precipitation and filtration, advanced oxidation process, adsorption and reverse osmosis (Fig. 21a). Of all the methods applied, the advanced oxidation process is very important as it is the primary means of destroying pathogens, micro-organisms and organic contaminants to prevent water-borne diseases and contamination, thereby protecting public health and the environment.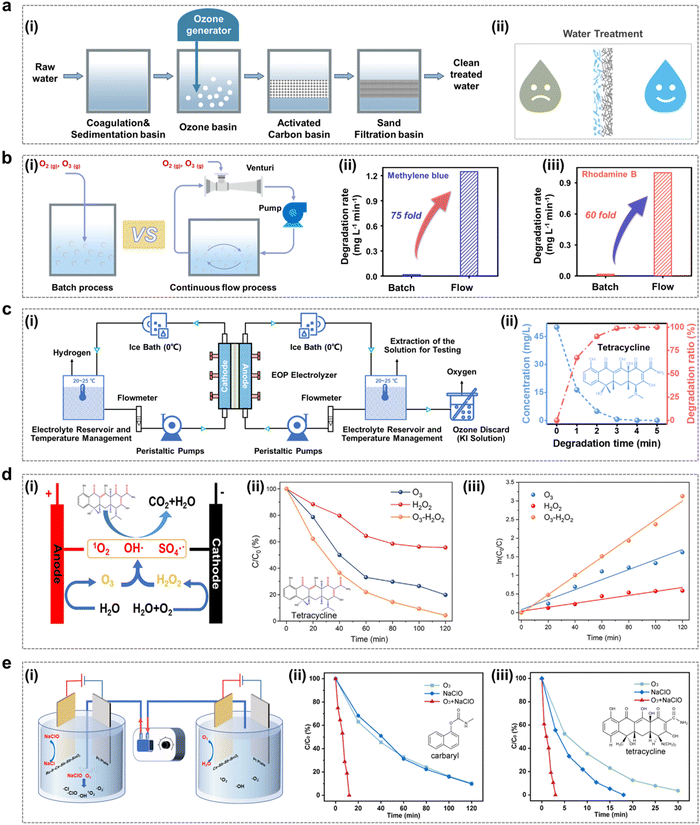 | ||
| Fig. 21 Wastewater purification through the EOP process. (a) Schematic flow diagram illustrating the wastewater treatment process using an ozone generator. (b) (i) Schematic representation of degradation processes in both batch and continuous flow systems. (ii) and (iii) Comparative efficiency analysis of methylene blue (ii) and rhodamine B (iii) degradation in batch versus flow systems. (Reprinted with permission from ref. 108. Copyright Elsevier 2023.) (c) (i) Schematic diagram of the experimental setup for in situ degradation of organic pollutants utilizing a visualized parallel flow field EOP electrolyzer. (ii) In situ electrochemical degradation performance of tetracycline. (Reprinted with permission from ref. 47. Copyright Elsevier 2023.) (d) (i) Schematic depiction of a bifunctional electrolyzer integrating EOP with the 2e− ORR. (ii) Degradation profiles of tetracycline using the obtained samples under O3, H2O2, and combined O3-H2O2 conditions. (iii) Pseudo-first-order kinetic analysis of tetracycline degradation under O3, H2O2, and O3-H2O2 systems. (Reprinted with permission from ref. 109. Copyright Elsevier 2023.) (e) (i) Schematic of the electrochemical synergistic degradation involving O3 and NaClO. (ii) Removal efficiency of carbaryl. (iii) Removal efficiency of tetracycline. (Reprinted with permission from ref. 53. Copyright Wiley 2024.) | ||
As illustrated in Fig. 21b, our research group discovered that the gaseous ozone produced by an EOP electrolyzer, when combined with a continuous flow process, enables highly efficient degradation of dyes.108 The results indicated that, compared to the batch flow degradation process, the continuous flow design provides an effective gas–liquid mixing mechanism. This mechanism enhances the uniform distribution and dissolution of gaseous ozone in the water, leading to a significant improvement in mass transfer and degradation rates while minimizing unnecessary concentration polarization. In addition, it has been shown that efficient in situ degradation of typical antibiotics can also be achieved with an ozone generator, with tetracycline at an initial concentration of 50 ppm being completely degraded within 5 min (Fig. 21c).47 In recent years, researchers have found that synergistic degradation of O3 with H2O2 or O3 with NaClO can be achieved by electrocatalysis. As shown in Fig. 21d, Shi and colleagues found that the degradation efficiencies of tetracycline in 120 min were 41.8% and 78.3% for the pure H2O2 and pure O3 systems, respectively.109 Moreover, the electrochemical degradation efficiency of the O3-H2O2 system was notably higher, achieving 98.1% degradation of tetracycline within 120 min of electrolysis. Additionally, Xue et al. observed that during the degradation process using O3 or NaClO alone, approximately 90% of carbaryl was degraded within 2 h. When O3 and NaClO were used simultaneously, carbaryl was completely degraded within 12 min, with a significant increase in the degradation rate (Fig. 21e(i–ii)).53 When O3 was used alone, the degradation rate of carbaryl was 96.4% within 30 min, whereas when NaClO was used only, carbaryl was completely degraded within 18 min. However, when O3 and NaClO were used simultaneously, tetracycline was completely degraded in only 3 min (Fig. 21e(iii)).
7. Conclusion and future perspectives
7.1. Conclusion
In this paper, we review the theoretical basis and the experimental progress of the electrochemical ozone production (EOP). Intensive research on the subject in recent years has greatly deepened our understanding of the EOP mechanism, which provides useful guidance for the design of catalysts with good EOP performance. Meanwhile, the EOP performance testing methods for catalysts are systematically summarized. The comparison of catalyst EOP performance using methods under standardized conditions is beneficial to both the optimization of existing systems and the evaluation of the feasibility of newly developed electrocatalysts. In addition, the demand for efficient EOP catalysts has stimulated a large number of research efforts devoted to the development of low-cost EOP catalysts with both activity and stability, including the rational control of the nanocatalyst structure and its reactivity by exploiting the size effect, the facet effect and the reconstruction effect. Based on these advances, researchers have increasingly focused on the practical applications of EOP. Significant progress has been made, including the rational design and assembly of EOP electrolyzers, as well as the expansion of EOP application scenarios and improvement of application effects (Fig. 22).7.2. Looking ahead
It is worth noting that several challenges remain in basic and applied research related to EOP, which need to be carefully addressed in the future.Firstly, although DFT calculations have been employed to predict the active sites of reaction intermediates and catalysts as well as to design efficient EOP catalysts, these theoretical models often fall short of accurately representing real catalytic conditions. A comprehensive understanding of the EOP mechanism is crucial not only for advancing scientific knowledge but also for guiding the development of high-performance catalysts. In fact, researchers have now begun to explore the EOP mechanism under real reaction conditions such as electric field and specific pH conditions, which has greatly contributed to the development of catalysts for EOP applications. Unfortunately, for most of the currently developed catalysts, particularly composite catalysts, there is a lack of in-depth, intensive and systematic mechanistic studies at the atomic scale.
Secondly, it is necessary to establish standardized test methods to compare the EOP performance of catalysts from different research groups. It is difficult to accurately compare and evaluate the performance of different materials due to differences in catalyst mass loadings, catalyst supports, working electrode preparation methods, reaction conditions and FE calculation methods. Therefore, in future studies, researchers are encouraged to evaluate the EOP behaviour of the catalysts under standard conditions in order to determine and compare the activity of each new electrocatalyst.
Thirdly, although many strategies have been developed to produce effective EOP catalysts, including Pt-based catalysts, BDD, DSA electrodes, etc., their synthesis processes are complex and expensive, resulting in high final product costs and insufficient catalyst yield and quality to meet industrial and commercial requirements. Although lead-based catalysts can meet the demand for commercial applications, there is a need to further develop green, low-cost and high-performance EOP catalysts that can be mass-produced in view of the green development trend. On the one hand, this insight inspires us to explore other metal oxide catalysts with electronic configurations similar to that of lead for EOP applications. On the other hand, the LOM mechanism can lead to the disruption of the catalyst's crystal structure. Therefore, developing metal oxides with unsaturated oxygen coordination could enable continuous structural reconstruction while maintaining high EOP activity, potentially achieving a balance between activity and stability in the EOP process. In addition, most current research relies on ex situ characterization techniques, which provide information only before and after the EOP tests. These methods overlook critical details such as the microstructural evolution of the atomic layer on the catalyst surface and the behavior of reaction intermediates adsorbed on the catalyst during the EOP process. Therefore, it is imperative to employ in situ characterization techniques to investigate the active sites and structural features of the catalysts throughout the EOP process to accurately elucidate the catalytic mechanism.
Fourthly, knowledge of the structural components of the electrolyzer is necessary to understand the EOP process. At present, the assembly cost of EOP electrolyzers is still relatively high, and the imperfections in the structural design could also affect the durable and stable operation during the EOP process. Considering the assembly cost of electrolyzers and the overall efficiency of EOP, it is also possible to promote the practical application of EOP technology in the future from the perspectives of the processing method of MEA, the material and porosity selection of GDL, the flow field design of BPP, and so on.
Fifth, the EOP process could be widely used in sterilisation and water treatment applications, and although progress has been reported in a wide range of studies, further rapid development is still limited by disciplinary constraints. We should encourage the cross-fertilization of the same technology between different disciplines and fields. For example, by promoting the cross-fertilization of the EOP process with biology and medicine, we can give full play to the strengths of various disciplines, promote the EOP process to a wider range of applications, and accelerate the rapid development of the process in practical application scenarios.
Author contributions
Jia Liu and Xiaoge Peng contributed equally to this review. Xing Zhong and Jianguo Wang conceived the topic and supervised the preparation of this review. Xiaosa Wang collected data. All authors have approved the final version of the manuscript.Data availability
No primary research results, software or code have been included and no new data were generated or analyzed as part of this review.Conflicts of interest
The authors declare no conflict of interest.Acknowledgements
The authors acknowledge the financial support from the National Key R & D Program of China (2022YFA1504200, 2021YFA1500903), Zhejiang Provincial Natural Science Foundation (No. LR22B060003) and National Natural Science Foundation of China (22322810, 22078293, 22141001, and 22008211).References
- Y. Ghorbani, S. E. Zhang, G. T. Nwaila, J. E. Bourdeau and D. H. Rose, J. Cleaner Prod., 2024, 434, 140414 CrossRef CAS.
- C. Tizaoui, R. Stanton, E. Statkute, A. Rubina, E. Lester-Card, A. Lewis, P. Holliman and D. Worsley, J. Hazard. Mater., 2022, 428, 128251 CrossRef CAS PubMed.
- Y. Tu, W. Tang, L. Yu, Z. Liu, Y. Liu, H. Xia, H. Zhang, S. Chen, J. Wu and X. Cui, Sci. Bull., 2021, 66, 720–726 CrossRef CAS PubMed.
- S. Farooq and C. Tizaoui, Crit. Rev. Environ. Sci. Technol., 2022, 53, 87–109 CrossRef.
- C. M. Morrison, S. Hogard, R. Pearce, D. Gerrity, U. von Gunten and E. C. Wert, Water Res., 2022, 214, 118206 CrossRef CAS PubMed.
- A. Blanco, F. d B. Ojembarrena, B. Clavo and C. Negro, Environ. Sci. Pollut. Res., 2021, 28, 16517–16531 CrossRef CAS PubMed.
- C. Tizaoui, Ozone: Sci. Eng., 2020, 42, 378–385 CrossRef CAS.
- A. Heebner and B. Abbassi, J. Water Process Eng., 2022, 46, 102638 CrossRef.
- D. Marín-García, D. Bienvenido-Huertas, J. Moyano and M. J. Oliveira, Waste Manage., 2022, 139, 60–69 CrossRef PubMed.
- A. John, A. Brookes, I. Carra, B. Jefferson and P. Jarvis, Crit. Rev. Environ. Sci. Technol., 2022, 52, 1561–1603 CrossRef CAS.
- I. Bavasso, D. Montanaro and E. Petrucci, Curr. Opin. Electrochem., 2022, 34, 101017 CrossRef CAS.
- L. G. De Sousa, D. V. Franco and L. M. Da Silva, J. Environ. Chem. Eng., 2016, 4, 418–427 CrossRef CAS.
- P. A. Christensen, T. Yonar and K. Zakaria, Ozone: Sci. Eng., 2013, 35, 149–167 CrossRef CAS.
- Q. Zhang, Y. Cao, Y. Yan, B. Yuan, H. Zheng, Y. Gu, X. Zhong and J. Wang, J. Mater. Chem. A, 2020, 8, 2336–2342 RSC.
- Y. Gu, S. Wang, H. Shi, J. Yang, S. Li, H. Zheng, W. Jiang, J. Liu, X. Zhong and J. Wang, ACS Catal., 2021, 11, 5438–5451 CrossRef CAS.
- P. Christensen, K. Zakaria and T. Curtis, Ozone: Sci. Eng., 2012, 34, 49–56 CrossRef CAS.
- J. Liu, S. Wang, Z. Yang, C. Dai, G. Feng, B. Wu, W. Li, L. Shu, K. Elouarzaki, X. Hu, X. Li, H. Wang, Z. Wang, X. Zhong, Z. J. Xu and J. Wang, EES Catal., 2023, 1, 301–311 RSC.
- K.-F. Cao, Z. Chen, Y.-G. Sun, B.-H. Huang, Q. Shi, Y. Mao, Y.-H. Wu, Y. Lu and H.-Y. Hu, Water Res., 2023, 243, 120373 CrossRef CAS PubMed.
- M. Qasim, M. S. Rafique and R. Naz, Mater. Chem. Phys., 2022, 291, 126442 CrossRef CAS.
- H. Zhang, Y. Zhang, T. Qiao, S. Hu, J. Liu, R. Zhu, K. Yang, S. Li and L. Zhang, Sep. Purif. Technol., 2022, 303, 122258 CrossRef CAS.
- I. F. Mena, M. A. Montiel, C. Sáez and M. A. Rodrigo, Chem. Eng. J., 2023, 464, 142688 CrossRef CAS.
- J.-W. Yu, G.-B. Jung, C.-W. Chen, C.-C. Yeh, X.-V. Nguyen, C.-C. Ma, C.-W. Hsieh and C.-L. Lin, Renewable Energy, 2018, 129, 800–805 CrossRef CAS.
- M. Rodríguez-Peña, J. A. B. Pérez, J. Llanos, C. Sáez, M. A. Rodrigo and C. E. Barrera-Díaz, Curr. Opin. Electrochem., 2021, 27, 100697 CrossRef.
- W. Li, G. Feng, S. Wang, J. Liu, X. Zhong, Z. Yao, S. Deng and J. Wang, J. Phys. Chem. C, 2022, 126, 8627–8636 CrossRef CAS.
- G. Feng, W. Li, J. Liu, X. Zhong, Z. Yao, S. Deng, W. Zhang, S. Wang and J. Wang, J. Chem. Phys., 2022, 157, 184105 CrossRef CAS PubMed.
- W. Li, G. Feng, J. Liu, X. Zhong, Z. Yao, S. Deng, S. Wang and J. Wang, Chin. J. Struct. Chem., 2022, 41(12), 2212051–2212059 CAS.
- C. Zhang, Y. Xu, P. Lu, X. Zhang, F. Xu and J. Shi, J. Am. Chem. Soc., 2017, 139, 16620–16629 CrossRef CAS PubMed.
- A. Zagalskaya and V. Alexandrov, ACS Catal., 2020, 10, 3650–3657 CrossRef CAS.
- D. A. Kuznetsov, M. A. Naeem, P. V. Kumar, P. M. Abdala, A. Fedorov and C. R. Müller, J. Am. Chem. Soc., 2020, 142, 7883–7888 CrossRef CAS PubMed.
- F.-Y. Chen, Z.-Y. Wu, Z. Adler and H. Wang, Joule, 2021, 5, 1704–1731 CrossRef CAS.
- J. S. Yoo, X. Rong, Y. Liu and A. M. Kolpak, ACS Catal., 2018, 8, 4628–4636 CrossRef CAS.
- Z.-F. Huang, J. Song, Y. Du, S. Xi, S. Dou, J. M. V. Nsanzimana, C. Wang, Z. J. Xu and X. Wang, Nat. Energy, 2019, 4, 329–338 CrossRef CAS.
- K. A. Stoerzinger, O. Diaz-Morales, M. Kolb, R. R. Rao, R. Frydendal, L. Qiao, X. R. Wang, N. B. Halck, J. Rossmeisl and H. A. Hansen, ACS Energy Lett., 2017, 2, 876–881 CrossRef CAS.
- K. Klyukin, A. Zagalskaya and V. Alexandrov, J. Phys. Chem. C, 2019, 123, 22151–22157 CrossRef CAS.
- O. Kasian, S. Geiger, T. Li, J.-P. Grote, K. Schweinar, S. Zhang, C. Scheu, D. Raabe, S. Cherevko and B. Gault, Energy Environ. Sci., 2019, 12, 3548–3555 RSC.
- X. Rong, J. Parolin and A. M. Kolpak, ACS Catal., 2016, 6, 1153–1158 CrossRef CAS.
- T. Binninger, R. Mohamed, K. Waltar, E. Fabbri, P. Levecque, R. Kötz and T. J. Schmidt, Sci. Rep., 2015, 5, 12167 CrossRef CAS PubMed.
- I. C. Man, H. Y. Su, F. Calle-Vallejo, H. A. Hansen, J. I. Martínez, N. G. Inoglu, J. Kitchin, T. F. Jaramillo, J. K. Nørskov and J. Rossmeisl, ChemCatChem, 2011, 3, 1159–1165 CrossRef CAS.
- A. Vojvodic and J. K. Nørskov, Science, 2011, 334, 1355–1356 CrossRef CAS PubMed.
- A. Grimaud, O. Diaz-Morales, B. Han, W. T. Hong, Y.-L. Lee, L. Giordano, K. A. Stoerzinger, M. T. Koper and Y. Shao-Horn, Nat. Chem., 2017, 9, 457–465 CrossRef CAS PubMed.
- G. Gibson, A. Morgan, P. Hu and W.-F. Lin, Chem. Phys. Lett., 2016, 654, 46–51 CrossRef CAS.
- A. Grimaud, W. T. Hong, Y. Shao-Horn and J.-M. Tarascon, Nat. Mater., 2016, 15, 121–126 CrossRef CAS PubMed.
- J. T. Mefford, X. Rong, A. M. Abakumov, W. G. Hardin, S. Dai, A. M. Kolpak, K. P. Johnston and K. J. Stevenson, Nat. Commun., 2016, 7, 11053 CrossRef CAS PubMed.
- J. Suntivich, K. J. May, H. A. Gasteiger, J. B. Goodenough and Y. Shao-Horn, Science, 2011, 334, 1383–1385 CrossRef CAS PubMed.
- W. Jiang, S. Wang, J. Liu, H. Zheng, Y. Gu, W. Li, H. Shi, S. Li, X. Zhong and J. Wang, J. Mater. Chem. A, 2021, 9, 9010–9017 RSC.
- H. Shi, G. Feng, S. Li, J. Liu, X. Yang, Y. Li, Y. Lu, X. Zhong, S. Wang and W. Jianguo, J. Mater. Chem. A, 2022, 10, 5430–5441 RSC.
- J. Liu, S. Wang, J. Cai, L. Wu, Y. Liu, J. He, Z. Xu, X. Peng, X. Zhong, L. An and J. Wang, Chin. J. Catal., 2024, 57, 80–95 CrossRef CAS.
- B. Yuan, Z. Yao, C. Qiu, H. Zheng, Y. Yan, Q. Zhang, X. Sun, Y. Gu, X. Zhong and J. Wang, J. Energy Chem., 2020, 51, 312–322 CrossRef.
- X. Yu, X. Liu, J. Zhao, M. Xue, H. Shi, C. Jiang, J. Liu, Y. Xue, F. Gao and X. Zhong, Chem. Eng. Sci., 2024, 286, 119652 CrossRef CAS.
- M. Li, C. Qiu, T. Sun, X. Wang, L. Xia, X. Yang, W. Zhao, H. Shi, L. Ding, X. Zhong, Y. Zhu and J. Wang, Ind. Eng. Chem. Res., 2023, 62, 7889–7900 CrossRef CAS.
- X. Yang, W. Li, S. Wang, H. Shi, X. Wang, M. Li, L. Ding, X. Zhong and J. Wang, ACS ES&T Eng., 2023, 3, 894–905 Search PubMed.
- L. Ding, W. Li, M. Xue, X. Peng, H. Shi, J. Liu, X. Wang, C. Jiang, Y. Xue, S. Wang, X. Zhong and J. Wang, AIChE J., 2024, 70(3), e18314 CrossRef CAS.
- M. Xue, J. Zhao, X. Yu, L. Ding, X. Wang, J. Liu, H. Shi, Y. Xue, Z. Yao, X. Zhong and J. Wang, Adv. Funct. Mater., 2024, 34(1), 2308567 CrossRef CAS.
- Y. Yan, Y. Gao, H. Zheng, B. Yuan, Q. Zhang, Y. Gu, G. Zhuang, Z. Wei, Z. Yao, X. Zhong, X. Li and J. Wang, Appl. Catal., B, 2020, 266, 118632 CrossRef CAS.
- H. Shi, X. Wang, X. Peng, M. Xue, Y. Xue, F. Gao, X. Zhong and J. Wang, J. Mater. Chem. A, 2024, 12, 10852–10862 RSC.
- L. Ding, J. Zhao, Z. Bao, S. Zhang, H. Shi, J. Liu, G. Wang, X. Peng, X. Zhong and J. Wang, J. Mater. Chem. A, 2023, 11, 3454–3463 RSC.
- X. Peng, Z. Bao, S. Zhang, Y. Li, L. Ding, H. Shi, J. Liu, X. Zhong, X. Li and J. Wang, Chem. Eng. Sci., 2023, 271, 118573 CrossRef CAS.
- X. Wang, J. Li, L. Ding, H. Shi, J. Liu, X. Yang, M. Li, X. Zhong, Z. Yao and J. Wang, AIChE J., 2023, 69(10), e18152 CrossRef CAS.
- H. Zheng, Y. Gao, X. Wang, H. Shi, Y. Gu, W. Jiang, J. Liu, S. Li, A. Li, S. Wang, J. Wang and X. Zhong, ChemistrySelect, 2022, 7, e202200966 CrossRef CAS.
- X. Wang, L. Wang, D. Wu, D. Yuan, H. Ge and X. Wu, Sci. Total Environ., 2023, 855, 158880 CrossRef CAS PubMed.
- S. Chen, F. Jiang, X. Xie, Y. Zhou and X. Hu, Electrochim. Acta, 2016, 192, 357–362 CrossRef CAS.
- M. H. Santana, L. A. De Faria and J. F. Boodts, Electrochim. Acta, 2004, 49, 1925–1935 CrossRef CAS.
- F. Liu, Z. Deng, D. Miao, W. Chen, Y. Wang, K. Zhou, L. Ma and Q. Wei, J. Environ. Chem. Eng., 2021, 9, 106369 CrossRef CAS.
- G. F. Wood, I. M. Terrero Rodríguez, J. J. Tully, S. Chaudhuri and J. V. Macpherson, J. Electrochem. Soc., 2021, 168(12), 126514 CrossRef CAS.
- J. L. Lansing, L. Zhao, T. Siboonruang, N. H. Attanayake, A. B. Leo, P. Fatouros, S. M. Park, K. R. Graham, J. A. Keith and M. Tang, AIChE J., 2021, 67(12), e17486 CrossRef CAS.
- P. A. Christensen, P. S. Attidekou, R. G. Egdell, S. Maneelok, D. A. C. Manning and R. Palgrave, J. Phys. Chem. C, 2017, 121, 1188–1199 CrossRef CAS.
- G. Gibson, Z. Wang, C. Hardacre and W.-F. Lin, Phys. Chem. Chem. Phys., 2017, 19, 3800–3806 RSC.
- X. Li, H. Xu, W. Yan and D. Shao, J. Electroanal. Chem., 2016, 775, 43–51 CrossRef CAS.
- C. Zhang, X. Liang, R. Xu, C. Dai, B. Wu, G. Yu, B. Chen, X. Wang and N. Liu, Adv. Funct. Mater., 2021, 31(14), 2008298 CrossRef CAS.
- J. Zhang, X. Qu, L. Shen, G. Li, T. Zhang, J. Zheng, L. Ji, W. Yan, Y. Han and X. Cheng, Small, 2021, 17, 2006698 CrossRef CAS PubMed.
- Z. Niu, N. Becknell, Y. Yu, D. Kim, C. Chen, N. Kornienko, G. A. Somorjai and P. Yang, Nat. Mater., 2016, 15, 1188–1194 CrossRef CAS PubMed.
- M. Li, M. Luo, Z. Xia, Y. Yang, Y. Huang, D. Wu, Y. Sun, C. Li, Y. Chao and W. Yang, J. Mater. Chem. A, 2019, 7, 20151–20157 RSC.
- J. Deng, P. Ren, D. Deng and X. Bao, Angew. Chem., Int. Ed., 2015, 54, 2100–2104 CrossRef CAS PubMed.
- Y. Peng and S. Chen, Green Energy Environ., 2018, 3, 335–351 CrossRef.
- Z. Zhao, Z. Liu, A. Zhang, X. Yan, W. Xue, B. Peng, H. L. Xin, X. Pan, X. Duan and Y. Huang, Nat. Nanotechnol., 2022, 17, 968–975 CrossRef CAS PubMed.
- Z. Deng, H. Long, Q. Wei, Z. Yu, B. Zhou, Y. Wang, L. Zhang, S. Li, L. Ma, Y. Xie and J. Min, Sens. Actuators, B, 2017, 242, 825–834 CrossRef CAS.
- H. Li, K. Zhou, J. Cao, Q. Wei, C.-T. Lin, S. E. Pei, L. Ma, N. Hu, Y. Guo, Z. Deng, Z. Yu, S. Zeng, W. Yang and L. Meng, Carbon, 2021, 171, 16–28 CrossRef.
- X. Mei, Q. Wei, H. Long, Z. Yu, Z. Deng, L. Meng, J. Wang, J. Luo, C.-T. Lin, L. Ma, K. Zheng and N. Hu, Electrochim. Acta, 2018, 271, 84–91 CrossRef CAS.
- M. H. P. Santana, L. A. D. Faria and J. F. C. Boodts, Electrochim. Acta, 2005, 50, 2017–2027 CrossRef CAS.
- A. Kraft, M. Stadelmann, M. Wünsche and M. Blaschke, Electrochem. Commun., 2006, 8, 883–886 CrossRef CAS.
- K. Arihara, C. Terashima and A. Fujishima, Electrochem. Solid-State Lett., 2006, 9, D17 CrossRef CAS.
- Y. Meas, L. A. Godinez and E. Bustos, Ozone Generation Using Boron-Doped Diamond Electrodes, John Wiley & Sons, Ins., 2011, pp. 311–331 Search PubMed.
- Y. He, H. Lin, Z. Guo, W. Zhang, H. Li and W. Huang, Sep. Purif. Technol., 2019, 212, 802–821 CrossRef CAS.
- P. Sun, C. Tang, X. Xia, Z. Yao, B. Quan, G. Yuan, C. Gu and J. Li, Microelectron. Eng., 2016, 155, 61–66 CrossRef CAS.
- Y. Coffinier, E. Galopin, S. Szunerits and R. Boukherroub, J. Mater. Chem., 2010, 20, 10671–10675 RSC.
- C. Shi, C. Li, M. Li, H. Li, W. Dai, Y. Wu and B. Yang, Appl. Surf. Sci., 2016, 360, 315–322 CrossRef CAS.
- X. Li, H. Li, M. Li, C. Li, D. Sun, Y. Lei and B. Yang, Carbon, 2018, 129, 543–551 CrossRef CAS.
- N. Yang, S. Yu, J. V. Macpherson, Y. Einaga, H. Zhao, G. Zhao, G. M. Swain and X. Jiang, Chem. Soc. Rev., 2019, 48, 157–204 RSC.
- J. Zhang, Y. Coffinier, Z.-Y. Zhao, S. Szunerits, A. Barras, X. Yu and R. Boukherroub, Electrochim. Acta, 2020, 354, 136649 CrossRef CAS.
- L. Shi, F. Xu, J. Gao, M. Yuen, S. Sun, J. Xu, K. Jia and D. Zuo, Diamond Relat. Mater., 2020, 109, 108098 CrossRef CAS.
- N. R. Wilson, S. L. Clewes, M. E. Newton, P. R. Unwin and J. V. Macpherson, J. Phys. Chem. B, 2006, 110, 5639–5646 CrossRef CAS PubMed.
- F. Liu, Z. Deng, D. Miao, W. Chen, Y. Wang, K. Zhou, L. Ma and Q. Wei, J. Environ. Chem. Eng., 2021, 9(6), 106369 CrossRef CAS.
- K. Arihara, C. Terashima and A. Fujishima, Electrochem. Solid-State Lett., 2006, 9(8), D17 CrossRef CAS.
- Y. Honda, T. A. Ivandini, T. Watanabe, K. Murata and Y. Einaga, Diamond Relat. Mater., 2013, 40, 7–11 CrossRef CAS.
- S.-A. Cheng and K.-Y. Chan, Electrochem. Solid-State Lett., 2004, 7, D4 CrossRef CAS.
- Y.-H. Wang, S. Cheng, K.-Y. Chan and X. Y. Li, J. Electrochem. Soc., 2005, 152, D197 CrossRef.
- P. A. Christensen, K. Zakaria, H. Christensen and T. Yonar, J. Electrochem. Soc., 2013, 160, H405 CrossRef CAS.
- J. Basiriparsa and M. Abbasi, J. Solid State Electrochem., 2012, 16, 1011–1018 CrossRef CAS.
- Y. H. Wang, K. Y. Chan, X. Y. Li and S. K. So, Chemosphere, 2006, 65, 1087–1093 CrossRef CAS PubMed.
- S. Y. Yang, Y. S. Choo, S. Kim, S. K. Lim, J. Lee and H. Park, Appl. Catal., B, 2012, 111–112, 317–325 CrossRef CAS.
- J. B. Parsa, M. Abbasi and A. Cornell, J. Electrochem. Soc., 2012, 159, D265 CrossRef CAS.
- G. Gibson and W. Lin, J. Electrochem., 2017, 23, 180 CAS.
- V. Naresh, L. Elias, S. Gaffoor and S. K. Martha, J. Electrochem. Soc., 2019, 166, A74 CrossRef CAS.
- R. Amadelli and A. Velichenko, J. Serb. Chem. Soc., 2001, 66, 835–845 CrossRef CAS.
- L. S. Andrade, L. A. M. Ruotolo, R. C. Rocha-Filho, N. Bocchi, S. R. Biaggio, J. Iniesta, V. García-Garcia and V. Montiel, Chemosphere, 2007, 66, 2035–2043 CrossRef CAS PubMed.
- A. Velichenko, D. Girenko, N. Nikolenko, R. Amadelli, E. Baranova and F. Danilov, Russ. J. Electrochem., 2000, 36, 1216–1220 CrossRef CAS.
- A. Velichenko, R. Amadelli, G. Zucchini, D. Girenko and F. Danilov, Electrochim. Acta, 2000, 45, 4341–4350 CrossRef CAS.
- J. Liu, C. Qiu, Z. Xu, M. Xue, J. Cai, H. Shi, L. Ding, X. Li, X. Zhong and J. Wang, Chem. Eng. J., 2023, 468, 143504 CrossRef CAS.
- H. Shi, G. Feng, T. Sun, X. Wang, L. Ding, Z. Wang, H. Jin, Q. Chen, S. Wang, X. Zhong, Y. Zhu and J. Wang, Chem. Catal., 2023, 3(9), 100728 CrossRef CAS.
- M. Malaki, A. Maleki and R. S. Varma, J. Mater. Chem. A, 2019, 7, 10843–10857 RSC.
- X. Jiang, H. Jang, S. Liu, Z. Li, M. G. Kim, C. Li, Q. Qin, X. Liu and J. Cho, Angew. Chem., Int. Ed., 2021, 60, 4110–4116 CrossRef CAS PubMed.
- L. Zhang, Y. Zheng, J. Wang, Y. Geng, B. Zhang, J. He, J. Xue, T. Frauenheim and M. Li, Small, 2021, 17, 2006730 CrossRef CAS PubMed.
- H. R. Inta, S. Ghosh, A. Mondal, G. Tudu, H. V. S. R. M. Koppisetti and V. Mahalingam, ACS Appl. Energy Mater., 2021, 4, 2828–2837 CrossRef CAS.
- D. Guan, J. Zhou, Y.-C. Huang, C.-L. Dong, J.-Q. Wang, W. Zhou and Z. Shao, Nat. Commun., 2019, 10, 3755 CrossRef PubMed.
- J. Hwang, R. R. Rao, L. Giordano, Y. Katayama, Y. Yu and Y. Shao-Horn, Science, 2017, 358, 751–756 CrossRef CAS PubMed.
- X. Ai, X. Zou, H. Chen, Y. Su, X. Feng, Q. Li, Y. Liu, Y. Zhang and X. Zou, Angew. Chem., Int. Ed., 2020, 59, 3961–3965 CrossRef CAS PubMed.
- H. Zhu, P. Zhang and S. Dai, ACS Catal., 2015, 5, 6370–6385 CrossRef CAS.
- J. I. Jung, H. Y. Jeong, J. S. Lee, M. G. Kim and J. Cho, Angew. Chem., 2014, 126, 4670–4674 CrossRef.
- W. Zhong, Z. Gong, Z. He, N. Zhang, X. Kang, X. Mao and Y. Chen, J. Energy Chem., 2023, 78, 211–221 CrossRef CAS.
- J. Lim, C.-Y. Liu, J. Park, Y.-H. Liu, T. P. Senftle, S. W. Lee and M. C. Hatzell, ACS Catal., 2021, 11, 7568–7577 CrossRef CAS.
- H. Shi, Y. Li, X. Wang, H. Yu and J. Yu, Appl. Catal., B, 2021, 297, 120414 CrossRef CAS.
- W. Chen, H. He, R. Zou, Y. Chen, X. Li, J. Wang, Y. Tang and L. Li, Environ. Sci.: Nano, 2021, 8, 3138–3152 RSC.
- S. Jaśkaniec, S. R. Kavanagh, J. Coelho, S. Ryan, C. Hobbs, A. Walsh, D. O. Scanlon and V. Nicolosi, npj 2D Mater. Appl., 2021, 5, 27 CrossRef.
- F. Zhang, J. Zhu, D. Zhang, U. Schwingenschlögl and H. N. Alshareef, Nano Lett., 2017, 17, 1302–1311 CrossRef CAS PubMed.
- Y. Zeng, M. Zhao, Z. Huang, W. Zhu, J. Zheng, Q. Jiang, Z. Wang and H. Liang, Adv. Energy Mater., 2022, 12, 2201713 CrossRef CAS.
- X. Liu, J. Meng, J. Zhu, M. Huang, B. Wen, R. Guo and L. Mai, Adv. Mater., 2021, 33, 2007344 CrossRef CAS PubMed.
- S. Jin, ACS Energy Lett., 2017, 2, 1937–1938 CrossRef CAS.
- S. Zhao, J. Huang, Y. Liu, J. Shen, H. Wang, X. Yang, Y. Zhu and C. Li, J. Mater. Chem. A, 2017, 5, 4207–4214 RSC.
- F. Okada, S. Tanaka, S. Tanaka and K. Naya, Electrochim. Acta, 2015, 153, 210–216 CrossRef CAS.
- M. I. Awad, S. Sata, K. Kaneda, M. Ikematsu and T. Ohsaka, J. Energy Chem., 2015, 24, 178–184 CrossRef.
- M. Hayashi, T. Ochiai, S. Tago, H. Saito, T. Yahagi and A. Fujishima, Chem. Lett., 2019, 48, 574–577 CrossRef CAS.
- S. Y. Yang, D. Kim and H. Park, Environ. Sci. Technol., 2014, 48, 2877–2884 CrossRef CAS PubMed.
- K. Zakaria and P. A. Christensen, Electrochim. Acta, 2014, 135, 11–18 CrossRef CAS.
- Y. Zhang, Y. Yang, S. Yang, E. Quispe-Cardenas and M. R. Hoffmann, ACS ES&T Eng., 2021, 1, 1236–1245 Search PubMed.
- C. Zhang, Y. Xu, P. Lu, X. Zhang, F. Xu and J. Shi, J. Am. Chem. Soc., 2017, 139, 16620–16629 CrossRef CAS PubMed.
- M. Upadhyay, A. Kim, S. S. Paramanantham, H. Kim, D. Lim, S. Lee, S. Moon and H. Lim, Appl. Energy, 2022, 306, 118016 CrossRef CAS.
- M. Upadhyay, S. Lee, S. Jung, Y. Choi, S. Moon and H. Lim, Int. J. Hydrogen Energy, 2020, 45, 20765–20775 CrossRef CAS.
- E. Amores, M. Sánchez, N. Rojas and M. Sánchez-Molina, Sustainable Fuel Technologies Handbook, Elsevier, 2021, pp. 271–313 Search PubMed.
- X.-Z. Yuan, N. Shaigan, C. Song, M. Aujla, V. Neburchilov, J. T. H. Kwan, D. P. Wilkinson, A. Bazylak and K. Fatih, Sustainable Energy Fuels, 2022, 6, 1824–1853 RSC.
- M. Carmo, D. L. Fritz, J. Mergel and D. Stolten, Int. J. Hydrogen Energy, 2013, 38, 4901–4934 CrossRef CAS.
- C. Coutanceau, S. Baranton and T. Audichon, Hydrogen Electrochemical Production, Academic Press, 2017 Search PubMed.
- D. Bessarabov, H. Wang, H. Li and N. Zhao, PEM Electrolysis for Hydrogen Production: Principles and Applications, CRC press, 2016 Search PubMed.
- C. Neofytidis, E. Ioannidou, L. Sygellou, M. Kollia and D. Niakolas, J. Catal., 2019, 373, 260–275 CrossRef CAS.
- J. Yoo, S.-K. Woo, J. H. Yu, S. Lee and G. W. Park, Int. J. Hydrogen Energy, 2009, 34, 1542–1547 CrossRef CAS.
- E. Borgardt, L. Giesenberg, M. Reska, M. Müller, K. Wippermann, M. Langemann, W. Lehnert and D. Stolten, Int. J. Hydrogen Energy, 2019, 44, 23556–23567 CrossRef CAS.
- Z. Shangguan, B. Li, P. Ming and C. Zhang, J. Mater. Chem. A, 2021, 9, 15111–15139 RSC.
- S. Choi, S.-H. Shin, D.-H. Lee, G. Doo, D. W. Lee, J. Hyun, J. Y. Lee and H.-T. Kim, J. Mater. Chem. A, 2022, 10, 789–798 RSC.
- A. Voronova, H. J. Kim, J. H. Jang, H. Y. Park and B. Seo, Int. J. Energy Res., 2022, 46, 11867–11878 CrossRef CAS.
- P. Satjaritanun, M. O’Brien, D. Kulkarni, S. Shimpalee, C. Capuano, K. E. Ayers, N. Danilovic, D. Y. Parkinson and I. V. Zenyuk, iScience, 2020, 23(12), 101783 CrossRef CAS PubMed.
- M. Zlobinski, T. Schuler, F. N. Büchi, T. J. Schmidt and P. Boillat, J. Electrochem. Soc., 2020, 167, 084509 CrossRef CAS.
- S. Yuan, C. Zhao, X. Cai, L. An, S. Shen, X. Yan and J. Zhang, Prog. Energy Combust. Sci., 2023, 96, 101075 CrossRef.
- A. Angulo, P. van der Linde, H. Gardeniers, M. Modestino and D. F. Rivas, Joule, 2020, 4, 555–579 CrossRef CAS.
- E. Amores, A. Contreras, L. Rodríguez and M. Carrero, European Hydrogen Energy Conference 2018. Costa del Sol, Spain. 14–16th March, 2018.
- N. F. Asri, T. Husaini, A. B. Sulong, E. H. Majlan and W. R. W. Daud, Int. J. Hydrogen Energy, 2017, 42, 9135–9148 CrossRef CAS.
- L. M. Da Silva, D. V. Franco, J. C. Forti, W. F. Jardim and J. F. C. Boodts, J. Appl. Electrochem., 2006, 36, 523–530 CrossRef CAS.
- P. A. Christensen, W. F. Lin, H. Christensen, A. Imkum, J. M. Jin, G. Li and C. M. Dyson, Ozone: Sci. Eng., 2009, 31, 287–293 CrossRef CAS.
- M. Rodríguez-Peña, J. A. Barrios Pérez, J. Lobato, C. Saez, C. E. Barrera-Díaz and M. A. Rodrigo, Sep. Purif. Technol., 2022, 297, 121529 CrossRef.
- G. Acosta-Santoyo, L. F. León-Fernández, E. Bustos, P. Cañizares, M. A. Rodrigo and J. Llanos, Electrochim. Acta, 2021, 390, 138878 CrossRef CAS.
- M. Rodríguez-Peña, J. A. Barrios Pérez, J. Llanos, C. Saez, C. E. Barrera-Díaz and M. A. Rodrigo, Sep. Purif. Technol., 2021, 267, 118672 CrossRef.
- M. Rodríguez-Peña, J. A. B. Pérez, J. Llanos, C. Saez, C. E. Barrera-Díaz and M. A. Rodrigo, Electrochim. Acta, 2021, 376, 138033 CrossRef.
- G. Santana-Martínez, G. Roa-Morales, L. Gómez-Olivan, E. Peralta-Reyes, R. Romero and R. Natividad, J. Environ. Chem. Eng., 2021, 9(4), 105148 CrossRef.
- A. Spiliotopoulou, P. Rojas-Tirado, R. K. Chhetri, K. M. Kaarsholm, R. Martin, P. B. Pedersen, L.-F. Pedersen and H. R. Andersen, Water Res., 2018, 133, 289–298 CrossRef CAS PubMed.
- M. Rodriguez-Pena, J. A. Barrios Perez, J. Llanos, C. Saez, C. E. Barrera-Diaz and M. A. Rodrigo, Chemosphere, 2022, 289, 133141 CrossRef CAS PubMed.
- M. Rodríguez-Peña, J. A. Barrios Pérez, J. Lobato, C. Saez, C. E. Barrera-Díaz and M. A. Rodrigo, Sep. Purif. Technol., 2022, 284, 120261 CrossRef.
- J. A. Lara-Ramos, C. Saez, F. Machuca-Martínez and M. A. Rodrigo, Sep. Purif. Technol., 2020, 241, 116701 CrossRef CAS.
- E. I. Epelle, A. Macfarlane, M. Cusack, A. Burns, J. A. Okolie, W. Mackay, M. Rateb and M. Yaseen, Chem. Eng. J., 2023, 454, 140188 CrossRef CAS PubMed.
- K. Rangel, F. O. Cabral, G. C. Lechuga, J. P. Carvalho, M. H. Villas-Bôas, V. Midlej and S. G. De-Simone, Microorganisms, 2021, 10, 40 CrossRef PubMed.
- M. Nagayoshi, C. Kitamura, T. Fukuizumi, T. Nishihara and M. Terashita, J. Endod., 2004, 30, 778–781 CrossRef PubMed.
- G. Manousaridis, A. Nerantzaki, E. Paleologos, A. Tsiotsias, I. Savvaidis and M. Kontominas, Food Microbiol., 2005, 22, 1–9 CrossRef CAS.
- M. Nagayoshi, T. Fukuizumi, C. Kitamura, J. Yano, M. Terashita and T. Nishihara, Oral Microbiol. Immunol., 2004, 19, 240–246 CrossRef CAS PubMed.
- R. B. Martins, I. A. Castro, M. Pontelli, J. P. Souza, T. M. Lima, S. R. Melo, J. P. Z. Siqueira, M. H. Caetano, E. Arruda and M. T. G. de Almeida, Ozone: Sci. Eng., 2021, 43, 108–111 CrossRef CAS.
- B. Wang, W. Shi, H. Zhang, H. Ren and M. Xiong, J. Environ. Chem. Eng., 2021, 9, 106115 CrossRef CAS.
- E. Zanacic, J. Stavrinides and D. W. McMartin, Water Res., 2016, 104, 397–407 CrossRef CAS PubMed.
- Á. Moratalla, S. E. Correia, E. Lacasa, P. Murillo, P. Cañizares, M. A. Rodrigo and C. Sáez, J. Water Process Eng., 2023, 55, 104153 CrossRef.
- C. Estrela, C. Estrela, D. Decurcio, A. Hollanda and J. Silva, Int. Endod. J., 2007, 40, 85–93 CrossRef CAS PubMed.
- X. Hu, Z. Chen, Z. Su, F. Deng, X. Chen, Q. Yang, P. Li, Q. Chen, J. Ma, W. Guan, R. Pei and Y. Wang, Virol. Sin., 2021, 36, 1066–1068 CrossRef CAS PubMed.
- W. Ding, W. Jin, S. Cao, X. Zhou, C. Wang, Q. Jiang, H. Huang, R. Tu, S. F. Han and Q. Wang, Water Res., 2019, 160, 339–349 CrossRef CAS PubMed.
- A. Roth, M. K. Maruthamuthu, S. Nejati, A. Krishnakumar, V. Selvamani, S. Sedaghat, J. Nguyen, M. N. Seleem and R. Rahimi, Sci. Rep., 2022, 12, 13927 CrossRef CAS PubMed.
- B. Zhu, X.-S. Li, P. Sun, J.-L. Liu, X.-Y. Ma, X. Zhu and A.-M. Zhu, Chin. J. Catal., 2017, 38, 1759–1769 CrossRef CAS.
- H. Ye, Y. Liu, S. Chen, H. Wang, Z. Liu and Z. Wu, Chin. J. Catal., 2019, 40, 631–637 CrossRef CAS.
Footnote |
| † Equal contribution. |
| This journal is © The Royal Society of Chemistry 2025 |


