
 Open Access Article
 This Open Access Article is licensed under a Creative Commons Attribution-Non Commercial 3.0 Unported Licence
Computer-aided design of Pt/In2O3 single-atom catalysts for CO2 hydrogenation to methanol†
Yuchen
Wang‡
abc,
Zixuan
Zhou‡
ab,
Bin
Qin‡
a,
Qingyu
Chang‡
 a,
Shanshan
Dang
a,
Yiqin
Hu
d,
Kun
Li
c,
Yuanjie
Bao
ab,
Jianing
Mao
be,
Haiyan
Yang
a,
Yang
Liu
c,
Jiong
Li
e,
Shenggang
Li
*abcf,
David A.
Dixon
*d,
Yuhan
Sun
acg and
Peng
Gao
*abf
a,
Shanshan
Dang
a,
Yiqin
Hu
d,
Kun
Li
c,
Yuanjie
Bao
ab,
Jianing
Mao
be,
Haiyan
Yang
a,
Yang
Liu
c,
Jiong
Li
e,
Shenggang
Li
*abcf,
David A.
Dixon
*d,
Yuhan
Sun
acg and
Peng
Gao
*abf
aCAS Key Laboratory of Low-Carbon Conversion Science and Engineering, Shanghai Advanced Research Institute, Chinese Academy of Sciences, Shanghai 201210, China. E-mail: lisg@sari.ac.cn; gaopeng@sari.ac.cn
bUniversity of Chinese Academy of Sciences, Beijing 100049, China
cSchool of Physical Science and Technology, ShanghaiTech University, Shanghai 201210, China
dDepartment of Chemistry and Biochemistry, The University of Alabama, Shelby Hall, Box 870336, Tuscaloosa, Alabama 35487-0336, USA. E-mail: dadixon@ua.edu
eShanghai Synchrotron Radiation Facility, Shanghai Advanced Research Institute, Chinese Academy of Sciences, Shanghai 201204, China
fState Key Laboratory of Low Carbon Catalysis and Carbon Dioxide Utilization, Shanghai Advanced Research Institute, Chinese Academy of Sciences, Shanghai 201210, China
gShanxi Research Institute, Huairou Research Laboratory, Taiyuan 030032, China
First published on 4th November 2024
Abstract
Methanol (CH3OH) synthesis from carbon dioxide (CO2) hydrogenation is an industrially viable approach to CO2 utilization. For the recently developed indium oxide (In2O3) catalyst, higher performance may be achieved by introducing transition metal promoters, although recent studies suggest that single atom sites favour CO formation. Here, by density functional theory-based microkinetic simulations, bulk-doped Pt/In2O3 single atom catalysts (SACs) with much higher CO2 reactivity than the In2O3 catalyst while maintaining CH3OH selectivity were designed. Several Pt/In2O3 SACs were synthesized to confirm our theoretical predictions. The synthesized Pt/In2O3 SAC in the predominantly bulk-doped form exhibits much higher CO2 reactivity than the In2O3 catalyst with high stability and similar CH3OH selectivity, yielding a CH3OH productivity of 1.25 g gcat−1 h−1. This study demonstrates the power of computational methods in designing oxide-based catalysts for industrial reactions and reveals a bulk-doped SAC with high performance.
Broader contextRapid increase in the amount of CO2 emission from fossil fuel consumption accelerates the approaching of climate change, and efficient and sustainable technologies must be swiftly developed and widely deployed to mitigate such severe consequence. Central to CO2 capture and utilization for reducing CO2 emission, CO2 hydrogenation to valuable chemicals such as methanol using renewable hydrogen is economically and technologically viable for applications at industrial scale. However, presently known catalysts for methanol synthesis from CO2 hydrogenation have suboptimal catalytic performance due to poor activity, low stability, or limited selectivity. For rapid development of more efficient catalysts for this important reaction, first principles-based simulations were employed to rationally design a Pt/In2O3 single atom catalyst in the unusual bulk-doped form, which was shown by our experiments to enable unprecedented methanol productivity of 1.25 g gcat−1 h−1 under reaction conditions of 5.0 MPa, 573 K and 54![[thin space (1/6-em)]](https://www.rsc.org/images/entities/char_2009.gif) 000 mL gcat−1 h−1, far exceeding the current reported maximum methanol productivity of less than 1.0 g gcat−1 h−1. 000 mL gcat−1 h−1, far exceeding the current reported maximum methanol productivity of less than 1.0 g gcat−1 h−1.
|
Introduction
Global warming and climate change induced by the excessive combustion of fossil fuels leading to growing carbon dioxide (CO2) emissions from the chemical and energy industries endanger the sustainable development of our society, so effective means for their mitigation must be sought. CO2 capture and utilization (CCU) is widely recognized as a viable approach for reducing emissions while providing carbon-based chemicals and fuels that are widely used in our society. With renewable hydrogen, CO2 hydrogenation over heterogeneous catalysts allows for sustainable production of fuels and chemicals including methanol (CH3OH) with the key advantages of potential large-scale industrial applications using existing technologies and facilities.1,2Cu-based catalysts are the most widely studied catalysts for methanol synthesis from syngas (carbon monoxide and dihydrogen, CO and H2) and also from CO2 hydrogenation, but poor catalyst stability and CH3OH selectivity limit the latter applications.3–10 In the past decade, a promising family of oxide-based catalysts, such as indium oxide (In2O3), which exhibit great catalyst stability, high catalytic activity, and excellent CH3OH selectivity, especially when supported by an oxide support, such as zirconium oxide or optimized for the crystalline phase and exposed facets, has emerged.11–14 Nevertheless, there is significant interest in further improving the CO2 reactivity of In2O3-based catalysts, for example, via transition metal promotion,15,16 in which CO formation via the reverse water gas shift (RWGS) reaction must be inhibited to maintain CH3OH selectivity.
Compared with metal nanoparticles modified In2O3, metal-promoted In2O3 (M/In2O3) catalysts with highly dispersed metal sites were found more effective for CO2 hydrogenation to methanol.17–20 M/In2O3 in the form of single atom catalysts (SACs) has significant advantages such as high metal utilization and large cost reduction, especially for noble metals. However, there are few studies of CO2 hydrogenation to methanol on M/In2O3 SACs.16,21,22 Although good CO2 reactivity and CH3OH selectivity have been reported for Rh/In2O3 SACs,16 a recent theoretical study23 suggests that introducing atomic metal promoters such as Ni in the form of a surface dopant or an adatom can be detrimental to CH3OH selectivity and may lead predominantly to CO formation. This casts doubt on the effectiveness of M/In2O3 SACs in promoting the methanol synthesis reaction and raises questions regarding the nature of the metal-induced promotional effect in these catalysts, which significantly limits targeted catalyst design.
Most SACs reported in the literature involve active atomic metal sites over the support surface, where the supports are mostly inactive,24–26 whereas atomic metal promoters present in the bulk of the supports are assumed to have no significant reactivity. However, the M/In2O3 SACs for CO2 hydrogenation are quite unique in that the In2O3 support is catalytically active, and the complex interaction between metal sites and In2O3 can significantly affect catalytic behaviours, so it is a great challenge to design and synthesize highly efficient M/In2O3 SACs for methanol synthesis.
In this work, we performed density functional theory (DFT) calculations and microkinetic simulations to elucidate the role of a platinum (Pt) dopant in Pt/In2O3 SACs for CO2 hydrogenation. Our simulations show that surface atomic Pt sites are detrimental to CH3OH formation, while surprisingly, the presence of bulk atomic Pt dopants greatly enhances CO2 reactivity while maintaining CH3OH selectivity. Our theoretical predictions are confirmed by the synthesis, evaluation, and characterization of several Pt/In2O3 SACs prepared using different methods. This study demonstrates the computer-aided design and experimental realization of highly efficient Pt/In2O3 SACs, and showcases the bulk-doped form of SACs with high performance.
Experimental
Density functional theory calculations
Spin-polarized DFT calculations were performed with the Vienna ab initio simulation package (VASP)27–30 using the Bayesian error estimation functional with van der Waals correlation (BEEF-vdW)31 and the projector-augmented wave (PAW) method.32,33 Transition states were optimized using the climbing-image nudged elastic band (CI-NEB)34 and dimer35 methods as implemented in the transition state tools for VASP (VTST), and were further verified by numerical frequency calculations. Charge density difference analysis was performed using the VESTA program,36 whereas all structures were built and visualized using Materials Visualizer from Materials Studio.The In2O3(111) surface was modelled with a stoichiometric and symmetric p(1 × 1) slab consisting of 72O and 48In atoms distributed in three O–In–O trilayers, where the bottom trilayer was fixed at its bulk position and a vacuum layer of 15 Å was inserted between adjacent slabs. A Γ-centred Monkhorst–Pack k-point mesh of (3 × 3 × 1), an energy cutoff of 400 eV, and a force convergence of 0.03 eV Å−1 were applied in the DFT calculations, similar to our previous works on this system12,37–41
Two types of SAC models for Pt/In2O3 were built by substituting one of the surface and bulk In atoms in the above In2O3(111) slab model. The most probable Pt/In2O3(111) structure in each case was determined by predicting the energetically most favourable location for the substitution, whose thermal stability was further verified by calculating the adhesive energy (ΔEadh) of the Pt single atom from eqn (1)
| ΔEadh = EPt/In2O3(111) − EPt − EVIn/In2O3(111) | (1) |
Surface oxygen vacancy (VO) sites were considered as the active sites for the In2O3 and Pt/In2O3 catalysts in CO2 hydrogenation. Free energies of formation of VO sites (ΔGf,VO) by H2 reduction were calculated from eqn (2)
| ΔGf,VO = ESurface_VO + GH2O − ESurface − GH2 | (2) |
The adsorption energy of an adsorbate A on a slab surface S is defined by eqn (3)
| Ead(A) = Etotal − (Eslab + EA) | (3) |
Similar to the study of Ye et al.,42 the elementary step of the hydrogenation pathway usually involves the reaction of a single H adatom with the intermediate. We performed additional DFT calculations to study the effect of H migration43 from the hydrogen adsorbed at the surrounding Pt/In sites to the In/O sites near the VO site as shown in Fig. S22 and Table S16 (ESI†). In2O3(111) and Ptb_bulk structures were found to have low energy barriers for H migration from one In to the other In (0.34 eV and 0.26 eV, respectively). The energy barriers for H migration from In to O are relatively high (1.18 eV and 1.14 eV, respectively). However, the Ptb_surface model also has relatively high energy barriers for H migration from one In to another In and O (1.15 eV and 1.11 eV, respectively). Moreover, the presence of a second H adatom does not significantly affect the energy barriers of H migration for these three models. Therefore, we hypothesize that our above simplification of the hydrogenation steps should be reasonable.
We further examine the potential synergistic effect of the surface and bulk Pt dopants on the catalytic activity of the surface oxygen vacancy site. The In2O3(111) structure is doped with Pt atoms both at the surface and in the bulk (Ptb_dual), where the main active site is the surface oxygen vacancy Ob_vac site, and the different pathways of the CO2 hydrogenation reaction were calculated for this model as shown in Fig. S23–S26 (ESI†). Comparing the potential energy surfaces of the Ptb_dual and Ptb_surface models, the energy barriers of the elementary steps of CO2 hydrogenation to methanol and the direct CO2 dissociation pathway of the Ptb_dual model are close to those of the Ptb_surface model, while those of most elementary steps of CO hydrogenation to methanol and the CO2 indirect dissociation pathway are higher than those of the Ptb_surface model. Therefore, we focus this work on the single atom doping model.
Microkinetic simulations
The reaction pathways predicted from the DFT calculations for CH3OH and CO formations from CO2 hydrogenation were used to build a multisite microkinetic model for mean-field microkinetic simulations under typical experimental conditions for CO2 hydrogenation using the CatMAP code.44,45 Elementary steps in the microkinetic model are given in Table S8 (ESI†), where “s” and “h” denote the VO and “hydrogen reservoir” sites, respectively. The structures of all the elementary steps are shown in Fig. S21 (ESI†). The ideal gas approximation and harmonic-rigid rotor approximation were employed for calculating the entropies and enthalpies of gaseous molecules and surface adsorbates, respectively. The degrees of rate control (DRC) and degrees of selectivity control (DSC)46,47 proposed by Campbell and implemented in CatMAP were also calculated.Catalytic preparation
Catalyst characterization
Powder X-ray diffraction (XRD) patterns were performed using a Rigaku Ultima IV powder diffractometer equipped with a Cu Kα radiation (λ = 0.15406 Å) operating at 40 kV and 40 mA. The diffractograms were obtained at a 2θ range of 0–90°.The loadings of Pt in the samples were measured by inductively coupled plasma-optical emission spectrometry (ICP-OES) on an Agilent 720 spectrometer.
N2 adsorption–desorption analyses were conducted at 77 K with a Micromeritics ASAP 2420 physisorption analyser. Before the measurement, the samples were outgassed at 300 °C for 10 h under vacuum, and then the surface area was calculated by the Brunauer–Emmett–Teller (BET) method.48
The microscopic features of the samples were characterized using a TEM (JEM-2100F) equipped with energy-dispersive X-ray spectroscopy (EDS) operated at 200 kV. The high-angle annular dark-field scanning TEM (HAADF-STEM) was performed using on a JEOL ARM300F equipped with double aberration correctors and a cold field emission gun.
CO2 temperature-programmed desorption (CO2-TPD) experiments were carried out with an OmniStar GSD320 02 mass spectrometer. First, the catalyst (100 mg) was pretreated at 573 K for 60 min in a flow of pure Ar or H2. Then, the catalyst was saturated in flowing CO2 at 323 K for 1 h followed by flushing in Ar for 3 h to remove any physiosorbed molecules. The CO2-TPD measurement was then performed at 50–1023 K under continuous flow of Ar.
H2 temperature-programmed reduction (H2-TPR) was carried out on a Micromeritics ChemiSorb 2920 with a thermal conductivity detector (TCD). Typically, the catalyst sample (54 mg) was placed in a quartz reactor and pre-treated in flowing Ar at 423 K for 1 h. Then the temperature was raised from 323 to 973 K at a rate of 5 K min−1 with 5% H2/Ar mixture gas.
Electron paramagnetic resonance (EPR) measurements of the free radicals were recorded by using 5,5-dimethyl-1-pyrroline (>99.0%) as a probe at a Bruker EMS-plus instrument (Bruker A300).
The X-ray absorption spectroscopy (XAS) experiments were conducted on the BL11B beamline of Shanghai Synchrotron Radiation Facility (SSRF). Before measurement, the samples were diluted by boron nitride and tableted. The data were collected at room temperature under fluorescence mode by using Lytle detector and the extended X-ray absorption fine structure (EXAFS) data were analysed via Athena software.
X-ray photoelectron spectrometer (XPS) analyses were performed using a Thermo Fisher Scientific ESCALAB 250Xi analyser with Al Kα radiation at 1486.6 eV under 9.9 × 10⁻⁷ torr. Binding energy values of all samples were calibrated based on an C 1s peak at 284.6 eV.
The synchrotron near-ambient pressure X-ray photoelectron spectroscopy (NAP-XPS) experiments were performed at beamline BL02B01 of SSRF. The C 1s photoemission line of C–C at 284.8 eV was used for the calibration. For the CO2 hydrogenation reaction, sample were exposed to a mixture of H2 (1.5 mTorr) and CO2 (0.5 mTorr). For the Ar pretreatment, sample was in the environment of pure H2 at 2 mTorr. For the H2/Ar atmosphere, H2 makes up 10% of all gases.
The in situ synchrotron-based vacuum ultraviolet photoionization mass spectrometry (SVUV-PIMS) study was carried out on the mass spectrometry endstation of the National Synchrotron Radiation Laboratory at Hefei, China. The Ar pretreatment products were monitored at an ionization energy of 11.8 eV, which allowed the detection of HCHO, CH3OH and HCOOH. To detect the intermediates and products formed during CO2 hydrogenation, the Ar pretreated Pt/In2O3 catalyst was exposed to H2/CO2 (3:1) at a flow rate of 80 mL min−1 and a pressure of 8 bar at 300 °C; the photoionization efficiency spectra were collected for 300 s at ionization energies in the range 10.6–11.6 eV in steps of 0.03 eV.
Catalytic evaluation
1.0 g of catalyst (40–60 mesh) with quartz sand mixing in equal volume was placed in a stainless-steel tube reactor. Prior to reaction, the sample was pretreated at 573 K for 1 h in pure Ar (150 mL min−1) and then reactant gas mixture with a H2/CO2/N2 ratio of 73/24/3 and a pressure of 5.0 MPa at 573 K was introduced into the reactor. The effluents were analysed online with a Shimadzu GC-2010C gas chromatograph equipped with thermal conductivity and flame ionization detectors. The CO2 conversion was calculated by an internal normalization method. The catalytic performance after 48 h of reaction was typically used for discussion.The CO2 conversion denoted as X(CO2), CH3OH selectivity denoted as S(CH3OH) and space-time yield (STY) of methanol denoted as STY(CO2) were calculated according to the following equations:
 | (4) |
 | (5) |
 | (6) |
Results
Active sites and reaction pathways on Pt/In2O3 SACs
The stoichiometric In2O3(111) surface shown in Fig. S1a (ESI†) has threefold symmetry, so its surface In and O atoms fall into six and four groups, labelled by Ina–Inf and Oa–Od, respectively. The most stable single-atom Pt/In2O3(111) structures, with the Pt dopant located at the surface and in the bulk, are shown in Fig. 1a and b, respectively, based on the calculated ΔEadh of a bulk Pt atom with the In2O3(111) slab in the presence of a VIn. As shown in Fig. 1c and Table S2 (ESI†), our calculations indicate that the Pt dopant preferably replaces the Inb_surface site for surface doping (denoted as Ptb_surface) and the Inb_bulk site for bulk doping (denoted as Ptb_bulk). In both cases, the ΔEadh values are substantially more negative than the cohesive energy of bulk Pt (ΔEcoh), suggesting the strong interaction of the single atom Pt dopant with the In2O3(111) slab, which may prevent the Pt dopants from self-aggregation.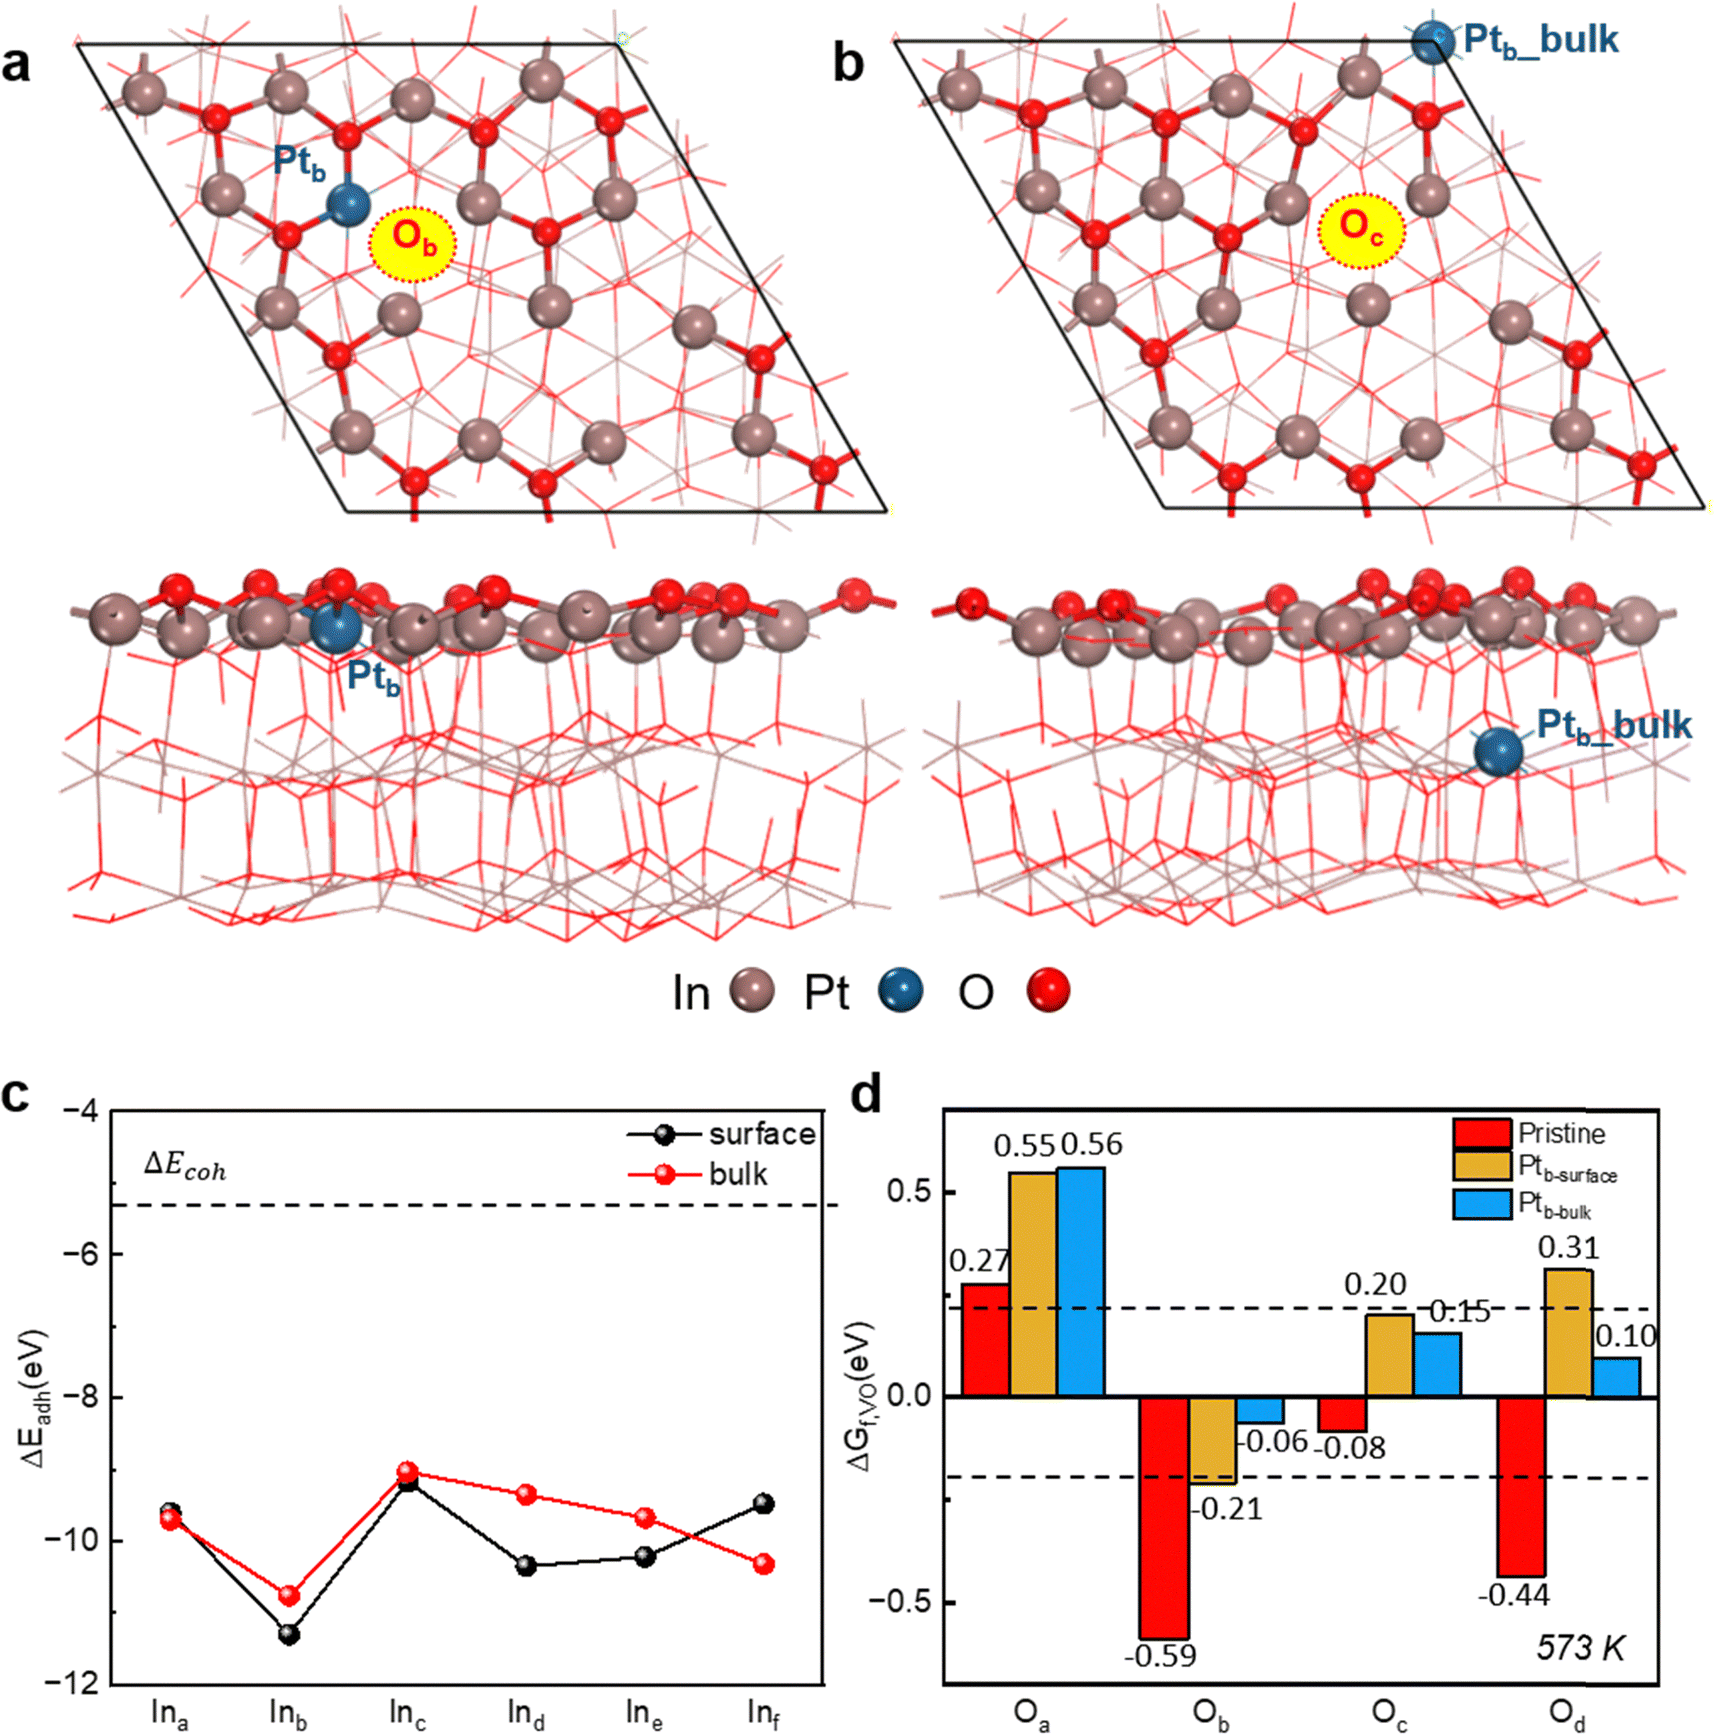 | ||
| Fig. 1 Screening single atom-doped Pt/In2O3 catalyst structures and active sites. (a) Top and side views of the most stable surface-doped Pt/In2O3(111) structure with the Pt dopant located at the Ptb_surface position and the surface oxygen vacancy (VO) situated at the Ob site. (b) Top and side views of the most stable bulk-doped Pt/In2O3(111) structure with the Pt dopant located at the Ptb_bulk position and the surface VO site placed at the Oc site. (c) Calculated adhesive energies of a bulk-doped (red) or surface-doped (black) Pt atom with an In vacancy (VIn) in In2O3(111), which are compared with the cohesive energy of bulk Pt. (d) Calculated free formation energies of surface VO on pristine (red), surface (yellow), and bulk (blue) doped Pt/In2O3(111) for H2 reduction at 573 K. The dashed lines (±0.2 eV) represent a region of near thermoneutrality for the free formation energies considering the typical accuracies of DFT predictions. | ||
Surface VO sites are usually considered the active sites for CO2 hydrogenation, and the VO site, which has a higher ΔGf,VO, is usually suggested to have a higher CO2 reactivity.8 For the surface and bulk-doped Pt/In2O3(111) structures, the most favourable VO sites further shown in Fig. 1a and b are located at the Ob and Oc sites (denoted as Ob_vac and Oc_vac), respectively. For the pristine In2O3(111) slab, the most favourable VO site as displayed in Fig. S1b (ESI†) is situated at the Oc site (also denoted as Oc_vac). The most favourable VO site was determined from the calculated ΔGf,VO values of all surface VO sites, as shown in Fig. 1d and Table S3 (ESI†), considering the Sabatier principle.49 As noted above, a VO site with a higher ΔGf,VO value may interact more strongly with CO2, resulting in a higher CO2 reactivity, although its formation by H2 reduction becomes thermodynamically and also possibly kinetically more difficult. Therefore, the most favourable VO site should have the highest ΔGf,VO value, provided that its formation by H2 reduction is exothermic or nearly thermoneutral at the typical reaction temperature, as indicated by the dashed lines in Fig. 1d. For the surface-doped Pt/In2O3(111) model, the Ob_vac site adjacent to the Ptb_surface site is chosen, as CO2 prefers to adsorb at the Ptb_surface–Ob_vac dual site. As shown in Fig. 1d, introducing the Pt dopant either at the surface or in the bulk of the In2O3(111) slab substantially increases the ΔGf,VO values for all four types of surface VO sites, which can be attributed to the deeper reduction of the metal sites surrounding the VO site (Fig. S2 and S3, ESI†). Surface doping of In2O3(111) leads to a deeper reduction of the three metal sites around the Ob_vac site, which suggests a lower stability, consistent with the increase in the ΔGf,VO value from −0.59 eV of the pristine In2O3(111) to −0.21 eV upon introducing the Ptb_surface dopant. Similarly, a deep reduction also occurs at three metal sites around the Oc_vac site in the bulk-doped Pt/In2O3 model, which corresponds to an increase in the ΔGf,VO value from the pristine In2O3(111) of −0.08 eV to 0.15 eV upon Pt doping.
The optimized structures of the important reaction intermediates for CO2 hydrogenation to CH3OH and CO over the surface and bulk-doped Pt/In2O3(111) models are presented in Fig. S4–S6 (ESI†), with their calculated adsorption energies summarized in Table S1 (ESI†). At the Oc_vac site on the pristine In2O3(111) surface, CO2 can weakly physisorb in the ln-CO2* structure or chemisorb in the bt-CO2* structure. Surface Pt doping greatly strengthens CO2 chemisorption at the Ptb_surface–Ob_vac site in the bt-CO2* structure by approximately 1.9 eV, so its CO2 adsorption energy changes from being quite endothermic to quite exothermic. Similarly, CO adsorption at the Ptb_surface site on the surface-doped Pt/In2O3(111) is also much stronger than that at the Oc_vac site on the pristine In2O3(111) surface by 0.8 eV. In contrast, bulk Pt doping only slightly affects the adsorption energies of the various species at the Ptb_bulk–Oc_vac site by <0.2 eV, when compared with those at the Oc_vac site on the pristine In2O3(111) surface. Thus, our calculations show that surface and bulk Pt doping result in distinct impacts on the adsorption properties of Pt/In2O3 SACs. Fig. 2 shows the entire reaction network for CO2 hydrogenation to CH3OH and CO over the Pt/In2O3 SACs. Our calculations show that CH3OH can form directly via the HCOO pathway from stepwise CO2 hydrogenation, or indirectly via the CO hydrogenation pathway from the CO intermediate, which can be produced by direct CO2 dissociation or indirectly via the COOH pathway. Our predicted reaction pathways for CO2 hydrogenation to CH3OH and CO are generally consistent with those found in the recent literature for related catalysts.12,50
 | ||
| Fig. 2 Catalytic cycles for CO2 hydrogenation to CH3OH and CO over Pt/In2O3 SACs. Methanol can form directly from CO2 hydrogenation via the HCOO pathway (blue), or indirectly from the CO intermediate via CO hydrogenation (green), whereas CO can form by direct CO2 dissociation or indirectly by the COOH route (red). _D* and _P* represent the defective and perfect structures with and without an oxygen vacancy, respectively. | ||
Fig. S7 (ESI†) compares the energy profiles of CH3OH formation from direct CO2 hydrogenation via the HCOO pathway (the blue cycle in Fig. 2), with the detailed relative energies given in Table S4 (ESI†). Compared with the relative energies for the pristine In2O3(111) surface, those for the surface-doped Pt/In2O3(111) model are less negative, whereas those for the bulk-doped Pt/In2O3(111) model are more negative except for the HCOO* and [CH2O + 2H]* intermediates. Relative energies of most reaction intermediates and energy barriers of most transition states for the HCOO pathway at the Ptb_surface–Ob_vac site on the Ptb_surface model are the highest, and the rate-determining step (RDS) is CH3O* hydrogenation to CH3OH* with an energy barrier of 2.49 eV. The RDS at the Ptb_bulk–Oc_vac site on the Ptb_bulk model is HCOO* hydrogenation to H2COO* with an energy barrier of 0.69 eV, indicating that the bulk-doped model is beneficial for methanol formation via the HCOO* pathway.
Fig. S8 and S9 (ESI†) show the energy profiles for CO formation from CO2 direct dissociation and via the indirect COOH pathway (red cycle in Fig. 2), with the detailed relative energies given in Tables S5 and S6 (ESI†). The potential energies of the CO2 direct dissociation pathway are generally lower than those of the indirect COOH pathway, suggesting the former to potentially play a more important role than the latter in CO formation. Furthermore, compared with the energy profiles for the pristine In2O3(111) surface, those for the surface-doped Pt/In2O3(111) model are more downhill, whereas those for the bulk-doped Pt/In2O3(111) are more uphill, indicating that CO formation may be suppressed and accelerated by surface and bulk Pt doping, respectively.
Fig. S10 (ESI†) compares the energy profiles for CH3OH formation from the CO intermediate via the CO hydrogenation pathway (the green cycle in Fig. 2), with the detailed relative energies given in Table S7 (ESI†). Compared with the potential energies for the pristine In2O3(111) surface, those for the surface-doped Pt/In2O3(111) model are lower, whereas those for the bulk-doped Pt/In2O3(111) model are rather similar, implying that bulk Pt doping has a less pronounced effect on this route than surface Pt doping. The RDS at the Ptb_surface–Ob_vac site on the Ptb-surface model is CH3O* hydrogenation to CH3OH* with an energy barrier of 1.37 eV, and that at the Ptb_bulk–Oc_vac site on the Ptb-bulk model is CH2O* hydrogenation to CH3O* with an energy barrier of 1.23 eV. From the energy barrier of the RDS, compared with the Ptb-surface model, the Ptb_bulk model may be more favorable for CO hydrogenation to CH3OH.
For the CO2 hydrogenation pathway on the In2O3(111) surface, the earlier study of Frei et al.11 indicates that HCOO* is formed by hydrogenation of the chemisorbed carb-CO2* with an energy barrier of 0.44 eV, whereas in our work, it is formed by hydrogenation of the physisorbed ln-CO2* with a much lower energy barrier of 0.01 eV. In addition, our previous calculations12,41 suggest carb-CO2* is a spectator species. carb-CO2* protonation to CO2OH* must overcome an energy barrier of 0.72 eV, whereas the reverse reaction has a much lower energy barrier of 0.25 eV, indicating that it is kinetically more favourable for CO2OH* dissociation back to the carb-CO2*, i.e., the reaction is endoergic. Furthermore, CO2OH* dissociation to [ln-CO2 + OH]* needs to overcome an energy barrier of 0.61 eV, which is higher than that for CO2OH* dissociation back to the carb-CO2* of 0.25 eV. The above two findings indicate that carb-CO2* is a spectator species. Finally, our previous calculations41 also suggest carb-CO2* hydrogenation to the bi-HCOO* to be kinetically unfavourable with an energy barrier of 1.01 eV.
The previous work of Cannizzaro et al.23 focused on Ni-promoted In2O3 catalysts using the Ni1-doped, Ni1-adsorbed, and Ni8-cluster models. For CO2 hydrogenation in the HCOO* pathway, the RDS for the Ni1-doped model is HCOO* hydrogenation to H2COO* with a high energy barrier of 3.26 eV, whereas the energy barrier of this step for the Ptb_surface model is much lower at 0.55 eV. On the other hand, the RDS on the surface-doped Pt/In2O3 model is CH3O* hydrogenation to CH3OH* with an energy barrier of 2.49 eV, whereas the energy barrier of this step for the Ni1-doped model is much lower at 1.02 eV from their calculations.23 In addition, for the Ni1-doped model, their calculations23 show that the CH2O* intermediate is obtained from H2COOH* dissociation, and the subsequent cleavage of the C–O bond in H2COOH* yields CH2O* and OH* with an energy barrier of 1.01 eV. In comparison, for the Ptb_surface model, our calculations show that CH2O* is formed by H2COO* dissociation with an energy barrier of 1.34 eV. For CO formation via the CO2 direct dissociation pathway, they predicted an energy barrier of 2.40 eV for the Ni1-doped model,23 which is rather similar to that of 2.71 eV for the Ptb_surface model from our calculations. However, they did not study the CO2 indirect dissociation pathway via the COOH* intermediate for the Ni1-doped model.23 For the Ptb_surface model, our calculations show that the RDS is CO2 hydrogenation to COOH* with an energy barrier of 1.70 eV, considerably lower than that for the CO2 direct dissociation pathway. The above comparison thus indicates that despite the apparent similarity between the catalyst model and the metal dopant for the surface-doped Ni/In2O3 and Pt/In2O3 SACs, the energy barriers of the elementary steps and the identity of the RDS can be quite different especially for CH3OH formation via the HCOO pathway.
Microkinetic simulations of CO2 hydrogenation on Pt/In2 O3 SACs
For quantitative prediction of the catalytic performance of the Pt/In2O3 SACs, multisite mean-field microkinetic simulations using our DFT energetics were performed; all the reaction routes shown in Fig. 2 were included in the microkinetic models. Fig. 3a shows the calculated turnover frequencies (TOFs) for CO2 consumption under the typical reaction conditions of 473–673 K and 5 MPa (H2:CO2 = 3:1). We predict that the Ptb_bulk–Oc_vac and Ptb_surface–Ob_vac sites exhibit considerably higher and lower CO2 reactivity, respectively, indicating that bulk Pt doping, not surface Pt doping, may facilitate the CO2 hydrogenation reaction. Fig. 3b further displays the calculated CH3OH selectivities under the above reaction conditions, which consistently decrease as the reaction temperature increases for all three model surfaces. For the pristine In2O3(111) surface, we predict that the CH3OH selectivity decreases from ∼97% at 523 K to ∼85% at 573 K, in reasonable agreement with the experimental observations for the pure In2O3 catalyst described in the following section. The bulk-doped Pt/In2O3(111) model is predicted to exhibit a very similar profile for the CH3OH selectivity in the simulated temperature range, whereas the surface-doped Pt/In2O3(111) model is found to clearly favour CO formation with a very low CH3OH selectivity even at the low reaction temperature of 473 K. Further simulations were performed to study the effect of Pt loading on CO2 reactivity and CH3OH selectivity at 573 K for the bulk-doped Pt/In2O3(111) model as shown in Fig. 3c, indicating that at a relatively low reaction temperature, increasing the Pt loading for bulk doping may enhance the CO2 reactivity 100× without significantly lowering CH3OH selectivity.
 | ||
| Fig. 3 Microkinetic simulations of the catalytic performance of Pt/In2O3 SACs. (a) and (b) Plots of the calculated turn-over frequencies (TOFs) for CO2 consumption (a) and CH3OH selectivities (b) for CO2 hydrogenation over the pristine In2O3(111) surface (black) and the surface and bulk-doped Pt/In2O3(111) models (red and blue, respectively) under the reaction conditions of 473–673 K, 5 MPa, and H2:CO2 = 3:1. (c) Plots of simulated TOFs for CO2 consumption (black) and CH3OH selectivities (red) for CO2 hydrogenation over the bulk-doped Pt/In2O3(111) model catalyst at different Pt loadings at 573 K. (d)–(f) Calculated DRC for the elementary steps during CO2 hydrogenation over the pristine In2O3(111) surface (d) and the surface and bulk-doped Pt/In2O3(111) models (e and f, respectively). | ||
Fig. 3d shows the calculated DRC for CO2 consumption at the Oc_vac site on the pristine In2O3(111) surface, indicating a strong dependence of the DRCs on reaction temperature. At relatively low reaction temperatures from 473 K to 598 K, the DRC of H2CO* hydrogenation to H3CO* (R6) is the largest, suggesting that this elementary step is the rate-determining step, and that lowering this energy barrier will lead to higher CO2 reactivity. At a higher reaction temperature, OH* hydrogenation to H2O* to form an oxygen vacancy (R11) is the RDS, whereas lowering the energy barrier of H2CO* hydrogenation to H3CO* has a much less pronounced effect on the overall CO2 reactivity. Fig. 3e displays the calculated DRC values for the CO2 reaction rate at the Ptb_surface–Ob_vac site on the surface-doped Pt/In2O3(111) model. CO2* direct dissociation (R14) is the RDS for CO2 conversion at 473–673 K, suggesting that lowering its energy barrier should lead to higher CO2 reactivity. This result is consistent with the very high energy barrier of 2.71 eV for CO2 direct dissociation on the surface-doped Pt/In2O3(111) model (Fig. S8 and Table S5, ESI†), although the bt-CO2* structure has a very negative adsorption energy of −0.78 eV. On the other hand, the DRCs of the elementary steps related to CH3OH formation are consistently low above 473 K, as the product composition is dominated by CO. Fig. 3f further shows the calculated DRCs for the CO2 reaction rate at the Ptb_bulk–Oc_vac site on the bulk-doped Pt/In2O3(111) model. Below 600 K, the DRCs of the OH* hydrogenation to generate the VO site (R11) are largest, suggesting VO formation to be the rate determining step, consistent with the much higher free formation energy of the Oc_vac site on this surface (Fig. 1d). This also agrees with the calculated coverages of the surface species shown in Fig. S11c (ESI†), suggesting that the free sites are mostly occupied by OH* at relatively low temperatures. At higher reaction temperatures, the DRC of direct CO2* dissociation (R14) becomes largest, as CO becomes the main product. The calculated DSC for CH3OH shown in Fig. S12 (ESI†) are also very sensitive to the reaction temperature, especially for the pristine In2O3(111) surface and the bulk-doped Pt/In2O3(111) model.
To reveal the effect of Pt doping on the electronic structure of the In site on the catalyst surface, projected density of states (PDOS) analysis was performed for the relevant structures. As shown in Fig. S13a (ESI†) for the Inc site in the presence of both H* and HCOO* adsorbates, the PDOS of the various Inc orbitals as well as the H* orbitals are all shifted to lower energies upon introducing a bulk Pt dopant. Similar observations were made for the effects of the bulk Pt dopant on the PDOS of the Inc orbitals without the presence of either the H* or HCOO* adsorbate, suggesting that introducing the bulk Pt dopant has significant influence on the redox property of the surface Inc site. Meanwhile, as discussed earlier, the Bader charge analyses shown in Fig. S2 and S3 (ESI†) suggest a deeper reduction of the three In sites around the Oc_vac site upon introduction of the bulk Pt dopant, consistent with an increase in the ΔGf,VO value.
Furthermore, crystal orbital Hamilton population (COHP) and integrated COHP (ICOHP) analyses were also performed as shown in Fig. S13b (ESI†) to understand the effect of the bulk Pt dopant on the interaction between Inc and H* in the presence of HCOO*. The increase in the negative ICOHP value at the Fermi surface indicates that introducing the bulk Pt dopant will strengthen the orbital interaction between Inc and H*, consistent with the predicted stronger H* adsorption and the lower effective energy barrier of HCOO* hydrogenation (Table S4, ESI†), leading to enhanced reactivity of the bulk-doped In2O3 catalyst. However, CO2 adsorption on the surface-doped Pt/In2O3(111) model is too strong, leading to much higher energy barriers for its subsequent hydrogenation. Whereas the RDS step in the HCOO pathway for the Ptb_bulk model is HCOO* hydrogenation to H2COO* with a modest energy barrier of 0.69 eV, that for the Ptb_surface model is CH3O* hydrogenation to CH3OH* with a much higher energy barrier of 2.49 eV.
The formal oxidation states of the Pt single atom sites in the surface-doped and bulk-doped Pt/In2O3 models are estimated to be both +3.5 based on the calculated Bader charges, when compared with those of bulk Pt and its various oxides as shown in Fig. S13b and Table S14 (ESI†). Upon the formation of a VO on the surface, the formal oxidation states of the Pt single atom sites in the surface-doped and bulk-doped Pt/In2O3 models become +1.9 and +3.5, respectively. Thus, the formal oxidation state of the surface-doped Pt is significantly affected by the formation of the nearby VO, as the Bader charge of Ptb_surface significantly decreases from 1.40 |e| to 0.81 |e| upon the formation of Ob_vac near Ptb_surface (Fig. S2, ESI†). In contrast, the formation of a surface VO on the bulk-doped Pt/In2O3 model has little effect on the formal oxidation state of the bulk Pt dopant, whose Bader charge remains essentially the same at 1.39 |e|. Therefore, our DFT-based microkinetic simulations show that selectively introducing bulk Pt dopants to the In2O3 catalyst can greatly enhance CH3OH productivity by substantially increasing CO2 reactivity while largely maintaining CH3OH selectivity, which suppresses the RWGS activity usually promoted by surface Pt dopants.
Preparation and catalytic performance of Pt-modified In2O3
Based on our theoretical predictions, a series of In2O3 and Pt/In2O3 samples with different Pt contents were synthesized by the hydrothermal method.8 The actual Pt loadings of the Pt/In2O3 samples were measured by ICP-OES to be 0.44, 1.24 and 2.82 wt%, denoted as 0.5Pt/In2O3, 1Pt/In2O3 and 3Pt/In2O3 catalysts, respectively. For comparison, 1Pt/In2O3-DI and 3Pt/In2O3-DI samples with similar Pt concentrations of 1.37 and 3.01 wt%, respectively, were also prepared by the dry impregnation method, in which the Pt species are mostly present on the In2O3 surface. Comparative analysis of surface sensitive XPS and ICP-OES results reveals that compared to 1Pt/In2O3-DI and 3Pt/In2O3-DI, the Pt species in the 1Pt/In2O3 and 3Pt/In2O3 catalysts are mostly distributed in the bulk of In2O3 (Fig. 4a). CO chemisorption provides further evidence that Pt on 1Pt/In2O3 and 3Pt/In2O3 mainly exists in the bulk phase (Table S9, ESI†). | ||
| Fig. 4 Catalytic properties of In2O3 and various Pt-modified In2O3 catalysts. (a) Pt contents of various catalysts characterized via ICP and XPS. (b) Effects of Pt content on CO2 conversion and methanol selectivity over Pt modified In2O3 catalysts prepared by the hydrothermal method. (c) Catalytic performance of 1Pt/In2O3 under different space velocities. (d) and (e) Comparison of CO2 conversion, methanol selectivity (d) and methanol yield (e) as a function of temperature over In2O3 and various Pt-modified In2O3 catalysts. (f) Comparison of the STY and selectivity of methanol over the 1Pt/In2O3 and 3Pt/In2O3 samples in this work and other state-of-the art catalysts (see Table S8 for more details, ESI†). (g) Stability test of 1Pt/In2O3 under standard reaction conditions (5 MPa, 573 K, H2/CO2 = 3:1, GHSV = 9000 mL gcat−1 h−1). | ||
Compared to the pristine In2O3 catalyst, all Pt-doped In2O3 catalysts show much higher activity and methanol yields at 573 K. With increasing Pt content, the CO2 conversion increased significantly to 25.1% over 3Pt/In2O3, which is nearly three times that achieved with pristine In2O3 (8.8%). The methanol selectivity decreased slightly from 75.2% over In2O3 to approximately 70% over 1Pt/In2O3 (Fig. 4b), consistent with our theoretical predictions in Fig. 3b, and then decreased sharply to 46.8% for 3Pt/In2O3. The STY of methanol for 1Pt/In2O3 is as high as 0.41 g gcat−1 h−1 with a CO2 conversion of 18.9%, which is more than twice that of In2O3. The STY of methanol was further enhanced by increasing the GHSV, and that for the 1Pt/In2O3 catalyst reached 1.25 g gcat−1 h−1 with a methanol selectivity of 84.8% at 54000 mL gcat−1 h−1 (Fig. 4c). Fig. 4f and Table S10 (ESI†) show that 1Pt/In2O3 and 3Pt/In2O3 delivered high STYs of methanol together with high methanol selectivity compared with various metal-modified In2O3 and other state-of-the-art catalysts reported in the literature under similar reaction conditions.5,15,16,51–63
The catalytic performances of 1Pt/In2O3-DI and 3Pt/In2O3-DI are much worse than those of bulk-doped 1Pt/In2O3 and 3Pt/In2O3, respectively, especially above 513 K (Fig. 4d and e). The methanol selectivity of 1Pt/In2O3 is nearly identical to that of In2O3 in the entire temperature range studied, whereas 3Pt/In2O3 has much lower methanol selectivity, similar to 1Pt/In2O3-DI, suggesting that the high Pt content in 3Pt/In2O3 may also increase the content of surface Pt doping. As the reaction temperature increases, the methanol selectivity over 1Pt/In2O3-DI decreases more rapidly than that over 1Pt/In2O3, consistent with our theoretical predictions. Compared with 1Pt/In2O3 and 1Pt/In2O3-DI, the increase in the CO2 conversion over 3Pt/In2O3 and 3Pt/In2O3-DI is slower with increasing temperature, resulting in a lower STY of methanol at 573 K. Arrhenius plots for methanol formation in Fig. S14b (ESI†) show that the apparent activation energy for methanol formation for 1Pt/In2O3 and 3Pt/In2O3 are 54.0 and 50.5 kJ mol−1, respectively, which are lower than those for 1Pt/In2O3-DI (61.8 kJ mol−1) and 3Pt/In2O3-DI (68.9 kJ mol−1). This also indicates that bulk-doped 1Pt/In2O3 and 3Pt/In2O3 are kinetically more favourable with lower energy barriers for methanol synthesis. Moreover, the CO2 conversion and methanol yield over 1Pt/In2O3-DI decrease rapidly from 13.0% and 0.26 g gcat−1 h−1 at 16 h, respectively, to 10.7% and 0.20 g gcat−1 h−1 at 118 h (Fig. S14e, ESI†). A significant deactivation was also detected for 3Pt/In2O3-DI (Fig. S14f, ESI†). However, the catalytic performance remains almost constant throughout the 118 h reaction for In2O3, 1Pt/In2O3 and 3Pt/In2O3 (Fig. 4g and Fig. S14c, d, ESI†).
Characterizations of Pt-modified In2O3
For samples prepared by the hydrothermal method, the specific surface area significantly increases to 126 m2 g−1 for 3Pt/In2O3 (Fig. S15a and b, ESI†). In contrast, the surface areas of 1Pt/In2O3-DI and 3Pt/In2O3-DI are much lower than In2O3, indicating that the Pt species might block the pores (Table S9, ESI†). Lattice fringes identified at multiple locations in the HRTEM images of all the samples yield a d-spacing of 0.292 nm, corresponding to the (222) planes of In2O3 (Fig. S16a and b, ESI†). As shown in Fig. S15c (ESI†), only the XRD peaks of the body-centred cubic In2O3 crystalline lattice were observed for all samples. No characteristic diffraction peaks of Pt species were detected, suggesting that the Pt species are highly dispersed on the In2O3, which is attributed to the strong interaction between Pt and In2O3. This is further confirmed by aberration-corrected HAADF-STEM characterization, which showed no obvious Pt nanoparticles (Fig. 5a and b). EDS mappings reveal that Pt is uniformly dispersed throughout the sample. No Pt–Pt contribution, but only the Pt–O contribution is observed by the EXAFS spectroscopy at the Pt L3-edge for all fresh samples (Fig. S17a, ESI†), indicating that the Pt species exist predominantly as isolated atoms, consistent with the HAADF-STEM observations. The fitted Pt–O coordination numbers (CNs) for 1Pt/In2O3-DI and 3Pt/In2O3-DI are 4.1 and 3.8, respectively (Table S11, ESI†), consistent with the surface-doped Pt/In2O3(111) model. These coordination numbers are lower than those for 1Pt/In2O3 (CN = 4.7) and 3Pt/In2O3 (CN = 4.4). X-ray absorption near edge structure spectra in Fig. S17c (ESI†) show that the white-line intensities for the 1Pt/In2O3-DI and 3Pt/In2O3-DI samples are similar to those of PtO2, whereas those for the 1Pt/In2O3 and 3Pt/In2O3 are between those of Pt foil and PtO2, indicating the oxidation state of Pt species (Ptn+, 0 < n < 4).24,64 The Pt 4d5/2 XPS peak can be deconvoluted into three peaks located at 314.2, 315.3 and 317.0 eV (Fig. S18, ESI†), belonging to Pt0, Pt2+ and Pt4+, respectively.21 The atomically dispersed Pt species in the fresh and thermally pretreated samples carry significant amounts of positive charges. These Ptn+ (Pt2+ and Pt4+) cations may thus replace the In3+ ions in the In2O3 lattice or occupy the interstitial sites of 1Pt/In2O3 and 3Pt/In2O3, strongly binding with lattice O2−. For 1Pt/In2O3-DI and 3Pt/In2O3-DI, the Ptn+ cations may be located at defect sites on the In2O3 surface. | ||
| Fig. 5 Characterization of various catalysts. (a) and (b) HAADF-STEM images with the corresponding line-scanning intensity profiles obtained on the magnified areas and the TEM-EDS elemental mappings of 1Pt/In2O3 (a) and 3Pt/In2O3 (b). (c) In situ SVUV-PIMS detection of gas-phase products during the CO2 hydrogenation process. (d) Photoionization efficiency spectra of the signals of m/z 30, 32 and 46 during the CO2 hydrogenation process. (e) The k3-weighted Fourier transform of EXAFS spectra of Pt modified In2O3 catalysts after the CO2 hydrogenation reaction for 1 h. (f) The in situ NAP-XPS spectra collected in the simulated reaction process. (g) and (h) H2-TPR (g) and CO2-TPD (h) profiles of pristine In2O3 and various Pt-modified In2O3 catalysts pretreated in Ar at 573 K for 1 h. | ||
When the SACs were exposed to reducing conditions, the interaction between the metal atoms and the support usually became weaker, resulting in aggregation of the metal atoms.18 Notably, the Pt species in 1Pt/In2O3 and 3Pt/In2O3 remain in the Ptn+ oxidation state after reaction for 48 h (Fig. S17b and e, ESI†), although the Pt–O CN significantly decreases to 2.4 for 1Pt/In2O3 and 2.3 for 3Pt/In2O3 (Table S11, ESI†). Additionally, a lack of Pt–Pt bonds also confirms the atomic dispersion of Pt species in the spent 1Pt/In2O3 and 3Pt/In2O3 SACs. These results indicate the very high stability of the Pt SACs even at a high Pt loading of 2.82 wt%. For the spent 1Pt/In2O3 and 3Pt/In2O3, the Pt–O bond distance remains close to that in PtO2, suggesting strong interactions between Pt and In2O3. However, the Pt species in 1Pt/In2O3-DI and 3Pt/In2O3-DI were obviously reduced to metallic Pt (Fig. S17b, d and e, ESI†), as Pt–Pt bonds originated from the sintering of surface Pt atoms were formed after reaction for only 1 h (Fig. 5e), which promotes the RWGS reaction. In addition, based on the Pt 4d XPS spectra of 1Pt/In2O3-DI and 3Pt/In2O3-DI, the Pt0 peak appeared after reaction for only 1 h, further confirming the aggregation of Pt species. The ratio of Pt0 changed slightly when the reaction time was extended to 48 h (Table S12, ESI†).
XPS analysis was carried out to investigate the chemical states of surface O sites (Fig. S19, ESI†). The O 1s peak at 531.7 eV was assigned to oxygen defect sites (Odefect), and no significant change in the Odefect content was observed for the 1Pt/In2O3 and 3Pt/In2O3 SACs after reaction for 1 h and 48 h. In contrast, the surface Odefect content increased markedly for 1Pt/In2O3-DI and 3Pt/In2O3-DI due to the over-reduction of In2O3 during CO2 hydrogenation, which might inhibit the dissociation of dihydrogen.65 Although the spent 1Pt/In2O3-DI and 3Pt/In2O3-DI have higher surface Odefect contents than the corresponding 1Pt/In2O3 and 3Pt/In2O3 SACs, this does not necessarily mean that they will have higher activities because XPS can probe several nanometres in depth for the samples. Synchrotron NAP-XPS measurements further confirm the change in surface oxygen defects and also provide insights into changes in the outer layers during the reaction. The in situ NAP-XPS data consist of (i) pretreatment at 573 K in 1.5 mTorr Ar, (ii) reduction with 10% H2/Ar (1.5 mTorr) to simulate the initial stage of the reaction, and (iii) reaction at 573 K in 2.0 mTorr of the reaction gas mixture (H2/CO2 = 3:1). As shown in Fig. 5f, the 1Pt/In2O3 sample pretreated at 573 K in Ar contains more thermally induced oxygen vacancies, and exposure to the H2/Ar atmosphere also leads to more H2-induced vacancies. Additionally, the VO content in the reaction atmosphere decreases slightly and remains stable, consistent with the high stability of 1Pt/In2O3. In situ SVUV-PIMS was employed to detect the gas phase products during CO2 hydrogenation on 1Pt/In2O3 as shown in Fig. 5c and d. The signals of m/z at 30, 32, and 42 have ionization thresholds of 10.90, 10.85 and 11.20 eV, respectively, suggesting the presence of HCHO, CH3OH, and HCOOH species during CO2 hydrogenation, which supports our proposed reaction mechanism.
The H2-TPR peak at 469 K shifts to much lower temperatures with the introduction of Pt (Fig. 5g), indicating that the active H adatoms spilling over from the Pt species to In2O3 can enhance the reduction of the In2O3 surface. Additionally, the surface reduction peaks of 1Pt/In2O3 and 3Pt/In2O3 are located at much higher temperatures than those of 1Pt/In2O3-DI and 3Pt/In2O3-DI, so bulk Pt doping makes it more difficult to create VO sites on the In2O3 surface compared to surface doping. CO2-TPD measurements show that for samples prepared by the hydrothermal method, the amount of thermally induced VO sites increases significantly with the increasing Pt loading, while the opposite occurs for surface Pt doping (Fig. 5h and Table S13, ESI†). 1Pt/In2O3 has the largest total amount of VO sites induced by thermal treatment and H2 reduction among all samples (Fig. S20, ESI†), which is further confirmed by the greater intensity of the EPR signal (Fig. S15d, ESI†) for 1Pt/In2O3 than for the other samples, contributing to its higher methanol production.
Conclusions
This study demonstrates the strength of computer-aided design for constructing oxide-based catalysts for industrial reactions; the simulations predicted a bulk-doped SAC with high performance. Our DFT-based microkinetic simulations suggest that introducing bulk Pt dopants to an In2O3 catalyst promotes CO2 reactivity while maintaining CH3OH selectivity. Our theoretical prediction facilitates the development of Pt/In2O3 catalysts with Pt single-atom dopants in the dominantly bulk-doped form, which show more than twice the CO2 conversion rate and high catalytic stability while having similar CH3OH selectivity compared with the pristine In2O3 catalyst. Our synthesized Pt/In2O3 SACs thus exhibit great potential for industrial applications in methanol synthesis from CO2 hydrogenation, and methanol productivity reaches 1.25 g gcat−1 h−1 under the reaction conditions of 5.0 MPa, 573 K and 54000 mL gcat−1 h−1, far exceeding the current reported maximum methanol productivity, which is less than 1.0 g gcat−1 h−1.
Author contributions
S. L., D. A. D. and P. G. conceived the project. Y. W., Z. Z., Q. C., S. L., D. A. D. and P. G. designed the study, analysed the data, and wrote the paper. Y. W., Q. C., B. Q., Y. H., and Y. B. performed DFT calculations. Q. C., Y. W. and K. L. performed microkinetic simulations. Z. Z., S. D., and H. Y. prepared and characterized the samples, and performed the catalytic evaluation. J. M. and J. L. assisted with the XAS experiments. Y. L. assisted with the XPS experiments. All authors discussed the results and commented on the manuscript.Data availability
The data supporting this article have been included as part of the ESI.†Conflicts of interest
There are no conflicts to declare.Acknowledgements
We thank beamline BL11B and BL02B01 at the SSRF, Shanghai, P. R. China as well as beamline BLO4B at National Synchrotron Radiation Laboratory, Hefei, P. R. China for the beam time and assistance with experiments. This work was financially supported by the National Natural Science Foundation of China (22293023, 22172189, 22172188, 22293025, U22B20136), Program of Shanghai Academic Research Leader (22XD1424100), Science and Technology Commission of Shanghai Municipality (23ZR1481700, 23YF1453400), CAS Youth Interdisciplinary Team, Chinese Academy of Sciences, Shanghai Branch (CASSHB-QNPD-2023-024), Joint Fund of the Yulin University and the Dalian National Laboratory for Clean Energy (Grant. YLU-DNL Fund 2022001), and Shell Global Solutions B. V. (CW373032, CW906044). The work at UA was supported by the U.S. Department of Energy (DOE), Office of Science, Office of Basic Energy Sciences (BES), Chemical Sciences, Geosciences, and Biosciences Division, catalysis science program (FWP 47319). D. A. D. thanks the Robert Ramsay Fund of UA for partial support.References
- X. Jiang, X. Nie, X. Guo, C. Song and J. G. Chen, Chem. Rev., 2020, 120, 7984–8034 CrossRef CAS
.
- J. Zhong, X. Yang, Z. Wu, B. Liang, Y. Huang and T. Zhang, Chem. Soc. Rev., 2020, 49, 1385–1413 RSC
- M. Yang, J. Yu, A. Zimina, B. B. Sarma, L. Pandit, J. D. Grunwaldt, L. Zhang, H. Xu and J. Sun, Angew. Chem., Int. Ed., 2023, 62, e202216803 CrossRef CAS
- M. Zabilskiy, V. L. Sushkevich, D. Palagin, M. A. Newton, F. Krumeich and J. A. van Bokhoven, Nat. Commun., 2020, 11, 2409 CrossRef CAS
- X. Liu, J. Luo, H. Wang, L. Huang, S. Wang, S. Li, Z. Sun, F. Sun, Z. Jiang and S. Wei, Angew. Chem., Int. Ed., 2022, 61, e202202330 CrossRef CAS
- S. Kattel, P. J. Ramírez, J. G. Chen, J. A. Rodriguez and P. Liu, Science, 2017, 355, 1296–1299 CrossRef CAS
- P. Amann, B. Klötzer, D. Degerman, N. Köpfle, T. Götsch, P. Lömker, C. Rameshan, K. Ploner, D. Bikaljevic, H.-Y. Wang, M. Soldemo, M. Shipilin, C. M. Goodwin, J. Gladh, J. Halldin Stenlid, M. Börner, C. Schlueter and A. Nilsson, Science, 2022, 376, 603–608 CrossRef CAS PubMed
- Y. Guo, X. Guo, C. Song, X. Han, H. Liu and Z. Zhao, ChemSusChem, 2019, 12, 4916–4926 CrossRef CAS
- H. Li, W. Fang, L.-X. Wang, Y. Liu, L. Liu, T. Sun, C. Liao, Y. Zhu, L. Wang and F.-S. Xiao, The Innovation, 2023, 4, 100445 CrossRef CAS
- H. Li, L. Wang, X. Gao and F.-S. Xiao, Ind. Eng. Chem. Res., 2022, 61, 10446–10454 CrossRef CAS
- M. S. Frei, M. Capdevila-Cortada, R. García-Muelas, C. Mondelli, N. López, J. A. Stewart, D. Curulla Ferré and J. Pérez-Ramírez, J. Catal., 2018, 361, 313–321 CrossRef CAS
- S. Dang, B. Qin, Y. Yang, H. Wang and Y. Sun, Sci. Adv., 2020, 6, eaaz2060 CrossRef CAS
- J. Wang, G. Zhang, J. Zhu, X. Zhang and C. Song, ACS Catal., 2021, 11, 1406–1423 CrossRef CAS
- X. Zhang, G. Zhang, W. Liu, F. Yuan, J. Wang, J. Zhu, X. Jiang, A. Zhang, F. Ding, C. Song and X. Guo, Appl. Catal., B, 2021, 284, 119700 CrossRef CAS
- D. Cai, Y. Cai, K. B. Tan and G. Zhan, Materials, 2023, 16, 2803 CrossRef CAS PubMed
- S. N. H. Dostagir, C. B. Thompson, H. Kobayashi, A. M. Karim and A. Shrotri, Catal. Sci. Technol., 2021, 10, 8196–8202 RSC
- X. Jia, K. Sun, J. Wang, C. Shen and C.-J. Liu, J. Energy Chem., 2020, 50, 409–415 CrossRef
- M. S. Frei, C. Mondelli, R. García-Muelas, K. S. Kley and J. Pérez-Ramírez, Nat. Commun., 2019, 10, 3377 CrossRef PubMed
- N. Rui, F. Zhang, K. Sun, Z. Liu, W. Xu, E. Stavitski, S. D. Senanayake, J. A. Rodriguez and C.-J. Liu, ACS Catal., 2020, 10, 11307–11317 CrossRef CAS
- K. Sun, N. Rui, Z. Zhang, Z. Sun, Q. Ge and C.-J. Liu, Green Chem., 2020, 22, 5059–5066 RSC
- Z. Han, C. Tang, J. Wang, L. Li and C. Li, J. Catal., 2021, 394, 236–244 CrossRef CAS
- J. Zhu, F. Cannizzaro, L. Liu, H. Zhang, N. Kosinov, I. A. W. Filot, J. Rabeah, A. Brückner and E. J. M. Hensen, ACS Catal., 2021, 11, 11371–11384 CrossRef CAS PubMed
- F. Cannizzaro, E. J. Hensen and I. A. Filot, ACS Catal., 2023, 13, 1875–1892 CrossRef CAS
- Z. Zhang, Y. Zhu, H. Asakura, B. Zhang, J. Zhang, M. Zhou, Y. Han, T. Tanaka, A. Wang and T. Zhang, Nat. Commun., 2017, 8, 16100 CrossRef CAS
- Y. Ren, Y. Tang, L. Zhang, X. Liu and T. Zhang, Nat. Commun., 2019, 10, 4500 CrossRef PubMed
- B. Qiao, A. Wang, X. Yang, L. F. Allard, Z. Jiang, Y. Cui, J. Liu, J. Li and T. Zhang, Nat. Chem., 2011, 3, 634–641 CrossRef CAS
- G. Kresse and J. Furthmüller, Comput. Mater. Sci., 1996, 6, 15–50 CrossRef CAS
-
J. Hafner and G. Kresse, in Properties of Complex Inorganic Solids, ed. A. Gonis, A. Meike and P. E. A. Turchi, Springer US, Boston, MA, 1997, pp. 69–82 Search PubMed
- G. Kresse and J. Hafner, Phys. Rev. B: Condens. Matter Mater. Phys., 1993, 47, 558–561 CrossRef CAS
- G. Kresse and J. Furthmüller, Phys. Rev. B: Condens. Matter Mater. Phys., 1996, 54, 11169–11186 CrossRef CAS PubMed
- J. Wellendorff, K. T. Lundgaard, A. Mφgelhφj, V. Petzold, D. D. Landis, J. K. Nφrskov, T. Bligaard and K. W. Jacobsen, Phys. Rev. B: Condens. Matter Mater. Phys., 2012, 85, 5826–5831 CrossRef
- P. E. Blöchl, Phys. Rev. B: Condens. Matter Mater. Phys., 1994, 50, 17953–17979 CrossRef PubMed
- P. E. Blöchl, C. J. Först and J. Schimpl, Bull. Mater. Sci., 2003, 26, 33–41 CrossRef
- G. Henkelman, B. P. Uberuaga and H. Jonsson, J. Chem. Phys., 2000, 113, 9901–9904 CrossRef CAS
- G. Henkelman and H. Jonsson, J. Chem. Phys., 1999, 111, 7010–7022 CrossRef CAS
- K. Momma and F. Izumi, J. Appl. Crystallogr., 2011, 44, 1272–1276 CrossRef CAS
- B. Qin and S. Li, Phys. Chem. Chem. Phys., 2020, 22, 3390–3399 RSC
- B. Qin, Z. Zhou and S. Li, Appl. Surf. Sci., 2021, 542, 148591 CrossRef CAS
- P. Gao, S. Li, X. Bu, S. Dang, Z. Liu, H. Wang, L. Zhong, M. Qiu, C. Yang, J. Cai, W. Wei and Y. Sun, Nat. Chem., 2017, 9, 1019–1024 CrossRef CAS
- P. Gao, S. Dang, S. Li, X. Bu, Z. Liu, M. Qiu, C. Yang, H. Wang, L. Zhong, Y. Han, Q. Liu, W. Wei and Y. Sun, ACS Catal., 2018, 8, 571–578 CrossRef CAS
- B. Qin, Z. Zhou, S. Li and P. Gao, J. CO2 Util., 2021, 49, 101543 CrossRef CAS
- J. Ye, C. Liu, D. Mei and Q. Ge, ACS Catal., 2013, 3, 1296–1306 CrossRef CAS
- Z. Zhou, B. Qin, S. Li and Y. Sun, Phys. Chem. Chem. Phys., 2021, 23, 1888–1895 RSC
- A. J. Medford, C. Shi, M. J. Hoffmann, A. C. Lausche, S. R. Fitzgibbon, T. Bligaard and J. K. Nørskov, Catal. Lett., 2015, 145, 794–807 CrossRef CAS
- C. T. Rettner, Phys. Rev. Lett., 1992, 69, 383–386 CrossRef CAS
- T. C. Campbell, ACS Catal., 2017, 7, 2770–2779 CrossRef
- C. Stegelmann, A. Andreasen and C. T. Campbell, J. Am. Chem. Soc., 2009, 131, 8077–8082 CrossRef CAS
- P. Sinha, A. Datar, C. Jeong, X. Deng and L. C. Lin, J. Phys. Chem. C, 2019, 123, 20195–20209 CrossRef CAS
- A. J. Medford, A. Vojvodic, J. S. Hummelshj, J. Voss and J. K. Nrskov, J. Catal., 2015, 328, 36–42 CrossRef CAS
- X. Wang, J. Pan, H. Wei, W. Li, J. Zhao and Z. Hu, J. Phys. Chem. C, 2022, 126, 1761–1769 CrossRef CAS
- T. Liu, X. Hong and G. Liu, ACS Catal., 2020, 10, 93–102 CrossRef CAS
- B. Hu, Y. Yin, Z. Zhong, D. Wu, G. Liu and X. Hong, Catal. Sci. Technol., 2019, 9, 2673–2681 RSC
- O. Martin, A. J. Martín, C. Mondelli, S. Mitchell, T. F. Segawa, R. Hauert, C. Drouilly, D. Curulla-Ferré and J. Pérez-Ramírez, Angew. Chem., Int. Ed., 2016, 55, 6261–6265 CrossRef CAS
- M. Zabilskiy, V. L. Sushkevich, M. A. Newton, F. Krumeich, M. Nachtegaal and J. A. Bokhoven, Angew. Chem., Int. Ed., 2021, 60, 17053–17059 CrossRef CAS
- Y. Yin, X. Bing, X. Zhou, X. Hong and G. Liu, Appl. Catal., B, 2018, 234, 143–152 CrossRef CAS
- C. Meng, G. Zhao, X. R. Shi, P. Chen, Y. Liu and Y. Lu, Sci. Adv., 2021, 7, abi6012 CrossRef
- M. M. J. Li, H. Zou, J. Zheng, T. S. Wu, T. S. Chan, Y. L. Soo, X. P. Wu, X. Q. Gong, T. Chen, K. Roy, G. Held and S. C. E. Tsang, Angew. Chem., Int. Ed., 2020, 59, 16039–16046 CrossRef CAS
- Y. Wang, D. Wu, T. Liu, G. Liu and X. Hong, J. Colloid Interface Sci., 2021, 597, 260–268 CrossRef CAS
- V. Dybbert, S. M. Fehr, F. Klein, A. Schaadt, A. Hoffmann, E. Frei, E. Erdem, T. Ludwig, H. Hillebrecht and I. Krossing, Angew. Chem., Int. Ed., 2019, 58, 12935–12939 CrossRef CAS PubMed
- M. Zabilskiy, V. L. Sushkevich, M. A. Newton and J. A. Van Bokhoven, ACS Catal., 2020, 10, 14240–14244 CrossRef CAS
- C. Wu, L. Lin, J. Liu, J. Zhang and D. Ma, Nat. Commun., 2020, 11, 5767 CrossRef CAS PubMed
- J. Wang, G. Li, Z. Li, C. Tang, Z. Feng, H. An, H. Liu, T. Liu and C. Li, Sci. Adv., 2017, 3, e1701290 CrossRef
- F. Sha, C. Tang, S. Tang, Q. Wang, Z. Han, J. Wang and C. Li, J. Catal., 2021, 404, 383–392 CrossRef CAS
- H. Jeong, D. Shin, B. S. Kim, J. Bae, S. Shin, C. Choe, J. W. Han and H. Lee, Angew. Chem., Int. Ed., 2020, 59, 20691–20696 CrossRef CAS
- C. Shen, K. Sun, Z. Zhang, N. Rui, X. Jia, D. Mei and C.-J. Liu, ACS Catal., 2021, 11, 4036–4046 CrossRef CAS
Footnotes |
| † Electronic supplementary information (ESI) available. See DOI: https://doi.org/10.1039/d4ey00218k |
| ‡ These authors contributed equally: Yuchen Wang, Zixuan Zhou, Qingyu Chang and Bin Qin. |
| This journal is © The Royal Society of Chemistry 2025 |