 Open Access Article
Terrestrial and marine sources of ice nucleating particles in the Eurasian Arctic†
Guangyu
Li‡
 *a,
André
Welti
 b,
Arianna
Rocchi
c,
Germán Pérez
Fogwill
b,
Manuel
Dall'Osto
c and
Zamin A.
Kanji
b,
Arianna
Rocchi
c,
Germán Pérez
Fogwill
b,
Manuel
Dall'Osto
c and
Zamin A.
Kanji
 *a
*a
aInstitute for Atmospheric and Climate Science, ETH Zurich, Switzerland. E-mail: lgy526462219@gmail.com; zamin.kanji@env.ethz.ch
bFinnish Meteorological Institute, Helsinki, Finland
cDepartment of Marine Biology and Oceanography, Institute of Marine Sciences (ICM, CSIC), Barcelona, Spain
First published on 2nd December 2024
Abstract
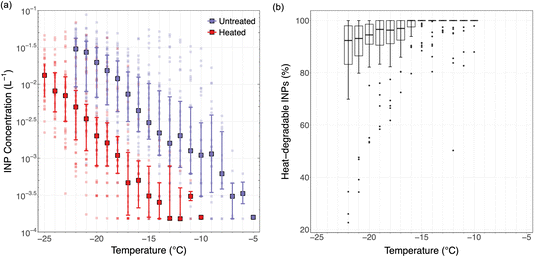
Ice nucleating particles (INPs) catalyze primary ice formation in Arctic low-level mixed-phase clouds, influencing their persistence and radiative properties. Knowledge of the abundance and sources of INP over the remote Arctic Ocean is scarce due to limited data coverage, particularly in the Eurasian Arctic. This study presents summertime measurements of INP concentrations in seawater, fog water and air from the ship-based Arctic Century Expedition, exploring the Barents, Kara, and Laptev Seas, and the adjacent high Arctic islands and archipelagos in August and September 2021. Heat sensitivity tests of ambient aerosols revealed that heat-liable, biogenic INPs make up the majority of Arctic INP populations at temperatures above −20 °C, and to a lesser extent down to −25 °C. INP content in fog water is found to be similar to ambient aerosol, indicating that INP in marine air could also act as cloud condensation nuclei. Measurements of aerosolized INPs using an on-board sea-spray aerosol bubble tank generator exhibit a positive correlation with ambient INP concentrations, but not with INP abundance in seawater samples. INP concentrations in air derived from sea water samples (using a NaCl conversion factor representative for the Arctic) were significantly lower than those measured in ambient air or bubble tank experiments. INP concentrations in bubble tank experiments positively correlated with the phosphate and fluorescence signals in the water. This suggests an important role of the aerosolization mechanism for preferentially partitioning biogenic INPs to the atmosphere.
1 Introduction
Ice nucleating particles (INPs) trigger primary ice formation in mixed-phase clouds (MPCs), which modulate the cloud radiative and microphysical properties.1,2 Accurate simulations of cloud properties in climate models require a realistic representation of INPs.3 The concentration of INPs influences the number, size, and phase partitioning of hydrometeors in clouds, which in turn affect the cloud albedo, lifetime, and might impact precipitation patterns. In the Arctic, cloud cover impacts the regional energy balance while the amount of snow-producing clouds affects the formation of sea ice. A scarcity of INP observations limits our understanding of the abundance and sources of INPs in different environments. The Eurasian Arctic Ocean is of particular interest because it could be the source of highly active INPs.4INPs can originate from terrestrial and marine sources. Mineral dust particles are a significant terrestrial source, capable of initiating ice nucleation (IN) at temperatures lower than approximately −15 °C.5 Known sources of mineral dust near the Arctic Ocean include the Arctic coasts of Greenland,6 the Russia coast,4 glacial outwash plains in Svalbard,7 and sandy deserts on Iceland.8 Marine INP sources in the Arctic Ocean are related to sea-spray aerosol (SSA), generated through wave breaking and bubble bursting, which represents another crucial source of INPs in the high-latitude Arctic Ocean.9–12 The production rate of SSA varies with meteorological conditions (e.g., wind speed, and sea surface temperature13,14) and sea ice coverage.13 Also both the abundance of different components in seawater and the aerosolization process at the ocean–atmosphere interface impact aerosol emission and partitioning.12,15 In addition to inorganic sea salt and sulfate, SSA contains marine biogenic aerosol, which can be composed of particulate microbes, phytoplankton cell exudates,16,17 and dissolved organic macromolecules18 released during phytoplankton blooms. These components can be IN-active at temperatures as high as −5 °C.19 It is hypothesized that the emission of IN-active marine biogenic aerosol could coincide with marine phytoplankton blooms and co-emission of biogenic aerosol precursors, such as dimethyl sulfide (DMS) and chlorophyll-a.20–22 As the Arctic warms and sea ice retreats, marine biological processes are likely to become more active which could change the marine INP emission. Uncovering the sources and understanding the mechanisms of marine biogenic aerosol release into the atmosphere is therefore needed for predicting the abundance of Arctic low-level MPCs in the future.23,24
In this work, we present ship-borne measurements of INP concentrations (NINP) sampled from different environments (seawater, fog water, marine air, and air from a bubble tank generator) and related aerosol properties during the Arctic Century Expedition in the summer of 2021 over the Barents, Kara and Laptev Seas and the adjacent high Arctic islands and archipelagos in the Eurasian Arctic, a region that has not been studied before.
2 Methods
2.1 Campaign overview
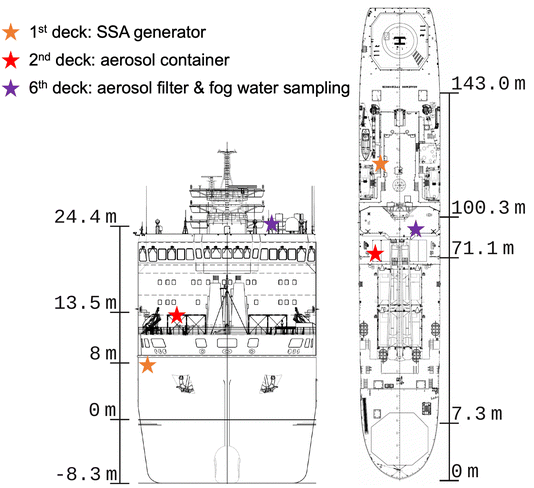
The Arctic Century Expedition took place from 5th August to 6th September 2021, starting and ending at the port of Murmansk, Russia. Fig. 1 shows the location of experiments, instruments and samplers on board the research vessel (RV) Akademik Tryoshnikov reported in this work. Detailed information on instrument configurations and their functions in each sector is given in Table 1. For measurements on the 1st deck, an aerosol generation bubble tank (BT) system for controlled SSA generation was set up. Inside the BT, aerosol is generated by simulating the bubble-bursting mechanisms using water jets to create bubbles. Water samples include 32 L seawater collected at 2 m depth with Niskin bottles using a Conductivity–Temperature–Depth (CTD) rosette sampling system or freshwater samples collected on land using sampling buckets (see sampled water locations in Fig. 2). The SSA generated in the BT was collected on filters for NINP measurements, and characterized for the size distribution by a scanning mobility particle sizer (SMPS) and an optical particle counter (OPC). Fresh and seawater samples used for BT experiments were also filtered for biochemical analysis (see Rocchi et al.25 for details on BT experiments and analysis of biological variables). On the 2nd deck, an aerosol container configured as a laboratory included interval sampling of ambient aerosol by a liquid impinger (for INP analysis), and continuous characterization of particle size distributions with an SMPS and an aerodynamic particle sizer (APS). On the 6th deck, several fog water collectors were installed next to a low volume PM10 filter sampler (LVS) (Table 1). The LVS sampled ambient aerosol continuously for 12 h per filter along the ship track during the campaign. The fog water and filters were analyzed for INPs in the laboratory after the campaign. Additionally, several near-shore surface microlayer (SML) and underlying subsurface seawater (SSW) samples were collected. The locations of fog water, sea- and freshwater, SML and SSW samples are marked in Fig. 2. Detailed experimental setups for sample collections and measurements are described in the following section.| On-board location | Instrument | Temporal resolution | Flow rate | Function |
|---|---|---|---|---|
| 1st deck | CTD-rosette | Station-based | — | Seawater sampling |
| Aerosol generator (BT) | Station-based | — | Aerosol generation from sampled water | |
| SMPS (BT-aerosol) | 4 min | 0.6 L min−1 | Online particle size distribution (<0.6 μm) | |
| OPC (BT-aerosol) | 5 s | 2.83 L min−1 | Online particle size distribution (>0.3 μm) | |
| Water filter | Station-based | — | Water filtration for biochemical analysis | |
| BT aerosol filter | 6–20 h | 10 L min−1 | Aerosol collection on filters for offline INP analysis | |
| 2nd deck | Impinger | 3 h | 300 L min−1 | Aerosol collection in water for offline INP analysis |
| SMPS | 4 min | 0.6 L min−1 | Ambient particle size distribution (0.012–0.6 μm) | |
| APS | 4 min | 1 L min−1 | Ambient particle size distribution (0.5–20 μm) | |
| 6th deck | Fog water collector | 6–12 h | — | Fog water collection for offline INP analysis |
| LVS (PM10 inlet) | 12 h | 38.3 L min−1 | Aerosol collection on filters for offline INP analysis | |
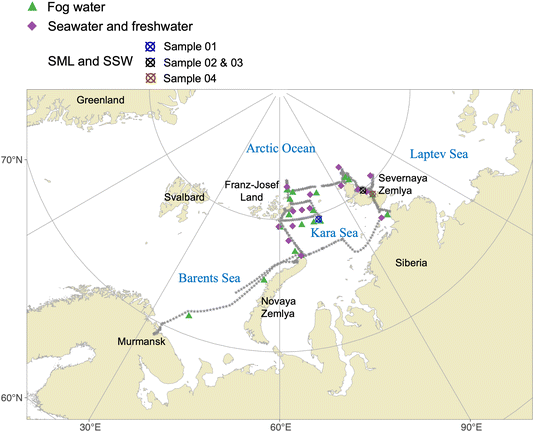 | ||
| Fig. 2 Map of water sampling locations during the Arctic Century Expedition. The gray asterisks represent the ship's track (1 h interval) throughout the expedition. | ||
2.2 Sample collection
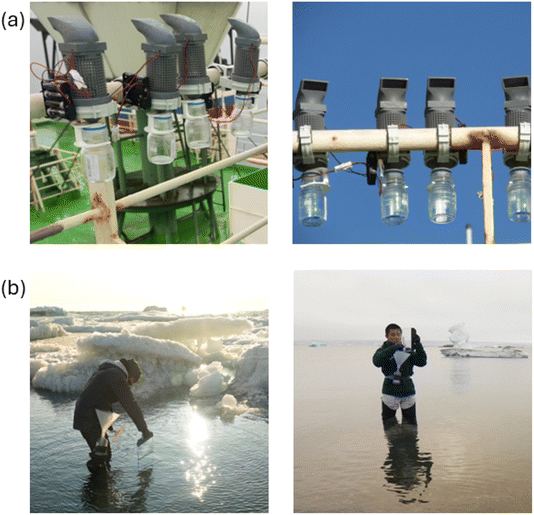
To compare any enrichment of INPs between the sea surface microlayer (SML, a sub-millimeter layer located at the interface between the ocean and atmosphere) and subsurface water (SSW), seawater was sampled at the coastal regions (see Fig. 2) accessed by a helicopter. Four SML samples were collected following the procedure shown in Fig. 3b. A clean glass plate is repeatedly vertically submerged and withdrawn from the sea surface to collect SML samples.27 The thin microlayer film attached to the plate is then transferred into sample bottles using a Teflon scraper to wipe down the glass plate. Four SSW bulk seawater samples were sampled by directly submerging sample bottles to about 50 cm below the ocean surface in parallel to the SML sampling.
For BT experiments, 30 L (of the sampled 32 L) of either sea or freshwater was used for aerosol generation. The 13 seawater samples were collected from a depth of 2∼4 m using the uppermost Niskin bottle from a SEA-BIRD CTD rosette sampling system. The 3 freshwater samples were collected using a plastic bucket from an island river, island lake, and island runoff (at the shore of Pioneer Island, October Revolution Island, and a lake on Cape Baranov, respectively, see Fig. 2). 2 L of each water sample was filtered to analyze biogeochemical variables.25 All samples (fog water, SML and SSW, water filters, water filtrates, and unfiltered water) were stored frozen at −20 °C until analyses.
Conductivity was measured prior to analyzing the INP concentrations for seawater samples to account for the freezing point depression from dissolved sea salt. The corrected freezing temperature was calculated according to Koop and Zobrist,28 and following the procedure of Wilson et al.10
2.3 INP analysis with DRoplet Ice Nuclei Counter Zurich (DRINCZ)
Aqueous particle suspensions were used for immersion-mode INP analysis using DRINCZ.29 After frozen storage, impinger samples were allowed to melt at 4 °C overnight before analysis. Membrane filter samples were immersed in 10 to 15 mL ultra-pure water and agitated using a sonicator for 30 min to resuspend the particles from filters into the water. Each liquid sample was pipetted into a Polymerase Chain Reaction (PCR) tray with 96 aliquots of 50 μL and cooled in an ethanol bath at 1 °C min−1. Freezing events were detected optically from the change in transparency of an aliquot upon freezing. INP concentration (NINP) was derived from the frozen fraction of aliquots at each integer temperature following Vali.30 For aerosol samples collected by impinger and LVS filters, NINP is calculated as per volume of sampled air: | (1) |
 | (2) |
| NINP,air(T) = NINP,fog water(T)·Ffog,air | (3) |
Field blanks undergoing the same procedures as the samples were collected every three days during the campaign. The NINP were corrected for the background of the blanks according to Vali,32 by subtracting the differential INP spectrum of the blanks from the samples. Based on the limit of detection (LOD) from the collected sample volume and the purity of the nano-pure water, the highest temperature for NINP detection was approximately −5 °C (above which sampled air volumes are deemed too low to detect any INPs), and the lowest temperature at which NINP can be reliably reported is −25 °C (below which nano-pure water initiates freezing). The overall uncertainty of the reported freezing temperatures is ±0.9 °C.29
2.4 Heat treatment of INP samples
Macromolecules originating from biological species (e.g., bacteria and phytoplankton) typically comprised of proteins can effectively catalyze ice nucleation33 and are heat labile. Heating effectively unfolds the proteinaceous structure, degrading their IN ability.33,34 In the post-campaign heat treatment, liquid samples extracted from the 50 LVS filters were subjected to 95 °C for 20 min. After cooling to room temperature, the samples were redistributed to PCR trays for INP analysis using DRINCZ. By comparing the IN activity before and after heating, it is possible to assess the contribution of heat-labile species to the INP population, which is a proxy to indicate the presence of biological INPs.332.5 Particle size distribution
In the aerosol container laboratory on the 2nd deck, the size distribution of submicron ambient aerosol was measured using an SMPS (Model 3938, consisting of a 3082 classifier, a 3081 long differential mobility analyzer, and a 3787 Condensation Particle Counter, TSI Inc.). The SMPS operated at a sampling flow rate of 0.6 L min−1 with a sheath-to-sample ratio of 10![[thin space (1/6-em)]](https://www.rsc.org/images/entities/char_2009.gif) :
:![[thin space (1/6-em)]](https://www.rsc.org/images/entities/char_2009.gif) 1, covering a size range of approximately 12 to 600 nm in electrical mobility diameter. A charge correction was applied to account for the misclassification of larger particles carrying multiple charges. Concurrently, the size distribution of coarse-mode particles (ranging from approximately 0.5 to 20 μm in aerodynamic diameter) was monitored using an APS (Model 3321, TSI Inc.) at a flow rate of 1 L min−1. Both the SMPS and APS were synchronized to a time resolution of 4 minutes to ensure aligned size distributions. The electrical mobility diameters obtained from the SMPS and aerodynamic diameters from the APS were converted to volume-equivalent diameters, assuming an average particle density of 2 g cm−3.7,35
1, covering a size range of approximately 12 to 600 nm in electrical mobility diameter. A charge correction was applied to account for the misclassification of larger particles carrying multiple charges. Concurrently, the size distribution of coarse-mode particles (ranging from approximately 0.5 to 20 μm in aerodynamic diameter) was monitored using an APS (Model 3321, TSI Inc.) at a flow rate of 1 L min−1. Both the SMPS and APS were synchronized to a time resolution of 4 minutes to ensure aligned size distributions. The electrical mobility diameters obtained from the SMPS and aerodynamic diameters from the APS were converted to volume-equivalent diameters, assuming an average particle density of 2 g cm−3.7,35
To monitor the aerosol size properties generated from the BT experiments, particle size distribution measurements were conducted using a combination of an SMPS and an OPC (Model GT-526S, MetOne). Two diffusion dryers filled with silica gel were used to dry the particles before entering the SMPS and the OPC. The SMPS was configured the same as in the aerosol container. The OPC provided 6-binned particle count in optical diameter (i.e., >0.3 μm, >0.5 μm, >1 μm, >2.5 μm, >5 μm and >10 μm) to extend the range of size distributions.
2.6 Chemical composition analysis
Inductively coupled plasma-optical emission spectrometry (ICP-OES, Model 5100, Agilent Technologies) was used to detect 11 selected elements (Al, Ca, Cl, Fe, K, Mg, Mn, Na, P, S, Si) in the 75 aerosol suspension samples collected by the impinger. The impinger samples were diluted by a factor of 10 with 2% HNO3 solution prior to the chemical analysis. Quality control was established by the measurement of blank samples and standard reference materials of each element processed in parallel (see details of experimental protocols in Gilli et al.36). The resulting elemental concentrations for Cl, Fe, Mn, and K were below the LOD and thus are not discussed. The remaining elements were analyzed in this work, including P, S, and joint classes of AlSiCa and NaMg, representing dust and sea salt components, respectively, according to the standards introduced in Hiranuma et al.37A total of 16 water samples (13 seawater + 3 freshwater) used for BT experiments were collected (including water filters, water filtrates and unfiltered water) for subsequent quantification of a series of biogeochemical variables, including chlorophyll-a (Chl-a), fluorescence, glucose, dissolved organic carbon (DOC), total dissolved nitrogen (TDN) and inorganic components, e.g., nitrate (NO3−), phosphate (PO43−) and silicate. For Chl-a measurements, the sample was extracted from filters using 90% acetone for photometric analyses. Fluorescence was measured with a fluorescence probe installed on the downward cast of the CTD-rosette. Samples for DOC and TDN were collected in combusted glass ampoules (8 h, 500 °C) and subsequently acidified with 85% phosphoric acid, heat sealed immediately, and stored at 4 °C in the dark until analysis by applying the high-temperature catalytic oxidation method.38 More detailed analytical procedures are described in Rocchi et al.25 and von Jackowski et al.39
3 Results and discussion
3.1 INPs in different Arctic environments
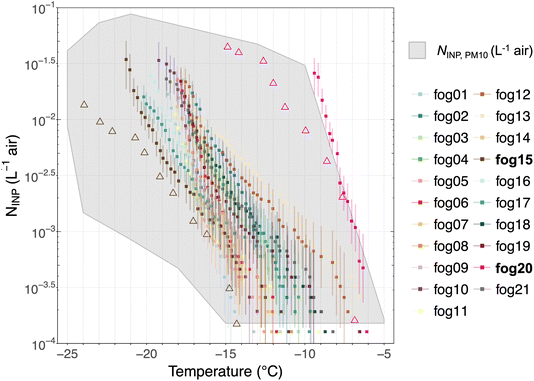 | ||
| Fig. 5 Cumulative INP spectra of fog water samples compared with ambient INP concentration measured from LVS filters. NINP in fog water was derived by converting to NINP in air using a fog water content of 0.1 g mair−3 (Costabloz et al.,31 see Section 2.3 for details). The error bars show the 95% confidence intervals derived following Agresti and Coull.48 The triangles represent the NINP measured by the LVS concurrently with “fog15” and “fog20”. | ||
N INP in the fog water varies by a factor of 5 to 10 at T < −15 °C. The variation becomes larger at warmer temperatures, primarily due to the higher uncertainty from the low number of active INPs at higher temperatures. However, this variation is constrained compared to NINP in ambient aerosol. One reason for the lower variability in NINP could be that ambient air is often influenced by long-range transport of INPs from diverse sources, which results in a larger natural variability in NINP depending on the atmospheric conditions in the boundary layer and air mass history. Also enhanced random dilution could broaden the NINP. The ambient NINP was positively correlated (moderate to strong) with NINP in concurrent fog water samples (results shown in Table A1 in the ESI†), which suggests that their sources overlap but some differences still exist. In particular, the highest correlation was observed for NINP at −20 °C. At these temperatures, mineral dust (from long-range transport) is IN-active or heat resistant silicates from biogenic sources could contribute to both INPs in fog water and ambient INPs. The lower correlation at higher temperatures suggests different dominant INP sources at these temperatures for ambient and fog water samples.
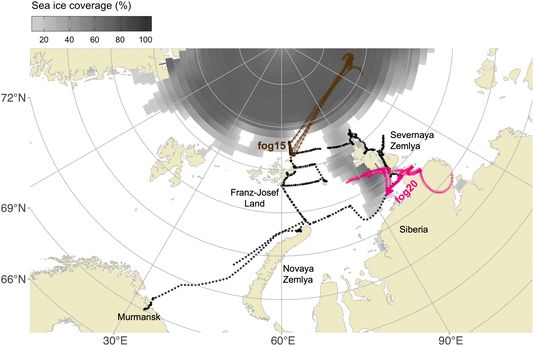
The sample “fog20” (Fig. 5) exhibited the highest NINP compared to the other samples. To better understand the characteristics of this sample, we plot the 2 days air mass backward trajectories for the high (“fog20”) and low (“fog15”) NINP samples in Fig. 6 together with the sample collection period and location. For “fog20”, the ship traveled in the middle of Severnaya Zemlya and the North Siberia Peninsula during the sampling period where local terrestrial sources of INPs are in the vicinity of the ship-track (see pink “fog20” trajectory in Fig. 6). The air mass history indicates that the North Siberia Peninsula could provide terrestrial INP active at high temperatures (below −6 °C) via long-range transport even when the ship moved away from land. Considering the season of the measurements (August/September), thawing permafrost could be one source of INPs.50,51 In addition, mineral dust from the coast of the North Siberia Peninsula and fluvial sediment input into the ocean from the many Siberian rivers could be re-suspended from the ocean surface52 and contribute to the high NINP in sample “fog20”. In contrast, for the low-NINP sample “fog15”, the ship was located north of Franz-Josef Land, spending some time within the pack-ice. The air masses originated from the central Arctic a region completely covered by sea ice, which besides INP released from sublimating blowing snow, lacks significant sources of INPs.
Admittedly, the 48 hours time frame with 0.5° spatial resolution is appropriate for tracking air mass movements from nearby sources but may not capture the influence of long-range transport or finer-scale variability. As a limitation, longer trajectories (e.g., 72–96 hours) could provide insights into potential distant sources but may introduce uncertainties in Arctic regions due to rapid changes in meteorological conditions. Additionally, while the trajectory analysis offers insights into general air mass origins, it does not allow for precise attribution of specific INP sources, especially in complex regions where terrestrial and marine influences converge.
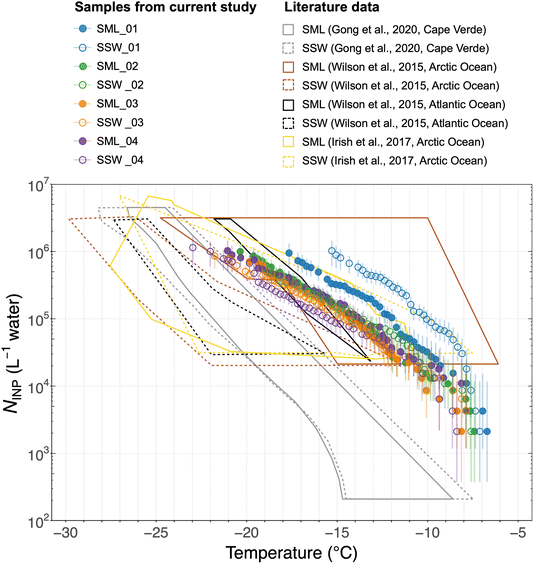 | ||
| Fig. 7 Cumulative INP spectra of sea surface microlayer (SML) and subsurface seawater (SSW) samples. Error bars show the 95% confidence intervals. Literature data10,53,54 of previous measurements of NINP in seawater at different locations are shown for comparison. The freezing temperatures for seawater NINP are corrected for freezing point depression. | ||
3.2 Ocean–atmosphere partitioning of INPs
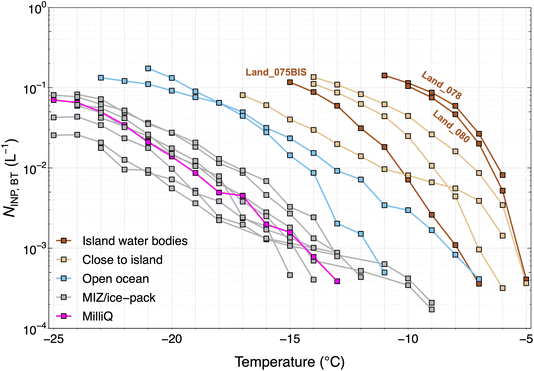
From the isolated experiments of different water samples in the BT, we distinguish the abundance of INPs generated by spray aerosolization of the water samples based on the sampling location. Fig. 8 shows the INP spectra of aerosolized particles from the BT experiments (NINP,BT). Overall, freshwater samples that were collected from rivers and lakes on islands (labeled as “Island water bodies”) and seawater samples collected close-to-islands produced higher aerosolized NINP compared to seawater samples farther away from land (see Fig. 8) supporting strong terrestrial INP sources. The “island water bodies” showing the lowest freezing temperature (Land_075BIS) was sampled on Pioneer Island in the bay in brackish waters as revealed by the intermediate salinity level (see Table A3 in the ESI†). The Land_080 sample was a seawater sample directly in contact with land. Given the highest INP concentrations were observed for samples with zero and high salinity (Land_078 and Land_080, respectively), the contact to land appears to control the INP concentrations observed rather than the salinity level. The influence of salinity is further discussed in later sections. From the seawater samples collected at different locations, NINP,BT was highest for samples obtained close to islands. For seawater samples, reduced NINP,BT was associated with increased sea ice coverage, i.e., NINP,BT produced from samples collected in the open ocean contained more INPs than samples from within the MIZ/ice pack.In Fig. 9 the NINP,BT, ambient NINP (from LVS filters) and NINP in air derived from the SML and SSW samples are shown. To convert the NINP in the SML and SSW samples to that in air, a factor of 10−10 was used that represents the ratio of NaCl in the atmosphere to that in seawater for the Arctic.61 First, we note that the BT-generated INPs overlap strongly with the ambient measurements. This suggests that the ambient INP has strong local sources from the seawater. Due to increased mixing and dilution in the ambient, it is also expected that NINP,BT would be biased higher in the BT than in the ambient as seen in Fig. 9. Secondly, the NINP derived for SML and SSW are much lower than those measured in ambient air and in the BT. This strongly supports the fact that the aerosol production mechanisms that occur at the sea surface (and in the BT) are responsible for preferentially partitioning INPs to the airborne phase. Modeling the bubble or jet bursting process at the sea surface is crucial to capture the true flux of INPs from the ocean to the atmosphere since the enrichment of airborne INPs cannot simply be represented by the mass transfer of NaCl.
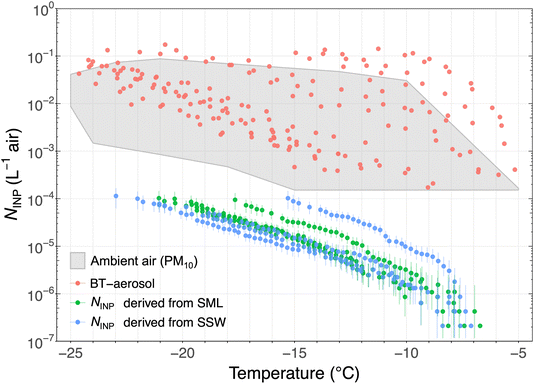 | ||
| Fig. 9 Atmospheric NINP as a function of temperature measured from ambient air by LVS filter with the PM10 inlet (gray shaded area), BT-aerosol collected on filters (red), and NINP derived from SML (green) and SSW (blue) samples, respectively. The factor used to convert NINP in the SML and SSW samples to concentration in air is 10−10.53 | ||
3.3 Correlations of NINP with SSA size and bio-chemical seawater properties
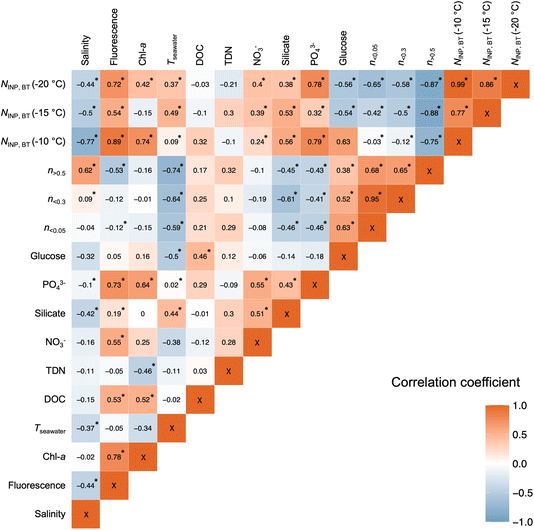
Fig. 10 shows the correlation between a selection of variables measured from the BT experiments during the Arctic Century campaign. Spearman rank correlation coefficients were calculated due to the unknown distribution of each investigated parameter. Notably, NINP,BT negatively correlates with salinity, reflecting INP-rich island water bodies. In addition, weak to moderate correlations were found between NINP,BT and seawater temperature (Tseawater). This could be a purely latitudinal or seasonal effect. However, higher water temperature is reported to boost marine biological productivity by lowering the activation energy of enzymes,62 thereby increasing the emission of IN-active marine biogenic aerosol.Concentrations of several components were measured for the water samples used in the BT experiments. Fig. 10 shows some overall positive and significant correlations were found between NINP,BT and chl-a (except T = −15 °C), fluorescence and phosphate. Although neither of these components is reported to be IN-active, their abundance is a tracer of promoted marine biological activity, from which IN-active organics and biogenic exudates can originate. Recently it was shown that fluorescent particle concentrations are a good predictor for INPs of dust and biological origin.63 No clear correlation between NINP,BT and DOC was found in contrast to McCluskey et al.18 who suggested that a positive correlation is indicative of sub-0.2 μm DOC components acting as marine INPs. Strong correlations were also not observed between NINP,BT and TDN and NO3−. A significant and moderate correlation was found between NINP,BT and silicate concentration. A biological origin of silicate in the ocean from marine diatoms and microalgae with siliceous cells has been reported (e.g., Thalassiosira pseudonana) to be IN-active.17 Another possibility for the positive correlation with silicate is the presence of dust-type INPs. Cornwell et al.52 showed in a laboratory study that the seawater doped with dust can be re-aerosolized with retained IN activity and added to the atmospheric INP populations during bubble bursting. This pathway of INP transfer could be responsible for the relatively high NINP aerosolized from land-sourced freshwater or seawater samples collected approaching islands (see Fig. 8) that are often rich in suspended sediments due to the fluvial outwash.
N INP,BT is negatively correlated with particle concentrations n > 0.5 aerosolized from the water samples, indicating that the absolute loading of SSA (dominated by NaCl) does not determine the abundance of aerosolized INPs (supporting the conclusions from Fig. 9) and emphasizes that NINP cannot always be predicted by aerosol number concentration35 like parameterizations for dusty or highly polluted atmospheres.64–66 However, the negative correlation between NINP,BT and n < 0.3 and n < 0.05 do not support that finer aerosol mode could be used as predictors for INP concentrations. The absence of a positive correlation with aerosol number concentration of different size ranges strengthens our conclusion that NINP cannot always be predicted by aerosol number concentrations in agreement with studies elsewhere in the Arctic and other remote regions.35,67,68 Combining the correlation analyses of NINP,BT with biological indicators (i.e., Chl-a, fluorescence, PO43−) and silicate, we infer that the aerosolization processes at the water–air interface preferentially partitions the IN-active species to the aerosol phase and that the composition (phosphate, silicate) and fluorescence information are crucial to predict INP concentrations.63
The relative abundance of INPs in different samples taken simultaneously including ambient air (impinger samples), seawater samples (CTD seawater), and BT-aerosolized SSA are shown in Fig. 11. The comparison reveals insignificant correlations between NINP in ambient air and the coincidentally sampled seawater (Fig. 11a). In contrast, a statistically significant correlation was found between airborne (NINP,ambient) and BT-aerosolized (NINP,BT) INP concentrations at the selected freezing temperatures (Fig. 11b). NINP,BT are present in higher concentrations compared to ambient INPs by about an order of magnitude due to the absence of dilution in the BT-aerosolized air. The positive correlations suggest that the BT experiments simulate a realistic aerosolization process at the sea–air interface, and the seawater can be a considerable source of INPs in the Arctic Ocean. The data from Fig. 11b suggest that SSA is a source of INPs, but the absence of a positive correlation with NINP derived from seawater in Fig. 11a suggests otherwise. This additional support is that the missing factor for water samples is the aerosolization process that enriches INPs in the air, which cannot simply be accounted for by the flux of SSA from water to air. The mechanisms of INP aerosolization at the ocean–air interface could be impacted by several compounding factors, e.g., an enrichment of INPs at the sea surface microlayer,10 dissolved species and their abundance,27,69 biological productivity,16,21 sea surface temperature,27,59 wind speed,70 and sea ice concentrations.20
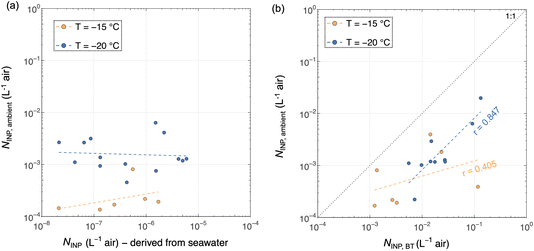 | ||
| Fig. 11 Comparisons between ambient NINP measured from impinger samples and coincident NINP measured from (a) seawater and (b) BT-aerosol filters. The dashed lines indicate the linear regression in the logarithmic scale, and only the statistically significant (p < 0.05) r values (correlation coefficients) are shown in the figure. The correlation coefficients of all data are given in Table A1.† | ||
4 Conclusions
This study presents summertime observations of NINP and aerosol related properties over the Barents, Kara, and Laptev Seas in the Eurasian Arctic from August to September 2021. Variability in NINP is highly influenced by local sources, and to some extent meteorological conditions, and potentially long-range transport. A series of online and offline measurements were applied to investigate the INP abundance in seawater, fog, and ambient air to understand the sources of the INP and production mechanisms.The majority of ambient aerosol samples collected on LVS filters were prone to degradation in INP concentration after heating to 95 °C for 20 min, indicating the presence of proteinaceous or biogenic INPs that are heat-labile. By comparing NINP in the ambient air to other environments, similar NINP was observed in fog water compared to ambient air, indicating INPs are not enriched in fog water and are likely cloud condensing nuclei. INPs in fog should be considered in studies of INP distribution and availability due to its role as an intermediate reservoir and for the formation of ice fogs in the atmospheric lifecycle of INPs. No clear trend was observed for INP enrichment in the SML compared to SSW, which is both in agreement with and in contrast to previous studies. The frequency of marine biological activity, such as phytoplankton blooms, fluvial input of sediment INPs, along with the variability in sea surface mixing and ocean state, could influence the abundance of INPs in different ocean layers.
A comparison of NINP in the SML, SSW and CTD seawater samples to in situ aerosol measurements from a BT system and ambient INPs from the LVS filters reveals that the bubble-bursting mechanism is important in transferring INPs from the ocean to the atmosphere. The abundance of INPs in the BT-sprayed aerosols showed a dependence on the composition of water components, with terrestrial freshwater possessing higher NINP compared to seawater samples. In accordance, a reduced NINP,BT was associated with a longer distance to land or an increased sea ice coverage where the subsurface seawater samples were collected. Based on the correlation analyses between NINP,BT and biological activity, this study supports the important role of marine biogenic aerosol as a source of INPs in the remote Arctic Ocean far from terrestrial sources. Our results highlight key relationships, such as the strong correlation between INP abundance and local biogenic factors (e.g., chlorophyll and fluorescence signals). These correlations suggest that integrating real-time biological activity data, especially during phytoplankton blooms, could improve model parameterizations of Arctic INP emissions. Lastly, other effects may be present in addition to the composition during the SSA generation and INP partitioning in the ocean and atmosphere, including the enrichment of IN-active materials in the sea surface microlayer, sea ice coverage, advection, and mixing in different ocean layers.
Data availability
The data in this article are available at https://doi.org/10.3929/ethz-b-000717415.Author contributions
GL performed sample processing and data analysis, produced figures, interpreted results, and co-wrote the manuscript. GL and AW participated in the campaign and conducted in situ sampling and measurements. AW contributed to the manuscript preparation and acquired funding. AR conducted the aerosol generation bubble tank experiment and collected samples for biochemical analysis. GPF performed INP analysis and heat treatment of filter samples, CTD seawater samples, and BT-aerosolized filter samples. MD provided the research idea on INP partitioning using the INP results from the bubble tank. ZAK supervised the project, obtained funding, and was involved in experiment and campaign planning, data interpretation, and manuscript writing. All authors reviewed the manuscript.Conflicts of interest
The authors declare that no competing interests are present.Acknowledgements
This research used samples and/or data provided by the Arctic Century Expedition, a joint initiative led by the Swiss Polar Institute (SPI), the Antarctic and Arctic Research Institute (AARI), and GEOMAR Helmholtz Centre for Ocean Research Kiel (GEOMAR), and funded by the Swiss Polar Foundation. GL and ZAK acknowledge that this project has been made possible by a grant from the Swiss Polar Institute, Dr Frederik Paulsen. GPF acknowledges funding from the Academy of Finland (Grant No. 342227). ZAK acknowledges this project has received funding from the Horizon Europe program under Grant Agreement No. 101137680 (Project CERTAINTY). We acknowledge all those involved in the fieldwork associated with the Arctic Century Expedition, including technical support from Dr Michael Rösch. We acknowledge Dr von Jackowski and Dr Engel for sharing biogeochemical data of CTD water samples. We acknowledge Franziska Aemisegger and Iris Thurnherr calculated the backward trajectories used in this study. We would like to thank Dr Xu from ETH for providing the ICP-OES instrument with assistance on sample preparation and measurements.References
- A. Korolev, G. McFarquhar, P. R. Field, C. Franklin, P. Lawson, Z. Wang, E. Williams, S. J. Abel, D. Axisa, S. Borrmann, J. Crosier, J. Fugal, M. Krämer, U. Lohmann, O. Schlenczek, M. Schnaiter and M. Wendisch, Mixed-phase clouds: Progress and challenges, Meteorol. Monogr., 2017, 58, 1–50, DOI:10.1175/AMSMONOGRAPHS-D-17-0001.1.
- M. C. Serreze and R. G. Barry, Processes and impacts of Arctic amplification: A research synthesis, Glob. Planet. Change, 2011, 77(1–2), 85–96, DOI:10.1016/j.gloplacha.2011.03.004.
- B. J. Murray, K. S. Carslaw and P. R. Field, Opinion: Cloud-phase climate feedback and the importance of ice-nucleating particles, Atmos. Chem. Phys., 2021, 21(2), 665–679, DOI:10.5194/acp-21-665-2021.
- G. C. E. Porter, M. P. Adams, I. M. Brooks, L. Ickes, L. Karlsson, C. Leck, M. E. Salter, J. Schmale, K. Siegel, S. N. F. Sikora, M. D. Tarn, J. Vüllers, H. Wernli, Z. Paul, J. Zinke and B. J. Murray, Highly active ice-nucleating particles at the summer North Pole, J. Geophys. Res.:Atmos., 2022, 127(6), e2021JD036059, DOI:10.1029/2021JD036059.
- C. Hoose and O. Möhler, Heterogeneous ice nucleation on atmospheric aerosols: a review of results from laboratory experiments, Atmos. Chem. Phys., 2012, 12(20), 9817–9854, DOI:10.5194/acp-12-9817-2012.
- G. Li, E. K. Wilbourn, Z. Cheng, J. Wieder, A. Fagerson, J. Henneberger, G. Motos, R. Traversi, S. D. Brooks, M. Mazzola, S. China, A. Nenes, U. Lohmann, N. Hiranuma and Z. A. Kanji, Physicochemical characterization and source apportionment of Arctic ice-nucleating particles observed in Ny-Ålesund in autumn 2019, Atmos. Chem. Phys., 2023, 23, 10489–10516, DOI:10.5194/acp-23-10489-2023.
- Y. Tobo, K. Adachi, P. J. DeMott, T. C. J. Hill, D. S. Hamilton, N. M. Mahowald, N. Nagatsuka, S. Ohata, J. Uetake, Y. Kondo and M. Koike, Glacially sourced dust as a potentially significant source of ice nucleating particles, Nat. Geosci., 2019, 12, 253–258, DOI:10.1038/s41561-019-0314-x.
- A. Sanchez-Marroquin, O. Arnalds, K. J. Baustian-Dorsi, J. Browse, P. Dagsson-Waldhauserova, A. D. Harrison, E. C. Maters, K. J. Pringle, J. Vergara-Temprado, I. T. Burke, J. B. McQuaid, K. S. Carslaw and B. J. Murray, Iceland is an episodic source of atmospheric ice-nucleating particles relevant for mixed-phase clouds, Sci. Adv., 2020, 6(26), eaba8137, DOI:10.1126/sciadv.aba8137.
- C. Leck and E. K. Bigg, Biogenic particles in the surface microlayer and overlaying atmosphere in the central Arctic Ocean during summer, Tellus B, 2005, 57(4), 305–316, DOI:10.3402/tellusb.v57i4.16546.
- T. W. Wilson, L. A. Ladino, P. A. Alpert, M. N. Breckels, I. M. Brooks, J. Browse, S. M. Burrows, K. S. Carslaw, J. A. Huffman, C. Judd, W. P. Kilthau, R. H. Mason, G. McFiggans, L. A. Miller, J. J. Nájera, E. Polishchuk, S. Rae, C. L. Schiller, M. Si, J. V. Temprado, T. F. Whale, J. P. S. Wong, O. Wurl, J. D. Yakobi-Hancock, J. P. D. Abbatt, J. Y. Aller, A. K. Bertram, D. A. Knopf and B. J. Murray, A marine biogenic source of atmospheric ice-nucleating particles, Nature, 2015, 525(7568), 234, DOI:10.1038/nature14986.
- J. M. Creamean, R. M. Kirpes, K. A. Pratt, N. J. Spada, M. Maahn, G. de Boer, R. C. Schnell and S. China, Marine and terrestrial influences on ice nucleating particles during continuous springtime measurements in an Arctic oilfield location, Atmos. Chem. Phys., 2018, 18(24), 18023–18042, DOI:10.5194/acp-18-18023-2018.
- K. A. Prather, C. D. Hatch and V. H. Grassian, Analysis of atmospheric aerosols, Annu. Rev. Anal. Chem., 2008, 1(1), 485–514, DOI:10.1146/annurev.anchem.1.031207.113030.
- P. K. Quinn, D. B. Collins, V. H. Grassian, K. A. Prather and T. S. Bates, Chemistry and related properties of freshly emitted sea spray aerosol, Chem. Rev., 2015, 115(10), 4383–4399, DOI:10.1021/cr500713g.
- H. Grythe, J. Ström, R. Krejci, P. Quinn and A. Stohl, A review of sea-spray aerosol source functions using a large global set of sea salt aerosol concentration measurements, Atmos. Chem. Phys., 2014, 14(3), 1277–1297, DOI:10.5194/acp-14-1277-2014.
- C. O'Dowd, D. Ceburnis, J. Ovadnevaite, J. Bialek, D. B. Stengel, M. Zacharias, U. Nitschke, S. Connan, M. Rinaldi and S. Fuzzi, et al., Connecting marine productivity to sea-spray via nanoscale biological processes: Phytoplankton dance or death disco?, Sci. Rep., 2015, 5(1), 14883, DOI:10.1038/srep14883.
- J. M. Creamean, J. N. Cross, R. Pickart, L. McRaven, P. Lin, A. Pacini, R. Hanlon, D. G. Schmale, J. Ceniceros, T. Aydell, N. Colombi, E. Bolger and P. J. DeMott, Ice nucleating particles carried from below a phytoplankton bloom to the Arctic atmosphere, Geophys. Res. Lett., 2019, 46(14), 8572–8581, DOI:10.1029/2019GL083039.
- D. A. Knopf, P. A. Alpert, B. Wang and J. Y. Aller, Stimulation of ice nucleation by marine diatoms, Nat. Geosci., 2011, 4(2), 88–90, DOI:10.1038/ngeo1037.
- C. S. McCluskey, J. Ovadnevaite, M. Rinaldi, J. Atkinson, F. Belosi, D. Ceburnis, S. Marullo, T. C. J. Hill, U. Lohmann, Z. A. Kanji, C. O'Dowd, S. M. Kreidenweis and P. J. DeMott, Marine and terrestrial organic ice-nucleating particles in pristine marine to continentally influenced northeast Atlantic air masses, J. Geophys. Res.:Atmos., 2018, 123, 6196–6212, DOI:10.1029/2017JD028033.
- B. J. Murray, D. O'Sullivan, J. D. Atkinson and M. E. Webb, Ice nucleation by particles immersed in supercooled cloud droplets, Chem. Soc. Rev., 2012, 41(19), 6519–6554, 10.1039/C2CS35200A.
- A. Gabric, P. Matrai, G. Jones and J. Middleton, The nexus between sea ice and polar emissions of marine biogenic aerosols, Bull. Am. Meteorol. Soc., 2018, 99(1), 61–81, DOI:10.1175/BAMS-D-16-0254.1.
- M. Rinaldi, S. Fuzzi, S. Decesari, S. Marullo, R. Santoleri, A. Provenzale, J. von Hardenberg, D. Ceburnis, A. Vaishya, C. D. O'Dowd and M. C. Facchini, Is chlorophyll-a the best surrogate for organic matter enrichment in submicron primary marine aerosol?, J. Geophys. Res.:Atmos., 2013, 118(10), 4964–4973, DOI:10.1002/jgrd.50417.
- S. Becagli, C. Ghedini, S. Peeters, A. Rottiers, R. Traversi, R. Udisti, M. Chiari, A. Jalba, S. Despiau, U. Dayan and A. Temara, MBAS (methylene blue active substances) and LAS (linear alkylbenzene sulphonates) in Mediterranean coastal aerosols: Sources and transport processes, Atmos. Environ., 2011, 45(37), 6788–6801, DOI:10.1016/j.atmosenv.2011.04.041.
- L. Ickes, G. C. E. Porter, R. Wagner, M. P. Adams, S. Bierbauer, A. K. Bertram, M. Bilde, S. Christiansen, A. M. L. Ekman, E. Gorokhova, K. Höhler, A. A. Kiselev, C. Leck, O. Möhler, B. J. Murray, T. Schiebel, R. Ullrich and M. E. Salter, The ice-nucleating activity of Arctic sea surface microlayer samples and marine algal cultures, Atmos. Chem. Phys., 2020, 20(18), 11089–11117, DOI:10.5194/acp-20-11089-2020.
- M. Si, E. Evoy, J. Yun, Y. Xi, S. J. Hanna, A. Chivulescu, K. Rawlings, D. Veber, A. Platt and D. Kunkel, et al., Concentrations, composition, and sources of ice-nucleating particles in the Canadian high Arctic during spring 2016, Atmos. Chem. Phys., 2019, 19(5), 3007–3024, DOI:10.5194/acp-19-3007-2019.
- A. Rocchi, A. von Jackowski, A. Welti, G. Li, Z. A. Kanji, V. Povazhnyy, A. Engel, J. Schmale, A. Nenes, E. Berdalet, R. Simó and M. Dall'Osto, Glucose enhances salinity-driven sea spray aerosol production in eastern Arctic waters, Environ. Sci. Technol., 2024, 58(20), 8748–8759, DOI:10.1021/acs.est.4c02826.
- N. I. Medina-Pérez, M. Dall'Osto, S. Decesari, M. Paglione, E. Moyano and E. Berdalet, Aerosol toxins emitted by harmful algal blooms susceptible to complex air–sea interactions, Environ. Sci. Technol., 2020, 55(1), 468–477, DOI:10.1021/acs.est.0c05795.
- M. van Pinxteren, S. Barthel, K. W. Fomba, K. Müller, W. von Tümpling and H. Herrmann, The influence of environmental drivers on the enrichment of organic carbon in the sea surface microlayer and in submicron aerosol particles – measurements from the Atlantic Ocean, Elem. Sci. Anth., 2017, 5(06), 35, DOI:10.1525/elementa.225.
- T. Koop and B. Zobrist, Parameterizations for ice nucleation in biological and atmospheric systems, Phys. Chem. Chem. Phys., 2009, 11, 10839–10850, 10.1039/B914289D.
- R. O. David, M. Cascajo-Castresana, K. P. Brennan, M. Rösch, N. Els, J. Werz, W. Vera, L. S. Boynton, S. Bogler, N. Borduas-Dedekind, C. Marcolli and Z. A. Kanji, Development of the DRoplet Ice Nuclei Counter Zurich (DRINCZ): validation and application to field-collected snow samples, Atmos. Meas. Tech., 2019, 12, 6865–6888, DOI:10.5194/amt-12-6865-2019.
- G. Vali, Quantitative Evaluation of Experimental Results an the Heterogeneous Freezing Nucleation of Supercooled Liquids, J. Atmos. Sci., 1971, 28(3), 402–409, DOI:10.1175/1520-0469(1971)028<0402:QEOERA>2.0.CO;2.
- T. Costabloz, F. Burnet, C. Lac, P. Martinet, J. Delanoë, S. Jorquera and M. Fathalli, Vertical profiles of liquid water content in fog layers during the SOFOG3D experiment, EGUsphere, 2024, 1–45, DOI:10.5194/egusphere-2024-1344.
- G. Vali, Revisiting the differential freezing nucleus spectra derived from drop-freezing experiments: Methods of calculation, applications, and confidence limits, Atmos. Meas. Tech., 2019, 12, 1219–1231, DOI:10.5194/amt-12-1219-2019.
- T. C. J. Hill, P. J. DeMott, Y. Tobo, J. Fröhlich-Nowoisky, B. F. Moffett, G. D. Franc and S. M. Kreidenweis, Sources of organic ice nucleating particles in soils, Atmos. Chem. Phys., 2016, 16(11), 7195–7211, DOI:10.5194/acp-16-7195-2016.
- B. G. Pummer, C. Budke, S. Augustin-Bauditz, D. Niedermeier, L. Felgitsch, C. J. Kampf, R. G. Huber, K. R. Liedl, T. Loerting, T. Moschen, M. Schauperl, M. Tollinger, C. E. Morris, H. Wex, H. Grothe, U. Pöschl, T. Koop and J. Fröhlich-Nowoisky, Ice nucleation by water-soluble macromolecules, Atmos. Chem. Phys., 2015, 15(8), 4077–4091, DOI:10.5194/acp-15-4077-2015.
- G. Li, J. Wieder, J. T. Pasquier, J. Henneberger and Z. A. Kanji, Predicting atmospheric background number concentration of ice-nucleating particles in the arctic, Atmos. Chem. Phys., 2022, 22(21), 14441–14454, DOI:10.5194/acp-22-14441-2022.
- R. S. Gilli, C. Karlen, M. Weber, J. Rüegg, K. Barmettler, H. Biester, P. Boivin and R. Kretzschmar, Speciation and mobility of mercury in soils contaminated by legacy emissions from a chemical factory in the Rhône valley in canton of Valais, Switzerland, Soil Syst., 2018, 2(3), 44, DOI:10.3390/soilsystems2030044.
- N. Hiranuma, S. D. Brooks, R. C. Moffet, A. Glen, A. Laskin, M. K. Gilles, P. Liu, A. M. Macdonald, J. W. Strapp and G. M. McFarquhar, Chemical characterization of individual particles and residuals of cloud droplets and ice crystals collected on board research aircraft in the ISDAC 2008 study, J. Geophys. Res.:Atmos., 2013, 118(12), 6564–6579, DOI:10.1002/jgrd.50484.
- A. Engel and L. Galgani, The organic sea-surface microlayer in the upwelling region off the coast of Peru and potential implications for air–sea exchange processes, Biogeosciences, 2016, 13(4), 989–1007, DOI:10.5194/bg-13-989-2016.
- A. von Jackowski, J. Grosse, E.-M. Nöthig and A. Engel, Dynamics of organic matter and bacterial activity in the Fram Strait during summer and autumn, Philos. Trans. R. Soc., A, 2020, 378(2181), 20190366, DOI:10.1098/rsta.2019.0366.
- M. Sprenger and H. Wernli, The LAGRANTO Lagrangian analysis tool – version 2.0, Geosci. Model Dev., 2015, 8(8), 2569–2586, DOI:10.5194/gmd-8-2569-2015.
- H. Wernli and H. C. Davies, A Lagrangian-based analysis of extratropical cyclones. I: The method and some applications, Q. J. R. Metereol. Soc., 1997, 123(538), 467–489, DOI:10.1002/qj.49712353811.
- H. Hersbach, B. Bell, P. Berrisford, S. Hirahara, A. Horányi, J. Muñoz-Sabater, J. Nicolas, C. Peubey, R. Radu, D. Schepers, A. Simmons, C. Soci, S. Abdalla, X. Abellan, G. Balsamo, P. Bechtold, G. Biavati, J. Bidlot, M. Bonavita, G. De Chiara, P. Dahlgren, D. Dee, M. Diamantakis, R. Dragani, J. Flemming, R. Forbes, M. Fuentes, A. Geer, L. Haimberger, S. Healy, R. J. Hogan, E. Hólm, M. Janisková, S. Keeley, P. Laloyaux, P. Lopez, C. Lupu, G. Radnoti, P. de Rosnay, I. Rozum, F. Vamborg, S. Villaume and J.-N. Thépaut, The ERA5 global reanalysis, Q. J. R. Metereol. Soc., 2020, 146(730), 1999–2049, DOI:10.1002/qj.3803.
- F. Conen, E. Stopelli and L. Zimmermann, Clues that decaying leaves enrich Arctic air with ice nucleating particles, Atmos. Environ., 2016, 129, 91–94, DOI:10.1016/j.atmosenv.2016.01.027.
- C. S. McCluskey, T. C. J. Hill, F. Malfatti, C. M. Sultana, C. Lee, M. V. Santander, C. M. Beall, K. A. Moore, G. C. Cornwell, D. B. Collins, K. A. Prather, T. Jayarathne, E. A. Stone, F. Azam, S. M. Kreidenweis and P. J. DeMott, A dynamic link between ice nucleating particles released in nascent sea spray aerosol and oceanic biological activity during two mesocosm experiments, J. Atmos. Sci., 2017, 74(1), 151–166, DOI:10.1175/JAS-D-16-0087.1.
- H. Wex, L. Huang, W. Zhang, H. Hung, R. Traversi, S. Becagli, R. J. Sheesley, C. E. Moffett, T. E. Barrett and R. Bossi, et al., Annual variability of ice-nucleating particle concentrations at different Arctic locations, Atmos. Chem. Phys., 2019, 19(7), 5293–5311, DOI:10.5194/acp-19-5293-2019.
- E. K. Bigg and C. Leck, Cloud-active particles over the central Arctic Ocean, J. Geophys. Res.:Atmos., 2001, 106(D23), 32155–32166, DOI:10.1029/1999JD901152.
- T. M. Seifried, F. Reyzek, P. Bieber and H. Grothe, Scots pines (Pinus sylvestris) as sources of biological ice-nucleating macromolecules (INMs), Atmosphere, 2023, 14(2), 266, DOI:10.3390/atmos14020266.
- A. Agresti and B. A. Coull, Approximate is better than “exact” for interval estimation of binomial proportions, Am. Stat., 1998, 52(2), 119–126 Search PubMed.
- J. M. Creamean, K. J. Suski, D. Rosenfeld, A. Cazorla, P. J. DeMott, R. C. Sullivan, A. B. White, F. M. Ralph, P. Minnis, J. M. Comstock, J. M. Tomlinson and K. A. Prather, Dust and biological aerosols from the Sahara and Asia influence precipitation in the western U.S., Science, 2013, 339(6127), 1572–1578, DOI:10.1126/science.1227279.
- K. R. Barry, T. C. J. Hill, K. A. Moore, T. A. Douglas, S. M. Kreidenweis, P. J. DeMott and J. M. Creamean, Persistence and potential atmospheric ramifications of ice-nucleating particles released from thawing permafrost, Environ. Sci. Technol., 2023, 57(9), 3505–3515, DOI:10.1021/acs.est.2c06530.
- J. M. Creamean, T. C. J. Hill, P. J. DeMott, J. Uetake, S. Kreidenweis and T. A. Douglas, Thawing permafrost: an overlooked source of seeds for Arctic cloud formation, Environ. Res. Lett., 2020, 15(8), 084022, DOI:10.1088/1748-9326/ab87d3.
- G. C. Cornwell, C. M. Sultana, M. Prank, R. E. Cochran, T. C. J. Hill, G. P. Schill, P. J. DeMott, N. Mahowald and K. A. Prather, Ejection of dust from the ocean as a potential source of marine ice nucleating particles, J. Geophys. Res.:Atmos., 2020, 125(24), e2020JD033073, DOI:10.1029/2020JD033073.
- X. Gong, H. Wex, M. van Pinxteren, N. Triesch, K. W. Fomba, J. Lubitz, C. Stolle, T.-B. Robinson, T. Müller, H. Herrmann and F. Stratmann, Characterization of aerosol particles at Cabo Verde close to sea level and at the cloud level – Part 2: Ice-nucleating particles in air, cloud and seawater, Atmos. Chem. Phys., 2020, 20(3), 1451–1468, DOI:10.5194/acp-20-1451-2020.
- V. E. Irish, P. Elizondo, J. Chen, C. Chou, J. Charette, M. Lizotte, L. A. Ladino, T. W. Wilson, M. Gosselin and B. J. Murray, et al., Ice-nucleating particles in Canadian Arctic sea-surface microlayer and bulk seawater, Atmos. Chem. Phys., 2017, 17(17), 10583–10595, DOI:10.5194/acp-17-10583-2017.
- P. J. DeMott, T. C. J. Hill, C. S. McCluskey, K. A. Prather, D. B. Collins, R. C. Sullivan, M. J. Ruppel, R. H. Mason, V. E. Irish, T. Lee, C. Y. Hwang, T. S. Rhee, J. R. Snider, G. R. McMeeking, S. Dhaniyala, E. R. Lewis, J. J. B. Wentzell, J. Abbatt, C. Lee, C. M. Sultana, A. P. Ault, J. L. Axson, M. Diaz Martinez, I. Venero, G. Santos-Figueroa, M. D. Stokes, G. B. Deane, O. L. Mayol-Bracero, V. H. Grassian, T. H. Bertram, A. K. Bertram, B. F. Moffett and G. D. Franc, Sea spray aerosol as a unique source of ice nucleating particles, Proc. Natl. Acad. Sci. U. S. A., 2016, 113(21), 5797–5803, DOI:10.1073/pnas.1514034112.
- D. B. Collins, A. P. Ault, R. C. Moffet, M. J. Ruppel, L. A. Cuadra-Rodriguez, T. L. Guasco, C. E. Corrigan, B. E. Pedler, F. Azam, L. I. Aluwihare, T. H. Bertram, G. C. Roberts, V. H. Grassian and K. A. Prather, Impact of marine biogeochemistry on the chemical mixing state and cloud forming ability of nascent sea spray aerosol, J. Geophys. Res.:Atmos., 2013, 118(15), 8553–8565, DOI:10.1002/jgrd.50598.
- A. J. Gabric, B. Qu, P. Matrai and A. C. Hirst, The simulated response of dimethylsulfide production in the Arctic Ocean to global warming, Tellus B, 2005, 57(5), 391–403, DOI:10.3402/tellusb.v57i5.16564.
- C. S. McCluskey, T. C. J. Hill, R. S. Humphries, A. M. Rauker, S. Moreau, P. G. Strutton, S. D. Chambers, A. G. Williams, I. McRobert, J. Ward, M. D. Keywood, J. Harnwell, W. Ponsonby, Z. M. Loh, P. B. Krummel, A. Protat, S. M. Kreidenweis and P. J. DeMott, Observations of ice nucleating particles over Southern Ocean waters, Geophys. Res. Lett., 2018, 45(21), 11989–11997, DOI:10.1029/2018GL079981.
- L. A. Ladino, J. D. Yakobi-Hancock, W. P. Kilthau, R. H. Mason, M. Si, J. Li, L. A. Miller, C. L. Schiller, J. A. Huffman, J. Y. Aller, D. A. Knopf, A. K. Bertram and J. P. D. Abbatt, Addressing the ice nucleating abilities of marine aerosol: A combination of deposition mode laboratory and field measurements, Atmos. Environ., 2016, 132, 1–10, DOI:10.1016/j.atmosenv.2016.02.028.
- W. Bruch, J. Piazzola, H. Branger, A. M. J. van Eijk, C. Luneau, D. Bourras and G. Tedeschi, Sea-spray-generation dependence on wind and wave combinations: A laboratory study, Bound.-Lay. Meteorol., 2021, 180(3), 477–505, DOI:10.1007/s10546-021-00636-y.
- X. Gong, H. Wex, J. Voigtländer, K. W. Fomba, K. Weinhold, M. van Pinxteren, S. Henning, T. Müller, H. Herrmann and F. Stratmann, Characterization of aerosol particles at Cabo Verde close to sea level and at the cloud level – Part 1: Particle number size distribution, cloud condensation nuclei and their origins, Atmos. Chem. Phys., 2020, 20(3), 1431–1449, DOI:10.5194/acp-20-1431-2020.
- E. K. Hall, C. Neuhauser and J. B. Cotner, Toward a mechanistic understanding of how natural bacterial communities respond to changes in temperature in aquatic ecosystems, ISME J., 2008, 2(5), 471–481, DOI:10.1038/ismej.2008.9.
- K. Gao, F. Vogel, R. Foskinis, S. Vratolis, M. I. Gini, K. Granakis, A.-C. Billault-Roux, P. Georgakaki, O. Zografou, P. Fetfatzis, A. Berne, A. Papayannis, K. Eleftheridadis, O. Möhler and A. Nenes, Biological and dust aerosols as sources of ice-nucleating particles in the eastern Mediterranean: source apportionment, atmospheric processing and parameterization, Atmos. Chem. Phys., 2024, 24(17), 9939–9974, DOI:10.5194/acp-24-9939-2024.
- P. J. DeMott, A. J. Prenni, G. R. McMeeking, R. C. Sullivan, M. D. Petters, Y. Tobo, M. Niemand, O. Möhler, J. R. Snider, Z. Wang and S. M. Kreidenweis, Integrating laboratory and field data to quantify the immersion freezing ice nucleation activity of mineral dust particles, Atmos. Chem. Phys., 2015, 15, 393–409, DOI:10.5194/acp-15-393-2015.
- M. Niemand, O. Möhler, B. Vogel, H. Vogel, C. Hoose, P. Connolly, H. Klein, H. Bingemer, P. Demott, J. Skrotzki and T. Leisner, A particle-surface-area-based parameterization of immersion freezing on desert dust particles, J. Atmos. Sci., 2012, 69, 3077–3092, DOI:10.1175/JAS-D-11-0249.1.
- P. J. DeMott, A. J. Prenni, X. Liu, S. M. Kreidenweis, M. D. Petters, C. H. Twohy, M. S. Richardson, T. Eidhammer and D. C. Rogers, Predicting global atmospheric ice nuclei distributions and their impacts on climate, Proc. Natl. Acad. Sci. U. S. A., 2010, 107, 11217–11222, DOI:10.1073/pnas.0910818107.
- M. Paramonov, S. Drossaart van Dusseldorp, E. Gute, J. P. D. Abbatt, P. Heikkilä, J. Keskinen, X. Chen, K. Luoma, L. Heikkinen, L. Hao, T. Petäjä and Z. A. Kanji, Condensation/immersion mode ice-nucleating particles in a boreal environment, Atmos. Chem. Phys., 2020, 20(11), 6687–6706, DOI:10.5194/acp-20-6687-2020.
- L. Lacher, M. Steinbacher, N. Bukowiecki, E. Herrmann, A. Zipori and Z. A. Kanji, Impact of air mass conditions and aerosol properties on ice nucleating particle concentrations at the High Altitude Research Station Jungfraujoch, Atmosphere, 2018, 9(9), 363, DOI:10.3390/atmos9090363.
- R. E. Cochran, O. Laskina, T. Jayarathne, A. Laskin, J. Laskin, P. Lin, C. Sultana, C. Lee, K. A. Moore and C. D. Cappa, et al., Analysis of organic anionic surfactants in fine and coarse fractions of freshly emitted sea spray aerosol, Environ. Sci. Technol., 2016, 50(5), 2477–2486, DOI:10.1021/acs.est.5b04053.
- E. R. Lewis and S. E. Schwartz, Sea Salt Aerosol Production: Mechanisms, Methods, Measurements, and Models, American Geophysical Union, 2004, vol. 152 Search PubMed.
Footnotes |
| † Electronic supplementary information (ESI) available. See DOI: https://doi.org/10.1039/d4fd00160e |
| ‡ Now at: Laboratory for Microwave Spatial Intelligence and Cloud Platform, Deqing Academy of Satellite Applications, Deqing, China. |
| This journal is © The Royal Society of Chemistry 2025 |

