 Open Access Article
 This Open Access Article is licensed under a Creative Commons Attribution-Non Commercial 3.0 Unported Licence
Combined crystallographic study of king scallop (Pecten maximus) shells using SEM, EBSD and Raman spectroscopy
Lise Guichaoua *a,
Natalie Reznikovb,
Bryce D. Stewartcd,
Roland Krögere and
Raynald Gauvina
*a,
Natalie Reznikovb,
Bryce D. Stewartcd,
Roland Krögere and
Raynald Gauvina
aMcGill Electron Microscopy Research Group, Department of Mining and Materials Engineering, McGill University, Montreal, Canada. E-mail: lise.guichaoua@mcgill.ca
bDepartment of Bioengineering, Faculty of Engineering, McGill University, Montreal, Canada
cSchool of Biological and Marine Sciences, University of Plymouth, UK
dMarine Biological Association, UK
eSchool of Physics, Engineering and Technology, University of York, UK
First published on 28th February 2025
Abstract
The shells of Pecten maximus (king scallop) are composed primarily of polycrystalline calcitic calcium carbonate, with a crucial aragonitic prismatic myostracum layer that facilitates soft tissue attachment and contributes to mechanical strength. Despite its importance, the impact of environmental stressors, such as metal contamination, on the myostracum remains underexplored. Hence, this study's main goal was to shed light on the microstructure and crystallography of king scallop shells, particularly the myostracum region, using a combination of scanning electron microscopy (SEM), electron backscatter diffraction (EBSD) analysis, and Raman spectroscopy. This approach was chosen to develop new protocols that integrate imaging techniques for a systematic analysis of pollution effects on shell growth and properties. Such an understanding is crucial for assessing the impact of environmental contamination on shell structure and composition. We compared samples from a metal contaminated site (Laxey) with those from non-contaminated site (Bradda) around the Isle of Man, to determine which structural and crystallographic information is detectable using the selected microscopy and spectroscopy techniques. SEM imaging showed a similar myostracum organization in specimens from both sites, with elongated, oriented grains. However, the non-contaminated site shell had more regular and elongated grains, while the shell from the contaminated site exhibited a broader grain size distribution, visible via electron channeling contrast and backscattered electron detection. EBSD analysis confirmed that both types exhibited well-crystallized aragonite in the myostracum, with slight differences in grain orientation and grain size with co-orientation indicating a marginal reduction in crystallographic alignment in the contaminated site shell. Raman maps reveal shifts in peak positions, indicating crystallite strain and differences in grain size. These variations may be related to a biological adaptation aimed at toughening the shell, but pollution could disrupt this crystallization process, weakening the shell. The combination of these techniques can advance our understanding of the microstructural alterations caused by metal contamination, highlighting its potential impact on the structural integrity of the shell. This study is a proof of principle study showing how a combination of different established imaging techniques can provide complementary and novel insights into the structure and composition of the king scallop myostracum. This systematic approach aims to develop new evaluation approaches for the study of the effects of environmental pollutants on the crystallography and microstructure of marine bivalve shells and hence their resilience.
Introduction
King scallops (Pecten maximus) are bivalve molluscs of considerable economic and ecological importance.1 Their shells are composed of polycrystalline calcium carbonate and a small amount of organic material. The main part of the shell is composed of calcitic foliated layers, except for a layer of aragonitic prismatic pallial myostracum.2 Of the six main types of calcitic microstructures employed by molluscs (granular, columnar prismatic, fibrous, foliated, chalk and crossed-foliated), foliated calcite is, possibly, the most widespread. The foliated microstructure is defined as being composed of parallel, elongated blade-shaped crystals (laths) with arrow-shaped ends.3The soft tissues are attached to the shells via the myostracum layer (also known as the adductor muscle scar, see Fig. 1(A)), which bears tremendous contractile force and is crucial for the survival of molluscs.4 Previous studies have shown that this myostracum layer is generally composed of prismatic aragonite.5 However, to date, there are very few studies on the myostracum of king scallops Pecten maximus and its structural role for the bivalve including its impact on the fracture toughness.
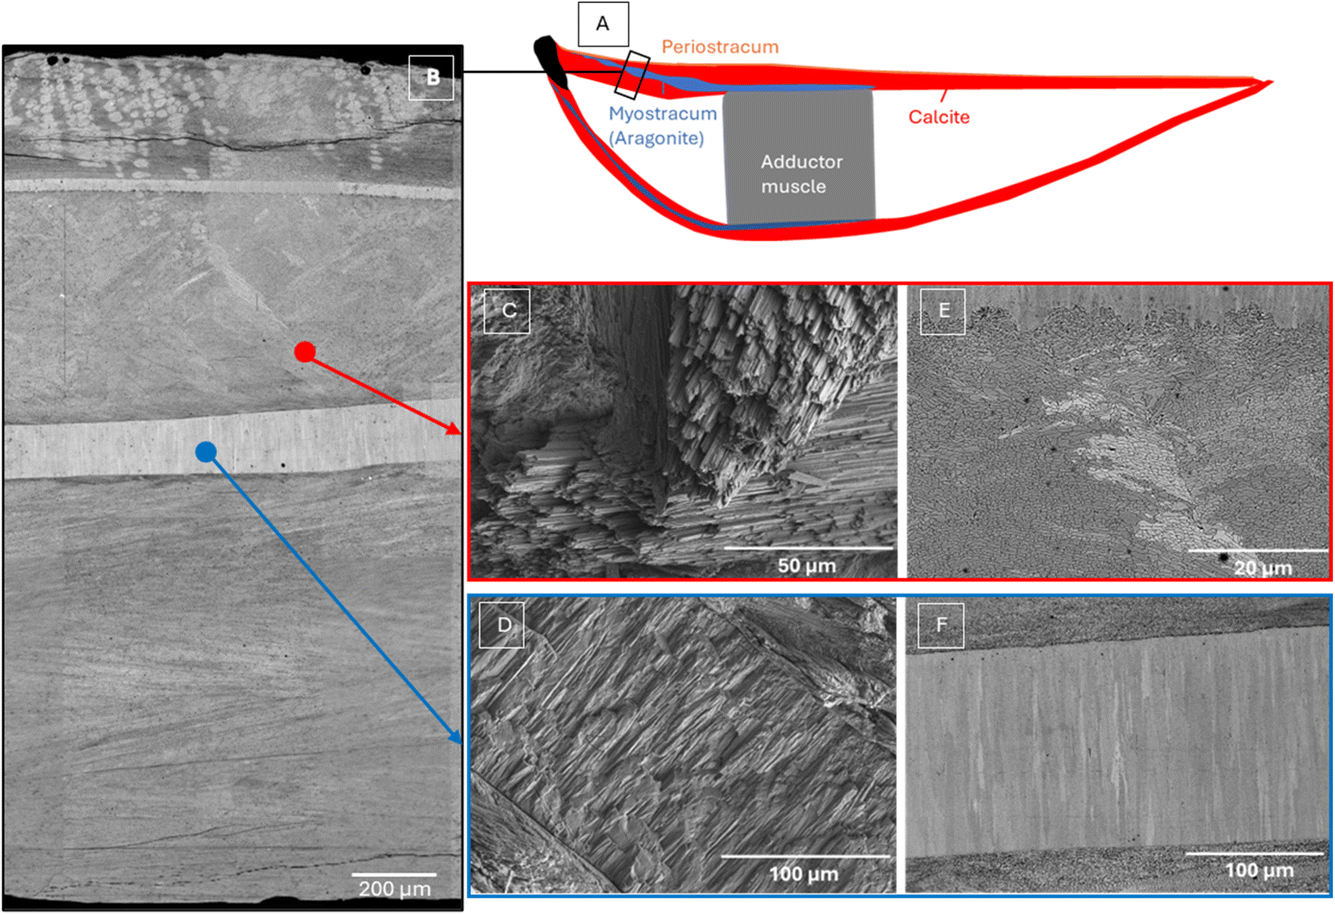 | ||
| Fig. 1 (A) Schematic longitudinal section of a king scallop (Pecten maximus) shell, both valves. Of the organic parts only the adductor muscle is indicated showing its attachment to the shell via an aragonitic calcium carbonate layer. (B) Backscattered electrons stitched SEM images of a king scallop sample from a non-contaminated area after surface polishing. SEM images of king scallop in calcite (red) area: (C) secondary electron image of calcite foliated grains on laser cut surface and (E) backscattered electron image of calcite foliated grain after surface polishing. SEM images of king scallop myostracum aragonite prismatic layer (blue) area: (D) secondary electron image of myostracum layer on laser cut surface and (E) backscattered electron image of myostracum layer after surface polishing. | ||
Relatively few experimental field studies have identified clear effects of site or water pollution on shell composition, especially in marine environments.6 Metals such as Pb and Zn can be incorporated into mollusc shells because these elements follow the same intracellular pathway as Ca during biomineralization. This process allows them to be integrated into the shell structure alongside calcium carbonate.7 It is indeed difficult to clearly associate or attribute observed differences to the presence of pollutants such as metals. Other types of ecological interactions may come into play when it comes to impacting scallop shell development and populations.8 However, in the study by Stewart et al.,9,10 the presence of metal sedimentary contamination, particularly Cu, Pb, and Zn, from mining activities on the Isle of Man in the British Isles, has been shown to be negatively correlated with shell strength. In addition to a reduction in shell thickness, king scallop shells from the contaminated area exhibited a distinct break line within both the top and bottom valves. Data, obtained from a collected set of 25 shells from each location (collected in two different years), suggests that these zones of mineralization failure have led to a statistically significant reduction in fracture strength compared to scallops from unpolluted areas. This weakness leads to an increased mortality during the dredging process and leaves individuals more vulnerable to predation.10 The fracture lines appear to be associated with the prismatic myostracum, which may explain the shell's tendency to crack in these regions under mechanical stress, as opposed to the calcitic bulk. The question that arises is: could metal pollution impact the overall toughness of the shell by altering the interfaces between the aragonitic myostracum and the calcitic bulk, and if so, how?
Fig. 1 illustrates the scanning electron microscope (SEM) images of the cross-sectional surface of a king scallop sample from a non-contaminated area, as previously reported.11,12 Fig. 1(B) displays a secondary electron SEM image of sample's section after polishing, revealing the general distribution of calcite and myostracum aragonite layers in king scallop shell from a non-contaminated site. Fig. 1(C) and (E) highlight the well-oriented, foliated calcite with sharp, thin laths with asymmetrical triangular endings, arranged in parallel clusters, while Fig. 1(D) shows the myostracum aragonite layer after Er:YAG dental laser cut with clearly oriented prismatic grains. Fig. 1(F) presents the same section after polishing, where the myostracum exhibits clearly elongated grains, with visible backscattered electron (BSE) channeling contrast indicative of the high crystallinity of the aragonite phase.
Studies have already demonstrated the value of using EBSD to investigate crystallization and biomineralization processes, particularly in shells.13,14 However, it seems that there are no studies that use EBSD to observe the impact of pollution on the microstructure and crystallography of shells living in polluted environments.
Raman spectroscopy is widely recognized for its ability to characterize the various mineral phases in shells, including calcite, aragonite, and other calcium carbonate forms.15 This information is essential for gaining insight into the crystallization processes and the formation of shells. In a Raman spectrum, the vibrational modes detected by Raman spectroscopy are affected by grain size (if in the submicrometric range) and lattice strain by leading to peak broadening and shifts. As a result, Raman spectroscopy is sensitive to structural defects, such as lattice irregularities or impurities, which may influence crystal growth and affect the shell's mechanical properties. When combined with techniques like optical or electron microscopy, Raman spectroscopy enables the identification of chemical and structural variations across different regions of the shell. Moreover, it can assess the hydration levels of minerals or detect changes induced by environmental factors (e.g., temperature, pH fluctuations, pollution), which can be important for crystallographic studies in both natural and controlled settings.16–18
Whilst each individual technique is generally well established, a combination of scanning electron microscopy (SEM), electron backscatter diffraction (EBSD) analysis and Raman spectroscopy, particularly with a focus on myostracum, has not been demonstrated so far. This study is therefore a proof of principle, showing how a combination of different imaging techniques can provide complementary insights into the structure and composition of the king scallop myostracum.
We aim to develop new protocols of a combination of scanning electron microscopy (SEM), electron backscatter diffraction (EBSD) analysis and Raman spectroscopy for assessing the impact of contamination on scallop shell growth. This integrated crystallographic analysis enables us to identify differences in the microstructure, crystallography, and growth patterns of shells, specifically focusing on the myostracum region. By comparing the crystallographic properties of shells from a metal-contaminated area to those from a non-contaminated area, we aim to better understand how environmental stressors influence shell development.
Methods
Samples selection
The samples were collected in the coastal waters around the Isle of Man, located in the northern Irish Sea. Details of the scallop population selection are provided in previous studies.9,10 Fig. 2 presents a map of the relative mean fracture strength observed for king scallops (Pecten maximus) around the Isle of Man, based on the collection site. Low fracture strength was observed in shells collected in the Laxey area, which is the closest to numerous previous metal ore mines and had the most highly contaminated sediment among sample sites. This provided us with an ideal opportunity to directly compare scallop populations from this contaminated site with those from sites with higher fracture strength/lower contamination levels, specifically the Bradda area. All other known environmental parameters, including water temperature, salinity, and nutrients, remained similar across the sites. | ||
| Fig. 2 Map of the relative mean fracture strength observed for Pecten maximus around the Isle of Man with the value for Bradda Offshore used to normalize the values for all other sites. Shells were collected from six sites around the Isle of Man in 2004. The color code indicates the value for the relative fracture strength. Laxey is the contaminated site, all the others are controls (n = 20 per site, 120 in total). The value for the Laxey site is 0.66 whereas the values for the other sites are all above 0.83. Red symbols assign major historical mining sites for zinc, lead and copper ores with the order of importance indicated by their sequence position.10 | ||
The EBSD and SEM studies presented here are limited to one sample from a non-contaminated site (Bradda) and one sample from a contaminated region (Laxey). Our initial objective is to observe the information detectable using the selected microscopy and spectroscopy techniques. This will allow us to determine the most suitable protocols for a more in-depth statistical study on a larger set of shells.
Sample preparation
For this study, in which we aim to highlight complementary insights that can be obtained through the combination of scanning electron microscopy (SEM), electron backscatter diffraction (EBSD) analysis, and Raman spectroscopy, we have prepared two scallop samples (one from Bradda, the non-contaminated site, one from Laxey, the contaminated site). The shells were cut using a diamond cut-off wheel (South Bay Technology Low Speed Diamond Wheel Saw MODEL 650) longitudinally (Fig. 3). The sectioned sample was then hand polished with lapping pads to a felt disk with a 50 nm colloidal silica suspension, to obtain a perfectly flat surface for future SEM observations and EBSD analysis. A 10 nm layer of carbon coating was necessary for conductivity. No etching process was applied. | ||
| Fig. 3 (A) Scallop sample from non-contaminated Bradda area and (B) scallop sample from metal contaminated Laxey area, longitudinal section view. The region of interest is marked with a red circle. | ||
Samples for Raman analyses were prepared by a Struers Diamond cut-off wheel and subsequent polishing using Struers diamond lapping-pads of gradually decreasing grain sizes from 30 μm to 250 nm until a specular surface was achieved. Raman studies have been performed on 3 samples showing similar trends.
Characterization methods
SEM imaging was conducted using a Hitachi field emission gun (FEG)-SEM SU8230 with low voltage analysis (5 K eV) and backscattered electron imaging (PD-BSE) to examine the myostracum region which is the area of interest in this study. We employed electron channeling contrast imaging (ECCI). An electron beam incident on a crystal can undergo electron channeling in a shallow near-surface layer which increases the initial beam penetration for certain orientations of the beam relative to the crystal planes. The additional penetration results in a slight reduction in the electron backscattering coefficient, which creates weak crystallographic contrast (a few percent) in SEM images by which differences in local crystallographic orientation can be directly observed, in particular grain boundaries.19Electron backscattered diffraction (EBSD) analyses were conducted at 20 keV on the myostracum area detected by the previous SEM analyses on the same (FEG)-SEM SU8230 equipped with the Bruker eFlash EBSD camera ARGUS detectors. The EBSD scans were performed with a step size from 140 to 270 nm with EBSP resolution of 800 × 600. For indexing the EBSD pattern, the unit cell settings that were used are: a0 = 4.99 Å, b0 = 4.99 Å, c0 = 17.061 Å for the calcite EBSD pattern and a0 = 4.961 Å, b0 = 7.967 Å, c0 = 5.74 Å for the aragonite EBSD pattern. All post-processing was done with the Oxford Instruments Aztec Crystal software except for grain size distribution which was obtained with ATEX software.
EBSD data are typically represented by crystallographic maps and/or pole figures, which are stereographic projections of crystallographic planes with respect to a fixed plane ([0001] for calcite and [001] for aragonite).13,14,20 For this study, the data are presented using greyscale band contrast, phase maps, pole figures and color-coded crystallographic orientation maps, where colors correspond to the crystallographic planes of calcite or aragonite crystals. The EBSD band-contrast map provides a greyscale image of the polycrystalline microstructure. A light grey color indicates a high intensity of the Kikuchi signal, corresponding to strong crystallization and black/dark colors point to a weak or absent Kikuchi signal, e.g. grains boundaries, organic matter, poor crystallinity, or small grains. The EBSD crystallographic orientation maps are color-coded according to the crystals orientation and inverse pole figures color, meaning the color represents the crystal axis pointing toward the observer. The pole figures provide statistical data on crystallographic co-orientation, indicated by multiple uniform density (MUD) values. These values represent the strength of the clustering of poles, relative to that of a random distribution, or, in other terms, they are proportional to the degree of co-orientation of the crystals.3 A higher MUD value reflects stronger co-orientation.
After the acquisition of the EBSD maps, the same routine data cleaning protocol, with the Oxford Instruments Aztec Crystal software, was applied as follows:
(1) Wild spike removal.
(2) Zero solution clean-up – eight neighbors (iterated 10 times)
(3) Zero solution clean-up – seven neighbors (iterated 10 times)
(4) Zero solution clean-up – six neighbors (no iteration)
Wild spikes are isolated pixels exhibiting a unique orientation, surrounded by pixels that share a common but distinct orientation (within a small angular tolerance). These are likely mis-indexed points. In Aztec Crystal software, wild spike removal replaces each wild spike pixel with the most common orientation of its surrounding pixels.
Zero solutions occur when EBSD patterns are collected from points that could not be indexed. Common causes of zero solutions include grain boundaries, distorted regions, contamination, or the presence of unknown phases. In Aztec Crystal software, zero solution cleaning identifies these unindexed points and replaces them with the most frequent neighboring orientation, provided they have more than the minimum required number of indexed neighbors (depending on the specified level of cleaning).
For the Raman analysis, we used a Horiba Xplora Raman Spectrometer with a 532-semiconductor laser and analyzed the different carbonate-related modes particularly the ν1-CO3 mode for Raman mapping, in order to reveal possible changes in the position of the calcite peak, which could indicate intrinsic deformation between the foliated calcite and the prismatic aragonite layer.
Results and discussion
This study aimed to explore the microstructural and crystallographic insights provided by a combined approach using electron microscopy, specifically SEM imaging, EBSD analysis, and Raman spectroscopy to understand the impact of metal contamination on scallop shells. Focusing on the myostracum region in samples collected around the Isle of Man, our initial goal was to evaluate the complementary benefits of these techniques and identify the most appropriate protocols for conducting a more detailed statistical analysis on a larger set of shells.The areas of interest selected to assess the impact of contamination on the myostracum in the shell collected from the non-contaminated offshore region of Bradda, and in the shell collected from the contaminated Laxey area, are outlined in Fig. 3. Fig. 4 and 5 provide a closer view with SEM backscattered electron images of the region of interest of each sample.
 | ||
| Fig. 4 BSE micrographs of the myostracum region for the scallop shell collected in the non-contaminated Bradda area. (A) A general view of the region of interest. (B) The upper boundaries between the myostracum and the shell bulk. (C) The microstructures of the scallop in the region at the top of the myostracum. (D) The lower boundaries between the myostracum and the shell bulk. (E) The microstructures of the shell in the region below the myostracum. | ||
 | ||
| Fig. 5 BSE micrographs of the myostracum region for the scallop shell collected in the contaminated Laxey area. (A) A general view of the region of interest. (B) The upper boundaries between the myostracum and the shell bulk. (C) The microstructures of the scallop in the region at the top of the myostracum. (D) The lower boundaries between the myostracum and the shell bulk. (E) The microstructures of the shell in the region below the myostracum. | ||
Fig. 4(A) and 5(A) display an overall microstructural organization for the longitudinal section around the myostracum region of scallop shells respectively from non-contaminated and contaminated sites. These backscattered electron images show channeling contrast and provide an overview of crystal orientation variations, particularly within the myostracum, which is, in both types of scallops, clearly visible and sandwiched between two foliated calcite areas. This allows us to observe the distribution and shape of aragonite grains, with contrast variations corresponding to changes in crystal orientation.
First, it is observed that the overall organization was similar for both types of scallops. Focusing on the myostracum, it consists of elongated, oriented grains. However, the grains in the lower part of both myostracum layers are notably fine and small. These grains gradually increase in both length and width towards the upper part of the myostracum, while maintaining a consistent growth orientation, resulting in a clear size gradient. Despite this similarity between the two types of shells, a noticeable difference in morphology and distribution is observed. The grains in the myostracum within the shell from the non-contaminated site appear more elongated and regularly arranged.
Examining the calcitic regions surrounding the myostracum reveals notable differences in microstructure. Fig. 4(B), (C), 5(B) and (C) provide a closer view of the region above the myostracum. In both shell types, the shape and grain distribution are uniform and consistent in size (around 1 micron in size). The boundary between the aragonite myostracum and the calcitic bulk is clearly defined, with homogeneous grains in the upper calcitic region, contrasting with the larger, elongated grains of the upper myostracum. The contrast variations between the grains are due to slight differences in their relative orientations, due to the BSE channeling contrast.
The boundary between the two microstructures in the lower myostracum appears less distinct as can be observed in Fig. 4(D) and 5(D). Again, there is little difference between the two types of shells. This “blurred” transition is likely linked to nanocrystalline grains present at this interface, both in the myostracum and in the adjacent calcitic bulk. The grains in the lower myostracum are particularly tiny and thin, making the boundary between the two microstructures gradual within a region of 1–2 μm thickness.
Near the myostracum, the calcite grains are nanocrystalline (see Fig. 4(E) and 5(E)) and a size gradient is observed as the distance from the myostracum increases. In the shell from contaminated site, this gradient extends over a larger distance, resulting in a more extensive area of small grains compared to the well crystallized and larger grains observed in the shell from the non-contaminated area. The size of these grains associated with the gradient in grain size might be linked to changes in crystal growth induced by metal contamination, which may disrupt the natural shell structure. This hypothesis remains to be confirmed with a more in-depth study on a selected panel of shells after appropriate combined protocols selection.
Following the SEM analysis, we performed EBSD analysis on an adjacent area, on the myostracum region. The EBSD maps presented in Fig. 6 provide the results obtained for both types of shell and give information on the crystallography of each shell section.
 | ||
| Fig. 6 (A) BSE image, (B) EBSD band contrast map, (C) EBSD phase map (D) IPF colored map and pole figure obtained on the myostracum region for the non-contaminated case. (E) BSE image, (F) EBSD band contrast map, (G) EBSD phase map (H) IPF colored map and pole figure obtained on the myostracum region for the shell from the contaminated site. | ||
First, we can see on the phase map, in Fig. 6(C) and (G) that, in both cases, the well-oriented and crystallized myostracum layer is clearly composed of well-crystallized aragonite, surrounded by the calcite phase on top and a poorly indexed phase at the bottom. Thanks to the SEM images in Fig. 4(E) and 5(E), it was observed that the calcite grains beneath the myostracum are very fine. The extremely small size of these grains may partly explain the absence of EBSD detection in this region. However, calcite islands are detected at the lower boundary of the myostracum in the non-contamination affected shell, which are not observed in the contaminated shell, suggesting larger or better-crystallized calcite grains.
The EBSD orientation maps, presented in Fig. 6(D) and (H), focusing on the aragonite myostracum and accompanied by the pole figure, confirm the preferential orientation of the aragonite grains. When an oriented texture is present, pole figures reveal a cylindrical ‘cluster’ distribution. For both contaminated and non-contaminated sites scallop samples, we observe a concentration point with a nearly circular shape, indicating a clear, oriented texture of grains. A higher multiple uniform density (MUD) value reflects a stronger co-orientation. As we can see, the MUD value obtained in the myostracum region of the non-contamination affected sample is slightly higher than that of the shell from the contaminated site, revealing a slightly stronger co-orientation compared to the contaminated site sample. However, the difference remains too small to conclude any alteration of the myostracum microstructure due to pollution. The second phase of this project, with a more in-depth study on a selected panel of shells, will aim to obtain more data to validate these observations. Analyses of different areas throughout the entire length of the myostracum in the shells could also be interesting to observe the evolution of the crystallography of the myostracum as the shell grows.
Additionally, EBSD analysis allows us to detect orientation variations, which helps determine the size of orientation domains or the grain size when grain boundaries are identified (non-indexed grain boundaries). Fig. 7 presents EBSD maps of the grain size distribution in the myostracum, for both shell types, with a colored scale corresponding to the grain longest dimension providing a quantitative analysis of the variation in grain size within the myostracum. The size variation is clearly visible, indicating submicron grain-sizes at the lower interface (red orange) which rapidly increase in size towards the upper interface.
 | ||
| Fig. 7 EBSD grains maps with a color scale according to grain size (longest dimension) in the myostracum. | ||
The lower boundary is distinctly composed of small grains, which could reflect the early stages of growth since it is observable in both shells. The shell from the contaminated site, however, appears to have a broader grain distribution.
To obtain a more representative grain size distribution, it would be necessary to measure the grain sizes over a larger area to ensure a sufficient number of grains are sampled. However, even with the current map, it is already evident that the regular elongated shape observed in the non-contaminated site shell does not appear as consistently regular in the contaminated counterpart. In fact, surprisingly large grains can be observed (note turquoise, purple and magenta in Fig. 7(B)).
The parallel Raman study also revealed differences in response between the regions at the upper and lower boundaries of the myostracum. The results are presented in Fig. 8. Using the ν1-CO3 symmetric stretching mode for Raman mapping, we observed, for all analysed samples, systematic shifts in the peak position above, below and across the myostracum, with a difference of 0.5 cm−1 between each. In comparison to the aragonitic myostracum, the top calcite domain is 0.5 cm−1 higher, while the lower domain differs by 1 cm−1. The peak position in samples from the non-contaminated site is overall shifted to smaller wavelengths. Moreover, the ν1-CO3 peak width is marginally higher for the non-contaminated site shells than in its contaminated counterpart. This variation in peak position and width may indicate intrinsic crystallite strain or be related to smaller grain sizes. It remains to be determined whether the crystallite size or intrinsic strain contribute to the peak shift and broadening. However, small and pre-strained crystallites have been identified in other mineralized tissues such as dental enamel, dentin, bone, and other bivalve shells indicating that it could be a “toughening” feature, rather than a random occurrence.21–23
 | ||
| Fig. 8 (A) BSE images of a sample from non-contaminated (Bradda) and contaminated (Laxey) sites; (B) Raman spectra taken from the myostracum and foliated regions of the Bradda sample, (C) ν1-CO3 Raman maps evaluating peak intensity, position and full width at half maximum of the Bradda and (D) and Laxey samples, (E) comparison of line profiles from top to bottom of the ν1-CO3 Raman position and full width at half maximum for Bradda and Laxey samples. | ||
Furthermore, growth lines can be identified in the Raman maps associated with the accretion sequence during the myostracum formation. These growth lines are also visible in the SEM image of samples from both contaminated and non-contaminated sites and are shown in Fig. 4(B) and 5(B).
Raman spectroscopy, therefore, complemented the SEM and EBSD results by providing molecular-level insights into structural deformation. This information is critical for understanding how metal contaminants might affect the growth and resistance of shells at a fundamental level by disrupting the crystalline integrity between mineralized layers.
Conclusion
The myostracum region of the king scallop (Pecten maximus) was examined using a combination of scanning electron microscopy (SEM), electron backscatter diffraction (EBSD), and Raman spectroscopy on samples collected around the Isle of Man at a contaminated site (Laxey) and non-contaminated site (Bradda). The main goal of this study is to present a combination of different imaging techniques that can provide complementary insights into the structure and composition of the myostracum. Such a study has not yet been performed. This combined study shows significant variations in grain size and crystal organization between the contaminated and non-contaminated sites shells we selected to run this preliminary phase.SEM images reveal similar microstructural organization with finer grains in the lower myostracum of both shells, increasing in size towards the upper myostracum. However, the shell from the non-contaminated site has more regular, elongated grains. The calcitic regions display similar microstructural differences, with a well-defined boundary between the myostracum and calcite in the upper part but a less distinct transition at the lower interface between myostracum and foliated calcite, where nanocrystalline grains mark a gradual transition across the interface. In contrast this interface region shows a further extension within the shell from the contaminated site.
In this combination of analyses, SEM imaging is essential as the first step to determine the areas for further analysis. BSE images on polished surface samples provide an initial overview of the crystallography of the shells, allowing for more precise selection of the areas for EBSD analysis.
EBSD analyses confirm that both shells have well-crystallized aragonite in the myostracum, surrounded by calcite and fine calcite grains beneath the myostracum that are difficult to detect with this technique. Calcite islands were present at the lower boundary of the myostracum only in the shell from the non-contaminated site. EBSD orientation maps show preferential alignment of aragonite grains, with slightly higher co-orientation in the non-contaminated site shell. Grain size analyses reveal smaller grains at the lower boundary of both shells, with a broader distribution and larger grains in the contaminated shell, that might suggest potential crystal disruption due to contamination.
Raman maps obtained on the myostracum region, providing molecular-level insights into structural deformation, reveal shifts in peak positions, indicating possible crystal strain and/or differences in grain size. These variations may be related to a biological design aimed at toughening the shell, but pollution might disrupt this crystallization process, weakening the shell.
Additional techniques could be added to our study protocol to characterize the presence of pollutants within the shell. EDS analyses have already been studied in our previous research,11 but the detection limit did not allow for the observation of trace amounts of pollutant elements. ToF-SIMS analysis could be considered to determine the presence or absence of these pollutant metals in the shell with ppm level sensitivity.24
By combining scanning electron microscopy (SEM), electron backscatter diffraction (EBSD), and Raman spectroscopy, this study provides complementary insights into the structure and crystallography of the myostracum of scallop shells. It also allows us to further develop a combined analysis protocol that will be applied to additional samples from both non-contaminated and contaminated water areas, to identify trends regarding the influence of water pollution on the myostracum, as well as on the calcitic mass of scallop shells (Pecten maximus). Ultimately, our goal is to understand the impact of environmental contamination on shell structure and properties.
Data availability
The authors confirm that the data supporting the findings of this study are available within the article.Conflicts of interest
There are no conflicts to declare.References
- P. F. Duncan, et al., Chapter 19 - The European Scallop Fisheries for Pecten maximus, Aequipecten opercularis, Chlamys islandica, and Mimachlamys varia, in Developments in Aquaculture and Fisheries Science, ed. S. E. Shumway and G. J. Parsons, Elsevier, 2016, pp. 781–858 Search PubMed.
- E. Grefsrud, et al., Modifications in Microstructure of Cultured and Wild Scallop Shells (Pecten maximus), J. Shellfish Res., 2008, 27, 633–641 CrossRef.
- A. G. Checa, et al., Bending and branching of calcite laths in the foliated microstructure of pectinoidean bivalves occurs at coherent crystal lattice orientation, J. Struct. Biol., 2019, 205(3), 7–17 CrossRef CAS PubMed.
- A. R. Brand, Chapter 12 Scallop ecology: Distributions and behaviour, in Developments in Aquaculture and Fisheries Science, ed. S. E. Shumway and G. J. Parsons, Elsevier, 2006, pp. 651–744 Search PubMed.
- W. Dong, et al., Characterization of the Myostracum Layers in Molluscs Reveals a Conservative Shell Structure, Front. Mar. Sci., 2022, 9, 862929 CrossRef.
- M. Zuykov, E. Pelletier and D. A. T. Harper, Bivalve mollusks in metal pollution studies: from bioaccumulation to biomonitoring, Chemosphere, 2013, 93(2), 201–208 CrossRef CAS PubMed.
- K. Jordaens, et al., Associations between shell strength, shell morphology and heavy metals in the land snail Cepaea nemoralis (Gastropoda, Helicidae), Sci. Total Environ., 2006, 363(1–3), 285–293 CrossRef CAS PubMed.
- M. Mayer-Pinto, et al., Effects of metals on aquatic assemblages: What do we really know?, J. Exp. Mar. Biol. Ecol., 2010, 391(1–2), 1–9 CrossRef CAS.
- B. Stewart, M. W. J. Mosley and A. Brand, Population dynamics and predictions in the Isle of Man fishery for the great scallop, Pecten maximus (L.), ICES J. Mar. Sci., 2003, 224–242 CrossRef.
- B. D. Stewart, et al., Metal pollution as a potential threat to shell strength and survival in marine bivalves, Sci. Total Environ., 2021, 755, 143019 CrossRef CAS PubMed.
- L. Guichaoua, et al., Using Combination of X-Ray 3D Tomography and FEG-SEM to Perform 3D-FIB Reconstruction in Identified Area to Investigate Effect of Mining Contamination on Scallop Shell Growth, Microsc. Microanal., 2023, 29(Supplement1), 560–561 CrossRef.
- L. Guichaoua, et al., Electron microscopy characterization of king scallop (Pecten maximus) shells from low voltage SEM to 3D-EBSD by 3D-FIB reconstruction, in EMC 2024, Copenhagen, 2024 Search PubMed.
- E. Griesshaber, R. Neuser, and W. Schmahl, The application of EBSD analysis to biomaterials: microstructural and crystallographic texture variations in marine carbonate shells, 2010 Search PubMed.
- S. Hoerl, et al., Crystal organisation and material properties of Chama and Glycymeris myostraca and shells, Materialia, 2024, 36, 102149 CrossRef CAS.
- M. De La Pierre, et al., The Raman spectrum of CaCO3 polymorphs calcite and aragonite: A combined experimental and computational study, J. Chem. Phys., 2014, 140(16), 164509 CrossRef PubMed.
- A. Dandeu, et al., Raman Spectroscopy – A Powerful Tool for the Quantitative Determination of the Composition of Polymorph Mixtures: Application to CaCO3 Polymorph Mixtures, Chem. Eng. Technol., 2006, 29(2), 221–225 CrossRef CAS.
- A. Badou, et al., New insight on spatial localization and microstructures of calcite-aragonite interfaces in adult shell of Haliotis tuberculata: Investigations of wild and farmed abalones by FTIR and Raman mapping, J. Struct. Biol., 2022, 214(2), 107854 CrossRef CAS PubMed.
- F. D. Fleischli, et al., The influence of internal length scales on mechanical properties in natural nanocomposites: A comparative study on inner layers of seashells, Acta Biomater., 2008, 4(6), 1694–1706 CrossRef CAS PubMed.
- J. I. Goldstein, D. E. Newbury, J. R. Michael, N. W. M. Ritchie, J. H. J. Scott and D. C. Joy, Scanning Electron Microscopy and X-Ray Microanalysis, Springer, New York, NY, 4th edn, 2018 Search PubMed.
- A. Pérez-Huerta, et al., High resolution electron backscatter diffraction (EBSD) data from calcite biominerals in recent gastropod shells, Micron, 2011, 42(3), 246–251 CrossRef PubMed.
- R. Free, et al., Mesoscale structural gradients in human tooth enamel, Proc. Natl. Acad. Sci. U. S. A., 2022, 119(52), e2211285119 CrossRef CAS PubMed.
- J.-B. Forien, et al., Water-Mediated Collagen and Mineral Nanoparticle Interactions Guide Functional Deformation of Human Tooth Dentin, Chem. Mater., 2016, 28(10), 3416–3427 CrossRef CAS.
- B. Bayerlein, et al., Inherent Role of Water in Damage Tolerance of the Prismatic Mineral–Organic Biocomposite in the Shell of Pinna Nobilis, Adv. Funct. Mater., 2016, 26(21), 3663–3669 CrossRef CAS.
- M. Marimoutou, et al., Metal localisation in gastropod shells: New insights from mass spectrometry techniques, Chemosphere, 2023, 344, 140375 CrossRef CAS PubMed.
| This journal is © The Royal Society of Chemistry 2025 |