 Open Access Article
Creative Commons Attribution 3.0 Unported Licence
The potential effect of polyphenols in emerging pharmacological liver targets for glucose regulation and insulin resistance: a review
Sónia
Rocha
 a,
Inês
Santos
a,
M.
Luísa Corvo
b,
Eduarda
Fernandes
a,
Inês
Santos
a,
M.
Luísa Corvo
b,
Eduarda
Fernandes
 *a and
Marisa
Freitas
 *a
*a
aLAQV, REQUIMTE, Laboratory of Applied Chemistry, Department of Chemical Sciences, Faculty of Pharmacy, University of Porto, 4050-313 Porto, Portugal. E-mail: marisafreitas@ff.up.pt; egracas@ff.up.pt; Tel: +351 220428664 Tel: +351 220428675
bResearch Institute for Medicines, Faculdade de Farmácia, Universidade de Lisboa, 1649-003 Lisbon, Portugal
First published on 12th June 2025
Abstract
In type 2 diabetes mellitus (DM), there is a combination of impaired insulin secretion and resistance in the target tissues. In the case of the liver, these events lead to decreased insulin effectiveness and increased glucagon levels, resulting in an imbalance that promotes excessive hepatic gluconeogenesis and glycogenolysis, contributing to hyperglycemia. Effective management of hyperglycemia and insulin resistance is crucial, underscoring the need for innovative liver-specific interventions. Polyphenols, renowned for their diverse biological activities, have emerged as promising candidates to treat type 2 DM. Based on a literature review spanning the last decade, this comprehensive systematic review thoroughly evaluates the effectiveness of polyphenols in targeting hepatic pathways for managing type 2 DM. The focus will be on assessing how polyphenols affect key targets, including protein tyrosine phosphatase 1B (PTP1B), the glucagon receptor, glucokinase, glycogen phosphorylase, and fructose 1,6-bisphosphatase. While there has been considerable attention on polyphenols as PTP1B inhibitors, studies on their impact on other targets have been comparatively limited. Notably, there is a lack of studies exploring polyphenols as glucagon receptor antagonists. Among polyphenols, flavonoids exhibit significant potential across diverse pathways, with hydroxy groups playing a pivotal role in their biological activities. However, further research, especially in cellular and animal models, is warranted to thoroughly validate their efficacy.
1. Introduction
The epidemic of diabetes mellitus (DM) and its associated complications presents a major global health challenge. As a complex chronic illness, DM substantially increases the risk of developing microvascular and macrovascular complications. Its rising incidence and prevalence are particularly concerning, highlighting the urgent need for effective prevention and management strategies worldwide.1Various pharmacological interventions for DM aim to lower blood glucose levels. However, current therapeutic approaches have inherent limitations and adverse effects, including hypoglycemia, gastrointestinal disturbances, urinary tract infections, weight gain, and cardiovascular risk. These challenges underscore the need for novel treatment strategies to improve DM management.2 Given the liver's crucial role in glucose regulation, liver-targeted therapies are essential for glycemic control. However, the limited development of treatments directly addressing hepatic dysfunction reflects a prevailing challenge in current therapeutic strategies.3,4
A diverse range of bioactive compounds derived from plant-based sources, including vegetables, fruits, and edible leaves, has exhibited promising pharmacological properties, with polyphenols standing out as particularly significant.5–9 Despite the growing interest in the pharmacological potential of polyphenols, a comprehensive review of their effects on hepatic targets in the context of DM is still lacking. A comprehensive review of the existing literature on polyphenolic structures that have been investigated is crucial for identifying research gaps and potential therapeutic applications. This review aims to bridge this knowledge gap by summarizing current findings on polyphenols and their modulation of liver-related targets involved in glucose homeostasis and insulin resistance. Specifically, it explores polyphenols as inhibitors of protein tyrosine phosphatase 1B (PTP1B), glucagon receptor antagonists, glucokinase (GK) activators, glycogen phosphorylase (GP) inhibitors, and fructose 1,6-bisphosphatase (FBPase) inhibitors.
2. Diabetes mellitus
According to the World Health Organization, noncommunicable diseases (NCDs), including cardiovascular diseases, cancer, DM and chronic respiratory diseases, represent the leading cause of death globally, being responsible for 74% of deaths worldwide.10 Among the NCDs, DM stands out as a significant global health concern. In 2024 alone, nearly 3.4 million individuals lost their lives due to complications related to DM.1 Despite being one of the most extensively studied diseases, being first mentioned in ancient Egyptian medical texts,11 DM still demands continuous medical attention.12 The revolutionary discovery of insulin, 100 years ago, marked the turning point in the lifespan of DM patients from a fatal diagnosis into a medically manageable condition.13 Insulin is a 51-residue anabolic protein secreted by pancreatic β cells of the islets of Langerhans, comprising two chains, a 21-residue A chain and a 30-residue B chain, linked by disulfide bonds.14 Over the past 50 years, major discoveries concerning the mechanisms involved in insulin action and insulin resistance have provided important insights into the pathophysiology and management of DM.15DM manifests clinically as hyperglycemia and can be classified, according to the Standards of Medical Care in Diabetes (2022) of the American Diabetes Association, into type 1 DM, type 2 DM, specific types of DM due to other causes, and gestational DM.16 Among all individuals with DM, 10–15% have type 1 DM,17 while over 90% have type 2 DM, making it the most prevalent form of the condition.12
In type 1 DM, hyperglycemia develops as the consequence of the loss of the pancreatic islet β cells. Two forms of type 1 DM have been described, type 1A (autoimmune) and type 1B (idiopathic) DM. Type 1B is far less common and its pathogenesis remains unclear. Type 1A represents around 70–90% of patients, and displays evidence of an autoimmune response against pancreatic β cells.17 Despite the exact mechanisms remaining unclear, recent studies indicate that the β cell response is more complex than being just a passive target. The classic view considers that β cell loss is mediated by autoimmune mechanisms, where autoreactive T cells erroneously destroy healthy β cells. However, new insights have been recently proposed, considering β cells as key contributors to the disease. β Cells rapidly respond to glucose variations to maintain normal glucose levels. However, this constant demand for insulin release results in endoplasmic reticulum stress and accumulation of misfolded proteins, creating vulnerability and β cell exposure to the immune system.18–20 These new insights into β cell vulnerability and type 1 DM aetiology are creating novel opportunities for treatment.18
Type 2 DM is characterized by the occurrence of insulin resistance in insulin-sensitive tissues and impaired insulin secretion due to progressive dysfunction of β cells.12 However, the interplay between these two defects remains undefined in terms of primary cause-and-effect. The prevailing paradigm defends the idea that insulin resistance precedes impaired insulin secretion.21 In this case, to offset the imbalance due to insulin resistance, β cells increase insulin secretion, leading to hyperinsulinemia. This chronic adaptation of β cells, together with environmental and genetic factors, results in β cell malfunction and a progressive decline of insulin secretion. Subsequently, hyperglycemia and type 2 DM develops when the β cells are incapable of compensating for this imbalance.12,21 The less cited paradigm proposes an opposing viewpoint, suggesting that the primary defect leading to the development of type 2 DM is insulin hypersecretion, or hyperinsulinemia. This condition ultimately results in insulin resistance and eventual β cell failure. However, it is important to note that these paradigms are not fully understood.21–23
3. Hepatic glucose homeostasis and diabetes mellitus
Glucose serves as the primary source of energy for most tissues in the human body. Hence, maintaining the balance of glucose throughout the body involves a complex regulatory system.24 Generally, to balance glucose homeostasis, insulin is released after the post-prandial increase in glucose levels, a process known as glucose-stimulated insulin secretion.25 After consuming carbohydrates, there is an immediate increase in circulating glucose resulting from absorption in the intestine, leading to insulin secretion. Glucose homeostasis is mainly regulated by direct effects on skeletal muscle, adipocytes and the liver, with distinct roles in metabolic homeostasis. In skeletal muscle, insulin enhances glucose uptake and glycogen synthesis. Adipose tissues respond to insulin by suppressing lipolysis and increasing glucose uptake, leading to lipid accumulation by lipogenesis. In the liver, insulin activates glycogen synthesis, promotes lipid accumulation via lipogenesis and decreases glucose release (Fig. 1).26 In a fasting state, the pancreatic α cells secrete glucagon, a catabolic hormone that opposes the effects of insulin. Glucagon plays a crucial role in maintaining circulating glucose levels during fasting conditions. In the liver, glucagon stimulates hepatic glucose output by glycogenolysis and gluconeogenesis, while in adipocytes, it enhances lipolysis (Fig. 1).3 | ||
| Fig. 1 Schematic representation of glucose metabolism during the postprandial and fasting states in skeletal muscle, adipose tissue, and liver. | ||
The liver represents one of the most important organs for glucose metabolism. Hepatocytes express several enzymes with actions depending on glucose concentrations. In the postprandial state, blood glucose enters hepatocytes by the glucose transporter type 2 (GLUT2), an energy-independent membrane-bound transporter (Fig. 2).27 Once inside the hepatocyte, glucose is phosphorylated to glucose 6-phosphate by GK, lowering intracellular glucose concentrations and increasing glucose uptake. Glucose transporters are not able to transport glucose 6-phosphate, so it remains retained inside the hepatocyte. Glucose 6-phosphate may be further metabolized in glycolysis, a critical ten-step process to generate energy. Also, in the postprandial state, glucose 6-phosphate is used to synthesize glycogen by glycogen synthase, the process known as glycogenesis (Fig. 2).28 The accumulation of glycogen, which consists of polymerized glucose, during the postprandial state in the liver, is an essential storage form of glucose, which can be utilized during fasting conditions.29 In the fasting state, hepatic glucose production accounts for nearly 90% of endogenous glucose production,30 providing glucose for other tissues such as the brain and muscle. Initially, hepatic glucose production starts with the release of glucose from stored glycogen, a process known as glycogenolysis (Fig. 2), with GP playing a major role. During prolonged periods of starvation, liver glycogen stores are depleted, and de novo glucose synthesis is initiated through gluconeogenesis. The primary source of new glucose is generated from non-carbohydrate precursors such as lactate, glycerol, and amino acids.29 These two pathways, gluconeogenesis and glycogenolysis, lead to an increase in glucose release into the bloodstream, with a consequent uptake of glucose by the peripheral tissues (Fig. 2).3
Typically, glucose levels within the normal range fall between 70 to 90 mg per dL. Type 2 DM develops when insulin levels are insufficient to counteract insulin resistance.12 In individuals with type 2 DM, the hepatic glucose production is increased and the suppression of glucose metabolism by insulin is impaired both in the fasted and postprandial states. However, DM is not solely characterized by insulin deficiency. Elevated levels of glucagon are characteristic of type 2 DM patients, leading to increased gluconeogenesis and glycogenolysis, contributing to hyperglycemia.3,12 Additionally, individuals with insulin resistance often exhibit enhanced de novo lipogenesis, resulting in fat accumulation in the liver and increased secretion of triglycerides, leading to elevated blood lipid levels.31 Type 2 DM frequently coexists with non-alcoholic fatty liver disease (NAFLD), now recognized as metabolic dysfunction-associated fatty liver disease (MAFLD). MAFLD encompasses steatosis (non-alcoholic fatty liver, NAFL) and non-alcoholic steatohepatitis (NASH), with increasing hepatic fibrosis, which can progress to cirrhosis, liver cancer, end-stage liver disease, and death.32,33 The global prevalence of MAFLD in patients with type 2 DM is estimated to be around 56%, posing an increased risk of adverse hepatic and extra-hepatic clinical outcomes.34
Prolonged hyperglycemia in DM is associated with micro- and macrovascular complications, such as damage to the kidneys, blood vessels and eyes. Treating hyperglycemia is of utmost importance in type 2 DM patients, with the liver being an important target organ for glucose homeostasis. Therefore, drugs that can target glucose metabolism or glucose uptake in the liver have the potential to improve hyperglycemia.3 The increased hepatic glucose output, a hallmark of liver dysregulation in type 2 DM, is not directly addressed by the currently prescribed antidiabetic medications, except for metformin.35 This biguanide compound derivative, unlike most commercial drugs, is derived from a natural product used in herbal medicine, the plant Galega officinalis, and is the most widely prescribed drug for type 2 DM therapy. Despite being used clinically for 60 years, its exact mechanism of action remains incompletely understood.36 Metformin acts primarily through the improvement of blood glucose levels by suppressing hepatic gluconeogenesis.30 However, despite being the first-line agent for the treatment of type 2 DM, metformin is associated with various side effects, with up to 25% of patients experiencing gastrointestinal symptoms such as abdominal pain, diarrhea, nausea and vomiting, and approximately 5% are unable to tolerate metformin.37 It is essential to find novel targets for decreasing hepatic glucose production or to promote liver glucose storage with minimal side effects. Other liver-targeted agents have been investigated in the clinic for the treatment of type 2 DM, including PTP1B inhibitors, glucagon receptor antagonists, GK activators, GP inhibitors, and FBPase inhibitors.3
3.1 Protein tyrosine phosphatase 1B
Insulin is secreted into the portal vein, exposing the liver to insulin concentrations two- to three-fold higher than those in the general circulatory system. The insulin signaling pathway initiates equally in all cellular types, with the binding of insulin to the insulin receptor (IR) on the cellular membrane and the consequent autophosphorylation of the IR at the tyrosine residues. This receptor comprises two α-chains and two β-chains, where insulin binds to the extracellular α-subunits of the IR (Fig. 3).38 The activation of the IR triggers a downstream metabolic signaling pathway, with the recruitment of diverse substrates. In this way, the activated IR recruits the insulin receptor substrates (IRS), being subsequently phosphorylated at the tyrosine residues. The major IRS isoforms expressed in the hepatocytes are IRS1 and IRS2. The phosphorylated IRS serves as docking for phosphoinositide 3-kinase (PI3K), which phosphorylates phosphatidylinositol (4,5)-bisphosphate (PIP2) to generate phosphatidylinositol (3,4,5)-trisphosphate (PIP3). The activation of PIP3 allows the recruitment of 3-phosphoinositide-dependent protein kinase-1 (PDK1), which leads to the phosphorylation of protein kinase B (PKB, also known as Akt) at Thr308. In addition, Akt is also activated by phosphorylation by mammalian target of rapamycin (mTORC) 2 at Ser473. Fully activated Akt enables the signal of multiple metabolic processes, including glycogen synthase kinase-3 (GSK3), the transcription factor forkhead box O1 (FOXO1), and multiple regulators of mTORC1 activity.31,38 As represented in Fig. 3, Akt induces glycogen synthesis through inactivation of GSK3, allowing the activation of glycogen synthase. Also, Akt inhibits gluconeogenesis and induces GK expression by phosphorylating and inhibiting FOXO1. In addition, Akt activates mTORC1, resulting in stimulation of protein synthesis. mTORC1 promotes sterol regulatory element-binding protein 1c (SREBP1c) to increase lipid synthesis. Moreover, the carbohydrate response element binding protein (ChREBP) also activates lipogenesis.31,39In the cells, protein phosphorylation occurs mainly on tyrosine (Tyr), serine (Ser) and threonine (Thr) residues, with protein kinases and protein phosphatases being the two super-enzyme families responsible for phosphorylation and dephosphorylation, respectively.40 Each step in the insulin signaling pathway involves a reversible enzymatic reaction, where the activated kinases of the pathway can be dephosphorylated by a phosphatase to stop their action. The discovery of the tyrosine kinase activity of the IR and IRS prompted a search for tyrosine phosphatases that could terminate their activation. PTP1B, a member of the protein tyrosine phosphatases super-family, is a negative regulator of the insulin signaling pathway through the dephosphorylation of the tyrosine residues of IR and IRS (Fig. 3).41 In fact, since PTP1B is a negative regulator of the insulin signaling pathway, increasing evidence demonstrates that inhibitors of this enzyme might increase the levels of phosphorylation of IR and its substrates, improving insulin sensitivity. Therefore, PTP1B is considered a potential target for the management of type 2 DM.42 PTP1B is an intracellular PTP comprising 431 amino acids with a molecular size of 50 kDa. It is ubiquitously expressed, being localized at the cytoplasmic face of the endoplasmic reticulum (Fig. 3). The catalytic domain of PTP1B possesses near 40% sequence homology with the other PTPs.43 In addition to insulin signaling, PTP1B also displays actions in the leptin signaling pathway through the dephosphorylation of Janus kinase 2 (JAK2), leading to its deactivation. Therefore, PTP1B inhibition could decrease leptin resistance, being a possible therapeutic strategy for weight loss.40,44 Obesity is one of the epidemics of the 21st century and is associated with the development of type 2 DM and MAFLD, among other adverse pathological conditions.45 It is considered one of the major risk factors for developing type 2 DM, where around 90% of type 2 DM patients are overweight or obese.46,47 Indeed, as PTP1B can play several roles in different signaling pathways, increasing attention has been dedicated to this enzyme as an interesting therapeutic target.40,44
Up to now, only a few PTP1B inhibitors have reached clinical trials, including trodusquemine, ertiprotafib, and JTT-551. However, these inhibitors were discontinued from clinical trials due to reduced efficacy, lack of specificity, and adverse side effects.40,43 Taking this into account, it is crucial to find novel effective, selective, and safe PTP1B inhibitors.
3.2 Glucagon receptor
Glucagon is a linear peptide hormone composed by 29 amino acids secreted by the pancreatic α cells. As already mentioned, in opposition to insulin, glucagon serves as an antagonist hormone, stimulating hepatic glucose production by glycogenolysis and gluconeogenesis to avert hypoglycemia.48 Glucagon is secreted in response to various stimuli, with hypoglycemia, certain amino acids, central nervous system, and the incretin hormone gastric inhibitory polypeptide (also known as glucose-dependent insulinotropic polypeptide; GIP) being among the most notable inducers. In contrast, glucagon secretion is suppressed by high glucose levels, by insulin, amylin, somatostatin, and by another incretin, glucagon-like peptide-1 (GLP-1). In a healthy individual, all the factors are coordinated to regulate glucagon secretion,49 where the levels of glucagon in the blood ranges from 6–12 pM (∼20–40 pg mL−1) after an overnight period of fasting, and from 3–5 pM (∼10–17 pg mL−1) in the postprandial state. Individuals with type 2 DM frequently develop fasting and postprandial hyperglucagonemia, showing a 50 to 100% increase in glucagon levels in the fasting state, which leads to increased hepatic production of glucose, and the consequent development of hyperglycemia. In addition, the administration of exogenous insulin is not enough to normalize glucagon levels in individuals with type 1 and type 2 DM.50 In fact, it was demonstrated that postprandial hyperglucagonemia is responsible for 50% of the increments in plasma glucose in type 2 DM patients.49 Hence, addressing the dysfunctions associated with glucagon has emerged as a new therapeutic avenue. Specifically, targeting the glucagon receptor may be a promising approach to reduce the hepatic glucose production and lower plasma glucose levels.3In the hepatocyte, glucagon binds to its seven-transmembrane receptor, a G protein-coupled receptor that can be also found in pancreatic β cells, activating adenylate cyclase to increase intracellular levels of cyclic adenosine monophosphate (cAMP), which in turn stimulates protein kinase A (PKA) signaling. PKA activation subsequently induces cAMP-response element-binding protein (CREB) and its coactivators CREB-regulated transcriptional coactivator 2 (CRTC2) and CREB-binding protein (CBP), thereby activating gluconeogenic enzymes. The binding of glucagon also activates the phospholipase C (PLC)/inositol triphosphate (IP3)/Ca2+ pathway, responsible for increasing the intracellular Ca2+ levels. Both pathways mediate the hyperglycemic effects of glucagon (Fig. 4).30,51,52
Targeting the glucagon receptor represents a promising approach under investigation to reduce hepatic glucose production. Research findings have demonstrated that mice lacking glucagon receptors in the liver exhibit improved glucose tolerance, elevated plasma glucagon levels and higher insulin sensitivity. Some evidence demonstrates that the hepatic glucagon receptor is linked to the development of pancreatic α cells, where α cell hyperplasia was observed in mice lacking the glucagon receptor. In addition, besides the glucose regulatory effect, pharmacological inhibition of the glucagon receptor also plays a role in lipid metabolism. However, inconsistent results have been observed, with both elevations and reductions in blood cholesterol levels.53 It remains unclear if this effect is translated to humans, highlighting the need for additional studies on this subject.30
Bay 27-9955, MK-0893 and LY2409021 are three glucagon receptor antagonists already studied in human clinical trials.30 Bay 27-9955 decreased fasting glucose levels in humans, but the trials were discontinued. MK-0893 is a selective and reversible competitive glucagon receptor antagonist compound that showed improvements in hyperglycemia. However, it has been observed to cause increases in plasma cholesterol levels. LY2409021 showed a promising reduction in glucose levels in phase I and phase II clinical trials, and clinical development is ongoing.3,30 Recent studies with LY2409021 showed that this glucagon receptor antagonist was able to decrease fasting plasma glucose concentrations, with no improvements in postprandial glucose tolerance in type 2 DM patients.54 While results with glucagon receptor antagonists suggest that this target could be a promising strategy in DM, further research is needed.
3.3 Glucokinase
GK, also known as hexokinase IV or hexokinase D, belongs to the hexokinase family. In mammals and other vertebrates, four hexokinases have been discovered and identified as hexokinase I–IV, or as hexokinase A–D. Hexokinases I, II and III possess a molecular weight of near 100 kDa, while hexokinase IV, GK, displays a molecular weight of near 50 kDa, and is composed of 465 amino acids.55In the human body, GK is mainly expressed in the pancreatic β cells and liver cells. This enzyme is responsible for the first step of glucose metabolism, catalyzing the phosphorylation of D-glucose to glucose 6-phosphate.56 In pancreatic β cells, GK acts as a glucose sensor, controlling the threshold for glucose-stimulated insulin secretion. In type 2 DM individuals, insulin secretion is impaired in part due to the reduced activity of GK. Therefore, increased levels of glucose are required to initiate insulin secretion. In hepatocytes, this enzyme plays a key role in glucose uptake and hepatic glucose regulation,57 and its activity is regulated through an interaction with the GK regulatory protein (GKRP), which binds and inactivates GK in the nucleus. In the postprandial state, GK is released to the cytoplasm following GKRP–GK complex disruption, stimulating glycolysis, glycogen production and storage and de novo lipogenesis (Fig. 5). In the fasting state, GKRP inactivates the enzyme, and glycogenolysis and gluconeogenesis pathways are activated to produce glucose.58 In type 2 DM individuals, it is described an impairment of near 50% of the GK activity during the progression of the disease, contributing to the reduction of glycogen storage and improper glucose regulation.57
 | ||
| Fig. 5 Molecular regulation of GK in hepatic cells. GK: glucokinase; GKRP: GK regulatory protein; GLUT2: glucose transporter 2. | ||
GK activation is a potential intervention for glucose homeostasis. GK activation targeting the liver stimulates hepatic glucose uptake and glycogen production and storage, inhibiting glycogenolysis. The activation of GK in pancreatic β cells stimulates the secretion of insulin. The net effect of GK actions in the liver and β cells, in addition to its reduced activity in type 2 DM individuals, has led to the development of dual activators targeting both the liver and pancreas, or only selective activators targeting only one tissue.35,59 However, GK activators have not reached clinical use due to adverse side effects, including hypoglycemia, toxicity, and increased plasma concentration of triglycerides. Still, these effects might be preventable with patient selection and liver-selective GK activators.59 The liver-selective GK activator PF-04991532 has shown favorable effects on glucose regulation in diabetic rats. However, additional studies need to be conducted due to the occurrence of oxidative metabolites of the compound found in the human plasma. Additional clinical studies are underway with another liver-selective GK activator, TTP399.3 Recent clinical studies with TTP399 have demonstrated promising effects.60,61 These clinical investigations aim to assess whether glycemic control is improved in patients with type 1 DM, without increasing hypoglycemia or ketoacidosis. The findings indicate enhanced glycemic control without elevating the incidence of hypoglycemia, and reduced occurrence of diabetic ketoacidosis.60,61
A different approach for GK activators is to inhibit the binding to GKRP. This approach could be beneficial since liver-selective GKRP inhibition decreases glucose levels without the risk of hypoglycemia. The compound AMG-3969, which can dissociate GK and its receptor, showed promising results in a diabetic mice model, decreasing blood glucose levels, with no effect in normal mice.3 These effects with liver-selective GK activators or liver-selective GKRP inhibitors have been demonstrating encouraging results as a novel alternative to be used as antidiabetic agents.
3.4 Glycogen phosphorylase
Glycogen stored in the liver serves as a crucial source of glucose, particularly valuable during periods of reduced food intake. GP is a key enzyme involved in the glycogenolysis pathway. This enzyme catalyzes the degradation of glycogen at the α-1,4-glycosidic linkage, to produce glycogen 1-phosphate.62 This product can be converted into glucose 6-phosphate by phosphoglucomutase (PGM), and glucose 6-phosphate can be further transformed into glucose by glucose 6-phosphatase (G6Pase). Glucose can then be transported from the hepatocyte into the bloodstream (Fig. 6).29GP exists in two interconvertible forms, the active phosphorylated GPa form, and the inactive dephosphorylated GPb form.63 GP activation requires a cascade mechanism in the hepatocyte, which starts with the binding of glucagon to its receptor, activating the cAMP/PKA signaling pathway, already mentioned in section 3.2. PKA phosphorylates phosphorylase kinase (PhK), which in turn activates GP by serine-14 phosphorylation (Fig. 6).29,62
Three different isoforms of GP have been identified, involving different tissue locations and physiological functions, namely in the brain (bGP), liver (lGP), and muscle (mGP). bGP provides an energy supply of glucose for periods of hypoglycemia, mGP delivers energy during muscle contraction, and lGP ensures glucose release from hepatic glycogen to other parts of the body.64,65 Therefore, as a key isoform involved in glucose regulation, lGP is a target for new possible pharmaceutical interventions. The inhibition of lGP may reduce plasma glucose levels by increasing glucose storage in the form of glycogen, reducing hyperglycemia.62 In addition, as glucose is a physiological regulator of lGP, inhibitors of lGP offer an appealing advantage. They demonstrated the ability to inhibit the enzyme at elevated blood glucose levels, but their potency diminishes when blood glucose levels decrease, thereby reducing the risk of hypoglycemia.3 However, there is a sequence homology among brain, muscle and liver isoforms of around 80%, and around 100% homology in the catalytic site of the enzyme.66 This high homology among isoforms is posing challenges in the search for a selective inhibitor of lGP. mGP inhibition is associated with serious adverse side effects in muscle due to the accumulation of glycogen in the tissues. Hence, it is essential to find selective and safe GP inhibitors.62
CP-368962 is a GP inhibitor that has been studied in clinical trials, showing hypoglycemic effects in type 2 DM individuals. However, after 4 weeks of treatment with CP-368962, the hypoglycemic effect was lost, indicating reduced durability of the effect.3 Therefore, additional studies are needed to identify novel GP inhibitors.
3.5 Fructose 1,6-bisphosphatase
The inhibition of gluconeogenesis is a promising strategy for type 2 DM management. However, so far, drugs targeting directly gluconeogenesis have not been approved for medical use.67 FBPase is a cytosolic enzyme that catalyzes the hydrolysis of fructose 1,6-bisphosphate to fructose 6-phosphate, being a key regulatory enzyme of gluconeogenesis (Fig. 7).68 Human FBPase consists of four identical polypeptide chains with 337 amino acid residues and nearly 37 kDa per submit. Two isoforms have been reported, the liver FBPase (FBP1), expressed in liver and kidney tissues, and the muscle FBPase (FBP2), found in the muscle tissue. FBP1 and FBP2 display nearly 77% homology, with almost complete identity at the active site.69 FBP1 is recognized as a regulatory enzyme of gluconeogenesis with a crucial role in the regulation of glucose levels, whereas the physiological role of FBP2 is not yet elucidated. Considering its central role in endogenous glucose production, it has been recognized as a potential target for the management of type 2 DM.69,70 Phosphoenolpyruvate carboxykinase (PEPCK), which converts oxaloacetate to phosphoenolpyruvate (PEP), and glucose 6-phosphatase (G6Pase), which catalyzes the conversion of glucose 6-phosphate to glucose, were the primary targets studied in gluconeogenesis for type 2 DM treatment. However, the inhibition of these enzymes is associated with several limitations and adverse effects. Moreover, the levels of PEPCK and G6Pase are not elevated in patients with type 2 DM.3,69 The presence of side effects has limited the research on inhibitors targeting these enzymes. Thus, FBPase represents a valid molecular target for gluconeogenesis inhibition.3,69 Furthermore, in the liver, FBPase is elevated in insulin-resistant and insulin-deficient animal models of DM, emphasizing the importance of this enzyme in the control of glucose levels of DM patients.67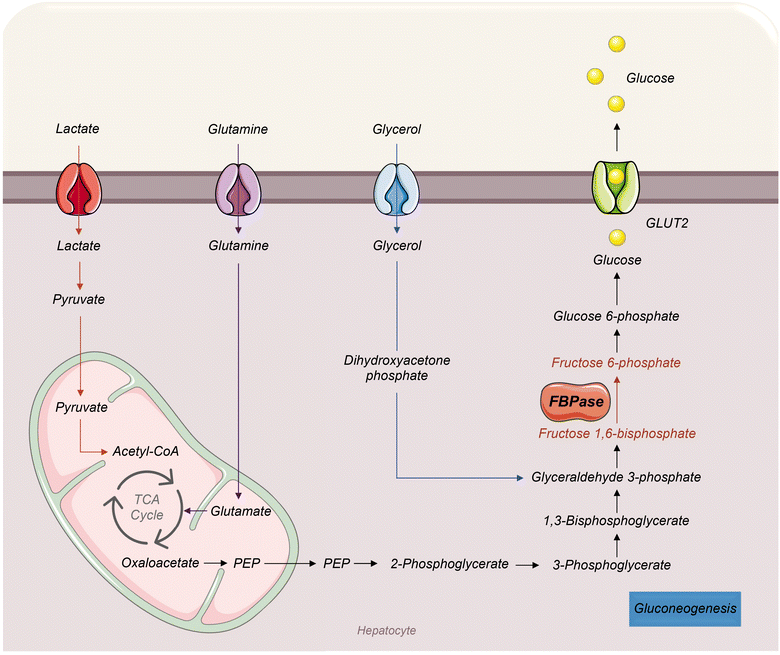 | ||
| Fig. 7 Representation of the hepatic gluconeogenesis process. FBPase: fructose 1,6-bisphosphatase; GLUT2: glucose transporter 2; PEP: phosphoenolpyruvate; TCA: tricarboxylic acid. | ||
MB07803 is a FBPase inhibitor already studied in clinical trials in type 2 DM patients. This inhibitor leads to the reduction of blood glucose levels. However, some patients experienced nausea and vomiting at higher doses, highlighting the need for additional studies with this compound. Furthermore, exploring the potential of novel FBPase inhibitors is essential.3
4. Polyphenols
Natural products are recognized for their great value in human health. Historically, plants have been traditionally used as medicines to treat several diseases. Hence, some medications are obtained from natural sources or derived from natural compounds. Acarbose (α-glucosidase inhibitor class) and metformin (biguanides class) are examples of antidiabetic medications derived from natural compounds. Studies with natural products have been increasing over the last few years, providing unique resources for drug discovery.71Polyphenols are naturally occurring compounds found in plants, comprising more than 8000 structures discovered to date in several plant species, including vegetables, fruits, grains, and beverages.2,72 Polyphenols comprise an essential part of the human diet, being responsible for some sensory and nutritional aspects of plant foods, including astringency, color and odor. As natural compounds synthesized by plants, these secondary metabolites are mainly involved in the attraction of pollinators, defense against ultraviolet radiation and protection against pathogens.73
Polyphenols consist of one or more phenolic groups in a molecule, varying from a single phenolic structure to a complex polymer with a high molecular mass.2,72 Polyphenols can be categorized in diverse forms due to the high diversity and distribution. The most common polyphenols can be classified according to the number of phenol rings and the structural elements that bind these rings into phenolic acids [benzoic acid derivatives (C1–C6) and cinnamic acid derivatives (C3–C6)], stilbenes (C6–C2–C6), flavonoids (C6–C3–C6, flavanones, flavones, flavanols, flavonols, isoflavones and anthocyanidins) and lignans (C6–C4–C6) (Fig. 8). Flavonoids are the most common and abundant group among polyphenols, with phenolic acids being the second most abundant group.2,74,75
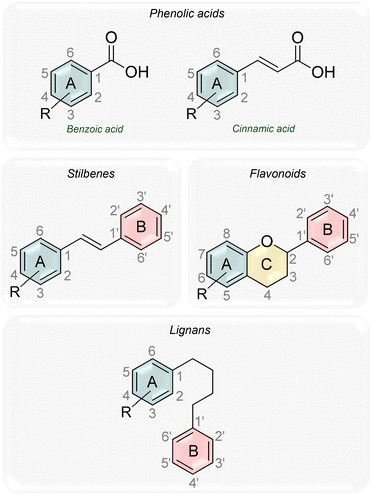 | ||
Fig. 8 Schematic representation of the general backbone structures illustrating phenolic acids, stilbenes, flavonoids, and lignans. R![[double bond, length as m-dash]](https://www.rsc.org/images/entities/char_e001.gif) OH. OH. | ||
Polyphenols have been recognized for numerous pharmacological activities, including antioxidant, cardioprotection, anticancer, anti-inflammatory, antimicrobial, anti-ageing, anti-obesity, and antidiabetic activities, among others, as reviewed by various authors.5–9 Increasing attention has been dedicated to the study of the antidiabetic activity of polyphenols, which can act on several different targets, including α-amylase and α-glucosidase,76 dipeptidyl peptidase-4,77 sodium-glucose cotransporter 2,78 and proliferator-activated receptor γ,79 among others. However, the studies with isolated polyphenols in clinical trials are still limited and often controversial, and therefore further studies are required to better understand the potential of these compounds as antidiabetic agents in humans.80 The limited bioavailability and extensive metabolism of these compounds have constrained their potential in vivo effects, making this a key topic of growing scientific interest that has been extensively addressed in several reviews.2,81–84 In their natural form, dietary polyphenols are often present as glycosides, esters, or complex polymers, which are poorly absorbed in the human gastrointestinal tract.84 Upon ingestion, these compounds undergo extensive transformation by intestinal enzymes and/or by colonic microflora before absorption, resulting in metabolites with substantial structural modifications. Following absorption, these metabolites reach the liver via the portal circulation, where they are further processed. The resulting hepatic metabolites then enter systemic circulation and are distributed to the peripheral tissues, where they may exert biological effects.2,82 The chemical structure of each polyphenol largely determines its absorption, distribution, metabolism, and excretion (ADME).84 These metabolic complexities contribute to the challenges of translating promising in vitro findings into consistent clinical outcomes. Despite the growing body of research, clear conclusions on polyphenol bioavailability remain limited. Reported plasma concentrations following normal dietary intake rarely exceed nanomolar to low micromolar levels,85,86 which contrasts with the higher concentrations commonly used in in vitro studies. Therefore, in clinical settings, it is essential to consider the most effective forms of polyphenol administration to enhance their therapeutic potential. Numerous strategies are currently being explored to improve their bioavailability, with nanotechnology showing promising results in increasing their efficacy and stability in vivo.2
Finding new alternatives to the current antidiabetic medications is required to manage type 2 DM with reduced side effects, and several polyphenols have been demonstrated to be promising compounds. As such, the main purpose of the present review is to highlight the effect of polyphenols on liver targets currently investigated in the clinic for the treatment of type 2 DM, including PTP1B, glucagon receptor, GK, GP, and FBPase.
4.1 Polyphenols as modulators of liver targets for diabetes mellitus treatment
A search on the PubMed database was conducted, using as keywords “polyphenols OR polyphenol OR phenolic acids OR phenolic acid OR stilbenes OR stilbene OR flavonoids OR flavonoid OR lignans OR lignan”, with each one of the following liver targets: “protein tyrosine phosphatase 1B” (186 results), “glucagon receptor” (92 results), “glucokinase” (57 results), “glycogen phosphorylase” (44 results), and “fructose 1,6-bisphosphatase” (18 results). Data were collected and articles from the last 10 years, from 2014 to February 2024, were included in the revision. Eligibility criteria included papers focused solely on polyphenols targeting PTP1B, glucagon receptor, GK, GP, and FBPase, in in vitro and in vivo studies. Studies performed with plant extracts and in silico studies were excluded from this review.| Chemical structure | Compound source | Model | Effect | Ref. |
|---|---|---|---|---|
| ↑ means “increase”, ↓ means “reduction”. IC50: half-maximal inhibitory concentration, IRS2: insulin receptor substrate 2, PTP1B: protein tyrosine phosphatase 1B, STZ: streptozotocin, DM: diabetes mellitus. | ||||
| In vitro studies | ||||

|
Commercial | Non-cellular enzymatic study (human PTP1B) | IC50 = 0.18 ± 0.02 mg mL−1 | 100 |

|
Commercial | Non-cellular enzymatic study | IC50 = 7.62 ± 0.21 μM | 89 |

|
Commercial | Non-cellular enzymatic study (human PTP1B) | IC50 = 37.14 ± 0.07 μM | 88 |
|
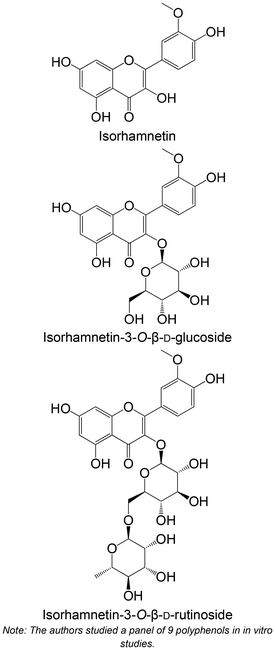
Isolated from Anoectochilus chapaensis | Non-cellular enzymatic study (human PTP1B) | Isorhamnetin: IC50 = 1.75 ± 0.02 μM | 102 |
| Isorhamnetin-3-O-β-D-glucoside: IC50 = 1.16 ± 0.03 μM | ||||
| Isorhamnetin-3-O-β-D-rutinoside: IC50 = 1.20 ± 0.05 μM | ||||

|
Isolated from Epimedium koreanum | Non-cellular enzymatic study (human PTP1B) | IC50 = 9.94 ± 0.15 μM | 103 |

|
Isolated from Xanthium strumarium | Non-cellular enzymatic study | IC50 = 8.9 ± 0.7 μM | 104 |

|
Isolated from Artemisia capillaris | Non-cellular enzymatic study (human PTP1B) | IC50 = 139.75 ± 2.97 μM | 105 |

|
Commercial | Non-cellular enzymatic study (human PTP1B) | IC50 = 7.76 ± 0.21 μM | 106 |
|
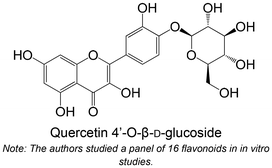
Isolated from Smilax china L. | Non-cellular enzymatic study (human PTP1B) | IC50 = 0.92 ± 0.19 μM | 90 |
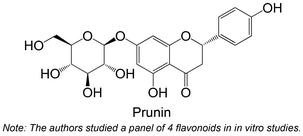
|
Not mentioned | Non-cellular enzymatic study | IC50 = 17.5 ± 2.6 μM | 91 |

|
Isolated from Acer ginnala Maxim. | Non-cellular enzymatic study (human PTP1B) | IC50 = 3.46 ± 0.05 μM | 107 |

|
Synthesis | Non-cellular enzymatic study (human PTP1B) | 1: IC50 = 16 ± 2 μM | 96 |
| 2: IC50 = 10 ± 1 μM | ||||

|
Isolated from Quercus liaotungensis | Non-cellular enzymatic study (human PTP1B) | IC50 = 1.03 ± 0.12 μM | 87 |

|
Isolated from Agrimonia pilosa | Non-cellular enzymatic study (human PTP1B) | Ellagic acid: IC50 = 7.14 ± 1.75 μM | 108 |
| Apigenin 7-O-β-D-glucuronide: IC50 = 7.73 ± 0.24 μM | ||||

|
Isolated from Angelica keiskei | Non-cellular enzymatic study | IC50 = 0.82 ± 0.09 μg mL−1 | 109 |

|
Synthesis | Non-cellular enzymatic study (human PTP1B) | IC50 = 0.57 ± 0.2 μM | 101 |
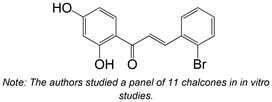
|
Synthesis | Non-cellular enzymatic study | 96.31 ± 1.76% at 20 μg mL−1 | 110 |

|
Isolated from Glycyrrhiza glabra | Non-cellular enzymatic study | IC50 = 6.0 ± 1.4 μM | 97 |

|
Isolated from Salvia amarissima Ortega | Non-cellular enzymatic study (human PTP1B) | IC50 = 62.0 ± 4.1 μM | 111 |
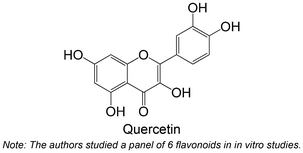
|
Isolated from Hypericum scabrum | Non-cellular enzymatic study | IC50 = 2.19 ± 0.2 μM | 112 |
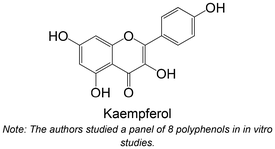
|
Isolated from Silybum marianum | Non-cellular enzymatic study (human PTP1B) | IC50 = 6.79 ± 0.22 μM | 113 |

|
Isolated from Eremophila denticulata | Non-cellular enzymatic study (human PTP1B) | 76.1 ± 12.4% at 100 μM | 114 |

|
Commercial | Non-cellular enzymatic study (human PTP1B) | IC50 = 6.70 ± 0.03 μM | 115 |

|
Isolated from Geranium collinum | Non-cellular enzymatic study | IC50 = 0.23 ± 0.04 μg mL−1 | 116 |

|
Isolated from Coreopsis tinctoria Nutt. | Non-cellular enzymatic study | IC50 = 7.73 ± 0.48 μg mL−1 | 117 |
|
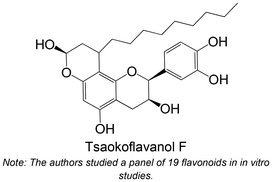
Isolated from Amomum tsao-ko | Non-cellular enzymatic study | IC50 = 56.4 ± 5.0 μM | 118 |

|
Isolated from Eremophila bignoniiflora | Non-cellular enzymatic study (human PTP1B) | IC50 = 41.4 ± 1.4 μM | 119 |
|
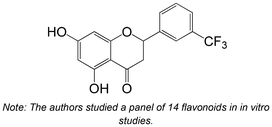
Synthesis | Non-cellular enzymatic study | IC50 = 2.37 ± 0.37 μM | 120 |

|
Isolated from Livistona chinensis | Non-cellular enzymatic study (human PTP1B) | IC50 = 9.41 ± 0.08 μM | 121 |

|
Isolated from Helminthostachys zeylanica | Non-cellular enzymatic study (human PTP1B) | IC50 = 0.6 ± 0.2 μM | 122 |

|
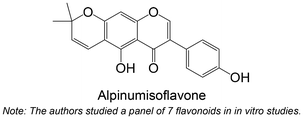
Isolated from Euonymus alatus | Non-cellular enzymatic study (human PTP1B) | IC50 = 13.7 ± 0.2 μM | 123 |
|
Isolated from Ficus tikoua | Non-cellular enzymatic study | IC50 = 11.16 ± 1.88 μM | 124 |

|
Isolated from Psoralea corylifolia | Non-cellular enzymatic study | IC50 = 10.3 ± 0.9 μM | 125 |

|
Synthesis | Non-cellular enzymatic study | IC50 = 1.6 ± 0.9 μM | 126 |

|
Isolated from Flemingia philippinensis | Non-cellular enzymatic study (human PTP1B) | IC50 = 2.4 ± 0.3 μM | 127 |

|
Isolated from the roots of Sophora flavescens | Non-cellular enzymatic study | IC50 = 5.26 ± 0.24 μM | 128 |

|
Isolated from Paulownia tomentosa | Non-cellular enzymatic study | IC50 = 1.9 ± 0.1 μM | 98 |

|
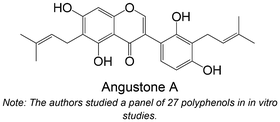
Isolated from Macaranga denticulata | Non-cellular enzymatic study | IC50 = 14.0 ± 1.2 μM | 99 |
|
Isolated from Erythrina subumbrans | Non-cellular enzymatic study | IC50 = 3.21 ± 0.24 μM | 129 |

|
Isolated from Dodonaea viscosa | Non-cellular enzymatic study | IC50 = 13.5 ± 0.3 μM | 130 |
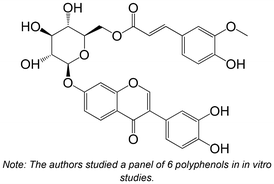
|
Isolated from Sophora alopecuroides L. | Non-cellular enzymatic study (human PTP1B) | Inhibition = 95.22% at 0.1 μg mL−1 | 131 |
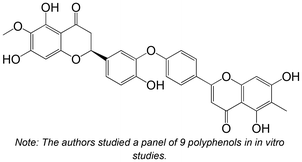
|
Isolated from Selaginella uncinata | Non-cellular enzymatic study | IC50 = 4.6 ± 0.5 μM | 132 |
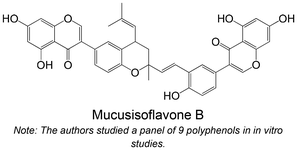
|
Isolated from Ficus racemosa | Non-cellular enzymatic study (human PTP1B) | IC50 = 2.5 ± 0.2 μM | 133 |
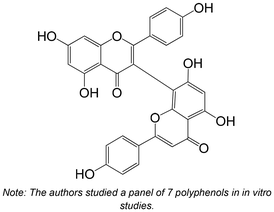
|
Isolated from Selaginella tamariscina | Non-cellular enzymatic study (human PTP1B) | IC50 = 4.5 ± 0.1 μM | 134 |

|
Isolated from Silybum marianum | Non-cellular enzymatic study (human PTP1B) | Silybin A: IC50 = 1.54 ± 0.22 μM | 135 |
| Isosilybin B: IC50 = 1.37 ± 0.22 μM | ||||

|
Isolated from Cudrania tricuspidata | Non-cellular enzymatic study (human PTP1B) | Cudratricusxanthone N: IC50 = 2.0 ± 0.4 μM | 136 |
| Cudracuspixanthone A: IC50 = 1.9 ± 0.4 μM | ||||

|
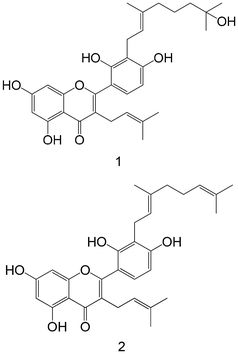
Isolated from Polygonum multiflorum | Non-cellular enzymatic study (human PTP1B) | 1: IC50 = 2.1 ± 0.08 μM | 137 |
| 2: IC 50 = 1.9 ± 0.04 μM | ||||

|
Isolated from Morus laevigata | Non-cellular enzymatic study | IC50 = 0.87 ± 0.09 μM | 138 |

|
Isolated from Morus nigra | Non-cellular enzymatic study | Morunigrines A: IC50 = 1.8 ± 0.2 μM | 139 |
| Morunigrines B: IC50 = 1.3 ± 0.3 μM | ||||

|
Isolated from Morus alba L. | Non-cellular enzymatic study (human PTP1B) | IC50 = 1.90 ± 0.12 μM | 140 |

|
Isolated from Allium cepa | Non-cellular enzymatic study | 1: IC50 = 1.68 ± 0.02 μM | 141 |
| 2: IC50 = 1.13 ± 0.01 μM | ||||
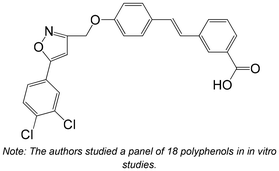
|
Synthesis | Non-cellular enzymatic study | IC50 = 0.91 ± 0.33 μM | 142 |
|
Isolated from Morus alba | Non-cellular enzymatic study | IC50 = 2.85 ± 0.30 μM | 143 |

|
Isolated from Rheum undulatum | Non-cellular enzymatic study (human PTP1B) | Piceatannol: IC50 = 4.81 ± 0.21 μM | 144 |
| δ-Viniferin: IC50 = 4.25 ± 0.02 μM | ||||
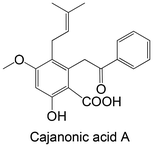
|
Isolated from Cajanus cajan | Cellular study with HepG2 cells overexpressing PTP1B | No differences in PTP1B mRNA expression | 145 |
| ↓ PTP1B protein expression | ||||

|
Isolated from Juniperus chinensis | Non-cellular enzymatic study (human PTP1B) | IC50 = 25.27 ± 0.14 μM | 146 |
| Cellular study with insulin-resistant HepG2 cells | ↓ PTP1B protein expression | |||

|
Isolated from Chrysanthemum morifolium | Non-cellular enzymatic study (human PTP1B) | Diosmetin 7-glucoside: 27.74 ± 2.10% at 1 μM | 147 |
| Diosmin: 36.26 ± 1.62% at 1 μM | ||||
| Diosmetin: 22.81 ± 2.07% at 1 μM | ||||
| Luteolin: 19.80 ± 2.18% at 1 μM | ||||
| Apigenin: 29.77 ± 1.48% at 1 μM | ||||
| Acacetin: 38.17 ± 1.62% at 1 μM | ||||
| Cellular study with CHO-K1 cells | ↓ PTP1B protein expression | |||
|
Isolated from mulberry leaves | Non-cellular enzymatic study | 1: IC 50 = 4.53 ± 0.31 μM | 148 |
| 2: IC50 = 10.53 ± 1.76 μM | ||||
| Cellular study with insulin-resistant HepG2 cells | 1: ↓ PTP1B protein expression | |||

|
Isolated from blueberry fruits | Non-cellular enzymatic study (human PTP1B) | Procyanidin B1: IC 50 = 0.60 ± 0.042 μM | 149 |
| Procyanidin B2: IC50 = 4.79 ± 0.023 μM | ||||
| Cellular study with insulin-resistant HepG2 cells | ↓ PTP1B protein expression | |||

|
Commercial | Cellular study with insulin-resistant HepG2 cells | ↓ PTP1B protein expression | 92 |

|
Commercial | Cellular study with insulin-resistant HepG2 cells | ↓ PTP1B protein expression | 150 |

|
Synthesis | Non-cellular enzymatic study (human PTP1B) | Inhibition = 18.09 ± 3.39% at 1 μM | 151 |
| In vitro cellular study with CHO-K1 cells | ↓ PTP1B protein expression | |||
|
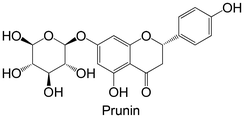
Isolated from Prunus davidiana | Non-cellular enzymatic study (human PTP1B) | IC50 = 5.5 ± 0.29 μM | 93 |
| Cellular study with insulin-resistant HepG2 cells | ↓ PTP1B protein expression | |||
|
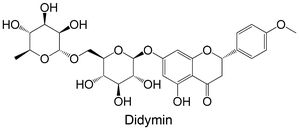
Commercial | Non-cellular enzymatic study (human PTP1B) | IC50 = 1.23 ± 0.11 μM | 94 |
| Cellular study with insulin-resistant HepG2 cells | ↓ PTP1B protein expression | |||
|
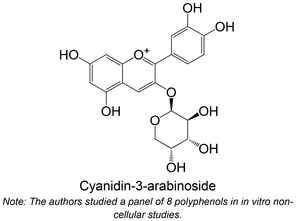
Isolated from blueberry fruits | Non-cellular enzymatic study (human PTP1B) | Cyanidin-3-arabinoside: IC50 = 8.91 ± 0.63 μM | 95 |
| Cellular study with HepG2 cells overexpressing PTP1B | ↓ PTP1B protein expression | |||
| In vivo studies | ||||

|
Synthesis | DM high-fat diet/streptozotocin-induced using C57BL/6J mice (50 and 100 mg kg−1 of compound, administration for 6 weeks) | ↓ PTP1B protein expression | 152 |

|
Synthesis | High-fat diet using C57BL/6J mice (10 mg kg−1 day−1 of compound, gastric gavage for 10 weeks, 5 days a week) | ↓ PTP1B protein expression | 153 |

|
Not mentioned | DM induced by STZ using Wistar rats (50 mg kg−1 of compound, administration daily by gavage daily for 8 weeks) | ↓ PTP1B gene expression | 154 |

|
Commercial | High-fat diet using C57BL/6J mice (20 mg kg−1 of compound, administration by dietary supplementation for 15 weeks) | ↓ PTP1B protein expression | 155 |

|
Commercial | IRS2-deficient using C57BL/6 and 129/Sv mice (2.5 mg kg−1 day−1 of compound, orally administered for 8 weeks via drinking water) | ↓ PTP1B gene expression and activity | 156 |
|
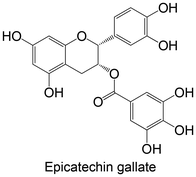
Commercial | High-fat and high-fructose diet using C57BL/6 mice (2 g L−1 of compound, treatment through drinking water for 16 weeks) | ↓ PTP1B protein expression | 150 |

|
Synthesis | Goto-Kakizaki rats (1, 5 and 10 mg kg−1 of compound, subcutaneously daily for 14 days) | =PTP1B protein expression on liver | 157 |
Proença et al.96 studied the in vitro inhibitory activity of a panel of 36 structurally related flavonoids. The authors concluded that the presence of both 7- and 8-OBn groups in the A ring, together with the presence of both 3′- and 4′-OMe groups in the B ring and the 3-OH group in the C ring, are essential for the inhibitory activity of PTP1B. The authors highlight that the presence of methoxy groups, together with hydroxy groups, are determinant for the intended activity,96 contrasting with Jing Xu et al.87 Although both studies investigate the human enzyme, using identical methodologies, the discrepant conclusions may stem from variations in enzyme–substrate ratios, as well as the additional factor of NaOH addition to stop the reaction in the study by Jing Xu et al.87
Upon examination of Table 1, it is evident that the presence of functional groups containing hydrocarbon chains, such as the prenyl and geranyl groups, is significant for the inhibition of the enzyme PTP1B. Particularly, Wei Li et al.97 studied 42 polyphenol derivatives, comprising different groups, including chalcones and flavonoids. Among the compounds investigated, flavonoid glycosides exhibited negligible inhibitory activity, diverging from other studies represented in Table 1. Nevertheless, prenylated compounds demonstrated noteworthy effectiveness. The authors emphasized the critical role of prenyl groups and hydroxy moieties in ortho-position for facilitating the activity of these compounds, eliciting inhibition of PTP1B through diverse modes.97 Geranylated flavonoids also demonstrated promising inhibitory activities, indicating that geranyl is an important substitution for the inhibition of PTP1B.98,99
Among the selected studies of Table 1, it is worth highlighting that only two specifically addressed the issue of polyphenol bioavailability [Rampadarath et al.,100, Zhao et al.,101]. Rampadarath et al.100 conducted an in silico pharmacokinetic analysis of orientin, assessing its ADME properties and drug-likeness using the SwissADME platform. The authors report that a potential therapeutic compound should ideally exhibit at least 10% oral bioavailability, a criterion that favors orientin, which showed a predicted value of 17%. While these computational results are promising and suggest orientin as a potentially bioavailable compound, no in vivo validation of these predictions was performed, thus limiting conclusions regarding its actual pharmacokinetic behavior. On the other hand, Zhao et al.101 carried out a more comprehensive pharmacokinetic profiling of the most active compound identified in their study in Sprague-Dawley rats. After intravenous administration at 2 mg kg−1, the polyphenol showed a long half-life (≈21 h). When given orally at a higher dose (20 mg kg−1), the compound reached a moderate level in the bloodstream over time, with a shorter half-life (≈9 h). These findings underscore the importance of pharmacokinetic characterization in evaluating the therapeutic viability of polyphenolic compounds. However, such studies remain scarce, and further investigations are essential.
Despite the substantial number of in vitro studies on polyphenols in the inhibition of PTP1B, relatively few in vivo studies have been published in the past decade. Notably, overall, all compounds exhibit hydroxy groups, belonging to different groups, including flavonoids, stilbenes, and phenolic acids. In the published in vivo studies, all tested polyphenols have shown the capability to decrease the expression of PTP1B.
| Chemical structure | Compound source | Study method | Effect | Ref. |
|---|---|---|---|---|
| ↑ means “increase”, ↓ means “reduction”. GK: glucokinase, IC50: half-maximal inhibitory concentration, STZ: streptozotocin, DM: diabetes mellitus. | ||||
| In vitro studies | ||||

|
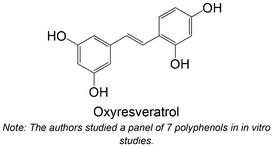
Commercial | Cellular assay with HepG2 | Resveratrol: ↓ the GK activity | 158 |
| Oxyresveratrol: no effect | ||||
| Cyanidin-3-glucoside: ↑ GK activity | ||||
| Cyanidin-3-rutinoside: ↑ GK activity | ||||
| Resveratrol: ↓ GK protein expression | ||||
| Oxyresveratrol: ↓ GK protein expression | ||||
| Cyanidin-3-glucoside: ↑ GK protein expression | ||||
| Cyanidin-3-rutinoside: ↑ GK protein expression | ||||
| Cellular assay with MIN6 | Resveratrol: ↓ GK protein expression | 159 | ||
| Oxyresveratrol: ↓ GK protein expression | ||||
| Cyanidin-3-glucoside: ↑ GK protein expression | ||||
| Cyanidin-3-rutinoside: ↑ GK protein expression | ||||
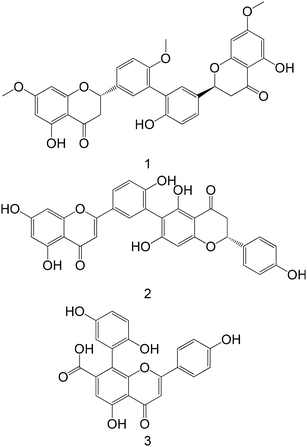
|
Isolated from Selaginella tamariscina | Cellular assay with HepG2 | 1: ↑ GK protein expression | 165 |
| 2: ↑ GK protein expression | ||||
| 3: ↑ GK protein expression | ||||

|
Not mentioned | Cellular assay with HepG2 | ↑ GK protein expression | 162 |
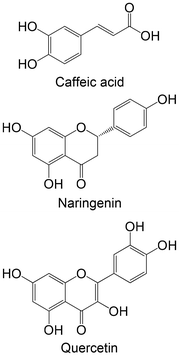
|
Commercial | Cellular assay with INS-1E | Caffeic acid: no differences in GK mRNA expression | 160 |
| Naringenin: ↑ GK mRNA expression under normoglycaemic and glucotoxic conditions | ||||
| Quercetin: ↑ GK mRNA expression under glucotoxic conditions | ||||
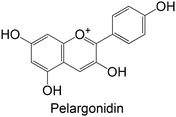
|
Commercial | Cellular assay with L6 | ↑ GK activity | 166 |
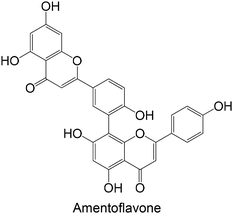
|
Isolated from Selaginella tamariscina | Cellular assay with HepG2 | ↑ GK activity | 167 |

|
Commercial | Cellular assay with HepG2 | ↑ GK activity | 168 |

|
Commercial | Cellular assay with HepG2 | ↑ GK protein expression | 169 |
| Ex vivo studies | ||||

|
Commercial | Study with isolated perfused rat liver using Wistar rats | Hesperetin: ↓ liver GK activity | 170 |
| Naringen: ↓ liver GK activity | ||||
| Hesperidin: no effect | ||||
| In vivo studies | ||||

|
Commercial | DM induced by NA/STZ using Wistar rats (50 mg kg−1 of compound, daily administration by gastric intubation for 4 weeks) | ↑ mRNA expression of liver GK levels on NA/STZ-induced rats | 163 |
| Not mentioned | DM induced by high fat and sugar diet, and STZ, using Sprague-Dawley rats (75 and 150 mg kg−1 of compound, administration by gavage, 6 days weeks, for 8 weeks) | ↑ liver GK protein expression on high fat and sugar diet, and STZ-induced rats | 162 | |

|
Not mentioned | DM induced by high-fat diet and fructose using Wistar rats (50 mg kg−1 of compound, administration by intubation for 30 days) | ↑ liver GK levels on STZ-induced rats. No effect on normal rats | 171 |

|
Commercial | STZ-induced Wistar rats (4, 8 and 16 mg kg−1 of compound, administration by intubation for 45 days) | ↑ liver GK levels on STZ-induced rats. No effect on normal rats | 172 |

|
Isolated from Selaginella tamariscina | STZ-induced CD-1 mice (20 and 40 mg kg−1 of compound, for 8 weeks, type of administration not mentioned) | ↑ liver GK levels on STZ-induced rats. | 173 |

|
Commercial | Megalobrama amblycephala fish fed with high-fat diet (0.04%, 0.36%, 1.08% of compound, administration hand-fed, 3 times a day, for 10 weeks) | ↓ mRNA expression of liver GK levels on fish fed with high-fat diet | 161 |

|
Commercial | DM induced by high-fat diet and STZ using C57BL/6J mice (0.005% w/w of compound, administration orally for 5 weeks) | ↑ liver GK activity and mRNA expression levels on high-fat diet- and STZ-induced mice | 174 |

|
Commercial | DM induced by alloxan using Kunming mice (5, 10, 20 mg kg−1 of compound, administration intragastrically, once a day for 28 days) | ↑ liver GK mRNA expression and protein levels on alloxan-induced mice. | 175 |
|
Synthesis | Wistar rats treated with obesogenic diet, high in sucrose and fat (15, 30 mg kg−1 day−1 of compound, administration orally once a day, for 6 weeks) | ↑ liver GK levels on obesogenic rats, with the lower concentration of pterostilbene | 164 |

|
Isolated | DM induced by alloxan and glucose, using Danio rerio zebrafish (2, 4, 10 μg mL−1 of compound, treatment with incubation for 24 h) | ↑ GK protein expression on alloxan- and glucose-induced zebrafish | 176 |
In two different in vitro studies using different cellular models,158,159 the same group studied the effects of two stilbenes, resveratrol and oxyresveratrol, and two flavonoids, cyanidin-3-glucoside and cyanidin-3-rutinoside, against the enzyme GK. The findings indicate that flavonoids exhibit greater promise in activating GK compared with stilbenes. Stilbenes either demonstrated no effect or led to a reduction in GK activity at higher concentrations.158,159 Bhattacharya et al.160 analyzed the effects of caffeic acid, naringenin and quercetin in the expression levels of GK. Remarkably, both flavonoids, naringenin and quercetin, were able to increase the levels of GK. Caffeic acid showed no effects in this study. It is also possible to verify that flavonoids proved to be more favourable, compared with the studied phenolic acid.160 One ex vivo study was performed with hesperidin, hesperetin and naringenin, using isolated perfused rat liver. Contrasting with the other studies, these flavonoids were not able to increase GK activity, showing no effect or even reduction in its levels.
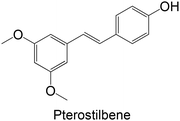
Regarding the in vivo studies, several polyphenols were explored, including polydatin, ferulic acid, galangin, amentoflavone, resveratrol, myricitrin, formononetin, pterostilbene and theaflavin-3,3′-digallate, as represented in Table 2. Almost all compounds display only hydroxy groups in their backbones, except ferulic acid, formononetin and pterostilbene, which hold hydroxy and methoxy groups. In general, all compounds, including those with hydroxy and methoxy groups in their backbone, exhibited an increase in GK levels.
Interestingly, the stilbene resveratrol was also studied in vivo,161 showing a reduction in the mRNA expression of liver GK, consistent with the findings of in vitro cellular studies.158,159 However, other stilbenes, polydatin and pterostilbene, were also studied in in vivo models, and showed a capacity to increase GK levels.162–164 Particularly, the stilbene polydatin was studied in two different in vivo studies, revealing promising activity for the activation of GK.162,163 Additionally, Hao et al.162 investigated the activity of polydatin in an insulin-resistant HepG2 cell model, which also demonstrated an ability to increase the GK protein expression.
| Chemical structure | Compound source | Study method | Effect | Ref. |
|---|---|---|---|---|
| ↑ means “increase”, ↓ means “reduction”. GP: glycogen phosphorylase, IC50: half-maximal inhibitory concentration, STZ: streptozotocin, DM: diabetes mellitus. | ||||
| In vitro studies | ||||

|
Commercial and synthesis | Non-cellular enzymatic study (rabbit muscle GPa) | Norwogonin (IC50 = 13.2 ± 1.4 μM) | 62 |
| Baicalein (IC50 = 23.5 ± 2.9 μM) | ||||
| Baicalin (IC50 = 20.5 ± 2.5 μM) | ||||
| Baicalein-7-methylether | ||||
| (IC50 = 22.6 ± 0.4 μM) | ||||

|
Commercial | Non-cellular enzymatic study (rabbit muscle GPb) | Chrysin (Ki = 19 μM) | 179 |
| Flavopiridol (Ki = 1.24 μM) | ||||
|
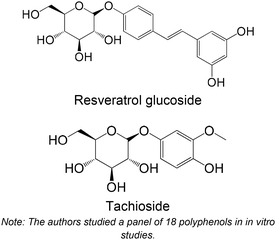
Resveratrol glucoside isolated from Paeonia clusii and tachioside isolated from Dorycnium pentaphyllum | Non-cellular enzymatic study (rabbit muscle GPb) | Resveratrol glucoside (IC50 = 258.4 ± 0.6 μM) | 185 |
| Tachioside (IC50 = 571.1 ± 45.5 μM) | ||||

|
Isolated from Seriphidium stenocephalum | Non-cellular enzymatic study (rabbit muscle GP) | Stenocephol (IC50 = 8.794 μM) | 186 |

|
Commercial | Non-cellular enzymatic study (rabbit muscle GPa and GPb) | Ellagic acid (Ki = 13.4 ± 1.2 μM for GPb and 7.52 ± 0.36 μM for GPa) | 187 |
| Gallic acid (Ki = 1.73 ± 0.16 mM for GPb and 3.86 ± 0.27 mM for GPa) | ||||

|
Synthesis | Non-cellular enzymatic study (rabbit muscle GPa and GPb, and human liver GPa) | Quercetin (Ki = 43.52 ± 1.65 μM for human GP) | 180 |
| Chrysin (Ki = 7.28 ± 0.09 μM for human GP) | ||||
| 1 (Ki = 7.39 ± 0.09 μM for human GP) | ||||
| 2 (Ki = 3.39 ± 0.22 μM for human GP) | ||||
| 3 (Ki = 3.89 ± 0.08 μM for human GP) | ||||
| 4 (Ki = 2.23 ± 0.08 μM for human GP) | ||||
| 5 (Ki = 21.36 ± 0.98 μM for human GP) | ||||
| Cellular study with HepG2 | Flavonoid 4 ↓ glycogenolysis in hepatocytes (IC50 = 70 μM) | |||
| In vivo studies | ||||

|
Not mentioned | DM induced by high-fat diet and fructose using Wistar rats (50 mg kg−1 of compound, with administration by intubation for 30 days) | ↓ liver GP levels on STZ-induced rats. No effect on normal rats | 171 |
|
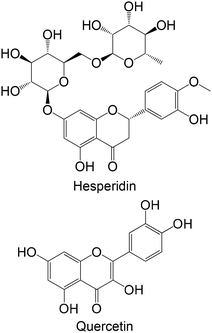
Commercial | DM induced by NA/STZ using Wistar rats (100 mg kg−1 day−1 of compounds, administration by oral gavage for 4 weeks) | ↓ liver GP levels with the same effect in hesperidin- and quercetin-treated rats | 181 |

|
Commercial | DM induced by high-fat diet and STZ using Wistar rats (100 mg kg−1 day−1 of compound, administration orally for 30 days) | ↓ liver GP levels on DM rats. No effect on normal rats | 188 |
|
Commercial | DM induced by STZ using Wistar rats (20, 40, 80 mg kg−1 of compound, administration intragastrically for 30 days) | ↓ liver GP levels on DM rats. No effect on normal rats | 184 |

|
Commercial | STZ–cadmium-induced diabetic nephrotoxic Wistar rats (1 mg kg−1 of compound, administered intraperitoneally once a day for 12 weeks) | ↓ liver GP levels on STZ–cadmium-induced rats. No effect on normal rats | 189 |

|
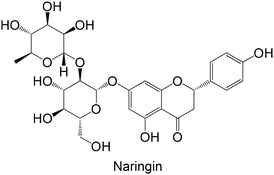
Commercial | DM induced by nicotineamide/STZ using rats (100 mg kg−1 day−1 of compounds, by oral gavage for 4 weeks) | ↓ liver GP levels on nicotineamide/STZ-induced rats, with the same effect for naringenin and naringin. | 183 |

|
Commercial | STZ-induced Wistar rats (25, 50, 100 mg kg−1 of compound, administered orally using an intragastric tube for 30 days) | ↓ liver GP levels on STZ-induced rats. No effect on normal rats. | 182 |

|
Commercial | STZ induced Wistar rats (100 mg kg−1 of compound, administered orally daily for 30 days) | ↓ liver GP levels on STZ-induced rats. No effect on normal rats. | 190 |

|
Isolated from Semecarpus anacardium | DM induced by high-fat diet and STZ using Wistar rats (20, 40, 80 mg kg−1 of compound, administration intragastrically for 30 days) | ↓ liver GP levels on high-fat diet and STZ-induced rats. No effect on normal rats. | 191 |

|
Commercial | STZ-induced Wistar rats (20 mg kg−1 of compound, administered orally daily for 6 weeks) | ↓ liver GP levels on STZ-induced rats. | 192 |
Rocha et al.62 explored the activity of 17 polyphenols in vitro against the enzyme rabbit muscle GPa. The authors concluded that the hydroxylation of the A ring is determinant for the inhibitory activity, whereas methoxy substituents were disadvantageous for GPa inhibitory activity. The flavonoid norwogonin (Table 3) was the most promising compound among the panel of polyphenols tested, showcasing heightened inhibitory activity in the presence of glucose. This characteristic suggests a potential for reducing the risk of hypoglycemia, particularly relevant in diabetic contexts marked by elevated plasma glucose levels. The authors also studied the flavonoid chrysin (Table 3), one of the most active compounds of the study. This flavonoid was studied by other authors,179,180 being recognized as a potent GP inhibitor.
Chetter et al.180 studied the inhibitory potential of 10 flavonoids against rabbit muscle GPa and GPb, and human liver GPa. The flavonoid, which contains hydroxy groups at the C-5 and C-7 positions and a methyl at the C-3′ position (Table 3), was the most active compound of the group. This compound was also studied using hepatocarcinoma HepG2 cells, where it effectively inhibited endogenous GP activity.180 In this study, the flavonoid quercetin (Table 3) showed the highest IC50 among all the tested compounds. Comparably, Rocha et al.62 also studied quercetin, which showed no inhibitory activity.
Polyphenols were already studied using in vivo models for testing the inhibition of GP (Table 3), including ferulic acid, hesperidin, quercetin, theaflavin, naringin, myricetin, naringenin, naringin, hesperidin, tangeretin, a biflavonoid and hesperetin. In general, these polyphenols are hydroxylated, except ferulic acid, hesperidin, tangeretin and hesperetin. The flavonoid hesperidin was already explored in 2 different studies and demonstrated a significant reduction of the GP levels in both studies.181,182 Quercetin, explored in two in vitro studies,62,180 was also studied in vivo by Ali et al.,181 demonstrating its ability to reduce lGP levels in treated animals, exhibiting a similar effect to hesperidin.
Ahmed et al.183 explored the antidiabetic effects of two flavonoids, naringin and naringenin, using nicotineamide- and streptozotocin-induced diabetic rats. Both flavonoids reduced lGP levels, showing that the presence of the disaccharide at the C-7 of the A ring, when compared with naringin, was not valuable for the reduction of lGP levels.183 Naringin was also investigated by Pari and Chandramohan184 using diabetic rats induced with streptozotocin. The results are in accordance with Ahmed et al.,183 illustrating the ability of naringin to reduce lGP levels.
There are few reports on the literature in the last 10 years exploring the inhibitory potential of polyphenols, as represented in Table 4. Considering the studies using polyphenols as FBPase inhibitors, flavonoids are the most explored compounds. Pterostilbene, a stilbene, is the only compound studied as an FBPase inhibitor that does not belong to the flavonoid family.
| Chemical structure | Compound source | Study method | Effect | Ref. |
|---|---|---|---|---|
| ↑ means “increase”, ↓ means “reduction”. FBPase: fructose 1,6-bisphosphatase, IC50: half-maximal inhibitory concentration, STZ: streptozotocin, DM: diabetes mellitus. | ||||
| In vitro studies | ||||

|
Commercial | Non-cellular enzymatic study (human FBPase) | Baicalein (IC50 = 29 ± 3 μM) | 68 |
| Scutellarein (IC50 = 38.2 ± 0.4 μM) | ||||
| Herbacetin (IC50 = 8.7 ± 0.7 μM) | ||||
| Gossypetin (IC50 = 24 ± 2 μM) | ||||

|
Isolated from Desmodium caudatum | Non-cellular enzymatic study (human FBPase) | 8-Prenylquercetin (IC50 = 3.62 ± 0.37 μM) | 193 |
| In vivo studies | ||||

|
Commercial | STZ-induced Wistar rats (4, 8 and 16 mg kg−1 of compound, with administration by intubation for 45 days) | ↓ liver FBPase levels on STZ-induced rats. No effect on normal rats | 172 |

|
Not mentioned | STZ-induced Swiss Albino mice (5 and 10 mg kg−1 of compound, intraperitoneal administration for 5 weeks) | ↓ liver FBPase levels on STZ-induced mice. No effect on normal rats | 194 |

|
Commercial | DM induced by STZ using Wistar rats (20, 40, 80 mg kg−1 of compound, administered orally by intragastric intubation, daily for a period of 30 days) | ↓ liver FBPase levels on STZ-induced rats. No effect on normal rats | 184 |

|
Commercial | STZ–cadmium-induced diabetic nephrotoxic Wistar rats (1 mg kg−1 of compound, administered intraperitoneally once a day for 12 weeks) | ↓ liver FBPase levels on STZ–cadmium-induced rats. | 189 |
| ↓ FBPase levels of normal rats | ||||
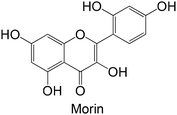
|
Commercial | STZ-induced Wistar rats (25 and 50 mg kg−1 of compound, administered orally to for 30 days) | ↓ liver FBPase levels on STZ-induced rats. No effect on normal rats | 195 |

|
Commercial | STZ-induced Wistar rats (25, 50, 100 mg kg−1 of compound, administered orally using an intragastric tube for 30 days) | ↓ liver FBPase levels on STZ-induced rats. No effect on normal rats | 182 |

|
Commercial | STZ-induced Wistar rats (100 mg kg−1 of compound, administered orally daily for 30 days) | ↓ liver FBPase levels on STZ-induced rats. No effect on normal rats | 190 |
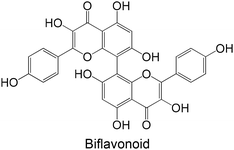
|
Isolated from Semecarpus anacardium | DM induced by high-fat diet and STZ using Wistar rats (20, 40, 80 mg kg−1 of compound, administration intragastrically for 30 days) | ↓ liver FBPase levels on high-fat diet and STZ-induced rats. No effect on normal rats | 191 |
Proença et al.68 investigated the effect of 55 structurally related flavonoids, using an in vitro non-cellular assay with isolated human FBPase. The results showed that herbacetin (Table 4), was the most potent inhibitor of the study, with similar potency to the positive control AMP. The authors concluded that, in general, the addition of hydroxy substituents increased the inhibitory effect of the flavonoids, and methoxy substituents are disadvantageous for the intended effect. In particular, the authors reported that hydroxy groups at the C-3, C-4′, C-5, C-7, and C-8 positions, as well as the double bond between C-2 and C-3 and the 4-oxo function at the pyrone ring, are determinant for the inhibitory potential of the compounds. For example, the flavonoid quercetin was not able to inhibit the enzyme.68 Similarly, Zhang et al.193 studied the effect of hydroxylated flavonoids in an in vitro non-cellular assay, and verified that the existence of hydroxy groups together with a prenyl group were essential for the inhibitory activity of the flavonoids. In accordance with Proença et al.,68 the flavonoid quercetin was not able to inhibit the enzyme. However, when comparing quercetin with 8-prenylquercetin, the addition of the prenyl group at the C-8 position was essential for the effect.193 Proença et al.68 and Zhang et al.193 also studied in common the flavonoids apigenin and naringenin, showing no effect on both studies.
Some authors have already studied polyphenols in in vivo studies, including galangin, pterostilbene, naringin, myricetin, morin, hesperidin, tangeretin and a biflavonoid, as represented in Table 4. These polyphenols were able to reduce the levels of FBPase in streptozotocin-induced animals. In general, these polyphenols are hydroxylated, except pterostilbene and hesperidin, holding methoxy and hydroxy groups, and tangeretin, bearing only methoxy groups. Proença et al.68 studied the flavonoids galangin, myricetin, and morin, revealing their lack of inhibitory activity against the human enzyme. The different results observed are possibly due to the distinct complexity associated with both in vitro and in vivo experiments.
5. Conclusions
Polyphenols have emerged as promising compounds for therapeutic research, demonstrating significant potential across multiple targeted pathways.Polyphenols as PTP1B inhibitors emerge as the most extensively studied category among the reviewed targets. In contrast, research on the other targets, including glucagon receptor antagonists, GK activators, GP inhibitors, and FBPase inhibitors, remains relatively limited. Notably, studies investigating polyphenols as glucagon receptor antagonists are virtually absent, highlighting a critical gap in the literature. Flavonoids have garnered particular interest across various targeted pathways, with the presence of hydroxyl groups playing a key role in their activities. However, despite the significant number of studies, cellular-based investigations remain scarce for all targets, limiting mechanistic insights into their efficacy and specificity. The development of in vitro mechanistic studies, particularly using cellular models, 3D cultures, and co-cultures, would be valuable in addressing this gap, as no such studies were identified within our search criteria over the past decade.
Additionally, it is important to acknowledge that in vitro enzymatic studies are conducted under varying conditions, with differences in enzyme concentrations and buffer compositions, while in vivo studies are performed in distinct models with variations in study duration, dosing regimens, and administration routes. These factors introduce challenges in making direct comparisons between studies. Moreover, polyphenols are subject to extensive metabolism and rapid elimination in the human body, which may limit their therapeutic potential in vivo despite promising in vitro results. Despite the increasing research on polyphenols, pharmacokinetic studies remain scarce, making it difficult to fully understand their ADME profiles. To address these challenges, future research should prioritize pharmacokinetic characterization and explore novel delivery systems aimed at enhancing bioefficacy and stability. In this context, approaches using nano-based delivery systems are gaining attention and may significantly improve the clinical translation of polyphenol-based therapies.
Overall, while considerable progress has been made in the last decade in elucidating the potential of polyphenols as inhibitors across various targets, there exists a pressing need for further investigation, particularly in cellular and in vivo models, to comprehensively understand their mechanisms of action, bioavailability, safety and therapeutic efficacy.
Data availability
No primary research results, software or code have been included and no new data were generated or analysed as part of this review.Conflicts of interest
There are no conflicts to declare.Acknowledgements
This work received financial support from the PT national funds (FCT/MECI, Fundação para a Ciência e Tecnologia and Ministério da Educação, Ciência e Inovação) through the project UID/50006 -Laboratório Associado para a Química Verde - Tecnologias e Processos Limpos. S. Rocha acknowledges the Fundação para a Ciência e a Tecnologia (FCT), the financial support for the PhD grant (PD/BD/145169/2019 and COVID/BD/153305/2023), through the PhD Programme in Medicines and Pharmaceutical Innovation (i3DU). M. Freitas acknowledges her CEEC contract-2020.04126.CEECIND/CP1596/CT0006 and LAQV-REQUIMTE for her contract under the reference LA/P/0008/2020: https://doi.org/10.54499/LA/P/0008/2020.References
- International Diabetes Federation, IDF Diabetes Atlas, Brussels, Belgium, 11th edn, 2025, [available from: https://www.diabetesatlas.org] Search PubMed.
- S. Rocha, M. Lucas, D. Ribeiro, M. L. Corvo, E. Fernandes and M. Freitas, Nano-based drug delivery systems used as vehicles to enhance polyphenols therapeutic effect for diabetes mellitus treatment, Pharmacol. Res., 2021, 169, 1–25 CrossRef PubMed.
- A. K. Rines, K. Sharabi, C. D. J. Tavares and P. Puigserver, Targeting hepatic glucose metabolism in the treatment of type 2 diabetes, Nat. Rev. Drug Discovery, 2016, 15(11), 786–804 CrossRef CAS PubMed.
- S. Rocha, M. Luísa Corvo, M. Freitas and E. Fernandes, Liposomal quercetin: A promising strategy to combat hepatic insulin resistance and inflammation in type 2 diabetes mellitus, Int. J. Pharm., 2024, 661, 124441 CrossRef CAS PubMed.
- A.-N. Li, S. Li, Y.-J. Zhang, X.-R. Xu, Y.-M. Chen and H.-B. Li, Resources and biological activities of natural polyphenols, Nutrients, 2014, 6(12), 6020–6047 CrossRef PubMed.
- Y. Zhang, P. Cai, G. Cheng and Y. Zhang, A brief review of phenolic compounds identified from plants: Their extraction, analysis, and biological activity, Nat. Prod. Commun., 2022, 17(1), 1–14 Search PubMed.
- B. Yan, Z. S. Chen, Y. Hu and Q. Yong, Insight in the recent application of polyphenols from biomass, Front. Bioeng. Biotechnol., 2021, 9, 1–15 Search PubMed.
- S. V. Luca, I. Macovei, A. Bujor, A. Miron, K. Skalicka-Woźniak and A. C. Aprotosoaie, et al., Bioactivity of dietary polyphenols: The role of metabolites, Crit. Rev. Food Sci. Nutr., 2020, 60(4), 626–659 CrossRef CAS PubMed.
- A. T. Rufino, V. M. Costa, F. Carvalho and E. Fernandes, Flavonoids as antiobesity agents: A review, Med. Res. Rev., 2021, 41(1), 556–585 CrossRef CAS PubMed.
- World Health Organization, Noncommunicable diseases - Progress Monitor 2022, 2022, [available from: https://www.who.int/publications/i/item/9789240047761] Search PubMed.
- S. Ghosh, S. Mahalanobish and P. C. Sil, Diabetes: discovery of insulin, genetic, epigenetic and viral infection mediated regulation, Nucleus, 2022, 65(2), 283–297 CrossRef PubMed.
- R. A. DeFronzo, E. Ferrannini, L. Groop, R. R. Henry, W. H. Herman and J. J. Holst, et al., Type 2 diabetes mellitus, Nat. Rev. Dis. Primers, 2015, 1(1), 1–22 Search PubMed.
- M. Li, X. Chi, Y. Wang, S. Setrerrahmane, W. Xie and H. Xu, Trends in insulin resistance: insights into mechanisms and therapeutic strategy, Signal Transduction Targeted Ther., 2022, 7(1), 216 CrossRef CAS PubMed.
- M. C. Lawrence, Understanding insulin and its receptor from their three-dimensional structures, Mol. Metab., 2021, 52, 1–17 Search PubMed.
- T. M. Batista, N. Haider and C. R. Kahn, Defining the underlying defect in insulin action in type 2 diabetes, Diabetologia, 2021, 64(5), 994–1006 CrossRef CAS PubMed.
- American Diabetes Association Professional Practice Committee, 2. Classification and Diagnosis of Diabetes: Standards of Medical Care in Diabetes 2022, Diabetes Care, 2022, 45(Supplement 1), 17–38 CrossRef PubMed.
- A. Katsarou, S. Gudbjörnsdottir, A. Rawshani, D. Dabelea, E. Bonifacio and B. J. Anderson, et al., Type 1 diabetes mellitus, Nat. Rev. Dis. Primers, 2017, 3(1), 1–17 Search PubMed.
- B. O. Roep, S. Thomaidou, R. van Tienhoven and A. Zaldumbide, Type 1 diabetes mellitus as a disease of the β-cell (do not blame the immune system?), Nat. Rev. Endocrinol., 2021, 17(3), 150–161 CrossRef CAS PubMed.
- R. Mallone and D. L. Eizirik, Presumption of innocence for beta cells: why are they vulnerable autoimmune targets in type 1 diabetes?, Diabetologia, 2020, 63(10), 1999–2006 CrossRef PubMed.
- E. Toren, K. S. Burnette, R. R. Banerjee, C. S. Hunter and H. M. Tse, Partners in crime: beta-cells and autoimmune responses complicit in type 1 diabetes pathogenesis, Front. Immunol., 2021, 12, 1–19 Search PubMed.
- M. Abdul-Ghani and R. A. DeFronzo, Insulin resistance and hyperinsulinemia: the egg and the chicken, J. Clin. Endocrinol. Metab., 2021, 106(4), 1897–1899 CrossRef PubMed.
- J. Bar-Tana, Insulin resistance, secretion and clearance - taming the three effector encounter of type 2 diabetes, Front. Endocrinol., 2021, 12, 1–4 Search PubMed.
- N. Esser, K. M. Utzschneider and S. E. Kahn, Early beta cell dysfunction vs insulin hypersecretion as the primary event in the pathogenesis of dysglycaemia, Diabetologia, 2020, 63(10), 2007–2021 CrossRef PubMed.
- A. Chadt and H. Al-Hasani, Glucose transporters in adipose tissue, liver, and skeletal muscle in metabolic health and disease, Pflugers Arch. – Eur. J. Physiol., 2020, 472(9), 1273–1298 CrossRef CAS PubMed.
- J. E. Campbell and C. B. Newgard, Mechanisms controlling pancreatic islet cell function in insulin secretion, Nat. Rev. Mol. Cell Biol., 2021, 22(2), 142–158 CrossRef CAS PubMed.
- D. E. James, J. Stöckli and M. J. Birnbaum, The aetiology and molecular landscape of insulin resistance, Nat. Rev. Mol. Cell Biol., 2021, 22(11), 751–771 CrossRef CAS PubMed.
- L. P. Bechmann, R. A. Hannivoort, G. Gerken, G. S. Hotamisligil, M. Trauner and A. Canbay, The interaction of hepatic lipid and glucose metabolism in liver diseases, J. Hepatol., 2012, 56(4), 952–964 CrossRef CAS PubMed.
- L. Rui, Energy metabolism in the liver, Compr. Physiol., 2014, 177–197 CrossRef.
- H.-S. Han, G. Kang, J. S. Kim, B. H. Choi and S.-H. Koo, Regulation of glucose metabolism from a liver-centric perspective, Exp. Mol. Med., 2016, 48(3), 1–10 Search PubMed.
- M. C. Petersen, D. F. Vatner and G. I. Shulman, Regulation of hepatic glucose metabolism in health and disease, Nat. Rev. Endocrinol., 2017, 13(10), 572–587 CrossRef CAS PubMed.
- P. M. Titchenell, M. A. Lazar and M. J. Birnbaum, Unraveling the regulation of hepatic metabolism by insulin, Trends Endocrinol. Metab., 2017, 28(7), 497–505 CrossRef CAS PubMed.
- J. V. Lazarus, H. E. Mark, Q. M. Anstee, J. P. Arab, R. L. Batterham and L. Castera, et al., Advancing the global public health agenda for NAFLD: a consensus statement, Nat. Rev. Gastroenterol. Hepatol., 2022, 19(1), 60–78 CrossRef CAS PubMed.
- M. G. Gill and A. Majumdar, Metabolic associated fatty liver disease: Addressing a new era in liver transplantation, World J. Hepatol., 2020, 12(12), 1168–1181 CrossRef PubMed.
- G. Targher, K. E. Corey, C. D. Byrne and M. Roden, The complex link between NAFLD and type 2 diabetes mellitus - mechanisms and treatments, Nat. Rev. Gastroenterol. Hepatol., 2021, 18(9), 599–612 CrossRef PubMed.
- K. A. Toulis, K. Nirantharakumar, C. Pourzitaki, A. H. Barnett and A. A. Tahrani, Glucokinase activators for type 2 diabetes: Challenges and future developments, Drugs, 2020, 80(5), 467–475 CrossRef CAS PubMed.
- G. Rena, D. G. Hardie and E. R. Pearson, The mechanisms of action of metformin, Diabetologia, 2017, 60(9), 1577–1585 CrossRef CAS PubMed.
- L. J. McCreight, C. J. Bailey and E. R. Pearson, Metformin and the gastrointestinal tract, Diabetologia, 2016, 59(3), 426–435 CrossRef CAS PubMed.
- M. C. Petersen and G. I. Shulman, Mechanisms of insulin action and insulin resistance, Physiol. Rev., 2018, 98(4), 2133–2223 CrossRef CAS PubMed.
- D. Santoleri and P. M. Titchenell, Resolving the paradox of hepatic insulin resistance, Cell. Mol. Gastroenterol. Hepatol., 2019, 7(2), 447–456 CrossRef PubMed.
- R. Liu, C. Mathieu, J. Berthelet, W. Zhang, J. M. Dupret and F. Rodrigues Lima, Human protein tyrosine phosphatase 1B (PTP1B): From structure to clinical inhibitor perspectives, Int. J. Mol. Sci., 2022, 23(13), 1–20 Search PubMed.
- R. A. Haeusler, T. E. McGraw and D. Accili, Biochemical and cellular properties of insulin receptor signalling, Nat. Rev. Mol. Cell Biol., 2018, 19(1), 31–44 CrossRef CAS PubMed.
- S. Rocha, M. Lucas, V. L. M. Silva, P. M. O. Gomes, A. M. S. Silva and A. N. Araújo, et al., Pyrazoles as novel protein tyrosine phosphatase 1B (PTP1B) inhibitors: An in vitro and in silico study, Int. J. Biol. Macromol., 2021, 181, 1171–1182 CrossRef CAS PubMed.
- S. Singh, A. Singh Grewal, R. Grover, N. Sharma, B. Chopra and A. Kumar Dhingra, et al., Recent updates on development of protein-tyrosine phosphatase 1B inhibitors for treatment of diabetes, obesity and related disorders, Bioorg. Chem., 2022, 121, 1–81 CrossRef PubMed.
- M. Obradovic, E. Sudar-Milovanovic, S. Soskic, M. Essack, S. Arya and A. J. Stewart, et al., Leptin and obesity: Role and clinical implication, Front. Endocrinol., 2021, 12, 1–14 Search PubMed.
- P. González-Muniesa, M.-A. Mártinez-González, F. B. Hu, J.-P. Després, Y. Matsuzawa and R. J. F. Loos, et al., Obesity, Nat. Rev. Dis. Primers, 2017, 3(1), 1–18 Search PubMed.
- R. A. Nianogo and O. A. Arah, Forecasting obesity and type 2 diabetes incidence and burden: The ViLA-Obesity Simulation Model, Front. Public Health, 2022, 10, 1–13 Search PubMed.
- C. T. Bramante, C. J. Lee and K. A. Gudzune, Treatment of obesity in patients with diabetes, Diabetes Spectr., 2017, 30(4), 237–243 CrossRef PubMed.
- S. Hædersdal, A. Lund, F. K. Knop and T. Vilsbøll, The role of glucagon in the pathophysiology and treatment of type 2 diabetes, Mayo Clin. Proc., 2018, 93(2), 217–239 CrossRef PubMed.
- A. Lund, J. I. Bagger, M. Christensen, F. K. Knop and T. Vilsbøll, Glucagon and type 2 diabetes: the return of the alpha cell, Curr. Diabetes Rep., 2014, 14(555), 1–7 CAS.
- J. E. Campbell and D. J. Drucker, Islet α cells and glucagon - critical regulators of energy homeostasis, Nat. Rev. Endocrinol., 2015, 11(6), 329–338 CrossRef CAS PubMed.
- N. J. W. Albrechtsen, R. E. Kuhre, J. Pedersen, F. K. Knop and J. J. Holst, The biology of glucagon and the consequences of hyperglucagonemia, Biomarkers Med., 2016, 10(11), 1141–1151 CrossRef PubMed.
- G. R. Kulina and E. J. Rayfield, The role of glucagon in the pathophysiology and management of diabetes, Endocr. Pract., 2016, 22(5), 612–621 CrossRef PubMed.
- A. T. Lasher, H. Srivastava and L. Y. Sun, Insights into the role of glucagon receptor signaling in metabolic regulation from pharmacological inhibition and tissue-specific knockout models, Biomedicines, 2022, 10(8), 1–12 CrossRef PubMed.
- S. Hædersdal, A. Lund, H. Maagensen, E. Nielsen-Hannerup, L. S. Gasbjerg and M. M. Rosenkilde, et al., The glucagon receptor antagonist LY2409021 has no effect on postprandial glucose in type 2 diabetes, Eur. J. Endocrinol., 2022, 186(2), 207–221 Search PubMed.
- D. M. Irwin and H. Tan, Evolution of glucose utilization: Glucokinase and glucokinase regulator protein, Mol. Phylogenet. Evol., 2014, 70, 195–203 CrossRef CAS PubMed.
- Y. Ren, L. Li, L. Wan, Y. Huang and S. Cao, Glucokinase as an emerging anti-diabetes target and recent progress in the development of its agonists, J. Enzyme Inhib. Med. Chem., 2022, 37(1), 606–615 CrossRef CAS PubMed.
- K. J. Filipski and J. A. Pfefferkorn, A patent review of glucokinase activators and disruptors of the glucokinase – glucokinase regulatory protein interaction: 2011–2014, Expert Opin. Ther. Pat., 2014, 24(8), 875–891 CrossRef CAS PubMed.
- M. C. G. J. Brouwers, C. Jacobs, A. Bast, C. D. A. Stehouwer and N. C. Schaper, Modulation of glucokinase regulatory protein: A double-edged sword?, Trends Mol. Med., 2015, 21(10), 583–594 CrossRef CAS PubMed.
- L. Perreault, J. S. Skyler and J. Rosenstock, Novel therapies with precision mechanisms for type 2 diabetes mellitus, Nat. Rev. Endocrinol., 2021, 17(6), 364–377 CrossRef CAS PubMed.
- K. R. Klein, S. C. Boeder, J. L. R. Freeman, I. Dunn, C. Dvergsten and S. Madduri, et al., Impact of the hepatoselective glucokinase activator TTP399 on ketoacidosis during insulin withdrawal in people with type 1 diabetes, Diabetes, Obes. Metab., 2022, 24(8), 1439–1447 CrossRef CAS PubMed.
- K. R. Klein, J. L. R. Freeman, I. Dunn, C. Dvergsten, M. S. Kirkman and J. B. Buse, et al., The SimpliciT1 Study: A Randomized, Double-Blind, Placebo-Controlled Phase 1b/2 Adaptive Study of TTP399, a Hepatoselective Glucokinase Activator, for Adjunctive Treatment of Type 1 Diabetes, Diabetes Care, 2021, 44(4), 960–968 CrossRef CAS PubMed.
- S. Rocha, N. Aniceto, R. C. Guedes, H. M. T. Albuquerque, V. L. M. Silva and A. M. S. Silva, et al., An in silico and an in vitro inhibition analysis of glycogen phosphorylase by flavonoids, styrylchromones, and pyrazoles, Nutrients, 2022, 14(2), 1–23 CrossRef PubMed.
- J. M. Hayes, A. L. Kantsadi and D. D. Leonidas, Natural products and their derivatives as inhibitors of glycogen phosphorylase: potential treatment for type 2 diabetes, Phytochem. Rev., 2014, 13(2), 471–498 CrossRef CAS.
- L. Zhang, C. Song, G. Miao, L. Zhao, Z. Yan and J. Li, et al., Novel Liver-targeted conjugates of Glycogen Phosphorylase Inhibitor PSN-357 for the Treatment of Diabetes: Design, Synthesis, Pharmacokinetic and Pharmacological Evaluations, Sci. Rep., 2017, 7(1), 1–14 CrossRef PubMed.
- S. Rocha, M. Lucas, A. N. Araújo, M. L. Corvo, E. Fernandes and M. Freitas, Optimization and validation of an in vitro standardized glycogen phosphorylase activity assay, Molecules, 2021, 26(15), 1–15 CrossRef PubMed.
- L. Agius, Role of glycogen phosphorylase in liver glycogen metabolism, Mol. Aspects Med., 2015, 46, 34–45 CrossRef CAS PubMed.
- J. Bie, S. Liu, Z. Li, Y. Mu, B. Xu and Z. Shen, Discovery of novel indole derivatives as allosteric inhibitors of fructose-1,6-bisphosphatase, Eur. J. Med. Chem., 2015, 90, 394–405 CrossRef CAS PubMed.
- C. Proença, A. Oliveira, M. Freitas, D. Ribeiro, J. L. C. Sousa and M. J. Ramos, et al., Structural specificity of flavonoids in the inhibition of human fructose 1,6-bisphosphatase, J. Nat. Prod., 2020, 83(5), 1541–1552 CrossRef PubMed.
- R. Kaur, L. Dahiya and M. Kumar, Fructose-1,6-bisphosphatase inhibitors: A new valid approach for management of type 2 diabetes mellitus, Eur. J. Med. Chem., 2017, 141, 473–505 CrossRef CAS PubMed.
- G.M. Liu and Y.-M. Zhang, Targeting FBPase is an emerging novel approach for cancer therapy, Cancer Cell Int., 2018, 18, 36 CrossRef PubMed.
- C. Sun, C. Zhao, E. C. Guven, P. Paoli, J. Simal-Gandara and K. M. Ramkumar, et al., Dietary polyphenols as antidiabetic agents: Advances and opportunities, Food Front., 2020, 1(1), 18–44 CrossRef.
- A. Rana, M. Samtiya, T. Dhewa, V. Mishra and R. E. Aluko, Health benefits of polyphenols: A concise review, J. Food Biochem., 2022, 46(10), 1–24 CrossRef PubMed.
- A. Bertelli, M. Biagi, M. Corsini, G. Baini, G. Cappellucci and E. Miraldi, Polyphenols: From theory to practice, Foods, 2021, 10(11), 1–15 CrossRef PubMed.
- R. Menezes, P. Matafome, M. Freitas and M.-T. García-Conesa, Updated information of the effects of (Poly)phenols against type-2 diabetes mellitus in humans: Reinforcing the recommendations for future research, Nutrients, 2022, 14(17), 1–15 CrossRef PubMed.
- C. S. Cutrim and M. A. S. Cortez, A review on polyphenols: Classification, beneficial effects and their application in dairy products, Int. J. Dairy Technol., 2018, 71(3), 564–578 CrossRef CAS.
- C. Proença, D. Ribeiro, M. Freitas and E. Fernandes, Flavonoids as potential agents in the management of type 2 diabetes through the modulation of α-amylase and α-glucosidase activity: a review, Crit. Rev. Food Sci. Nutr., 2022, 62(12), 3137–3207 CrossRef PubMed.
- C. Proença, M. Freitas, D. Ribeiro, S. M. Tomé, A. N. Araújo and A. M. S. Silva, et al., The dipeptidyl peptidase-4 inhibitory effect of flavonoids is hindered in protein rich environments, Food Funct., 2019, 10(9), 5718–5731 RSC.
- C.-I. Choi, Sodium-glucose cotransporter 2 (SGLT2) inhibitors from natural products: Discovery of next-generation antihyperglycemic agents, Molecules, 2016, 21(9), 1–12 Search PubMed.
- D. Rigano, C. Sirignano and O. Taglialatela-Scafati, The potential of natural products for targeting PPARα, Acta Pharm. Sin. B, 2017, 7(4), 427–438 CrossRef PubMed.
- H. Cao, J. Ou, L. Chen, Y. Zhang, T. Szkudelski and D. Delmas, et al., Dietary polyphenols and type 2 diabetes: Human study and clinical trial, Crit. Rev. Food Sci. Nutr., 2019, 59(20), 3371–3379 CrossRef CAS PubMed.
- M. Rudrapal, G. Rakshit, R. P. Singh, S. Garse, J. Khan and S. Chakraborty, Dietary polyphenols: Review on chemistry/sources, bioavailability/metabolism, antioxidant effects, and their role in disease management, Antioxidants, 2024, 13(4), 429 CrossRef CAS PubMed.
- C. Manach, A. Scalbert, C. Morand, C. Rémésy and L. Jiménez, Polyphenols: food sources and bioavailability, Am. J. Clin. Nutr., 2004, 79(5), 727–747 CrossRef CAS PubMed.
- S. Quesada-Vázquez, I. Eseberri, F. Les, P. Pérez-Matute, M. Herranz-López and C. Atgié, et al., Polyphenols and metabolism: from present knowledge to future challenges, J. Physiol. Biochem., 2024, 80(3), 603–625 CrossRef PubMed.
- L. Chen, T. Hui, X. Zhenglu, C. Hui, C. W. San and S.-W. Krystyna, et al., Modifications of dietary flavonoids towards improved bioactivity: An update on structure–activity relationship, Crit. Rev. Food Sci. Nutr., 2018, 58(4), 513–527 CrossRef CAS PubMed.
- M. D'Archivio, C. Filesi, R. Varì, B. Scazzocchio and R. Masella, Bioavailability of the polyphenols: Status and controversies, Int. J. Mol. Sci., 2010, 11(4), 1321–1342 CrossRef PubMed.
- A. Scalbert and G. Williamson, Dietary intake and bioavailability of polyphenols, J. Nutr., 2000, 130(8), 2073S–2085S CrossRef CAS PubMed.
- J. Xu, X. Wang, J. Yue, Y. Sun, X. Zhang and Y. Zhao, Polyphenols from Acorn Leaves (Quercus liaotungensis) Protect Pancreatic Beta Cells and Their Inhibitory Activity against α-Glucosidase and Protein Tyrosine Phosphatase 1B, Molecules, 2018, 23(9), 2167 CrossRef PubMed.
- M. Y. Ali, S. Jannat, H.-A. Jung and J.-S. Choi, Structural Bases for Hesperetin Derivatives: Inhibition of Protein Tyrosine Phosphatase 1B, Kinetics Mechanism and Molecular Docking Study, Molecules, 2021, 26(24), 7433 CrossRef CAS PubMed.
- J. S. Choi, M. Nurul Islam, M. Yousof Ali, E. J. Kim, Y. M. Kim and H. A. Jung, Effects of C-glycosylation on anti-diabetic, anti-Alzheimer's disease and anti-inflammatory potential of apigenin, Food Chem. Toxicol., 2014, 64, 27–33 CrossRef CAS PubMed.
- B. T. Zhao, D. D. Le, P. H. Nguyen, M. Y. Ali, J.-S. Choi and B. S. Min, et al., PTP1B, α-glucosidase, and DPP-IV inhibitory effects for chromene derivatives from the leaves of Smilax china L, Chem.-Biol. Interact., 2016, 253, 27–37 CrossRef CAS PubMed.
- H. A. Jung, P. Paudel, S. H. Seong, B.-S. Min and J. S. Choi, Structure-related protein tyrosine phosphatase 1B inhibition by naringenin derivatives, Bioorg. Med. Chem. Lett., 2017, 27(11), 2274–2280 CrossRef CAS PubMed.
- F. Yan, J. Feng, W. Li, L. Wu and J. Li, A Preliminary Study on the Effect and Mechanism of Breviscapine for Improving Insulin Resistance in HepG2 Cells, J. Cardiovasc. Pharmacol., 2020, 76(2), 216–226 CrossRef CAS PubMed.
- H. A. Jung, M. Y. Ali, H. K. Bhakta, B.-S. Min and J. S. Choi, Prunin is a highly potent flavonoid from Prunus davidiana stems that inhibits protein tyrosine phosphatase 1B and stimulates glucose uptake in insulin-resistant HepG2 cells, Arch. Pharmacal Res., 2017, 40(1), 37–48 CrossRef CAS PubMed.
- M. Y. Ali, S. Zaib, M. M. Rahman, S. Jannat, J. Iqbal and S. K. Park, et al., Didymin, a dietary citrus flavonoid exhibits anti-diabetic complications and promotes glucose uptake through the activation of PI3K/Akt signaling pathway in insulin-resistant HepG2 cells, Chem.-Biol. Interact., 2019, 305, 180–194 CrossRef CAS PubMed.
- J.-L. Tian, X.-J. Liao, Y.-H. Wang, X. Si, C. Shu and E.-S. Gong, et al., Identification of Cyanidin-3-arabinoside Extracted from Blueberry as a Selective Protein Tyrosine Phosphatase 1B Inhibitor, J. Agric. Food Chem., 2019, 67(49), 13624–13634 CrossRef CAS PubMed.
- C. Proença, M. Freitas, D. Ribeiro, J. L. C. Sousa, F. Carvalho and A. M. S. Silva, et al., Inhibition of protein tyrosine phosphatase 1B by flavonoids: A structure - activity relationship study, Food Chem. Toxicol., 2018, 111, 474–481 CrossRef PubMed.
- W. Li, S. Li, K. Higai, T. Sasaki, Y. Asada and S. Ohshima, et al., Evaluation of licorice flavonoids as protein tyrosine phosphatase 1B inhibitors, Bioorg. Med. Chem. Lett., 2013, 23(21), 5836–5839 CrossRef CAS PubMed.
- Y. H. Song, Z. Uddin, Y. M. Jin, Z. Li, M. J. Curtis-Long and K. D. Kim, et al., Inhibition of protein tyrosine phosphatase (PTP1B) and α-glucosidase by geranylated flavonoids from Paulownia tomentosa, J. Enzyme Inhib. Med. Chem., 2017, 32(1), 1195–1202 CrossRef CAS PubMed.
- L.-B. Zhang, C. Lei, L.-X. Gao, J.-Y. Li, J. Li and A.-J. Hou, Isoprenylated Flavonoids with PTP1B Inhibition from Macaranga denticulata, Nat. Prod. Bioprospect., 2016, 6(1), 25–30 CrossRef CAS PubMed.
- A. Rampadarath, F. O. Balogun, C. Pillay and S. Sabiu, Identification of Flavonoid C-Glycosides as Promising Antidiabetics Targeting Protein Tyrosine Phosphatase 1B, J. Diabetes Res., 2022, 2022, 6233217 Search PubMed.
- Y. Zhao, Y. Cao, H. Chen, F. Zhuang, C. Wu and G. Yoon, et al., Synthesis, biological evaluation, and molecular docking study of novel allyl-retrochalcones as a new class of protein tyrosine phosphatase 1B inhibitors, Bioorg. Med. Chem., 2019, 27(6), 963–977 CrossRef CAS PubMed.
- J. Cai, L. Zhao and W. Tao, Potent protein tyrosine phosphatase 1B (PTP1B) inhibiting constituents from Anoectochilus chapaensis and molecular docking studies, Pharm. Biol., 2015, 53(7), 1030–1034 CrossRef CAS PubMed.
- D. H. Kim, H. A. Jung, H. S. Sohn, J. W. Kim and J. S. Choi, Potential of Icariin Metabolites from Epimedium koreanum Nakai as Antidiabetic Therapeutic Agents, Molecules, 2017, 22(6), 986 CrossRef PubMed.
- P.-J. Jiang, M.-J. Lu, Y.-Y. Xi, J. Chen, J.-J. Zheng and X.-W. Xu, New flavonoid glycosides from Xanthium strumarium with their protein tyrosine phosphatase 1B inhibitory activity, J. Asian Nat. Prod. Res., 2022, 24(1), 45–51 CrossRef CAS PubMed.
- M. N. Islam, I. J. Ishita, H. A. Jung and J. S. Choi, Vicenin 2 isolated from Artemisia capillaris exhibited potent anti-glycation properties, Food Chem. Toxicol., 2014, 69, 55–62 CrossRef CAS PubMed.
- M. Yousof Ali, S. Zaib, M. Mizanur Rahman, S. Jannat, J. Iqbal and S. Kyu Park, et al., Poncirin, an orally active flavonoid exerts antidiabetic complications and improves glucose uptake activating PI3K/Akt signaling pathway in insulin resistant C2C12 cells with anti-glycation capacities, Bioorg. Chem., 2020, 102, 104061 CrossRef CAS PubMed.
- T. T. Le, M. T. Ha, T. Q. Cao, J. A. Kim, J. S. Choi and B. S. Min, 1,5-Anhydro-D-glucitol derivative and galloylated flavonoids isolated from the leaves of Acer ginnala Maxim. as dual inhibitors of PTP1B and α-glucosidase enzymes: In vitro and in silico studies, Phytochemistry, 2023, 213, 113769 CrossRef CAS PubMed.
- D. H. Nguyen, U. M. Seo, B. T. Zhao, D. D. Le, S. H. Seong and J. S. Choi, et al., Ellagitannin and flavonoid constituents from Agrimonia pilosa Ledeb. with their protein tyrosine phosphatase and acetylcholinesterase inhibitory activities, Bioorg. Chem., 2017, 72, 293–300 CrossRef CAS PubMed.
- J.-L. Li, L.-X. Gao, F.-W. Meng, C.-L. Tang, R.-J. Zhang and J.-Y. Li, et al., PTP1B inhibitors from stems of Angelica keiskei (Ashitaba), Bioorg. Med. Chem. Lett., 2015, 25(10), 2028–2032 CrossRef CAS PubMed.
- C. Xie, Y. Sun, C. Y. Pan, L. M. Tang and L. P. Guan, 2,4-Dihydroxychalcone derivatives as novel potent cell division cycle 25B phosphatase inhibitors and protein tyrosine phosphatase 1B inhibitors, Pharmazie, 2014, 69(4), 257–262 CAS.
- E. Salinas-Arellano, A. Pérez-Vásquez, I. Rivero-Cruz, R. Torres-Colin, M. González-Andrade and M. Rangel-Grimaldo, et al., Flavonoids and Terpenoids with PTP-1B Inhibitory Properties from the Infusion of Salvia amarissima Ortega, Molecules, 2020, 25(15), 3530 CrossRef CAS PubMed.
- L. Jiang, S. Numonov, K. Bobakulov, M. N. Qureshi, H. Zhao and H. A. Aisa, Phytochemical Profiling and Evaluation of Pharmacological Activities of Hypericum scabrum L, Molecules, 2015, 20(6), 11257–11271 CrossRef CAS PubMed.
- N.-B. Qin, C.-C. Jia, J. Xu, D.-H. Li, F.-X. Xu and J. Bai, et al., New amides from seeds of Silybum marianum with potential antioxidant and antidiabetic activities, Fitoterapia, 2017, 119, 83–89 CrossRef CAS PubMed.
- Y. Zhao, T. Li, L. Kjaerulff, H. Venter, S. Coriani and B. L. Møller, et al., Orthogonal Reversed-Phase C18 and Pentafluorophenyl HPLC Separation for Phytochemical Profiling of Serrulatanes in Eremophila denticulata, J. Nat. Prod., 2023, 86(12), 2638–2650 CrossRef CAS PubMed.
- J. S. Choi, M. N. Islam, M. Y. Ali, Y. M. Kim, H. J. Park and H. S. Sohn, et al., The effects of C-glycosylation of luteolin on its antioxidant, anti-Alzheimer's disease, anti-diabetic, and anti-inflammatory activities, Arch. Pharmacal Res., 2014, 37(10), 1354–1363 CrossRef CAS PubMed.
- S. Numonov, S. Edirs, K. Bobakulov, M. N. Qureshi, K. Bozorov and F. Sharopov, et al., Evaluation of the Antidiabetic Activity and Chemical Composition of Geranium collinum Root Extracts - Computational and Experimental Investigations, Molecules, 2017, 22(6), 983 CrossRef PubMed.
- N. Begmatov, J. Li, K. Bobakulov, S. Numonov and H. A. Aisa, The chemical components of Coreopsis tinctoria Nutt. and their antioxidant, antidiabetic and antibacterial activities, Nat. Prod. Res., 2020, 34(12), 1772–1776 CrossRef CAS PubMed.
- X.-F. He, J.-J. Chen, T.-Z. Li, X.-K. Zhang, Y.-Q. Guo and X.-M. Zhang, et al., Nineteen New Flavanol–Fatty Alcohol Hybrids with α-Glucosidase and PTP1B Dual Inhibition: One Unusual Type of Antidiabetic Constituent from Amomum tsao-ko, J. Agric. Food Chem., 2020, 68(41), 11434–11448 CrossRef CAS PubMed.
- Y. Zhao, L. Kjaerulff, K. T. Kongstad, A. M. Heskes, B. L. Møller and D. Staerk, 2(5H)-Furanone sesquiterpenes from Eremophila bignoniiflora: High-resolution inhibition profiling and PTP1B inhibitory activity, Phytochemistry, 2019, 166, 112054 CrossRef CAS PubMed.
- L.-P. Sun, W.-P. Ma, L.-X. Gao, L.-L. Yang, Y.-C. Quan and J. Li, et al., Synthesis and characterization of 5,7-dihydroxyflavanone derivatives as novel protein tyrosine phosphatase 1B inhibitors, J. Enzyme Inhib. Med. Chem., 2013, 28(6), 1199–1204 CrossRef CAS PubMed.
- Y. Wang, J. Zhai, D. Yang, N. Han, Z. Liu and Z. Liu, et al., Antioxidant, Anti-Inflammatory, and Antidiabetic Activities of Bioactive Compounds from the Fruits of Livistona chinensis Based on Network Pharmacology Prediction, Oxid. Med. Cell. Longevity, 2021, 2021, 7807046 CrossRef PubMed.
- A. B. Shah, S. Yoon, J. H. Kim, K. Zhumanova, Y. J. Ban and K. W. Lee, et al., Effectiveness of cyclohexyl functionality in ugonins from Helminthostachys zeylanica to PTP1B and α-glucosidase inhibitions, Int. J. Biol. Macromol., 2020, 165, 1822–1831 CrossRef CAS PubMed.
- S.-Y. Jeong, P.-H. Nguyen, B.-T. Zhao, M. Y. Ali, J.-S. Choi and B.-S. Min, et al., Chemical Constituents of Euonymus alatus (Thunb.) Sieb. and Their PTP1B and α-Glucosidase Inhibitory Activities, Phytother. Res., 2015, 29(10), 1540–1548 CrossRef CAS PubMed.
- L. Q. Wu, C. Lei, L. X. Gao, H. B. Liao, J. Y. Li and J. Li, et al., Isoprenylated Flavonoids with PTP1B Inhibition from Ficus tikoua, Nat. Prod. Commun., 2015, 10(12), 2105–2107 Search PubMed.
- L. Ren, L.-Z. Li, J. Huang, L.-Z. Huang, J.-H. Li and Y.-M. Li, et al., New compounds from the seeds of Psoralea corylifolia with their protein tyrosine phosphatase 1B inhibitory activity, J. Asian Nat. Prod. Res., 2020, 22(8), 732–737 CrossRef CAS PubMed.
- L. Zhang, Y. Ge, H. M. Song, Q. M. Wang and C.-H. Zhou, Design, synthesis of novel azolyl flavonoids and their protein tyrosine Phosphatase-1B inhibitory activities, Bioorg. Chem., 2018, 80, 195–203 CrossRef CAS PubMed.
- Y. Wang, H. J. Yuk, J. Y. Kim, D. W. Kim, Y. H. Song and X. F. Tan, et al., Novel chromenedione derivatives displaying inhibition of protein tyrosine phosphatase 1B (PTP1B) from Flemingia philippinensis, Bioorg. Med. Chem. Lett., 2016, 26(2), 318–321 CrossRef CAS PubMed.
- T. Sasaki, W. Li, K. Higai, T. H. Quang, Y. H. Kim and K. Koike, Protein Tyrosine Phosphatase 1B Inhibitory Activity of Lavandulyl Flavonoids from Roots of Sophora flavescens, Planta Med., 2014, 80(7), 557–560 CrossRef CAS PubMed.
- C.-Y. Liu, P. Deng, B. Wang, A.-H. Liu, M.-G. Wang and S.-W. Li, et al., Coumaronochromones, flavanones, and isoflavones from the twigs and leaves of Erythrina subumbrans inhibit PTP1B and nitric oxide production, Phytochemistry, 2023, 206, 113550 CrossRef CAS PubMed.
- Z. Uddin, Y. H. Song, M. Ullah, Z. Li, J. Y. Kim and K. H. Park, Isolation and Characterization of Protein Tyrosine Phosphatase 1B (PTP1B) Inhibitory Polyphenolic Compounds From Dodonaea viscosa and Their Kinetic Analysis, Front. Chem., 2018, 6, 40 CrossRef PubMed.
- M. Zhang, Y. Zhang, Q. Huang, H. Duan, G. Zhao and L. Liu, et al., Flavonoids from Sophora alopecuroides L. improve palmitate-induced insulin resistance by inhibiting PTP1B activity in vitro, Bioorg. Med. Chem. Lett., 2021, 35, 127775 CrossRef CAS PubMed.
- J. Xu, L. Yang, R. Wang, K. Zeng, B. Fan and Z. Zhao, The biflavonoids as protein tyrosine phosphatase 1B inhibitors from Selaginella uncinata and their antihyperglycemic action, Fitoterapia, 2019, 137, 104255 CrossRef CAS PubMed.
- B. T. D. Trinh, A. K. Jäger and D. Staerk, High-Resolution Inhibition Profiling Combined with HPLC-HRMS-SPE-NMR for Identification of PTP1B Inhibitors from Vietnamese Plants, Molecules, 2017, 22(7), 1228 CrossRef PubMed.
- P.-H. Nguyen, D.-J. Ji, Y.-R. Han, J.-S. Choi, D.-Y. Rhyu and B.-S. Min, et al., Selaginellin and biflavonoids as protein tyrosine phosphatase 1B inhibitors from Selaginella tamariscina and their glucose uptake stimulatory effects, Bioorg. Med. Chem., 2015, 23(13), 3730–3737 CrossRef CAS PubMed.
- N. Qin, T. Sasaki, W. Li, J. Wang, X. Zhang and D. Li, et al., Identification of flavonolignans from Silybum marianum seeds as allosteric protein tyrosine phosphatase 1B inhibitors, J. Enzyme Inhib. Med. Chem., 2018, 33(1), 1283–1291 CrossRef CAS PubMed.
- T. H. Quang, N. T. T. Ngan, C.-S. Yoon, K.-H. Cho, D. G. Kang and H. S. Lee, et al., Protein Tyrosine Phosphatase 1B Inhibitors from the Roots of Cudrania tricuspidata, Molecules, 2015, 20(6), 11173–11183 CrossRef CAS PubMed.
- T.-T. A. Nguyen, M. T. Ha, S.-E. Park, J. S. Choi, B. S. Min and J. A. Kim, Stilbenes with Potent Protein Tyrosine Phosphatase-1B Inhibitory Activity from the Roots of Polygonum multiflorum, J. Nat. Prod., 2020, 83(2), 323–332 CrossRef CAS PubMed.
- M. Wang, B.-W. Yu, M.-H. Yu, L.-X. Gao, J.-Y. Li and H.-Y. Wang, et al., New Isoprenylated Phenolic Compounds from Morus laevigata, Chem. Biodiversity, 2015, 12(6), 937–945 CrossRef CAS.
- K.-J. Qu, B. Wang, C.-S. Jiang, B.-G. Xie, A.-H. Liu and S.-W. Li, et al., Rearranged Diels–Alder Adducts and Prenylated Flavonoids as Potential PTP1B Inhibitors from Morus nigra, J. Nat. Prod., 2021, 84(8), 2303–2311 CrossRef CAS PubMed.
- M. T. Ha, S. H. Seong, T. D. Nguyen, W.-K. Cho, K. J. Ah and J. Y. Ma, et al., Chalcone derivatives from the root bark of Morus alba L. act as inhibitors of PTP1B and α-glucosidase, Phytochemistry, 2018, 155, 114–125 CrossRef CAS PubMed.
- N. K. Vu, C. S. Kim, M. T. Ha, Q.-M. T. Ngo, S. E. Park and H. Kwon, et al., Antioxidant and Antidiabetic Activities of Flavonoid Derivatives from the Outer Skins of Allium cepa L, J. Agric. Food Chem., 2020, 68(33), 8797–8811 CrossRef CAS PubMed.
- H. He, Y. Ge, H. Dai, S. Cui, F. Ye and J. Jin, et al., Design, Synthesis and Biological Evaluation of Stilbene Derivatives as Novel Inhibitors of Protein Tyrosine Phosphatase 1B, Molecules, 2016, 21(12), 1722 CrossRef PubMed.
- R.-H. Kwon, N. Thaku, B. Timalsina, S.-E. Park, J.-S. Choi and H.-A. Jung, Inhibition Mechanism of Components Isolated from Morus alba Branches on Diabetes and Diabetic Complications via Experimental and Molecular Docking Analyses, Antioxidants, 2022, 11(2), 383 CrossRef CAS PubMed.
- M. T. Ha, D. H. Park, S. Shrestha, M. Kim, J. A. Kim and M. H. Woo, et al., PTP1B inhibitory activity and molecular docking analysis of stilbene derivatives from the rhizomes of Rheum undulatum L, Fitoterapia, 2018, 131, 119–126 CrossRef CAS PubMed.
- R. Yang, L. Wang, J. Xie, X. Li, S. Liu and S. Qiu, et al., Treatment of type 2 diabetes mellitus via reversing insulin resistance and regulating lipid homeostasis in vitro and in vivo using cajanonic acid A, Int. J. Mol. Med., 2018, 42(5), 2329–2342 CAS.
- H. J. Jung, S. H. Seong, M. Y. Ali, B.-S. Min, H. A. Jung and J. S. Choi, α-Methyl artoflavanocoumarin from Juniperus chinensis exerts anti-diabetic effects by inhibiting PTP1B and activating the PI3K/Akt signaling pathway in insulin-resistant HepG2 cells, Arch. Pharmacal Res., 2017, 40(12), 1403–1413 CrossRef CAS PubMed.
- M. Chen, K. Wang, Y. Zhang, M. Zhang, Y. Ma and H. Sun, et al., New insights into the biological activities of Chrysanthemum morifolium: Natural flavonoids alleviate diabetes by targeting α-glucosidase and the PTP-1B signaling pathway, Eur. J. Med. Chem., 2019, 178, 108–115 CrossRef CAS PubMed.
- S.-L. Niu, Z.-F. Tong, Y. Zhang, T.-L. Liu, C.-L. Tian and D.-X. Zhang, et al., Novel Protein Tyrosine Phosphatase 1B Inhibitor-Geranylated Flavonoid from Mulberry Leaves Ameliorates Insulin Resistance, J. Agric. Food Chem., 2020, 68(31), 8223–8231 CrossRef CAS PubMed.
- B. Li, R. Fu, H. Tan, Y. Zhang, W. Teng and Z. Li, et al., Characteristics of the interaction mechanisms of procyanidin B1 and procyanidin B2 with protein tyrosine phosphatase-1B: Analysis by kinetics, spectroscopy methods and molecular docking, Spectrochim. Acta, Part A, 2021, 259, 119910 CrossRef CAS PubMed.
- Y. Mi, W. Zhang, H. Tian, R. Li, S. Huang and X. Li, et al., EGCG evokes Nrf2 nuclear translocation and dampens PTP1B expression to ameliorate metabolic misalignment under insulin resistance condition, Food Funct., 2018, 9(3), 1510–1523 RSC.
- Y. Zhang, M. Chen, Y. Tao, B. Chu, Y. Ma and K. Lu, et al., Natural 8-C-ascorbyl-(−)-epigallocatechin as antidiabetic agent: α-glucosidase and PTP-1B signaling pathway dual regulators, Fitoterapia, 2022, 162, 105263 CrossRef CAS PubMed.
- J.-L. Tian, X. Si, C. Shu, Y.-H. Wang, H. Tan and Z.-H. Zang, et al., Synergistic Effects of Combined Anthocyanin and Metformin Treatment for Hyperglycemia In Vitro and In Vivo, J. Agric. Food Chem., 2022, 70(4), 1182–1195 CrossRef CAS PubMed.
- M.-Y. Wu, C.-C. Liu, S.-C. Lee, Y.-H. Kuo and T.-J. Hsieh, N-Octyl Caffeamide, a Caffeic Acid Amide Derivative, Prevents Progression of Diabetes and Hepatic Steatosis in High-Fat Diet Induced Obese Mice, Int. J. Mol. Sci., 2022, 23(16), 8948 CrossRef CAS PubMed.
- Z. Nasrollahi, K. ShahaniPour, R. Monajemi and A. M. Ahadi, Abelmoschus esculentus (L.) Moench improved blood glucose, lipid, and down-regulated PPAR-α, PTP1B genes expression in diabetic rats, J. Food Biochem., 2022, 46(7), e14097 CrossRef CAS PubMed.
- E. Cremonini, A. Bettaieb, F. G. Haj, C. G. Fraga and P. I. Oteiza, (-)-Epicatechin improves insulin sensitivity in high fat diet-fed mice, Arch. Biochem. Biophys., 2016, 599, 13–21 CrossRef CAS PubMed.
- Á. González-Rodríguez, B. Santamaría, J. A. Mas-Gutierrez, P. Rada, E. Fernández-Millán and V. Pardo, et al., Resveratrol treatment restores peripheral insulin sensitivity in diabetic mice in a sirt1-independent manner, Mol. Nutr. Food Res., 2015, 59(8), 1431–1442 CrossRef PubMed.
- S. Rocha, A. Amaro, M. D. Ferreira-Junior, C. Proença, A. M. S. Silva and V. M. Costa, et al., Melanoxetin: A Hydroxylated Flavonoid Attenuates Oxidative Stress and Modulates Insulin Resistance and Glycation Pathways in an Animal Model of Type 2 Diabetes Mellitus, Pharmaceutics, 2024, 16(2), 261 CrossRef CAS PubMed.
- H. He, W.-G. Yu, J.-P. Yang, S. Ge and Y.-H. Lu, Multiple comparisons of glucokinase activation mechanisms of five mulberry bioactive ingredients in hepatocyte, J. Agric. Food Chem., 2016, 64(12), 2475–2484 CrossRef CAS PubMed.
- Y.-C. Zheng, H. He, X. Wei, S. Ge and Y.-H. Lu, Comparison of regulation mechanisms of five mulberry ingredients on insulin secretion under oxidative stress, J. Agric. Food Chem., 2016, 64(46), 8763–8772 CrossRef CAS PubMed.
- S. Bhattacharya, N. Oksbjerg, J. F. Young and P. B. Jeppesen, Caffeic acid, naringenin and quercetin enhance glucose-stimulated insulin secretion and glucose sensitivity in INS-1E cells, Diabetes, Obes. Metab., 2014, 16(7), 602–612 CrossRef CAS PubMed.
- D. Zhang, Y. Yan, H. Tian, G. Jiang, X. Li and W. Liu, Resveratrol supplementation improves lipid and glucose metabolism in high-fat diet-fed blunt snout bream, Fish Physiol. Biochem., 2018, 44(1), 163–173 CrossRef CAS PubMed.
- J. Hao, C. Chen, K. Huang, J. Huang, J. Li and P. Liu, et al., Polydatin improves glucose and lipid metabolism in experimental diabetes through activating the Akt signaling pathway, Eur. J. Pharmacol., 2014, 745, 152–165 CrossRef CAS PubMed.
- A. M. Abd El-Hameed, A. I. Yousef, S. M. Abd El-Twab, A. A. G. El-Shahawy and A. Abdel-Moneim, Hepatoprotective Effects of Polydatin-Loaded Chitosan Nanoparticles in Diabetic Rats: Modulation of Glucose Metabolism, Oxidative Stress, and Inflammation Biomarkers, Biochemistry, 2021, 86(2), 179–189 CAS.
- S. Gómez-Zorita, A. Fernández-Quintela, L. Aguirre, M. T. Macarulla, A. M. Rimando and M. P. Portillo, Pterostilbene improves glycaemic control in rats fed an obesogenic diet: involvement of skeletal muscle and liver, Food Funct., 2015, 6(6), 1968–1976 RSC.
- H.-P. Long, J. Liu, P.-S. Xu, K.-P. Xu, J. Li and G.-S. Tan, Hypoglycemic flavonoids from Selaginella tamariscina (P.Beauv.) Spring, Phytochemistry, 2022, 195, 1–8 CrossRef PubMed.
- A. Samadder, D. Tarafdar, S. K. Abraham, K. Ghosh and A. R. Khuda-Bukhsh, Nano-pelargonidin protects hyperglycemic-induced L6 cells against mitochondrial dysfunction, Planta Med., 2017, 83(5), 468–475 CrossRef CAS PubMed.
- X. Zheng, Y. Ke, A. Feng, P. Yuan, J. Zhou and Y. Yu, et al., The mechanism by which amentoflavone improves insulin resistance in HepG2 cells, Molecules, 2016, 21(5), 1–13 CrossRef PubMed.
- Z. Yang, W. Huang, J. Zhang, M. Xie and X. Wang, Baicalein improves glucose metabolism in insulin resistant HepG2 cells, Eur. J. Pharmacol., 2019, 854, 187–193 CrossRef CAS PubMed.
- S. Zhou, J. Liu, L. Tan, Y. Wang, J. Li and Y. Wang, et al., Changes in metabolites in raw and wine processed Corni Fructus combination metabolomics with network analysis focusing on potential hypoglycemic effects, Front. Pharmacol., 2023, 14, 1173747 CrossRef CAS PubMed.
- G. S. Nascimento, R. P. Constantin, E. H. Gilglioni, C. V. de Castro Ghizoni, A. Bracht and K. S. Utsunomiya, et al., The acute effects of citrus flavanones on the metabolism of glycogen and monosaccharides in the isolated perfused rat liver, Toxicol. Lett., 2018, 291, 158–172 CrossRef PubMed.
- A. Narasimhan, M. Chinnaiyan and B. Karundevi, Ferulic acid exerts its antidiabetic effect by modulating insulin-signalling molecules in the liver of high-fat diet and fructose-induced type-2 diabetic adult male rat, Appl. Physiol., Nutr., Metab., 2015, 40(8), 769–781 CrossRef CAS PubMed.
- A. A. Aloud, V. Chinnadurai, G. Chandramohan, M. A. Alsaif and K. S. Al-Numair, Galangin controls streptozotocin-caused glucose homeostasis and reverses glycolytic and gluconeogenic enzyme changes in rats, Arch. Physiol. Biochem., 2020, 126(2), 101–106 CrossRef CAS PubMed.
- C. Su, C. Yang, M. Gong, Y. Ke, P. Yuan and X. Wang, et al., Antidiabetic activity and potential mechanism of amentoflavone in diabetic mice, Molecules, 2019, 24(11), 1–14 CrossRef PubMed.
- D. Y. Kim, S. R. Kim and U. J. Jung, Myricitrin ameliorates hyperglycemia, glucose intolerance, hepatic steatosis, and inflammation in high-fat diet/streptozotocin-induced diabetic mice, Int. J. Mol. Sci., 2020, 21(5), 1–13 Search PubMed.
- G. Qiu, W. Tian, M. Huan, J. Chen and H. Fu, Formononetin exhibits anti-hyperglycemic activity in alloxan-induced type 1 diabetic mice, Exp. Biol. Med., 2017, 242(2), 223–230 CrossRef CAS PubMed.
- H. Zhou, Y. Wu, E. Kim, H. Pan, P. He and B. Li, et al., Simultaneous tests of Theaflavin-3,3′-digallate as an anti-diabetic drug in human hepatoma G2 cells and zebrafish (Danio rerio), Nutrients, 2021, 13(12), 1–11 CrossRef PubMed.
- M. Donnier-Maréchal and S. Vidal, Glycogen phosphorylase inhibitors: a patent review (2013–2015), Expert Opin. Ther. Pat., 2016, 26(2), 199–212 CrossRef PubMed.
- N. Gaboriaud-Kolar and A.-L. Skaltsounis, Glycogen phosphorylase inhibitors: a patent review (2008–2012), Expert Opin. Ther. Pat., 2013, 23(8), 1017–1032 CrossRef CAS PubMed.
- K. E. Tsitsanou, J. M. Hayes, M. Keramioti, M. Mamais, N. G. Oikonomakos and A. Kato, et al., Sourcing the affinity of flavonoids for the glycogen phosphorylase inhibitor site via crystallography, kinetics and QM/MM-PBSA binding studies: Comparison of chrysin and flavopiridol, Food Chem. Toxicol., 2013, 61, 14–27 CrossRef CAS PubMed.
- B. A. Chetter, E. Kyriakis, D. Barr, A. G. Karra, E. Katsidou and S. M. Koulas, et al., Synthetic flavonoid derivatives targeting the glycogen phosphorylase inhibitor site: QM/MM-PBSA motivated synthesis of substituted 5,7-dihydroxyflavones, crystallography, in vitro kinetics and ex vivo cellular experiments reveal novel potent inhibitors, Bioorg. Chem., 2020, 102, 1–13 CrossRef PubMed.
- A. M. Ali, M. A. Gabbar, S. M. Abdel-Twab, E. M. Fahmy, H. Ebaid and I. M. Alhazza, et al., Antidiabetic potency, antioxidant effects, and mode of actions of Citrus reticulata fruit peel hydroethanolic extract, hesperidin, and quercetin in nicotinamide/streptozotocin-induced Wistar diabetic rats, Oxid. Med. Cell. Longevity, 2020, 2020, 1–21 Search PubMed.
- R. Sundaram, E. Nandhakumar and H. Haseena Banu, Hesperidin, a citrus flavonoid ameliorates hyperglycemia by regulating key enzymes of carbohydrate metabolism in streptozotocin-induced diabetic rats, Toxicol. Mech. Methods, 2019, 29(9), 644–653 CrossRef CAS PubMed.
- O. M. Ahmed, M. A. Hassan, S. M. Abdel-Twab and M. N. Abdel Azeem, Navel orange peel hydroethanolic extract, naringin and naringenin have anti-diabetic potentials in type 2 diabetic rats, Biomed. Pharmacother., 2017, 94, 197–205 CrossRef CAS PubMed.
- L. Pari and R. Chandramohan, Modulatory effects of naringin on hepatic key enzymes of carbohydrate metabolism in high-fat diet/low-dose streptozotocin-induced diabetes in rats, Gen. Physiol. Biophys., 2017, 36(3), 343–352 CrossRef CAS PubMed.
- N. Mavrokefalos, V. Myrianthopoulos, A. S. Chajistamatiou, E. D. Chrysina and E. Mikros, Discovery of the glycogen phosphorylase-modulating activity of a resveratrol glucoside by using a virtual screening protocol optimized for solvation sffects, Planta Med., 2015, 81(6), 507–516 CrossRef CAS PubMed.
- N. Shafiq, U. Arshad, S. Brogi, M. Rashid, N. Rafiq and S. Parveen, Characterization of stenocephol from Seriphidium stenocephalum as potent HepG2 cell growth and glycogen phosphorylase inhibitor, Nat. Prod. Res., 2022, 1–7 Search PubMed.
- E. Kyriakis, G. A. Stravodimos, A. L. Kantsadi, D. S. M. Chatzileontiadou, V. T. Skamnaki and D. D. Leonidas, Natural flavonoids as antidiabetic agents. The binding of gallic and ellagic acids to glycogen phosphorylase b, FEBS Lett., 2015, 589(15), 1787–1794 CrossRef CAS PubMed.
- K. Gothandam, V. S. Ganesan, T. Ayyasamy and S. Ramalingam, Antioxidant potential of theaflavin ameliorates the activities of key enzymes of glucose metabolism in high fat diet and streptozotocin – induced diabetic rats, Redox Rep., 2019, 24(1), 41–50 CrossRef PubMed.
- N. Kandasamy and N. Ashokkumar, Protective effect of bioflavonoid myricetin enhances carbohydrate metabolic enzymes and insulin signaling molecules in streptozotocin–cadmium induced diabetic nephrotoxic rats, Toxicol. Appl. Pharmacol., 2014, 279(2), 173–185 CrossRef CAS PubMed.
- R. Sundaram, P. Shanthi and P. Sachdanandam, Effect of tangeretin, a polymethoxylated flavone on glucose metabolism in streptozotocin-induced diabetic rats, Phytomedicine, 2014, 21(6), 793–799 CrossRef CAS PubMed.
- S. Ramalingam, M. Karuppiah, M. Thiruppathi, S. Palanivelu and S. Panchanatham, Antioxidant potential of biflavonoid attenuates hyperglycemia by modulating the carbohydrate metabolic enzymes in high fat diet/streptozotocin induced diabetic rats, Redox Rep., 2020, 25(1), 1–10 CrossRef CAS PubMed.
- O. M. Ahmed, A. S. Saleh, E. A. Ahmed, M. M. Ghoneim, H. A. Ebrahim and M. A. Abdelgawad, et al., Efficiency of bone marrow-derived mesenchymal stem cells and hesperetin in the treatment of streptozotocin-induced type 1 diabetes in wistar rats, Pharmaceuticals, 2023, 16(6), 859 CrossRef CAS PubMed.
- Y. Zhang, X. Zhang, Z. Xiao, X. Zhang and H. Sun, Hypoglycemic and hypolipidemic dual activities of extracts and flavonoids from Desmodium caudatum and an efficient synthesis of the most potent 8-prenylquercetin, Fitoterapia, 2022, 156, 1–9 Search PubMed.
- B. Elango, S. Dornadula, R. Paulmurugan and K. M. Ramkumar, Pterostilbene ameliorates streptozotocin-induced diabetes through enhancing antioxidant signaling pathways mediated by Nrf2, Chem. Res. Toxicol., 2016, 29(1), 47–57 Search PubMed.
- P. Vanitha, C. Uma, N. Suganya, E. Bhakkiyalakshmi, S. Suriyanarayanan and P. Gunasekaran, et al., Modulatory effects of morin on hyperglycemia by attenuating the hepatic key enzymes of carbohydrate metabolism and β-cell function in streptozotocin-induced diabetic rats, Environ. Toxicol. Pharmacol., 2014, 37(1), 326–335 CrossRef CAS PubMed.
| This journal is © The Royal Society of Chemistry 2025 |


