
 Open Access Article
 This Open Access Article is licensed under a
 Creative Commons Attribution 3.0 Unported Licence
TOFHunter—unlocking rapid untargeted screening of inductively coupled plasma–time-of-flight–mass spectrometry data†
Hunter B.
Andrews‡
 *a,
Lyndsey
Hendriks‡
b,
Sawyer B.
Irvine
c,
Daniel R.
Dunlap
d and
Benjamin T.
Manard
d
*a,
Lyndsey
Hendriks‡
b,
Sawyer B.
Irvine
c,
Daniel R.
Dunlap
d and
Benjamin T.
Manard
d
aRadioisotope Science and Technology Division, Oak Ridge National Laboratory, USA. E-mail: andrewshb@ornl.gov
bUniversity of Vienna, Austria
cNuclear Nonproliferation Division, Oak Ridge National Laboratory, USA
dChemical Sciences Division, Oak Ridge National Laboratory, USA
First published on 25th February 2025
Abstract
This study provides an overview of a newly developed open source program written in Python, TOFHunter, which permits the rapid and untargeted screening of inductively coupled plasma (ICP)-time-of-flight (TOF)-mass spectrometry (MS) datasets. ICP-TOF-MS is an analytical tool capable of providing quasi simultaneous detection of all nuclides from Li to Pu. This capability has triggered an increase in studies investigating single-particle analysis in which the TOF-MS provides correlated elemental/isotopic signatures on a particle basis in time. Similarly, laser ablation mapping has seen rapid growth owing to ICP-TOF-MS's capacity to handle fast washout times (<10 ms) while providing a broad nuclide coverage. The caveat to this broad mass coverage and high time resolution comes in the form of large, overwhelming datasets. With datasets typically on the scale of gigabytes, it is easy for a user to only focus on very targeted analytes; however, this focus diminishes the opportunity offered by the TOF-MS detector. TOFHunter applies chemometric methods, principal component analysis (PCA), and interesting features finder (IFF) on ICP-TOF-MS data, allowing for investigation of correlations, major and minor variance sources, and sample screening. The unique spectra identified by the (IFF) are used to generate a list of mass peaks, which are then matched with both nuclides and potential interferences before being exported for the user to investigate. Several case studies are discussed herein, demonstrating TOFHunter's ability to screen aqueous injections, single-particle/single-cell analysis, and probe laser ablation mapping files for unique regions of interest.
1. Introduction
Inductively coupled plasma (ICP)-time-of-flight (TOF)-mass spectrometry (MS) is an analytical technique combining the benefits of ICP with the simultaneous multielement detection capabilities of TOF-MS. In short, the working principle of TOF-MS is that ions are accelerated and travel through a flight tube, with lighter ions reaching the detector faster than heavier ones. This process allows the mass-to-charge ratio (m/z) of the ions to be determined based on their flight times. As opposed to quadrupole MS, in which nuclide lists must be defined prior to acquisition, with TOF-MS, full mass spectra are recorded with each data point, enabling the identification and quantification of multiple elements within a sample simultaneously. This feature is particularly attractive for screening purposes. For example, when analyzing nanoparticle (NP) mixtures, prior knowledge of the particle composition is not required because the complete elemental composition of the different NP types is detected, thereby allowing their differentiation based on their multielemental fingerprint.1 The multielement detection capability offered by TOF-MS is not only beneficial for single-particle (SP) analysis but also highly effective when combined with laser ablation (LA) sampling.2 LA-ICP-TOF-MS allows for the direct analysis of solid samples; a focused laser beam ablates material from the sample's surface, enabling high-resolution spatial mapping of elemental distributions within the sample.3 Overall, ICP-TOF-MS provides rapid, high-throughput analysis with broad elemental coverage, making it a powerful tool in various fields such as Earth science,4–7 environmental monitoring,8–10 forensics,11,12 and biomedical research,13,14 among others.However, despite its advantages, the analysis of ICP-TOF-MS data can be challenging. Indeed, the large amount of data generated in a single run, including complete TOF mass spectra and integrated data for each nuclide, can be complex. Thus, the technique would greatly benefit from automated data reduction approaches. Similar to other high-dimensional analytical methods such as laser-induced breakdown spectroscopy (LIBS), the need for rapid and untargeted screening methods in various scientific domains drives the development of new processing approaches.15,16 Consequently, effective data analysis tools are crucial for harnessing the full potential of ICP-TOF-MS, enabling researchers to identify interesting features and patterns within their data quickly. Here, a novel approach is presented for untargeted screening of ICP-TOF-MS data through the application of chemometric tools such as principal component analysis (PCA) and interesting features finder (IFF) with the goal to ease the burden on laboratory staff when measuring known and unknown samples.
Notably, over the past years, the field of SP analysis has witnessed the development of various automated data analysis schemes triggered by a need to differentiate various NP populations such as engineered, incidental, and natural NPs. Holbrook et al.17 applied a LightGBM multiclass classifier to automate the labelling of multielement particles from wear samples and Bland et al.18 used machine learning (ML) for source appointment of soil particles. Pushing further in the direction of ML, Buckman et al. developed a two-stage, semisupervised ML method to classify Ce-containing nanoparticles as engineered, incidental, or natural.19 Similarly, clustering analysis has been used to differentiate between engineered and natural NPs in environmental systems,20,21 as well as to compare multimetal NP composition in wastewater treatment plants.9 More recently, to support larger datasets, Gundlach-Graham et al. introduced TOF-SPI, a LabVIEW-based program for accurate SP analysis, including compound Poisson particle detection, split-event correction, and quantification, which is now available as a Windows executable.22 Similarly, Lockwood et al. provided a Python based tool for SP-ICP-TOF-MS data processing which takes into consideration compound Poisson and Gaussian statistics for detection limits.23 Although these approaches have demonstrated their potential and efficacy in their respective applications, they generally (1) require user input regarding nuclide composition through an “Analyte selection step” and (2) in some cases, they rely on preprocessed data (i.e., thresholded SP data) and are consequently tailored to address particular research questions or scenarios.
Commercial data reduction platforms such as iolite 4 and HDIP are specifically designed to work with LA-ICP-TOF-MS data and cannot be universally applied to all ICP-TOF-MS analysis. A recent effort by Lockwood et al. has extended their previous software into a tool called SPCal which also includes a non-targeted screening tool.24 This tool assumes a single ion area and then screens the data to determine when any mass channel has a corresponding particle event. This is complementary to the software tool presented in this study; however, it is only applicable to SP-ICP-TOF-MS data. In contrast, the methodology presented herein offers a more generalized and adaptable solution by directly handling unprocessed ICP-TOF-MS data, regardless of application, thereby eliminating the need for application-specific preprocessing steps and, most importantly, eliminating the need for a priori knowledge of the sample. This inherent flexibility enables the approach to be seamlessly applied to diverse datasets (e.g., analysis of steady, continuous signals, as well as short transients) and research contexts independent of the application at hand. This study leverages PCA and IFF on raw data directly from the instrument, this method is not influenced by preprocessing steps, thereby enhancing the interpretability and robustness of the results. By maintaining the integrity of the original data and extracting key features through chemometric tools, this approach offers a comprehensive yet efficient means of data exploration and pattern recognition. Although previous approaches have made significant contributions to automated data processing in specific application area, this methodology differentiates itself through its versatility, efficiency, and applicability to a wide range of datasets and research contexts. Through this work, the aim is to advance the field of data analysis by offering a robust and adaptable tool that maximizes the utility of raw mass spectrum data for diverse applications.
In summary, the study presented here aimed to enhance the capabilities of ICP-TOF-MS through the implementation of advanced multivariate analysis techniques. The goal was to develop an efficient workflow that reduces the time and effort required for data interpretation, ultimately unlocking the potential for rapid, untargeted screening. This methodology is subsequently tested amongst various case studies (e.g., ionic solutions, SP-ICP-TOF-MS, and LA-ICP-TOF-MS applications). These case studies were used to demonstrate the software's functionality and effectiveness in different analytical contexts. It is the hope that this tool becomes one of many helpful open-source software available for the community to better realize the powerful analysis enabled by ICP-TOF-MS.
2. TOFHunter description
The primary purpose of the TOFHunter script is to perform a rapid, untargeted screening of ICP-TOF-MS data. For every data point recorded within a TOF-MS time trace, complete TOF mass spectra are acquired alongside integrated data for each isotope. The script has been developed to work with raw hierarchical data format (HDF5, https://www.hdfgroup.org) and files from icpTOF instruments (TOFWERK AG, Switzerland), but may be extended to other ICP-TOF-MS instruments in the future with minimal modifications. A notional diagram of the script's structure is shown in Fig. 1. This peak data matrix contains the integrated peak areas for greater than 300 nuclides.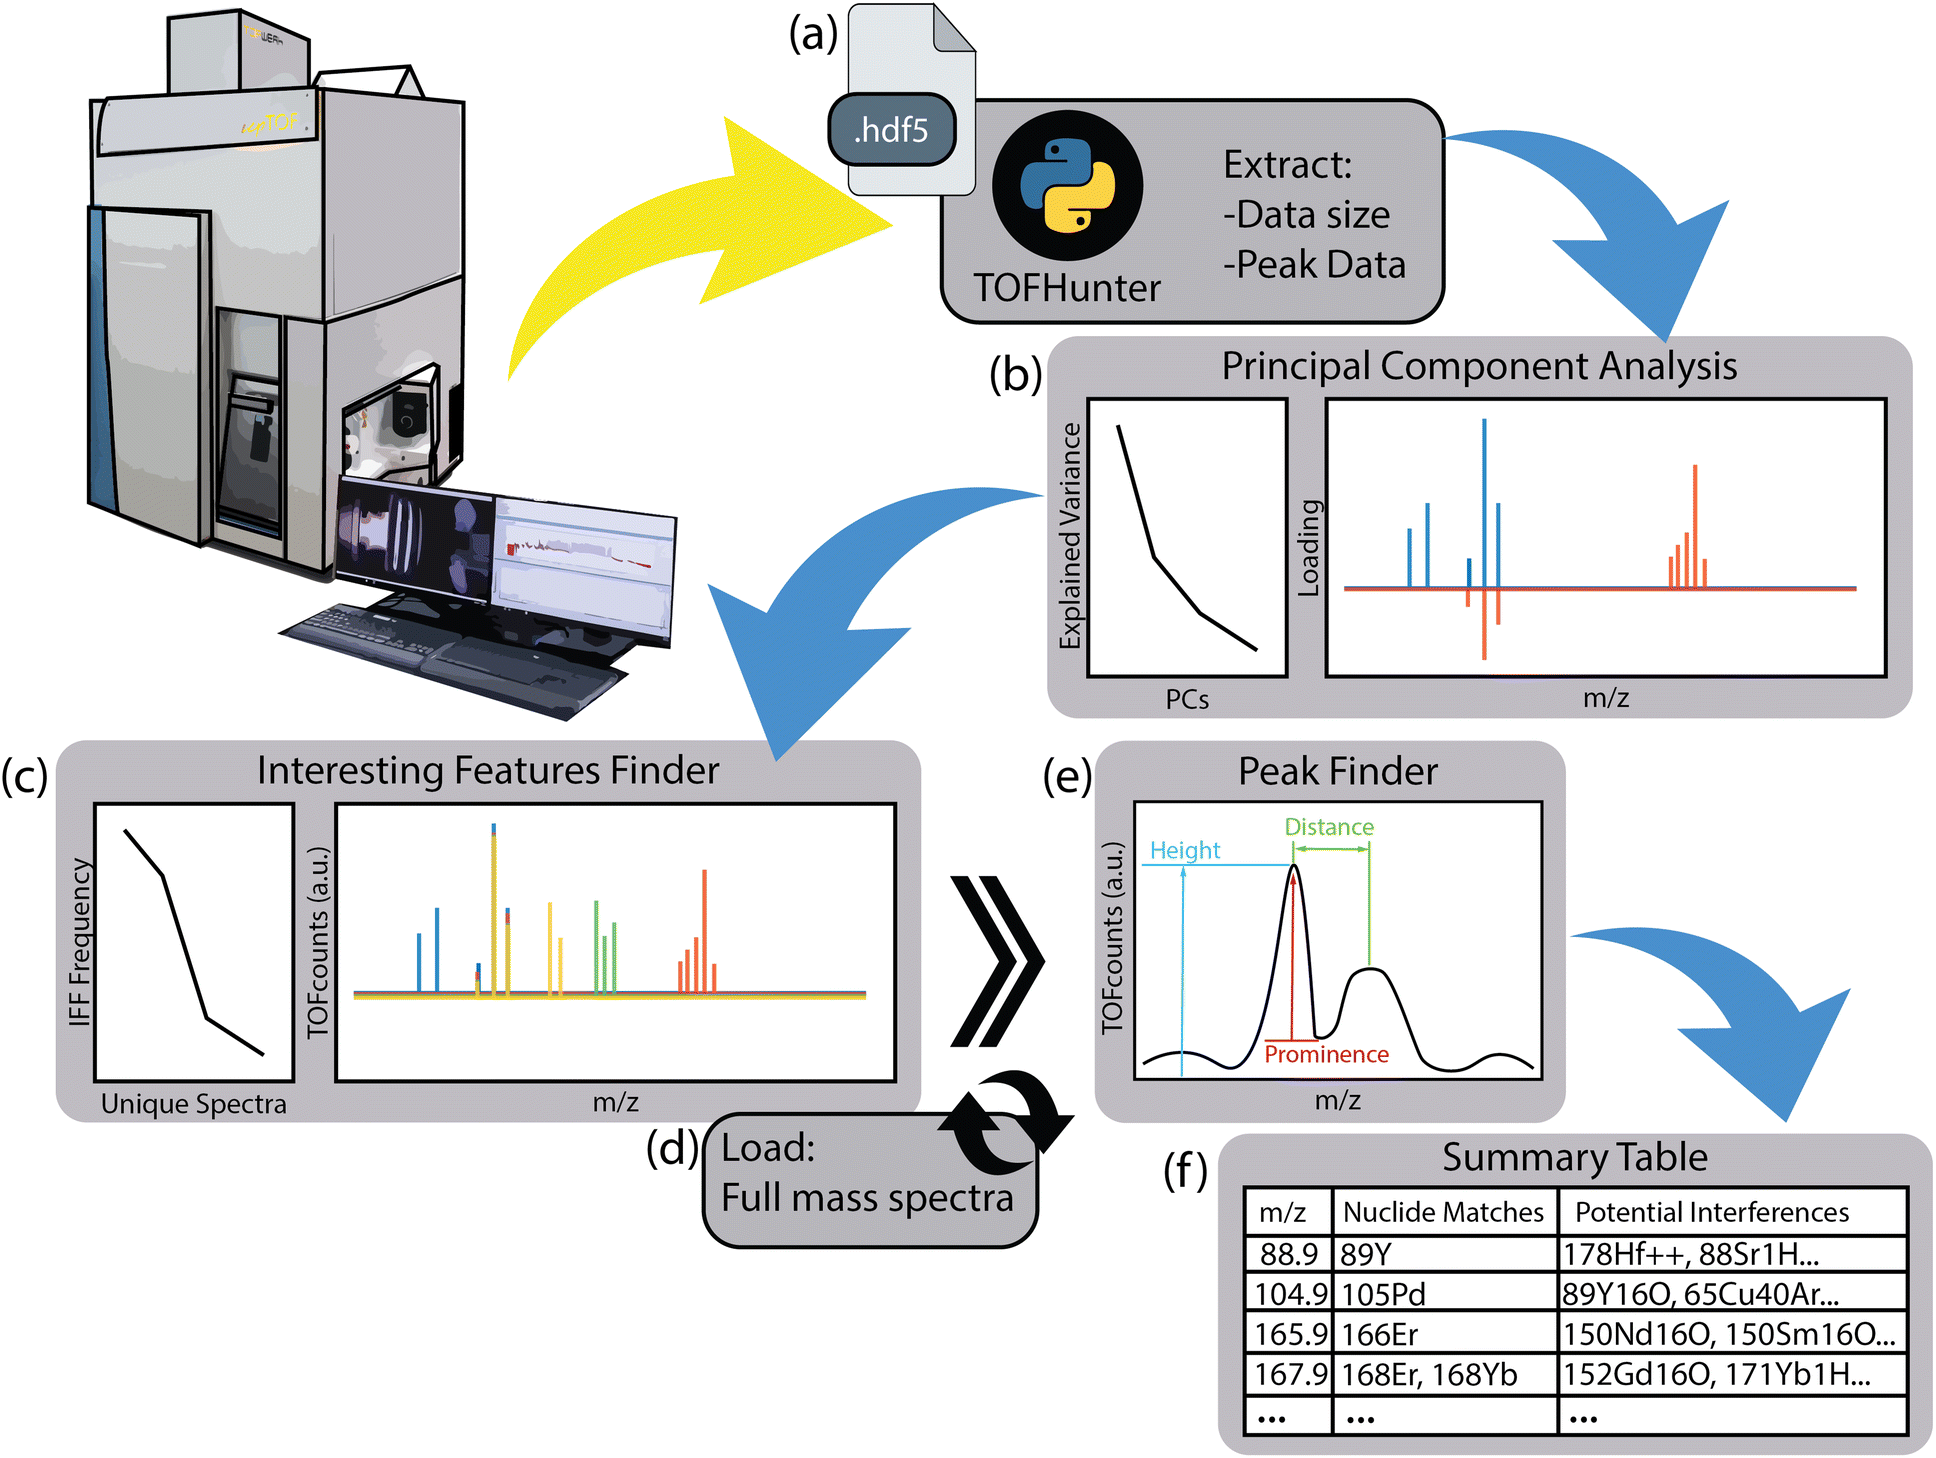 | ||
| Fig. 1 Notional diagram of TOFHunter program structure, including (a) data file selection, (b) PCA, (c) IFF, (d) loading of full-resolution mass spectra, (e) peak finding and (f) a nuclide and interference summary table. | ||
To explore the data from the ICP-TOF-MS in an untargeted approach, two chemometric techniques were applied. The first was PCA, which was performed using the scikit-learn library.25 PCA is a dimension reduction technique that identifies orthogonal vectors, or principal components (PCs), which explain the variance in the dataset. Correlation amongst features can be investigated by examining the loadings of these PCs. When running PCA in TOFHunter, the user may define ‘pca_components’ as an integer number of PCs or a fraction of the explained variance. This definition will include as many PCs as required to fulfill that level of explained variance. Note that the default value is set to 0.99, or 99% explained variance. Here, explained variance refers to the amount of dispersion in a dataset that can be accounted for by a model (e.g., PCA). This section concludes with a plot showing an explained variance versus PC plot and a plot of the PC loadings (see Fig. 1b). In TOFHunter, this plot is interactive, allowing the user to zoom in and out as needed. Note, no preprocessing is performed prior to PCA stemming from the ideology that the user would have no prior knowledge of the samples being screened; however, if desired the code can be augmented to trim the mass ranges considered and/or perform normalization.
The second chemometric tool, known as IFF, was originally designed to be used with LIBS data to rapidly evaluate large datasets and identify unique features regardless of their contribution to the overall variance.26 Since its inception, IFF has been applied in various LIBS-based application spaces, including studying archaeological mortar with LIBS imaging,27 exploring rare earth elements in mineral phases,28 and investigating lung diseases.29 In this way, IFF has been shown to capture minor signatures that may be missed using more traditional approaches such as PCA. This ability is particularly vital for LA-ICP-TOF-MS, in which very small compositional regions in mapping may only contribute a handful of mass spectra in a dataset with tens of thousands. Similarly, for SP-ICP-TOF-MS applications, a particle population may be diluted in a much larger matrix population. For these applications, the use of IFF on ICP-TOF-MS data may better enable the identification of elusive compounds—much like finding a needle in a haystack—without prior knowledge. Note, this study presents the first application of the IFF algorithm to ICP-TOF-MS data.
Detailed discussions of the IFF algorithm and how it works can be found elsewhere,26,29 but a brief explanation is provided here. These large datasets can be represented as a cloud of data points in multidimensional space. The IFF is used as a tool to estimate the convex hull of these data points, which is the enclosing edge of this data cloud. The IFF produces random vectors positioned through this data cloud and then projects the data onto these vectors. The first and last data points (spectra) projected onto these vectors are recorded as potential vertices for the convex hull. This process is iterated as a list of vertices (unique spectra), and the frequency with which they are identified are recorded. For a visual representation of this process, refer to a recent study by Ferreira et al.29
For the IFF in TOFHunter, the algorithm is run on the peak data matrix, which aids in computational time because the memory requirements are less than running the full spectra through the algorithm. Similar to the PCA portion, the user may define the number of unique features for the IFF to identify. For example, the ‘unique_spectra’ may be set as 0.1, which would determine the minimum frequency needed to extract a spectrum from the IFF tool as 10% of the most frequently selected spectrum's occurrence (i.e., 10% of 3030 would lead to a 30 frequency needed). This option allows for the code to dynamically adjust to the dataset being analyzed. Conversely, the user can explicitly identify the number of unique spectra as a defined integer. The unique spectra extracted from the IFF are then appended to a list and imported as their full-resolution mass spectra into the program. This section includes an interactive plot showing an IFF frequency versus spectrum number plot and a plot of the unique mass spectra themselves (Fig. 1c). Note, the raw mass spectra are in units of millivolts, but for simplicity, the y-axis is labelled as ‘Intensity’ with arbitrary units (a.u).
At this point, the provided plot of the IFF-determined unique mass spectra can be explored manually to better understand the dataset. However, in the interest of further expediting the screening process, the functionality was added to detect mass peaks and then match them with known masses and interferences. This section of TOFHunter uses the ‘find_peaks’ tools available from the SciPy library.30 Each IFF spectrum is parsed with mass peaks being identified based on three parameters that the user can fine-tune: peak height, prominence, and distance (Fig. 1e). Peak height refers to the minimum threshold in TOF-MS counts for a peak to be detected. Prominence is a measure of how well the peak stands out amongst its neighboring peaks. Lastly, distance refers to the space between peaks and acts as a constraint to prevent multiple points being detected amongst a single mass peak. Based on the testing done on the data presented in this study, the default values were defined as 5 and 60 for prominence and distance, respectively. Peak height is adjusted more frequently based on signal intensity. To aid in tuning these parameters, an additional plot is provided in this section, which illustrates a selected IFF spectrum and identified peaks with a marker. The result of this section is a tabulated list of peak masses and intensities tied to their IFF spectrum number.
The last section of TOFHunter matches the previously generated peak list with matching nuclides and potential interferences. Two reference sheets are used for this step. The first is a Microsoft Excel file version of the National Institute of Standards and Technology's Atomic Weights and Isotopic Compositions for All Elements database.31 The second sheet is a database of interferences assembled by Lomax-Vogt and Olesik.32 Note that this reference sheet was modified such that doubly charged species originating from odd atomic masses were notated by only the half-mass at which they would appear rather than the two nearest integer masses. Additionally, other known interferences or molecular masses that were not present in the list (e.g., 238U16O+) were added as necessary. All interferences identified in this database are positively charged ions unless otherwise noted. The nuclides and potential interferences were matched with the peak list from the peak identifier by rounding peak masses to their nearest 0.5 amu and then recording matches. A summary data frame is the result of this section, which includes spectrum number, peak mass, peak intensity, matching nuclides, and potential interferences (Fig. 1f). The option to export the summary table to a separate Excel sheet at a user-defined ‘export_path’ is provided in the forefront of the script.
The TOFHunter program is available for download (http://github.com/andrewshb/TOFHunter) for free use by the ICP-TOF-MS community. Note that this approach should be considered as a screening tool and not a clustering tool. There is no filtering, no thresholding, and no consideration of critical values related to sensitivity. Although the program is powerful for untargeted screening and dataset exploration, it is not a classification tool in its current form and does rely on user judgment. TOFHunter is designed to provide analysts a rapid inspection of their data to inform further analysis. For example, the screening feature of TOFHunter can be used to reevaluate the planned standards such that subsequent analysis can be thorough and better equipped for statistical analysis and quantification.
3. TOFHunter use case examples
To both test the developed program and demonstrate the ways in which it can be used, four example use cases are provided in this article. Following scientific norms to reuse existing datasets, most of the datasets used in this study were repurposed from previous collaborations.3.1. Aqueous injections
As discussed previously, PCA is commonly dominated by high-intensity signals, which significantly contribute to the variance. Thus, for conventional steady-state signals such as those produced from ionic standards or digested samples, plasma species (e.g., Ar+, ArH+, O2+, N+, ArO+, Ar2+) and background signals (e.g., H2O+, Si+) may overshadow lower-concentration analyte signals in the PCA results. This effect is illustrated in Fig. 2, where a multielement solution was measured at different concentrations. Nominal concentrations of 0.01, 10 and 100 μg mL−1 of the multielement standard were investigated, but for simplicity, only 0.01 and 100 μg mL−1 are shown in Fig. 2. The multielement solutions were measured using an icpTOF S2 (TOFWERK, Switzerland) with the standard sample introduction system comprising a cyclonic quartz spray chamber with a MicroMist nebulizer. The multielement solution calibration series was prepared from 10 μg mL−1 29 element ICP calibration/quality control standard (IV-Stock-21, Inorganic Venture) and 10 μg mL−1 rare earth, U, Th ICP Standard (CMS-1, Inorganic Venture). The 1 μg mL−1 multielement solution contained the following 46 elements: Ag, Al, As, Ba, Be, Bi, Ca, Cd, Ce, Co, Cr, Cs, Cu, Dy, Er, Eu, Fe, Ga, Gd, Ho, In, K, La, Li, Lu, Mg, Mn, Na, Nd, Ni, Pb, Pr, Rb, Sc, Se, Sm, Sr, Tb, Th, Tl, Tm, U, V, Y, Yb and Zn. As expected, at the lowest concentration of 0.01 μg mL−1, Fig. 2a shows a predominance for plasma species, as shown by the large loadings associated with argide interferences (e.g., 40Ar14N+, 40Ar16O+, 40Ar40Ar+). However, when the concentration of the multielement solution was increased, the analyte peaks gained in signal intensity, surpassing the plasma species as the superior source of variance and significantly altering the PCA loading plot. However, the IFF was designed to better capture low-variance signals and was less drastically affected by the change in the magnitude of the signal intensity, a difference was still observable.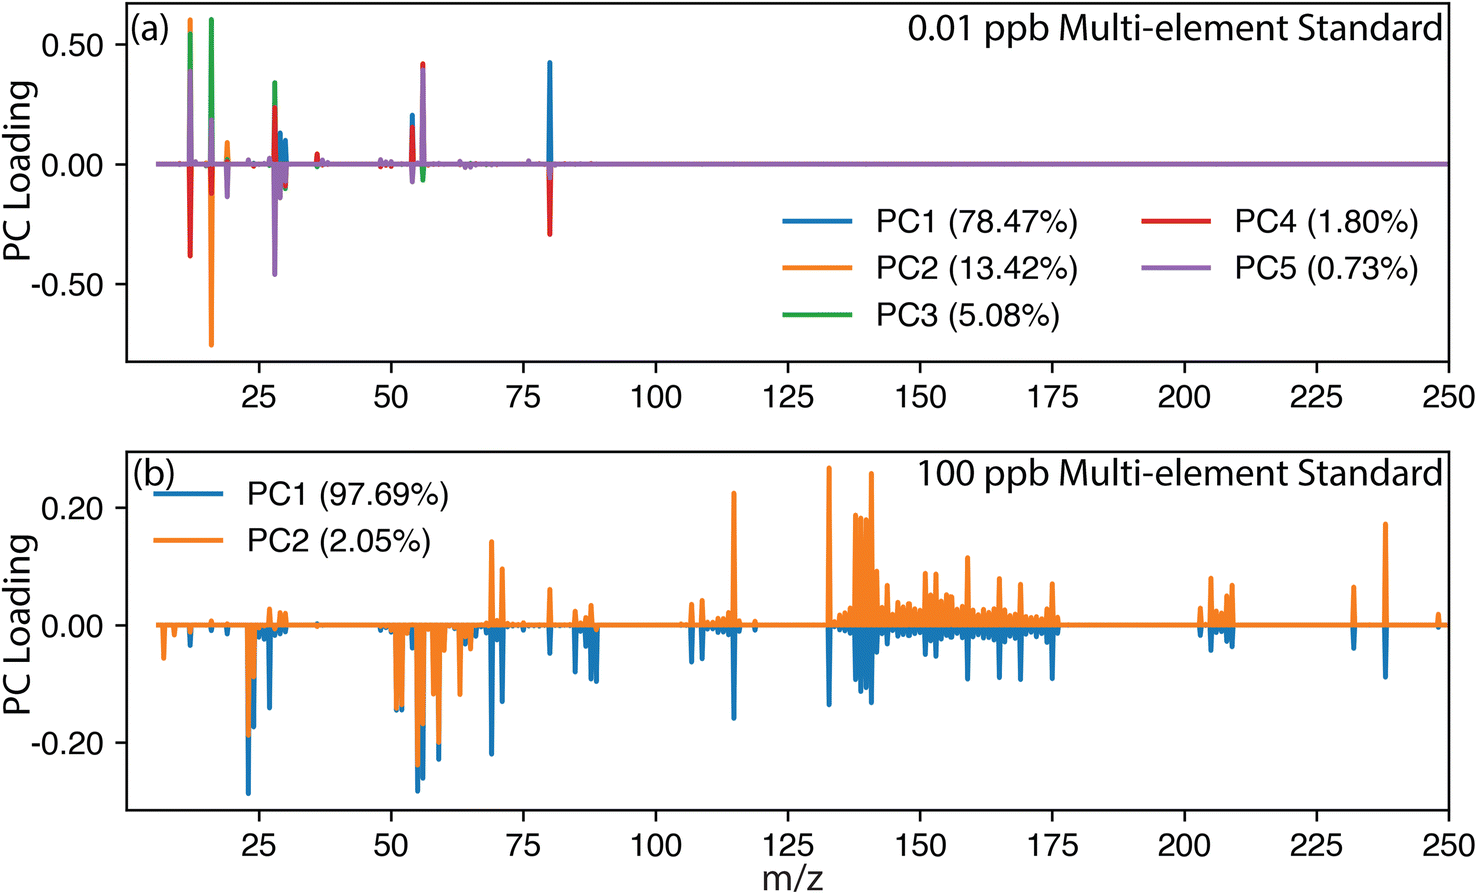 | ||
| Fig. 2 PCA loading plot illustrating the effect of increasing analyte concentration in a multielement solution. At lower concentrations, the PCA was dominated by plasma species. As the concentration of analytes increased from (a) 0.01 μg mL−1 to (b) 100 μg mL−1, their signal intensity surpassed that of the plasma species, ultimately simplifying the results. | ||
The effectiveness of PCA and IFF in identifying analytes and key features in TOF-MS datasets is not only determined by signal magnitude but is also influenced by time resolution used during the acquisition. Similar to observations made regarding the effectiveness of baseline subtraction, higher time resolution, achieved through shorter integration times, results in fewer ions detected per spectrum, leading to a less well-defined spectrum, which may prevent an accurate characterization.33 Alternatively, longer integration times allow the accumulation of more ions per spectrum, thereby enhancing the signal-to-noise ratio and improving the ability of PCA and IFF to accurately identify and characterize analytes. This effect is investigated in Fig. S1,† where the same 100 μg mL−1 multielement solutions were measured at 1 ms, 10 ms, and 100 ms. High time resolution resulted in less well-defined mass spectra, leading to an increase in unique spectra selected by IFF. Conversely, slower integration times averaged multiple spectra together, reducing variance and resulting in fewer unique spectra. Ultimately, the choice of time resolution depends on the user's application and the IFF will result in more or less unique features accordingly when assuming a consistent sample transient, which is not the case for many SP-ICP-TOF-MS and LA-ICP-TOF-MS applications.
3.2. SP-ICP-TOF-MS: upconversion nanoparticles and nanoplastics
In the case of sparse analyte signals, such as when monitoring the short transient signals generated from NPs in SP-ICP-MS applications, background events typically greatly outnumber NP events. Here, up-conversion NPs (UCNPs) were used to demonstrate the different information extracted from PCA and IFF. UCNPs are nanomaterials typically composed of a host matrix such as NaYF4 doped with rare earth ions such as Yb3+ and Er3+, which convert low-energy infrared light into higher-energy visible light. Depending on the desired properties or the end-use application, the synthesis process is adjusted, and in this case, the following elements were expected to be detected: Y, Ce, Er and Yb. In this specific case, 22![[thin space (1/6-em)]](https://www.rsc.org/images/entities/char_2009.gif) 802 UCNPs were detected within the 250000 data points (300 s acquisition time with 1.2 ms integration time), representing a ratio of UCNPs to background data points of 9%. The samples were measured on an icpTOF S2 (TOFWERK, Switzerland) using the standard sample introduction system comprising a cyclonic quartz spray chamber with a MicroMist nebulizer. As shown in Fig. 3, the UCNPs signals were absent in the PCA loadings, but IFF correctly identified them. The reason for this is that PCA focuses on explaining the most sample variance, whereas IFF finds the unique sources of variance, which, in this case, are the UCNPs. Notably, the IFF also identifies a subpopulation of Sn particles which were unexpected. This is an example of signals that account for 9% of the overall dataset not necessarily accounting for 9% of the experimental variance. Variance is defined as how much values deviate from the mean of the dataset; because the plasma species dominated the mass spectra, the UCNP signals contributed little to the variance in comparison. The predominance of plasma species and background species (H2O+, Si+), which have a constant signal, was not ignored in the IFF but reflected in the most frequently identified unique mass spectra.
802 UCNPs were detected within the 250000 data points (300 s acquisition time with 1.2 ms integration time), representing a ratio of UCNPs to background data points of 9%. The samples were measured on an icpTOF S2 (TOFWERK, Switzerland) using the standard sample introduction system comprising a cyclonic quartz spray chamber with a MicroMist nebulizer. As shown in Fig. 3, the UCNPs signals were absent in the PCA loadings, but IFF correctly identified them. The reason for this is that PCA focuses on explaining the most sample variance, whereas IFF finds the unique sources of variance, which, in this case, are the UCNPs. Notably, the IFF also identifies a subpopulation of Sn particles which were unexpected. This is an example of signals that account for 9% of the overall dataset not necessarily accounting for 9% of the experimental variance. Variance is defined as how much values deviate from the mean of the dataset; because the plasma species dominated the mass spectra, the UCNP signals contributed little to the variance in comparison. The predominance of plasma species and background species (H2O+, Si+), which have a constant signal, was not ignored in the IFF but reflected in the most frequently identified unique mass spectra.
 | ||
| Fig. 3 (a) PCA results and (b) IFF results for the UCNP samples with explained variance levels and IFF frequencies provided in the corresponding legends (IFF offset = 2000 a.u). The UCNP signature is denoted in the IFF2 spectral plot. Note: the first most-frequent IFF spectra, IFF1, only contains plasma species owing to the sparse nature of SP-ICP-TOF-MS; this is the large source of variance that prevented PCA from capturing the UCNP signatures. | ||
As mentioned previously, IFF identifies unique sources of variances and thus has the potential to reveal different subpopulations. In another example dataset using THP-1 cells exposed to Pd-doped nanoplastics, one can expect to identify three subpopulations: cells only, Pd-doped nanoplastics only, and joint events where cells and nanoplastics are associated.34 These samples were measured on an icpTOF S2 using a single-cell sample introduction system (Glass Expansion Inc., Australia). In the initial work, cell events were identified based on the detection of their elemental fingerprint comprising P and Zn. In Fig. 4, the IFF frequency plot reveals the presence of the expected three subpopulations with their corresponding unique mass spectrum (IFF1) cells only, (IFF2) Pd-doped nanoplastics only, and (IFF4) joint events where cells and nanoplastics were associated. An unexpected subpopulation of cells of lower signal intensity was detected and attributed to cell fragmentation (IFF3) during the sample introduction process. An abbreviated version of the peak summary table can be found in the ESI (Table S1).†
 | ||
| Fig. 4 The unique mass spectra for a sample containing exposed THP-1 cells.34 The first four unique spectra identified by IFF describe the entire dataset (bottom to top): (IFF1) cells, (IFF2) nanoplastics, (IFF3) a subpopulation of potentially fragmented cells and (IFF4) joint events. The application of IFF accurately identified these four distinct groups, demonstrating its effectiveness in distinguishing complex mixtures. | ||
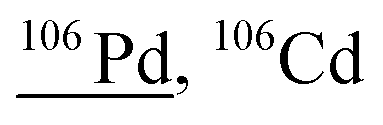
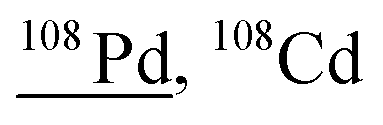
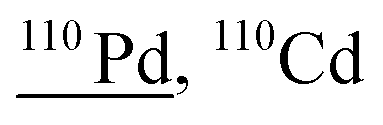
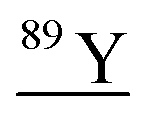
Other than population identification, the simultaneous multielement detection capability of TOF-MS permits the identification of various m/z values, as illustrated in Fig. 5, where IFF2 from the UCNPs is overlaid with IFF2 from the THP-1 cells sample. An abbreviated version of the peak summary table is provided in Table 1. A signal observed at m/z = 105 could naively be attributed to 105Pd considering that Pd has isotopes in this mass range. However, 105Pd is not the most abundant isotope; its natural abundance is relatively low (22.3%). In a typical Pd isotopic distribution, one would expect to see prominent signals corresponding to other isotopes such as 106Pd (27.3%), 108Pd (26.5%), and 110Pd (11.7%). Although this isotopic pattern can be correctly identified in Pd-doped nanoplastics, it was not observed in UCNPs samples. Instead, an intense peak at m/z = 89 was detected, indicating the presence of Y. This result suggests that the signal at m/z = 105 was not due to 105Pd but rather to 89Y16O+. This example demonstrates the power of additional information from TOF-MS measurements to accurately identify different m/z values. By leveraging isotopic patterns, the presence of various species can be better validated. The detection of doubly charged species is confirmed based on the presence of corresponding singly charged species, and similarly for oxide forms, the nonoxidized form needs to be present. Consequently, the presented algorithm provides a robust and reliable method for feature extraction and confirmation in ICP-TOF-MS data analysis. Although this capability presently relies on the user, future additions to the program could leverage the nuclide library and isotopic signatures from the included National Institute of Standards and Technology database to computationally perform this analysis.
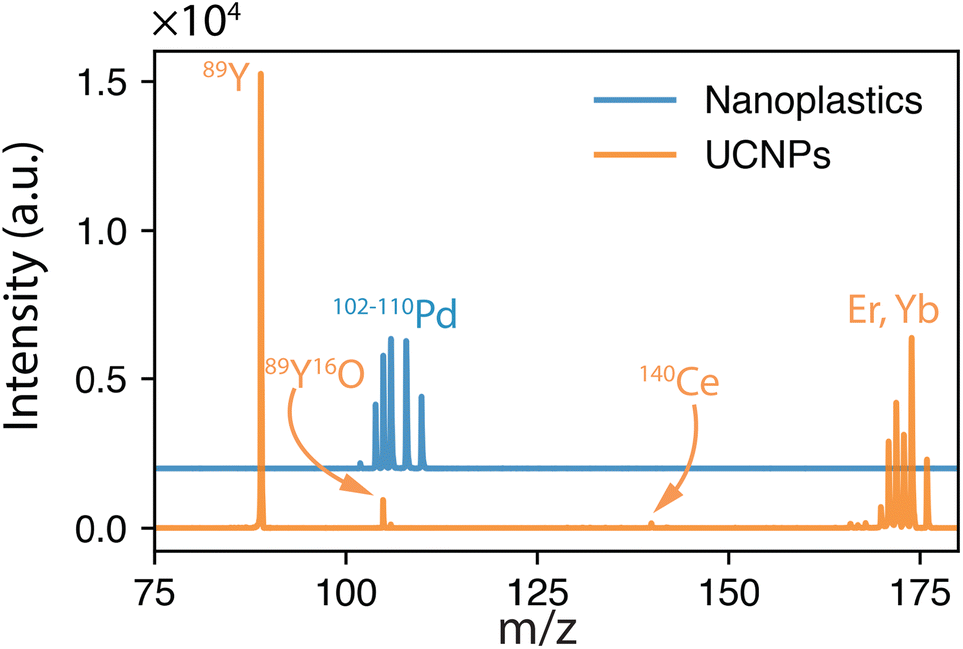 | ||
| Fig. 5 Overlay of the unique spectra from UCNPs and THP-1 cells exposed to 5 μg mL−1 Pd-doped nanoplastics. A signal at m/z = 105 could naively be attributed to 105Pd. However, 105Pd is not the major Pd isotope, and other Pd isotopes should be detected. The isotopic Pd pattern is identifiable in Pd-doped nanoplastics but not in UCNPs. Instead, an intense peak at m/z = 89 indicates m/z = 105 as 89Y16O+, the oxidized species of Y. | ||
| m/z | Intensity (a.u.) | Nuclide matches | Potential interferences |
|---|---|---|---|
| a Underlined nuclides represent the most likely matches based on user judgement. b All interferences are positively charged ions unless otherwise noted. | |||
| Pd-doped nanoplastics | |||
| 101.9 | 178 |
|
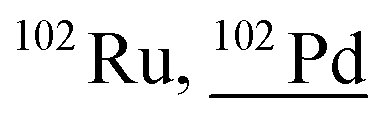
204Hg++, 52Cr16O16O16O1H1H, 53Cr16O16O16O1H, 54Cr16O16O16O, 164Dy40Ar++, 62Ni40Ar, 204Pb++, 85Rb16O1H, 101Ru1H, 86Sr16O, 84Sr18O, 84Sr17O1H |
| 103.9 | 2133 |

|
87Rb16O1H, 54Cr16O16O16O1H1H, 64Ni40Ar, 208Pb++, 103Rh1H, 88Sr16O, 87Sr16O1H, 86Sr18O, 87Sr17O, 86Sr17O1H, 64Zn40Ar |
| 105.9 | 4354 |
|
105Pd1H, 88Sr18O, 88Sr17O1H, 89Y17O, 89Y16O1H, 172Yb40Ar++, 66Zn40Ar, 90Zr16O, 70Ge36Ar, 92Mo14N, 50Cr40Ar16O |
| 107.9 | 4281 |
|
107Ag1H, 52Cr40Ar16O, 92Mo16O, 76Se16O16O, 89Y18O1H, 176Yb40Ar++, 68Zn40Ar, 92Zr16O, 91Zr16O1H, 90Zr18O, 91Zr16O16O1H, 70Ge38Ar, 72Ge36Ar, 94Mo14N |
| 109.9 | 2397 |
|
54Cr40Ar16O, 109Ag1H, 72Ge38Ar, 70Ge40Ar, 74Ge36Ar, 94Mo16O, 93Nb16O1H, 93Nb17O, 78Se16O16O, 70Zn40Ar, 94Zr16O, 92Zr18O, 96Mo14N, 74Se36Ar |
|
|||
| UCNPs | |||
| 44.5 | 59 | — |

|
| 88.9 | 15254 |
|
138Ba40Ar++, 71Ga18O, 72Ge17O, 72Ge16O1H, 73Ge16O, 178Hf++, 88Sr1H, 49Ti40Ar, 51V38Ar |
| 104.9 | 945 | 105Pd |

|
| 139.9 | 162 |

|
102Ru38Ar, 100Ru36Ar, 123Sb17O, 139La1H, 92Mo16O16O16O, 100Mo40Ar, 100Ru40Ar, 124Sn16O, 124Te16O, 123Te16O1H |
| 165.9 | 144 |
|
50Cr52Cr16O16O16O16O, 165Ho1H, 150Nd16O, 148Nd18O, 150Sm16O, 149Sm16O1H |
| 167.9 | 171 |
|
50Cr54Cr16O16O16O16O, 52Cr52Cr16O16O16O16O, 167Er1H, 151Eu16O1H, 151Eu17O, 152Gd16O, 150Nd18O, 152Sm16O, 136Ce16O16O |
| 169.9 | 707 |

|
151Eu18O1H, 152Gd18O, 152Gd17O1H, 52Cr53Cr16O16O16O16O1H, 52Cr54Cr16O16O16O16O, 53Cr53Cr16O16O16O16O, 153Eu16O1H, 153Eu17O, 154Gd16O, 154Sm16O, 169Tm1H, 138Ce16O16O |
| 171.9 | 4195 |

|
155Gd17O, 154Gd18O, 154Gd17O1H, 132Ba40Ar, 140Ce16O16O, 156Dy16O, 153Eu18O1H, 156Gd16O, 155Gd16O1H, 171Yb1H, 136Ce36Ar |
| 173.9 | 6386 |
|
157Gd17O, 156Gd18O, 156Gd17O1H, 155Gd18O1H, 134Ba40Ar, 142Ce16O16O, 158Dy16O, 157Gd16O1H, 158Gd16O, 173Yb1H, 136Ce38Ar, 138Ce36Ar |
| 175.9 | 2302 |

|
158Gd18O, 158Gd17O1H, 157Gd18O1H, 136Ba40Ar, 160Dy16O, 160Gd16O, 159Tb16O1H, 159Tb17O, 175Lu1H, 140Ce36Ar, 136Ce40Ar, 138Ce38Ar |
3.3. LA-ICP-TOF-MS: meteorite mapping
Another common use of ICP-TOF-MS is for LA mapping of geological and biological samples. The quasi simultaneous detection enabled by the TOF-MS permits faster scan rates, allowing megahertz imaging. Again, these samples generate incredibly large data files, and when unknown or exploratory samples are run, analysis can be overwhelming. Here, TOFHunter can be leveraged for untargeted screening of LA-ICP-TOF-MS data to investigate zoning and correlations as well as help distinguish nuclides from their isobaric interferences. For this example, an LA-ICP-TOF-MS map of an Al Bir Lahlou meteorite cross section is presented. Al Bir Lahlou 001 is a noritic achondrite primarily comprising Ca-rich plagioclase (60 vol%) and low-Ca pyroxene (35 vol%) with minor amounts of olivine, low-Ni metal and Cr-spinel.35 The meteorite was acquired as a cross section cut from a large fragment and, as such, only required polishing prior to being analysed. The meteorite was analysed with an ImageGEO193 (Elemental Scientific Lasers, Bozeman, Montana) and an icpTOF R (TOFWERK, Switzerland) using a 20 × 20 μm spot at 80 Hz with a scan speed of 504 μm s−1. The sample was approximately 0.36 cm2 and took 70 min to map, resulting in a large 2.6 GB data file. The TOFHunter script completed its screening analysis in less than 30 s.The first two PCA components explain 90% of the sample variance, with eight additional PCs required for the remaining 9% variance to reach the desired 99%. When PC1 was investigated, it was clear that Ba, confirmed based on the isotopic signature in the mass spectrum, was a dominating source of variance. In this case, TOFHunter was used to identify correlated and anticorrelated mass signatures. The PC1 loadings reveal Ba isotopes correlated with 44Ca and anticorrelated with 52Cr and 24Mg. The PC1 loading results described well the dominant source of mineralogic variance in this meteorite, with Ca-rich plagioclase (low Mg and Cr) and low-Ca pyroxene (high Mg and Cr) being the most volumetric components. This example is visualized in Fig. 6, where the PCA loadings and corresponding RGB maps were generated in iolite 4 (Elemental Scientific Lasers, Bozeman, Montana). Notably, iolite 4 does contain PCA functionality, but the user must select TOF-MS masses to use in the PCA, whereas TOFHunter performs the PCA in an untargeted approach and provides visual loadings for inspection. HDIP offers PCA functionality as well; however, the integration of the IFF functionality offers the ability to identify low variance signatures as well.
 | ||
| Fig. 6 PCA components (a) PC1 and (b) PC2 used for identifying correlated and anticorrelated masses. RGB maps were generated in iolite 4. | ||
As shown in Fig. 6, a user can readily leverage TOFHunter and iolite 4 for rapid image analysis. The utility of this untargeted approach is highlighted by the presence and relationship of Ba, which would not likely have been the target of initial investigation. The presence of discrete Ba-rich regions, as well as the anticorrelated behavior with Mg and Cr, should provoke further investigation. For example, if the Ba is hosted in the sulfate mineral, barite (BaSO4), then the origin is likely terrestrial chemical weathering.36 Note that in Fig. 6a and b, the Ba isotopic ratio appears to change; this change was due to saturation of the major 138Ba isotope. Simply, Fig. 6b shows that as Mg and Si increased, so did Ba. However, because 138Ba was likely saturating the detector, all other isotopes of Ba increased more than 138Ba, generating this deviance from the natural isotopic ratio. This is an excellent example to warn users not to rely solely on PCA isotopic fingerprints, but rather inspect the spectra themselves using IFF where saturation is readily visible.
Like with PCA, IFF can be used to identify unique regions within the mapped sample. IFF should be more sensitive to minor regional signatures than PCA, which is dominated by the larger regions that contribute the most to the data variance. Here, many unique spectra were identified, and the top four were each counted at least 15% of the time as unique signatures. Additionally, the signal response in this mapping sample was far more intense than previous examples, so the peak_height parameter was modified to 1000 a.u. to minimize erroneous peaks in the summary table.
Upon further investigation of the IFF results, it was confirmed that saturation of the TOF-MS detector led to more IFF unique spectra being identified. For example, as the Ba saturated the TOF-MS, the minor Ba isotopes continued to grow in intensity while the major isotopes remained constant at the saturation limit. This effect is seen in the PCA as well. This essentially tricks the algorithm into considering the saturated and unsaturated spectra as being unique from one another. The IFF spectra revealed several nuclides that were not as evident in the PCA analysis, highlighting its benefit. The IFF spectra and RGB maps are shown in Fig. 7. The IFF spectra agree well with the expected mineral compositions. In Fig. 7b, the map of 59Co, 54Fe and 24Mg identifies a unique region with the Co-bearing Fe-metal described in the classification.35 The Sr (plagioclase) was anticorrelated with the Fe and Mg (pyroxene), agreeing with the PC1 results. An interesting result is the relationship between 88Sr, 140Ce and 134Ba shown in small, discrete regions as individual and mixed components, which were not described in the original classification of this meteorite and warrant further investigation.
 | ||
| Fig. 7 (a) IFF-identified mass spectra used for identifying unique regions in the (b and c) mapped Al Bir Lahlou meteorite. | ||
4. Conclusions
ICP-TOF-MS offers the advantage of fast data acquisition rates collected both rapidly and with a high degree of dimensionality. This benefit is accompanied by a reliance on a degree of data handling that has otherwise not been needed in ICP-MS analytical measurements using conventional quadrupole MS. Whereas these traditional measurements rely on users defining the species of interest prior to analysis, ICP-TOF-MS offers the opportunity to perform untargeted screening. Although programs have been made to aid users in data analysis including SP event detection, advanced calibration approaches, and clustering tools, no universal untargeted screening tools have been developed to replace inefficient user parsing of data during or after collection. Conversely, TOFHunter is designed to be agnostic to the source of the ICP-TOF-MS application and is designed to be a preliminary tool to allow users to rapidly understand their complicated data. Based on the TOFHunter results, it would be expected for users to then repeat measurements with proper calibrants and utilize other software tools to further analyze their results with proper statistical considerations for quantifiable results.TOFHunter allows researchers to analyse their ICP-TOF-MS data in a systematic and untargeted screening manner, enabling the confirmation of known and identification of unknown analytes, thereby providing a comprehensive view of the sample composition. The tool leverages two powerful chemometric approaches—PCA and IFF—to inspect correlated signatures, as well as high- and low-variance sources. The novel combination of PCA and IFF offers a unique inspection of ICP-TOF-MS data not provided elsewhere. In SP-ICP-TOF-MS applications, particle signals very often constitute less than 10% of the dataset; consequently, IFF has been shown to be powerful for detecting several of these minor populations within the examples given. Similarly, for LA-ICP-TOF-MS, both PCA and IFF were demonstrated as powerful tools to access which features should be considered for further analysis (e.g., mapping) and relationships between analytes that would have otherwise gone unnoticed. In both cases, TOFHunter generates an output summary file listing the peaks detected along with their corresponding nuclide matches and potential interferences. This tool provides the foundation for a user to investigate isotopic trends and further decipher the analytes of interest for a given sample. This tool can be used for screening sample data to define which calibrations are needed.
Data availability
Data is available upon reasonable request and approval from data owners. TOFHunter is available for download at (https://github.com/andrewshb/TOFHunter). Both a standard Python script and GUI are available.Conflicts of interest
L. H. worked for TOFWERK AG at the time of this work.Acknowledgements
The authors acknowledge the different collaborators for generously providing the samples, from which the generated data were repurposed in this study. The collaboration and data shared were instrumental in testing the efficacy of the software algorithm. The engineered nanoparticles samples (UCNPs) presented in Fig. 3 and 5 were provided by Dr Christoph Gimmler from the Fraunhofer Center for Applied Nanotechnology in Hamburg, Germany, which is part of the Fraunhofer Institute for Applied Polymer Research. The Pd-doped nanoplastics (Fig. 4 and 5) were provided by Prof. Densie Mitrano from ETH Zurich in Zurich, Switzerland. The THP-1 cells presented in Fig. 4 were provided by Dr Tina Bürki-Thurnherr from Empa, St. Gallen, Switzerland. The data generated from the exposed THP-1 cells originated from a previous study34 and was repurposed here. This work was supported by the Oak Ridge National Laboratory, managed by UT-Battelle for the US Department of Energy under contract DE-AC05-000R22725. This work was supported by the Laboratory Directed Research and Development Program of Oak Ridge National Laboratory and the United States National Nuclear Security Administration's Office of Defense Nuclear Nonproliferation Research and Development.References
- A. Praetorius, A. Gundlach-Graham, E. Goldberg, W. Fabienke, J. Navratilova, A. Gondikas, R. Kaegi, D. Günther, T. Hofmann and F. Von Der Kammer, Environ. Sci.: Nano, 2017, 4, 307–314 RSC.
- A. Gundlach-Graham, M. Burger, S. Allner, G. Schwarz, H. A. Wang, L. Gyr, D. Grolimund, B. Hattendorf and D. Günther, Anal. Chem., 2015, 87, 8250–8258 CrossRef CAS PubMed.
- A. Gundlach-Graham and D. Günther, Anal. Bioanal. Chem., 2016, 408, 2687–2695 CrossRef CAS PubMed.
- S. M. Chernonozhkin, T. Van Acker, S. J. Van Malderen, J. Belza, S. Goderis and F. Vanhaecke, J. Anal. At. Spectrom., 2024, 39, 1050–1056 RSC.
- M. D. Montaño, C. W. Cuss, H. M. Holliday, M. B. Javed, W. Shotyk, K. L. Sobocinski, T. Hofmann, F. v. d. Kammer and J. F. Ranville, ACS Earth Space Chem., 2022, 6, 943–952 CrossRef PubMed.
- C. Neff, P. K. Schmidt, P. S. Garofalo, G. Schwarz and D. Günther, J. Anal. At. Spectrom., 2020, 35, 2255–2266 RSC.
- A. Gundlach-Graham, P. S. Garofalo, G. Schwarz, D. Redi and D. Günther, Geostand. Geoanal. Res., 2018, 42, 559–574 CrossRef CAS.
- A. Gondikas, F. von der Kammer, R. Kaegi, O. Borovinskaya, E. Neubauer, J. Navratilova, A. Praetorius, G. Cornelis and T. Hofmann, Environ. Sci.: Nano, 2018, 5, 313–326 RSC.
- K. Mehrabi, R. Kaegi, D. Günther and A. Gundlach-Graham, Environ. Sci.: Nano, 2021, 8, 1211–1225 RSC.
- J. Wang, M. M. Nabi, M. Erfani, E. Goharian and M. Baalousha, Environ. Sci.: Nano, 2022, 9, 714–729 RSC.
- R. Brünjes, J. Schüürman, F. von der Kammer and T. Hofmann, Forensic Sci. Int., 2022, 332, 111202 CrossRef PubMed.
- A.-L. Ronzani, F. Pointurier, M. Rittner, O. Borovinskaya, M. Tanner, A. Hubert, A.-C. Humbert, J. Aupiais and N. Dacheux, J. Anal. At. Spectrom., 2018, 33, 1892–1902 RSC.
- A. Schoeberl, M. Gutmann, S. Theiner, M. Schaier, A. Schweikert, W. Berger and G. Koellensperger, Anal. Chem., 2021, 93, 16456–16465 CrossRef CAS PubMed.
- D. Metarapi, A. Schweikert, A. Jerše, M. Schaier, J. T. van Elteren, G. Koellensperger, S. Theiner and M. Šala, Anal. Chem., 2023, 95, 7804–7812 CrossRef CAS PubMed.
- H. B. Andrews, C. D. Quarles Jr, V. C. Bradley, T. L. Spano, J. A. Petrus, B. Paul, N. A. Zirakparvar, D. R. Dunlap, C. R. Hexel and B. T. Manard, Microchem. J., 2024, 196, 109605 CrossRef CAS.
- E. H. Kwapis, J. Borrero, K. S. Latty, H. B. Andrews and K. C. Hartig, Appl. Spectrosc., 2024, 78, 9–55 CrossRef CAS PubMed.
- T. R. Holbrook, D. Gallot-Duval, T. Reemtsma and S. Wagner, J. Anal. At. Spectrom., 2021, 36, 2684–2694 RSC.
- G. D. Bland, M. Battifarano, A. E. Pradas del Real, G. Sarret and G. V. Lowry, Environ. Sci. Technol., 2022, 56, 2990–3001 CrossRef CAS PubMed.
- R. L. Buckman and A. Gundlach-Graham, J. Anal. At. Spectrom., 2023, 38, 1244–1252 RSC.
- M. Baalousha, J. Wang, M. Erfani and E. Goharian, Sci. Total Environ., 2021, 792, 148426 CrossRef CAS PubMed.
- M. Tharaud, L. Schlatt, P. Shaw and M. F. Benedetti, J. Anal. At. Spectrom., 2022, 37, 2042–2052 RSC.
- A. Gundlach-Graham, S. Harycki, S. E. Szakas, T. L. Taylor, H. Karkee, R. L. Buckman, S. Mukta, R. Hu and W. Lee, J. Anal. At. Spectrom., 2024, 39, 704–711 RSC.
- T. E. Lockwood, R. G. de Vega and D. Clases, J. Anal. At. Spectrom., 2021, 36, 2536–2544 RSC.
- T. E. Lockwood, L. Schlatt and D. Clases, J. Anal. At. Spectrom., 2025, 40, 130–136 RSC.
- F. Pedregosa, J. Mach. Learn. Res., 2011, 12, 2825 Search PubMed.
- Q. Wu, C. Marina-Montes, J. O. Cáceres, J. Anzano, V. Motto-Ros and L. Duponchel, Spectrochim. Acta, Part B, 2022, 195, 106508 CrossRef CAS.
- N. Herreyre, A. Cormier, S. Hermelin, C. Oberlin, A. Schmitt, V. Thirion-Merle, A. Borlenghi, D. Prigent, C. Coquidé and A. Valois, J. Anal. At. Spectrom., 2023, 38, 730–741 RSC.
- C. Fabre, L. Marulier, B. Monfaredi, V. Motto-Ros, B. Bousquet, A. Eglinger and A. Tarantola, Spectrochim. Acta, Part B, 2024, 106954 CrossRef CAS.
- V. H. Ferreira, V. Gardette, B. Busser, L. Sancey, S. Ronsmans, V. Bonneterre, V. Motto-Ros and L. Duponchel, Anal. Chem., 2024, 96, 7038–7046 CrossRef CAS PubMed.
- P. Virtanen, R. Gommers, T. E. Oliphant, M. Haberland, T. Reddy, D. Cournapeau, E. Burovski, P. Peterson, W. Weckesser and J. Bright, Nat. Methods, 2020, 17, 261–272 CrossRef CAS PubMed.
- J. Coursey, D. Schwab, J. Tsai and R. Dragoset, Physical Measurement Laboratory, 2017, 1–10 Search PubMed.
- M. C. Lomax-Vogt, F. Liu and J. W. Olesik, Spectrochim. Acta, Part B, 2021, 179, 106098 CrossRef CAS.
- L. Hendriks, A. Gundlach-Graham, B. Hattendorf and D. Günther, J. Anal. At. Spectrom., 2017, 32, 548–561 RSC.
- L. Hendriks, V. M. Kissling, T. Buerki-Thurnherr and D. M. Mitrano, Environ. Sci.: Nano, 2023, 10, 3439–3449 RSC.
- J. Gattacceca, F. M. McCubbin, J. Grossman, A. Bouvier, N. L. Chabot, M. D'Orazio, C. Goodrich, A. Greshake, J. Gross, M. Komatsu, B. Miao and D. Schrader, Meteorit. Planet. Sci., 2022, 57, 2102–2105 CrossRef CAS.
- M. R. Lee and P. A. Bland, Geochim. Cosmochim. Acta, 2004, 68, 893–916 CrossRef CAS.
Footnotes |
| † Electronic supplementary information (ESI) available: This manuscript has been authored in part by UT-Battelle, LLC, under contract DE-AC05-00OR22725 with the US Department of Energy (DOE). The US government retains and the publisher, by accepting the article for publication, acknowledges that the US government retains a nonexclusive, paid-up, irrevocable, worldwide license to publish or reproduce the published form of this manuscript, or allow others to do so, for US government purposes. DOE will provide public access to these results of federally sponsored research in accordance with the DOE Public Access Plan (http://energy.gov/downloads/doe-public-access-plan). See DOI: https://doi.org/10.1039/d4ja00331d |
| ‡ These authors contributed equally to this work. |
| This journal is © The Royal Society of Chemistry 2025 |