 Open Access Article
An isotope dilution approach for validating the output of mercury gas generators for mercury pollution monitoring†
Sophie Page a,
Philip J. H. Dunn
 *a,
Panayot Petrov‡
 a,
Sreekanth Vijayakumaran Nair
 bc,
Igor Živković
 bc,
Milena Horvat
 bc,
Warren T. Corns
 d and
Heidi Goenaga-Infante
 *a
*a
aNational Measurement Laboratory, LGC, Queens Road, Teddington, Middlesex TW11 0LY, UK. E-mail: Heidi.Goenaga-Infante@lgcgroup.com; Philip.Dunn@lgcgroup.com
bDepartment of Environmental Sciences, Jožef Stefan Institute, Jamova Cesta 39, 1000 Ljubljana, Slovenia
cJožef Stefan International Postgraduate School, Jamova Cesta 39, 1000 Ljubljana, Slovenia
dP S Analytical Ltd, Arthur House, Crayfields Industrial Estate, Main Road, Orpington, Kent, BR5 3HP, UK
First published on 4th February 2025
Abstract
Mercury (Hg) gas generators produce a continuous flow of Hg vapour and are used to calibrate detectors used in the field for Hg pollution monitoring. Typically, Hg gas generators are certified using empirical equations such as Dumarey or Huber which lead to results that can differ considerably and lack traceability. This work presents, for the first time, a novel online gas phase isotope dilution (IDMS) method for the accurate quantification of the output of Hg gas generators achieving SI traceability via NIST SRM 3133 certified reference material. To achieve this, a 199Hg isotopically enriched standard was vapourised using a cold vapour generator and mixed with the gaseous output of a Hg gas generator. The 202Hg/199Hg ratio of the gaseous blend was then measured by ICP-MS, and the generator output calculated using a single IDMS equation adapted for gas mixtures. The efficiency of the 199Hg vapour generation is a key contributing parameter to the measurement uncertainty and was therefore quantified using a 197Hg radiotracer and found to be greater than 99.5%. The feasibility of this method for validating the output of Hg gas generators was demonstrated by quantifying the output of one elemental Hg at an Hg flow of approximately 32 ng L−1 and one oxidised Hg gas generator at an Hg flow of approximately 4 ng L−1. In both cases, a relative expanded uncertainty (k = 2) of less than 9% was obtained. This method represents an important step towards improving the traceability, and therefore comparability of measurements for gaseous Hg which are essential for global environmental monitoring and reduction of atmospheric Hg pollution.
1. Introduction
Mercury (Hg) is a pollutant that is highly toxic to human, animal, and environmental health. It has been shown to damage the nervous, digestive, and immune systems, and cause developmental issues in foetuses and young children.1–3 Atmospheric Hg is of specific interest because airborne elemental Hg is readily carried around the globe by air currents and can be deposited into soils, waters, and plants where it can enter the food chain or be re-volatilised back into the atmosphere. Whilst Hg can enter the environment naturally from volcanic activity, geothermal springs, and cinnabar ore deposits, anthropogenic Hg sources are of particular concern because they contribute over 50% of current atmospheric Hg emissions.4 Anthropogenic sources include coal combustion, waste incineration, mining, and industrial uses such as cement production and smelting. Coal combustion and artisanal gold mining are the largest contributors, making up 60% of anthropogenic emissions.4 When coal is burned, Hg is released as gaseous elemental Hg (Hg0). In the flue, Hg0 can react with chlorine to from mercuric chloride (HgCl2) and other oxidised Hg species which are more soluble than Hg0 and highly toxic. Mercury can also attach to particulate matter in the flue gas producing particulate-bound Hg (PBM), however this represents less than 5% of total atmospheric Hg emissions and over 99% of it is removed from flue gases using electrostatic precipitators and fabric filters.5 Therefore, the two most prominent species of Hg in coal power plant stack gases are Hg0 and volatile HgII compounds.Due to the known link between Hg exposure and toxicity in humans,1–3 and notable case studies such as Minamata Bay, European legislation such as the Industrial Emissions Directive (IED) 2010/75/EU,6 the Air Quality Directive (AQD) 2004/107/EC,7 and the Waste Incineration Directive (WID) 2000/76/EC,8 set maximum limits for gaseous Hg emissions and require combustion and waste incineration plants to monitor their total gaseous Hg emissions. Accurate and traceable determinations of both elemental and oxidised gaseous Hg are therefore vital in both understanding and monitoring the concentration of Hg in the environment and the contributions from emission sources. This knowledge is essential to protecting human health, enforcing regulatory limits, and ensuring legislation remains sufficient to control and reduce atmospheric Hg levels.
Gaseous Hg monitoring typically utilises atomic detectors such as atomic absorption spectroscopy (AAS), atomic fluorescence spectrometry (AFS), and atomic emissions spectrometry (AES). There are several manual and automatic calibration approaches for Hg detectors where set points are created by introducing gases of known Hg concentration. The most common calibration techniques use either a bell jar or a Hg gas generator. The bell jar method utilises a glass vessel containing a small droplet of Hg0. The contents are exposed to the atmosphere via a tube to allow a Hg-saturated atmosphere to form inside the vessel.9,10 For calibration purposes, a known volume of Hg vapour can be extracted with a syringe via a septum. The concentration of the Hg vapour is calculated by theoretical calculations such as the Dumarey11 or Huber12 equations that are based on temperature, pressure, and gas flow rates. However, results from these equations have been shown to disagree by more than 7% at 20 °C.13
Mercury gas generators produce a continuous stream of Hg vapour that can be used to calibrate Hg measurement systems. Depending on the type of generator, the concentration of Hg in gas is either constant or dynamic and can contain Hg0 and/or HgII. Typically, the output of Hg0 generators is calculated by empirical equations such as the Dumarey or Huber equation, which lack traceability; however comparable measurements for gaseous Hg are required globally to understand, monitor, and reduce atmospheric Hg levels.
Isotope dilution mass spectrometry (IDMS) is a high accuracy and low uncertainty quantification method that can provide SI-traceability by using an isotopically enriched standard. It therefore offers a potential tool for traceable quantification and validation of Hg gas generators. Quétel et al. (2014) developed a low uncertainty IDMS method traceable to ERM-AE640 – a certified 202Hg isotopically enriched standard – for quantifying Hg mass concentrations in air.13 Mercury vapour samples were trapped in the liquid phase and mixed with the liquid 202Hg isotopically enriched standard. However, this method is based on collecting only millilitre samples of air for which Hg concentrations are orders of magnitude lower than the μg m−3 Hg mass flows of many Hg gas generators, thus making it difficult to use to validate output of higher mass flows from Hg gas generators.
A high accuracy and low uncertainty method able to quantify and validate the output of Hg gas generators that negates the need for Hg trapping, is SI-traceable, and has an expanded uncertainty of less than 10% is therefore, increasingly needed. It is also desirable that the method uses a species-independent detector to avoid the need for separate thermal converters or pyrolysis for which the efficiency and uncertainty are not always known.
This work describes, for the first time, methodology based on the use of IDMS with ICP-MS for the traceable and direct quantification of gaseous Hg from Hg0 and HgII gas generators. This is achieved by mixing the output of a Hg gas generator with a cold vapour from an 199Hg-enriched standard. The 202Hg/199Hg ratio of the gaseous blend was measured by ICP-MS, and the generator output calculated using a single IDMS equation adapted for gas mixtures. The efficiency of 199Hg vapour generation was determined using a 197Hg radiotracer. The method was applied to quantification of the output of one elemental Hg and one oxidised Hg gas generator. A full uncertainty budget and key contributing factors to the overall measurement uncertainty are described.
2. Experimental
2.1. Materials
All reagents were prepared in 10% v/v hydrochloric acid prepared with concentrated 32–35% assay UpA grade hydrochloric acid (Romil Ltd, Waterbeach, Cambridge, UK) and 18.2 MΩ cm ultra-high purity water (Elga, Veolia, High Wycombe). All liquid standards used in this work were introduced to the instrumental set-up as vapours obtained by reduction. This was performed using 4% (w/v) tin chloride dihydrate (low in Hg, suitable for AAS, Thermo Scientific Chemicals, Belgium) in 10% v/v HCl in a continuous cold vapour generation system (CV, Cetac HGX-200). A working solution of 199Hg standard ORNL SAMD/116 (Oak Ridge National Laboratory, Oak Ridge, Tennessee) was prepared in 10% v/v HCl and used as the IDMS isotopically enriched standard. The Hg mass fraction of the isotopically enriched standard was determined by reverse IDMS measurements using NIST SRM 3133 (National Institute of Standards and Technology, Gaithersburg, Maryland) as the natural Hg. Enriched 199Hg solutions of variable concentration between 0.1 and 10 ng g−1 were used. NIST SRM 3133 was also used for mass bias correction in the gas phase IDMS method.2.2. Instrumental set-up
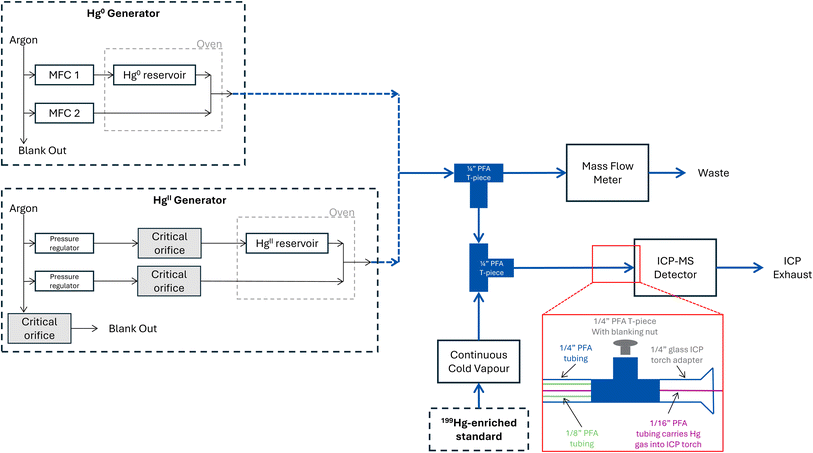
Two different Hg gas generators were used. Firstly, a 10.534 dynamic Hg0 generator (P S Analytical, Orpington, Kent, UK), utilising a temperature-controlled Hg0 reservoir across which a low flow of gas is passed. The flow of gas takes up an amount of Hg0 that can be estimated empirically using, for example, the Dumarey equation.11 The gas is then further dynamically diluted by merging it with an additional gas with controlled flow. In this way, the Hg0 gas generator follows the saturation method as described by ISO 6145-9:2009.14 The second Hg generator was a 10.532 critical orifice HgII generator with a fixed output (P S Analytical, Orpington, Kent, UK). This generator uses a similar principle and passes a controlled low of gas across a saturated HgCl2 reservoir that is again diluted; however, the flow rates are fixed using critical orifices, rather than being mass flow controlled. Simple schematics of both Hg gas generators can be found in Fig. 1.Fig. 1 also shows the set-up used for the gas phase IDMS method to determine the Hg output of a Hg gas generator using an Agilent 8800 ICP-MS (Agilent Technologies, Tokyo, Japan) operated by Agilent MassHunter software (Version C.01.06). A Cetac HGX-200 CV system was used to vaporise the liquid 199Hg isotopically enriched standard using the ICP-MS peristaltic pump to control the uptake rate of the liquid standard. An Ohaus GA200D balance (Parsippany, New Jersey, USA) was used to record the uptake rate of the pump as a weight loss function. The balance was calibrated with a weight set traceable to the kilogram (National Physical Laboratory, Teddington, UK), thus providing SI-traceability. The gaseous output of the generator was mixed with a vapourised 199Hg isotopically enriched standard in PFA tubing. Typical operating flow rates for many Hg gas generators exceed 10 L min−1. However, to maintain the ICP-MS plasma, flow rates entering the torch cannot exceed 1.2 L min−1. Therefore, a portion of the generator output was vented to achieve a combined generator and CV flow rate between 1.0 and 1.2 L min−1. For each tested generator and generator flow setting, the tubing lengths were adjusted until the desired flows were achieved.
Before measurement, the Hg gas generator was connected to a nitrogen gas supply and set to the operating conditions to be tested and left to stabilise for three to seven days. This allowed the tubing to be saturated with Hg and thereby minimise drift. Once stabilised, the generator gas supply was switched to argon for compatibility with the ICP-MS. All samples were measured ten times, and the data averaged. All sequences contained at least three blanks, the generator alone, the generator/isotopically enriched standard blend, and NIST SRM 3133 via the CV generator for mass bias correction. The blend raw 199Hg and 202Hg counts were corrected for blank and mass bias, then ratioed and averaged to give the 202Hg/199Hg blend ratio for use in eqn (1). The uncertainty of the 202Hg/199Hg blend was calculated as the standard deviation of the ten 202Hg/199Hg ratios of the gas blend (corrected for mass bias and blank) as measured by the ICP-MS. The ICP-MS parameters used for this work are outlined in Table 1.
| Parameter | Setting |
|---|---|
| RF power | 1450 |
| Make-up gas (for CV generator) | 0.95 L min−1 |
| Sample/skimmer cone | Ni/Ni |
| Reaction gas | No gas |
| Monitored mass shift | No mass shift |
| Monitored masses | 199, 201, 202 |
| Data acquisition mode | Time resolved analysis |
| Sampling period | 0.3 s |
| Acquisition time | 60 s |
| Integration time | 0.1 s |
2.3. Calculation of generator mass flow
To calculate the mass flow of natural isotopic composition Hg from a Hg gas generator, qm(Hgn), in μg m−3 (this is the average Hg concentration in the gaseous output of the generator over time of analysis), eqn (1) was used, where qm(Hge) is the mass flow in g min−1 of the 199Hg isotopically enriched standard; qv(Hgn) is the volumetric flow of natural Hg from the generator in sL min−1 (standard L min−1, i.e. corrected to 20 °C and 100 kPa) entering the ICP-MS; Ar(Hgn) and Ar(Hge) are the atomic weights of the generator Hg (Hgn) and the 199Hg enriched standard (Hge), respectively; x(199Hge) and x(202Hgn) are the isotope amount fractions of 199Hg in the enriched Hg standard and of 202Hg in the generator output, respectively; Rb(202Hg/199Hg) is the measured isotope ratio in the generator/enriched standard blend; Re(202Hg/199Hg) is the measured isotope ratio in the enriched 199Hg standard; and Rn(199Hg/202Hg) is the measured isotope ratio in the natural Hg output from the generator. All measured isotope ratios were corrected for mass bias at the beginning of each measurement session by introducing NIST SRM 3133 via the CV generator and using argon gas as a blank in place of the generator.
 | (1) |
The atomic weight and isotope amount fraction of the 199Hg-enriched standard were taken from the supplier certificate. The isotope amount fractions and atomic weight of Hg in the generator output were assumed to be those for natural Hg according to IUPAC (International Union of Pure and Applied Chemistry).15 The Hg isotopic ratios for the enriched (Re) and natural (Rn) sources were calculated from the isotope amount fractions, and all other parameters in eqn (1) were measured.
The mass flow of the 199Hg isotopically enriched standard, qm(Hge), in pg min−1 was calculated from eqn (2) where w(Hge) is the mass fraction of total Hg in the working 199Hg-enriched standard solution in pg g−1, qm(pump) is the uptake rate of the peristaltic pump in g min−1, and E(CV) is the CV generator efficiency which was determined by the Jožef Stefan Institute using a 197Hg radiotracer (described below). The uptake rate of the peristaltic pump was determined by measuring the weight lost from the 199Hg-enriched standard solution vial during the method at 10 seconds intervals and averaging over 10 minutes.
| qm(Hge) = qm(pump) × w(Hge) × E(CV) | (2) |
The volumetric flow from the generator that entered the ICP-MS, qv(Hgn), was determined either directly or indirectly. The direct method used an ADM G6691E mass flow meter to measure the flow rate of the generator flow after splitting and before it merged with the gaseous 199Hg-enriched standard. However, this measurement could not occur while the ICP-MS torch was lit as it required disconnecting tubing after the first T-piece in Fig. 1. The indirect method involved measurement of the flow rate at the output of the generator prior to the IDMS method using the Mesalabs Flex Cal-H flow meter, and then subtracting the flow rate of the waste generator gas measured during the ICP-MS acquisition. This provided real time data on the volumetric flow but was subject to higher uncertainties that increased considerably with the generator flow rate.
2.4. Cold vapour efficiency
Efficiency of the CV generator used to introduce the 199Hg-enriched standard during gas-phase IDMS, E(CV), was determined using a 197Hg radiotracer of known activity to allow detection of Hg within the CV waste. The 197Hg radiotracer was produced via a neutron capture reaction by irradiating the ampoule containing enriched 196Hg in 2% v/v HNO3 with a high neutron flux (1013 cm−2 s−1) for 12 h in the central channel of the TRIGA Mark II research reactor (Jožef Stefan Institute, Ljubljana, Slovenia). Working standards were prepared by dilution of an irradiated 197HgII stock solution to an approximate concentration of 5 ng mL−1 in 5% v/v HNO3 to ensure the activity in the collected waste would be detected. Precise concentrations of the 197Hg in the working standards were then determined by CV-atomic absorption spectroscopy (CV-AAS) using NIST SRM 3133 as a calibrant. The same CV conditions were applied as for gas-phase IDMS as noted above, except for the use of nitrogen gas instead of argon. Once the 197HgII working standard solutions had passed through the CV generator, aliquots of the waste as well as the remaining working standard were transferred to glass vials and the activity of the waste measured relative to the working standards using a CANBERRA high-purity germanium (HPGe) well detector (Mirion Technologies (Canberra) Inc., Atlanta, Georgia, USA). All activity peak areas were corrected for radioactive decay since the irradiation and were used to calculate the percentage losses of 197Hg as described in Gačnik et al. (2022).162.5. Uncertainty estimation
Measurement uncertainty associated with each determination of Hg generator output was estimated for each run using the Kragten method,17 and an uncertainty budget was created. The contribution of each parameter in eqn (1) to the overall uncertainty was calculated using either uncertainties from certificates or measured uncertainties.3. Results & discussion
3.1. Measured IDMS parameters
The method was applied to two different Hg gas generators from PS Analytical (Orpington, Kent, UK): a Hg0 generator of variable output (PSA 10.534) and a fixed output HgII generator (PSA 10.532). During testing the mean measured 202Hg/199Hg ratio in the gaseous blend was 0.97 with a typical relative expanded uncertainty (k = 2) of 0.4%. The uptake rate of the 199Hg-enriched standard varied between 0.25 and 0.28 g min−1 an overall expanded uncertainty (k = 2) of 0.03 g min−1. The mass fraction of total Hg in the working 199Hg-enriched standard varied between 0.51 and 4.2 ng g−1 with a mean relative expanded uncertainty (k = 2) of 2%.3.2. Cold vapour efficiency
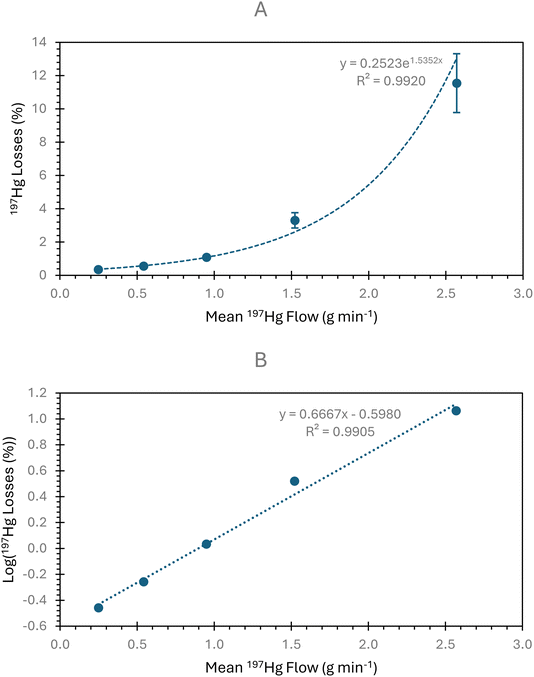
The CV efficiency was determined as a ratio of 197Hg losses after vapour generation at the flow rates used in the IDMS method. Higher flow rates were also tested to examine how the CV generator efficiency changes and determine the optimal flow rates for maximum efficiency. The results from the CV generator efficiency experiments are outlined in Fig. 2. The percentage losses of 197Hg increased exponentially with the flow of the Hg sample and reductant with the R2 value for the loglinear plot being close to unity (Fig. 2B). Therefore, low sample and reductant flow rates achieve high CV generation efficiency. The mean 197Hg loss at the 0.245 g min−1 flow rates used in the IDMS method were 0.35%, giving a mean efficiency of 99.65% with an expanded uncertainty (k = 2) of 0.05%.3.3. Mass flow of the 199Hg-enriched standard, qm(Hge)
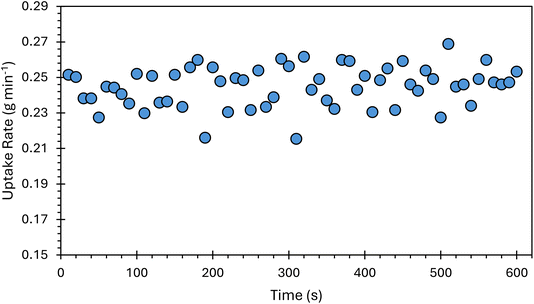
The CV generator efficiency and associated uncertainty were taken from the efficiency measurements most closely matching the use of the instrument system for online IDMS. Therefore, the mean and standard deviation at the 0.245 g min−1 flow rates were used. The uncertainty of the peristaltic pump uptake rate was the standard deviation of the weight loss measurements in g min−1 over a 10 minutes period (Fig. 3) and was on average 1.4% (k = 1). The uncertainty of the mass fraction of the 199Hg-enriched standard was determined by combining the uncertainty of the reverse IDMS result used to calculate the concentration of the 199Hg-enriched standard stock solution and the uncertainty from serial dilutions calculated using replicate weighing and balance uncertainty. The mean relative uncertainty of 199Hg-enriched standard mass fraction was 1.0% (k = 1). The uncertainty in the mass flow of the 199Hg-enriched standard was consistently one of the two highest uncertainty contributors in the IDMS method (Fig. 5). Given eqn (2), the contribution of uncertainty in qm(Hge) to the uncertainty in the IDMS result might be further reduced through the use of a pump capable of a more stable delivery of the 199Hg-enriched standard solution to the CV system.3.4. Gas-phase IDMS method performance
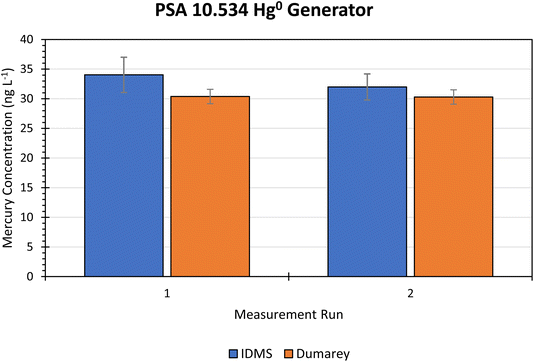 | ||
| Fig. 4 Bar chart comparing the measured mass flow of Hg from the PSA 10.534 generator determined using the new gas phase IDMS method, and the theoretical Hg mass flow based on the Dumarey equation using the generator temperature, pressure, and flow settings. The vertical error bars for the IDMS bars are the expanded measurement uncertainties (k = 2). The vertical error bars for the Dumarey bars are the indicative expanded uncertainty (k = 2) from Dumarey et al. (2010).11 | ||
| Generator | Reservoir flow (mL min−1) | Dilution flow (L min−1) | Temperature (°C) | Pressure (hPa) | Theoretical Hg output (μg m−3) | Run | Measured Hg mass flow (μg m−3) | Uc (k = 2) (%) |
|---|---|---|---|---|---|---|---|---|
| PSA 10.534 Hg0 | 1 | 1.5 | 35.2 | 1027.1 | 30.38 | 1 | 34.03 | 8.7 |
| 35.1 | 1021.6 | 30.30 | 2 | 31.99 | 6.9 |
In the field, this generator is typically used at diluent flow rates of between 10 and 20 L min−1. However, this generator was tested using the indirect volumetric flow measurement technique with the Mesalabs Flex Cal-H flow meter which has a high uncertainty at high flow rates. The uncertainty of the volumetric flow, u(qv(Hgn)), was calculated as the sum of the squares of the standard deviations of the total and vent generator flows. The volumetric flow was consistently the highest contributor to uncertainty in the IDMS result for the PSA 10.534 generator (Fig. 5) and the magnitude of the uncertainty increased with the generator flow rate. Increasing the generator flow rate increased the overall expanded IDMS measurement uncertainty from 6.9% to 8.7% (k = 2) at 1.5 L min−1 (Table 2 and Fig. 5), to 17.8% (k = 2) at 10 L min−1. At the higher flow rate, 94% of overall uncertainty in the IDMS result was from the determination of the flow rate itself. The relative uncertainty (k = 2) of the volumetric flow at 10 L min−1 was 20%, but only 5% at 1.5 L min−1.
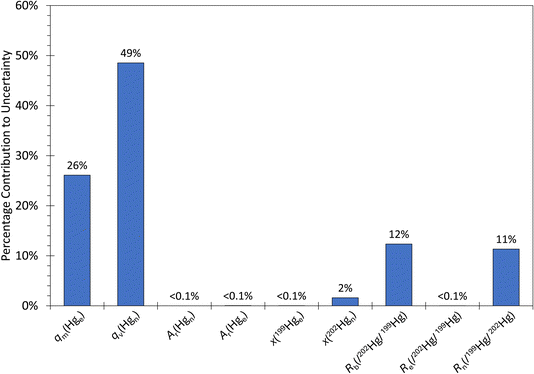 | ||
| Fig. 5 Uncertainty budget for the PSA 10.534 IDMS run two calculated using the standard uncertainties of each parameter in the gas phase IDMS equation. The abbreviations on the x-axis correspond with those used in eqn (1). The major contributions are qm(Hge) – the mass flow of the 199Hg isotopically enriched standard – and qv(Hgn) – the volumetric flow of natural Hg from the generator. This uncertainty budget is also typical of the PSA 10.532 generator. | ||
For this method to be applicable to Hg gas generators with the higher flow rates of 10 to 20 L min−1 with reasonable uncertainties, there are two options. Firstly, the direct volumetric flow measurement method could be applied such that the measurement of lower flow rates is required leading to reduced measurement uncertainties. Alternatively, to continue applying the direct method, a flow meter capable of measuring the necessary flow rates with low uncertainty is required. To bring the overall IDMS uncertainty down to the level achieved with the direct flow measurement technique, any lower uncertainty flow meter would need to achieve a volumetric flow uncertainty (k = 1) of at most 3% in the 10 to 20 L min−1 range.
| Generator | Run | Measured Hg mass flow (μg m−3) | Uc (k = 2) (%) | Mean Hg mass flow (μg m−3) | Standard deviation | Overall Uc (k = 2) (%) |
|---|---|---|---|---|---|---|
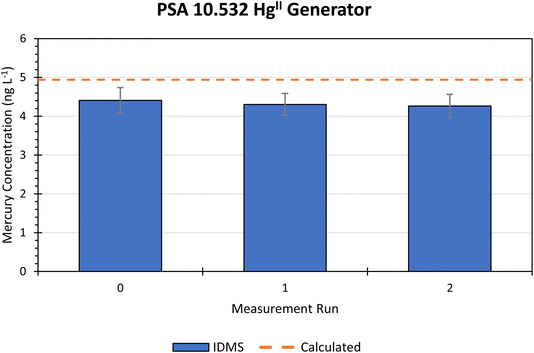
| PSA 10.532 critical orifice HgII | 1 | 4.41 | 7.5 | 4.32 | 0.08 | 7.9 |
| 2 | 4.29 | 6.5 | ||||
| 3 | 4.26 | 7.0 |
The expected mass flow from the generator can be calculated using the saturated vapour pressure of HgCl2 at the oven temperature setpoint, and the reservoir and dilution flowrates.18 The expected Hg mass flow was estimated by calculation as 5.12 μg m−3. The manufacturer has also directly measured the mass flow of the generator as 4.94 ± 0.2 μg m−3 using thermal conversion of HgII to Hg0 followed by cold vapour-AFS using the Dumarey equation calibration from a bell jar. This measurement did not account for the efficiency of thermal conversion. The IDMS result of 4.32 μg m−3 was 84.5% of the calculated estimate and 87.6% of the manufacturer's measured output. A re-evaluation of the theoretical output by accounting for flow suppression imparted on the HgII reservoir may reduce the expected output. If the reservoir flow is supressed by around 10% the IDMS and expected values should be similar.
The critical orifice HgII generator required substantial stabilisation time (Section 2.2) prior to measurement to minimise drift in Hg mass flow resulting from adsorption to tubing and fittings between the generator reservoir and ICP-MS torch.19 In this way, it was expected that saturation of adsorption sites could be achieved. Nevertheless, the possibility of a minimal loss in Hg within the gas stream remained and could also account for some of the difference between theoretical estimated generator output and the IDMS results.
The direct flow measurement technique significantly reduced the expanded uncertainty of the IDMS result for the PSA 10.532 generator. However, the direct measurement is not possible while the ICP-MS plasma is ignited, and therefore the measured flow rate may not reflect the true flow rate during the IDMS measurement. In addition, the ADM flow meter is not operational at flow rates more than 1 L min−1 and cannot therefore be used to measure the generator output or waste flows. For future applications of this method to Hg gas generators at higher flow rates within their suggested operating parameters of 10 to 20 L min−1 and achieving a reasonable uncertainty, either assumptions are needed that the ADM flow meter reading is comparable to the flow rate during measurement when the ICP-MS torch is lit, or a high level flow meter with a lower uncertainty is required.
3.5. Wider applications of the developed methodology
The method outlined here could easily be applied to the IDMS quantification of the output of other Hg generators where the isotopically enriched standard cannot be added directly to the sample. Examples include oxidative Hg gas generators, liquid evaporative generators and reduction generators that reduce Hg salts to Hg0. In addition, this method could be used with other isotopically enriched standard introduction systems that vaporise a liquid standard instead of a cold vapour generator and could therefore be used in laboratories where a cold vapour generator is not available.4. Conclusions
A gas-phase IDMS method has been implemented for dry-based Hg gas generators that produced results within 12% of the theoretical Hg0 generator output predicted by the Dumarey equation but crucially provided results that were fully traceable to the SI. The method also produced repeatable results with a low combined expanded uncertainty of 7.9% (k = 2) for the fixed flow critical orifice HgII generator at a mercury mass flow of between 4 and 5 μg m−3. The IDMS results did not agree with the estimated theoretical output provided by the manufacturer within expanded uncertainty; however this is likely be due to an underestimation of the generator mass flow, or losses of oxidised Hg in the IDMS set-up. To the best of our knowledge, this is the first method that can provide traceability to the SI for HgII generators used during in situ measurements of Hg concentrations.Data availability
The data supporting this article have been included as part of the ESI.†Author contributions
SP: conceptualisation, methodology, analysis, data processing, first draft; PJHD: methodology, supervision, writing-/review and editing; PP: conceptualisation, methodology, analysis, supervision, writing-/review and editing, funding acquisition; SVN: methodology, analysis, writing-/review and editing; IZ: methodology, analysis, supervision, writing-/review and editing; MH: methodology, resources, supervision, writing/review and editing, funding acquisition; WC: methodology, resources, writing/review and editing, funding acquisition; HGI: conceptualisation, methodology, resources, supervision, writing/review and editing, funding acquisition.Conflicts of interest
There are no conflicts to declare.Acknowledgements
The work described in this paper was performed at the UK National Measurement Laboratory at LGC Ltd. This work was co-funded by the European Union's Horizon 2022 research and innovation programme as part of the European Metrology Programme for Innovation and Research (EMPIR) project 19NRM03 SI-Hg and the UK government Department for Science, Innovation, and Technology (DIST) National Measurement System (NMS) portfolio of programmes. This work has also received financial support from the Slovenian Research and Innovation Agency (ARIS) through programme P1-0143. The authors thank to the Metrology Institute of the Republic of Slovenia (MIRS) under contract no. C3212-10-000071 (6401-5/2009/27) for activities and obligations performed as a Designated Institute.References
- H. A. Roman, T. L. Walsh and B. A. Coull, et al., Evaluation of the Cardiovascular Effects of Methylmercury Exposures: Current Evidence Supports Development of a Dose–Response Function for Regulatory Benefits Analysis, Environ. Health Perspect., 2011, 119(5), 607–614, DOI:10.1289/ehp.1003012.
- D. A. Axelrad, D. C. Bellinger, L. M. Ryan and T. J. Woodruff, Dose–Response Relationship of Prenatal Mercury Exposure and IQ: An Integrative Analysis of Epidemiologic Data, Environ. Health Perspect., 2007, 115(4), 609–615, DOI:10.1289/ehp.9303.
- A. H. Stern and A. E. Smith, An assessment of the cord blood:maternal blood methylmercury ratio: implications for risk assessment, Environ. Health Perspect., 2003, 111(12), 1465–1470, DOI:10.1289/ehp.6187.
- United National Environment Programme, Global Mercury Assessment 2018, 2019 Search PubMed.
- L. Zhang, S. Wang and Q. Wu, et al., Mercury transformation and speciation in flue gases from anthropogenic emission sources: a critical review, Atmos. Chem. Phys., 2016, 16(4), 2417–2433, DOI:10.5194/acp-16-2417-2016.
- European Parliament, Council of the European Union, Directive 2010/75/EU on industrial emissions (integrated pollution prevention and control), Official Journal of the European Union, 2010, L334/17, http://data.europa.eu/eli/dir/2010/75/oj.
- European Parliament, Council of the European Union, Directive 2004/107/EC relating to arsenic, cadmium, mercury, nickel and polycyclic aromatic hydrocarbons in ambient air, Official Journal of the European Union, 2004, L23/3, https://eur-lex.europa.eu/eli/dir/2004/107/oj.
- European Parliament, Council of the European Union, Directive 2000/76/EC on the incineration of waste, Official Journal of the European Union, 2000, L332/91, https://eur-lex.europa.eu/legal-content/en/ALL/?uri=CELEX%3A32000L0076.
- R. J. C. Brown, A. S. Brown, W. T. Corns and P. B. Stockwell, Accurate Calibration of Mercury Vapour Indicators for Occupational Exposure Measurements Using a Dynamic Mercury Vapour Generator, Instrum. Sci. Technol., 2008, 36(6), 611–622, DOI:10.1080/10739140802448309.
- A. S. Brown, R. J. C. Brown, W. T. Corns and P. B. Stockwell, Establishing SI traceability for measurements of mercury vapour, Analyst, 2008, 133(7), 946–953, 10.1039/B803724H.
- R. Dumarey, R. J. C. Brown, W. T. Corns, A. S. Brown and P. B. Stockwell, Elemental mercury vapour in air: the origins and validation of the ‘Dumarey equation’ describing the mass concentration at saturation, Accredit. Qual. Assur., 2010, 15(7), 409–414, DOI:10.1007/s00769-010-0645-1.
- M. L. Huber, A. Laesecke and D. G. Friend, Correlation for the Vapor Pressure of Mercury, Ind. Eng. Chem. Res., 2006, 45(21), 7351–7361, DOI:10.1021/ie060560s.
- C. R. Quétel, M. Zampella and R. J. C. Brown, et al., International System of Units Traceable Results of Hg Mass Concentration at Saturation in Air from a Newly Developed Measurement Procedure, Anal. Chem., 2014, 86(15), 7819–7827, DOI:10.1021/ac5018875.
- ISO 6145-9:2009, Gas analysis—preparation of calibration gas mixtures using dynamic volumetric methods—part 9: saturation method, 2009, published online.
- J. Meija, T. B. Coplen and M. Berglund, et al., Isotopic compositions of the elements 2013 (IUPAC technical report), Pure Appl. Chem., 2016, 88(3), 293–306, DOI:10.1515/pac-2015-0503.
- J. Gačnik, I. Živković and G. S. Ribeiro, et al., Calibration Approach for Gaseous Oxidized Mercury Based on Nonthermal Plasma Oxidation of Elemental Mercury, Anal. Chem., 2022, 94(23), 8234–8240, DOI:10.1021/acs.analchem.2c00260.
- J. Kragten, Tutorial review. Calculating standard deviations and confidence intervals with a universally applicable spreadsheet technique, Analyst, 1994, 119(10), 2161–2165, 10.1039/AN9941902161.
- L. Bernard, K. O. Awitor and J. P. Badaud, et al., Determination of the vapor pressure of HgCl2 by the Knudsen effusion method, J. Phys. III, 1997, 7(2), 311–319, DOI:10.1051/jp3:1997124.
- J. Gačnik, I. Živković, S. Ribeiro Guevara, R. Jaćimović, J. Kotnik and M. Horvat, Validating an Evaporative Calibrator for Gaseous Oxidized Mercury, Sensors, 2021, 21(7), 2501, DOI:10.3390/s21072501.
Footnotes |
| † Electronic supplementary information (ESI) available. See DOI: https://doi.org/10.1039/d4ja00373j |
| ‡ Current address: National Physical Laboratory, Hampton Road, Teddington, Middlesex, TW11 0LW, UK. |
| This journal is © The Royal Society of Chemistry 2025 |



![[thin space (1/6-em)]](https://www.rsc.org/images/entities/char_2009.gif) 197Hg losses again against the sample flow rate.
197Hg losses again against the sample flow rate.