Dual-drive acoustic micromixer for rapid nucleation and ultrafast growth of perovskite nanoparticles†
Zhifang
Liu
a,
Yuwen
Lu
a,
Wei
Tan
ab and
Guorui
Zhu
 *ab
*ab
aSchool of Chemical Engineering and Technology, Tianjin University, Tianjin, 300354, China. E-mail: zhuguorui@tju.edu.cn
bZhejiang Institute of Tianjin University, Ningbo, Zhejiang 315201, China
First published on 30th October 2024
Abstract
All-inorganic cesium lead halide perovskites have garnered significant attention owing to their favorable optical properties. Microfluidics-based acoustic mixers are capable of achieving rapid nucleation and ultrafast growth kinetics. Nevertheless, conventional acoustic mixers rely on the response of microstructures to the acoustic field for mixing fluids, the majority of these disturbances occur in the central region of the channel, with minimal impact on the fluid within the side walls. This paper proposes a novel acoustic mixer that combines the effects of sharp corners and bubbles in response to the acoustic field, thereby producing effective disturbance of the fluid throughout the channel. The combined effect enables the micromixer to achieve complete mixing at different inlet flow ratios with mixing times as low as 5 ms. The superiority of acoustic mixers in controlling the nanocrystal formation stage was further validated through the synthesis of chalcogenide nanocrystals using the LARP method. The millisecond mixing time facilitated the rapid formation of nanocrystals and their subsequent rapid growth. The results demonstrate that the green luminescence intensity at 520 nm of the samples synthesized using the acoustic micromixer is 118% higher than that of the samples synthesized using an intermittent reactor. The novel micromixer broadens the range of applications and offers a promising avenue for the large-scale continuous synthesis of high-quality lead-halide perovskite nanocrystals (NCs).
1. Introduction
All-inorganic cesium lead halide perovskite (CsPbX3, X = Cl, Br, I) nanocrystals (NCs) have great potential for applications in many fields due to their low toxicity, high fluorescence efficiency, narrow and tunable emission spectra, and large light absorption coefficients.1–5 Effective control of their size and uniformity during synthesis is crucial to take advantage of their full potential.6,7 The current most popular method for the synthesis of all-inorganic perovskite nanocrystals is the hot injection method.8 In order to avoid the disadvantages of high reaction temperatures and toxic solvents of the hot injection method, researchers proposed the ligand assisted reprecipitation (LARP) method.9 The perovskite precursors (i.e., CsX, PbX2) were transferred from a good solvent (i.e., DMSO, DMF) to an antisolvent (i.e., toluene, IPA10) at room temperature. The nucleation and subsequent growth of CsPbX3 nanocrystals is triggered by supersaturation due to polarity difference. Therefore, local supersaturation significantly affects the nucleation and growth rate of CsPbX3 NCs;11,12 controlling the effective and rapid mixing of the good and anti-solvents, which in turn controls the local supersaturation, is crucial in the crystallization process. However, most studies on the synthesis of CsPbX3 NCs using LARP have employed conventional magnetic stirring, which invariably leads to (i) a polydisperse nanoparticle distribution and (ii) unwanted by-products.13–15Recently, microfluidics has demonstrated considerable potential in the synthesis of nanomaterials, due to its high mixing efficiency and precise control of the reaction process.16–23 The transformation of chalcogenide nanocrystals of varying sizes can be achieved by simply adjusting the inlet flow rate or reaction conditions.20,24–27 Concurrently, during the nucleation and growth of chalcogenides, microfluidics also facilitates the directional attachment of monomers.28 Although great progress has been made, two critical shortcomings limit the applicability of microreactors in material synthesis. First, some microreactors synthesize nanocrystals through cooling crystallization with temperature differences, necessitating temperature control of the reactor (oil baths, heated platforms, etc.). However, this approach presents a challenge in terms of device complexity.26,28–31 The LARP method, conducted at room temperature, employs rapid mixing of good and anti-solvents to facilitate the nucleation process, which necessitates the reactor's capacity for rapid mixing. In order to achieve efficient mixing of solutions within microchannels, researchers have proposed passive mixing techniques that rely on special structures to perturb the fluid,32–35 as well as active mixing techniques with an applied energy field.36–39 The mixing performance of microreactors based on passive mixing is contingent upon the flow rate and cannot be readily adjusted. Acoustic micromixers in active mixing technology generate acoustic waves by applying an AC electrical signal and delivering it to drive microstructures (sharp edges40 or bubbles41,42) in the channel, which create a pair of reverse rotating vortices near the microstructure to perturb the fluid efficiently and homogenize the fluids in millisecond response times.43 Secondly, acoustic mixers address the second issue inherent to microreactors in the synthesis of nanoparticles, fouling and clogging in microreactors resulting from the minute dimensions of the characteristic channels. The sharp corners and bubbles oscillate strongly in the fluid medium, generating significant shear forces. The mechanical effects can not only enhance mixing and mass transfer, but also detach particles deposited on channel walls.44,45 Nevertheless, the majority of disturbances generated by sharp edges and bubbles in conventional acoustic mixers occur in the mid-channel region.43,46,47 There is no effective disturbance of the fluid at the sidewalls of the channel. In actual production experiments, the majority of the fluid ratios are variable. During perovskite synthesis, efficient mixing is beneficial for reducing particle size and polydispersity. In order to rapidly homogenize precursor solutions with a ratio of 1 to 10 in perovskite synthesis, it is essential to design a novel mixer structure that can effectively perturb the fluids across the entire channel.
To address this issue, a novel acoustic micromixer was designed to perturb the fluid using vibrations generated by sharp-edges and bubbles in response to an acoustic signal input from a piezoelectric transducer. The efficacy of the chip in facilitating efficient mixing was validated for a range of inlet flow ratios, including 1![[thin space (1/6-em)]](https://www.rsc.org/images/entities/char_2009.gif) :
:![[thin space (1/6-em)]](https://www.rsc.org/images/entities/char_2009.gif) 1 and 1
1 and 1![[thin space (1/6-em)]](https://www.rsc.org/images/entities/char_2009.gif) :
:![[thin space (1/6-em)]](https://www.rsc.org/images/entities/char_2009.gif) 10, to accommodate diverse experimental scenarios in real-world applications. This study examines the distinct roles of sharp corners and bubbles in the acoustic field, with the aim of informing the design of the chip. Furthermore, the low-to-millisecond mixing of the acoustic micromixer allows superior control of the nanocrystal formation stage. Compared with the batch reactor method, the CsPbBr3 NCs synthesized using the micromixer have minimal by-products, are more homogeneous in size, and have significant advantages in terms of photoluminescence intensity and experimental reproducibility. In addition to its utility in nanoparticle synthesis, the acoustic mixer has demonstrated considerable potential in other mixer application scenarios such as enzymatic reactions,48 acoustic enrichment,49,50 particle sorting,51,52 gradient generators53 and biosensors.54
10, to accommodate diverse experimental scenarios in real-world applications. This study examines the distinct roles of sharp corners and bubbles in the acoustic field, with the aim of informing the design of the chip. Furthermore, the low-to-millisecond mixing of the acoustic micromixer allows superior control of the nanocrystal formation stage. Compared with the batch reactor method, the CsPbBr3 NCs synthesized using the micromixer have minimal by-products, are more homogeneous in size, and have significant advantages in terms of photoluminescence intensity and experimental reproducibility. In addition to its utility in nanoparticle synthesis, the acoustic mixer has demonstrated considerable potential in other mixer application scenarios such as enzymatic reactions,48 acoustic enrichment,49,50 particle sorting,51,52 gradient generators53 and biosensors.54
2. Materials and methods
2.1 Device design and fabrication
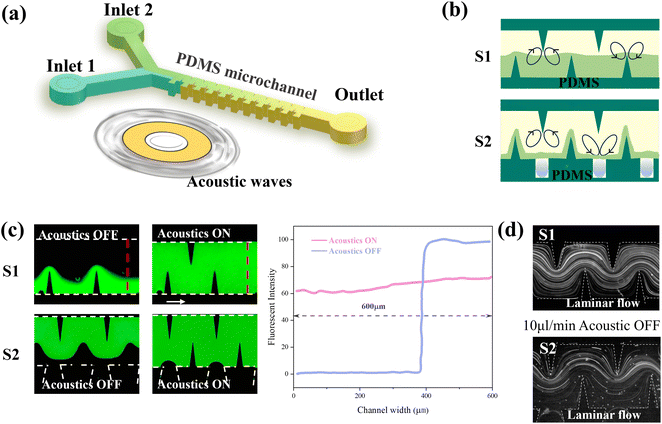
The microfluidic device shown in Fig. 1a was fabricated with standard soft lithography techniques, including SU-8 mold manufacturing, polydimethylsiloxane (PDMS) pouring and plasma bonding. Piezoelectric transducers were bonded to a glass substrate near the PDMS microchannel using epoxy resin. In a conventional sharp-edged acoustic micromixer (S1), the vortices generated by the sharp edges are situated in the middle of the channel. However, if the interface between the two fluids is situated close to one side of the channel at large flow ratios, the sharp corners on the other side are unable to produce effective perturbations. In this study, we conducted a comparative analysis of two distinct microchannel types shown in Fig. 1b: single sharp-edged microchannels (S1) and sharp-edged grooved composite (S2) microchannels. Fig. S1a† illustrates the specific dimensional parameters of the structure. In particular, a groove for bubble trapping was distributed in the middle of every two sharp edges on one side of the S2 microchannel. Bubbles are less likely to be washed away in the trapezoidal notch structure (Fig. S1b†).2.2 Mixing performance evaluation and flow characteristics
A fluorescent solution and DI water were injected into the microchannel using injection pumps (Legato 100, KD Scientific). Fluid dynamics in microchannels were observed and recorded using a CCD camera (Viee, China). ImageJ software was used to extract the gray level distribution of the sampling position in the fluorescence image (red dashed lines shown in Fig. 1c). The mixing index M = 1 − σ/σmax quantitatively characterized the mixing performance of the device,37 where σ is the standard deviation of normalized fluorescence intensity in the channel, and σmax is the maximum standard deviation within the data range. Piezoelectric transducers were excited by a square wave signal generated with a signal generator (AFG31022, Tektronix) and amplified with an amplifier (ATA-308, Agitek, China). The working frequency was set to 2.6 ± 2 kHz (adjusted for experimental conditions). The fluorescence particle tracer experiment was carried out by injecting 2 μm polystyrene microsphere aqueous solution into the microchannel to visualize the flow pattern (Fig. 1d).2.3 Continuous synthesis and characterization of CsPbBr3 NCs
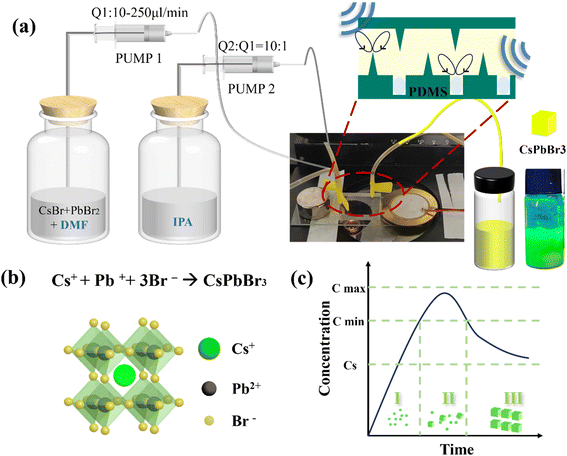
The experimental setup of synthesis of CsPbBr3 NCs by the LARP method is shown in Fig. 2a. The corresponding structural models of CsPbBr3 NCs are illustrated in Fig. 2b. The perovskite precursors were transferred from a good solvent to an antisolvent at room temperature. The nucleation and subsequent growth of CsPbX3 nanocrystals was triggered by supersaturation due to polarity difference. After a series of experiments (Fig. S2†), it was determined that DMF and IPA were the most suitable solvents considering the toxicity and polarity. The ratio of good solvents to antisolvents will facilitate the transformation of perovskite nanocrystals of varying sizes.20 In order to synthesize pure CsPbBr3 nanocrystals, the flux ratio of the good solvent to the counter-solvent was fixed at 1![[thin space (1/6-em)]](https://www.rsc.org/images/entities/char_2009.gif) :
:![[thin space (1/6-em)]](https://www.rsc.org/images/entities/char_2009.gif) 10. The synthesis of PNCs through LARP is considered to follow the classical LaMer theory for nucleation and growth of nanoparticles.55 Accumulation of monomers beyond a certain degree of supersaturation leads to nucleation, whereby new monomers are incorporated into the nucleus through oriented attachment (Fig. 2c). The particular pharmaceutical agents and procedures necessary for the experiment are delineated in the ESI.†
10. The synthesis of PNCs through LARP is considered to follow the classical LaMer theory for nucleation and growth of nanoparticles.55 Accumulation of monomers beyond a certain degree of supersaturation leads to nucleation, whereby new monomers are incorporated into the nucleus through oriented attachment (Fig. 2c). The particular pharmaceutical agents and procedures necessary for the experiment are delineated in the ESI.†
3. Results and discussion
3.1 Flow characteristics
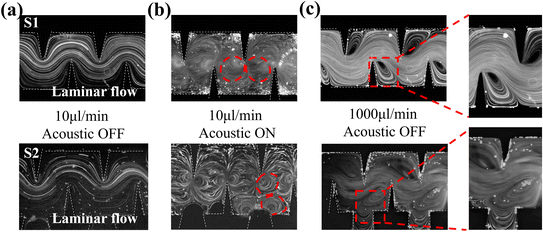
The mixing process of the two structures was classified into two modes based on the above phenomena: the acoustic streaming dominant mode at low flow rates and the inertial vortex dominant mode at high flow rates. At low flow rates without an acoustic field, the flow field exhibits characteristics of laminar flow. It is worth noting that when the piezoelectric transducer is turned on, in contrast to the S1 micromixer which employs sharp edges to generate vortices, the S2 micromixer additionally employs bubbles to generate vortices (Fig. 3b). At high flow rates, the acoustic flow is suppressed, and the bubbles at the notches are washed away by the high-velocity fluid (Fig. S1†); the mixing process is based on the inertial vortex. Meanwhile, the groove structure of the S2 micromixer enhances the horizontal vortices generated by the sharp edges. The enhanced effect is reflected in the increased vortex area and fluid disorder, achieving uniform mixing at high flow rates.
3.2 Comparison of the mixing performance of S1 and S2 micromixers
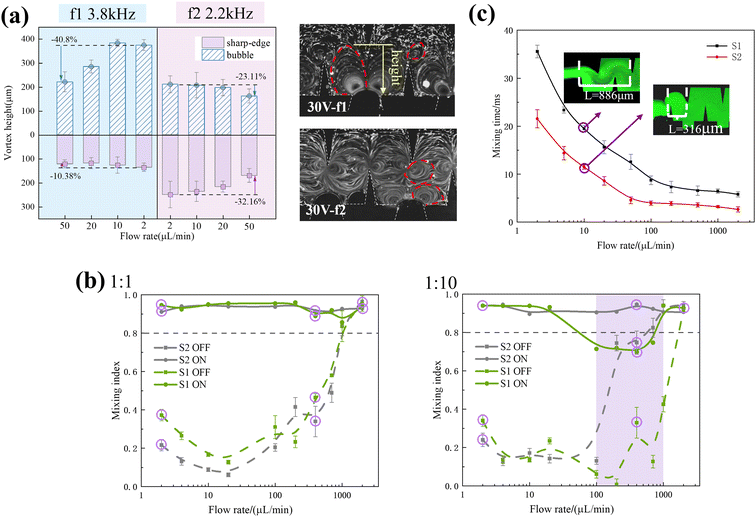
A fluorescent solution and DI water were injected into the microchannel to extract the grey scale distribution of the target position in the fluorescence image and calculate the mixing index. Fig. 4b illustrates the variation in the mixing index at the outlets of two microchannels when the piezoelectric transducer is turned on and off for the two inlet fluids with 1 to 1 and 1 to 10 flow ratios. The purple circles indicated the fluorescence images at the outlets of S1 and S2 under calibration conditions (Fig. S4†).When the ratio of the two inlet fluids was 1 to 1, the mixing interface was located in the middle of the channel, and the mixing index varied similarly in both channels. When the piezoelectric transducer was turned off, the inertial vortices from the increased flow resulted in a higher mixing index. When the piezoelectric transducer was turned on, the sharp edges acted as the main acoustic streaming-producing flow unit. The acoustic flow generated by the sharp edge vibration ensured complete mixing of the solution in both channels, resulting in a uniform green solution (Fig. S4†). The mixing index was consistently above 0.8.
When the ratio of the two inlet fluids was 1 to 10, the mixing interface was located at the side wall of the channel. When the piezoelectric transducer was turned off, as the flow rate increased, in the S1 micromixer, only the inertial vortex generated by the sharp corner on one side mixed the fluid. However, S2 exhibited superior mixing performance to S1 with the synergistic effect of the horizontal vortex generated by the sharp corner and the groove (purple region in Fig. 4b). When the piezoelectric transducer was turned on, the vortex perturbation generated by the sharp corner on the other side did not reach the interface of the two fluids in the S1 micromixer. Therefore, when 100 μL min−1 < Q < 1000 μL min−1, as indicated by the purple region in Fig. 2b, the acoustic flow was suppressed by the main flow and only one set of sharp corners was working, and the mixing index was significantly reduced. In contrast, in addition to a set of sidewalls with sharp edges, there were vortices generated by surface vibrations of the bubbles captured by the grooves used to mix the fluid in the S2 micromixer (Fig. 3c). This resulted in complete mixing throughout the entire range of flow rates tested in the experiments, with the mixing index being consistently above 0.8.
To further measure the difference in mixing performance, in addition to the mixing index at the outlet, the mixing time is an important factor that reflects the performance of the mixer. Specific information on the calculation of the mixing time is contained in the ESI.† The mixing time under all flow rates in the S1 and S2 micromixers tested in the experiment is shown in Fig. 4c.
The above analyses from different perspectives of the mixing index, mixing time and flow distribution show that the structure with grooves on the side wall is capable of achieving complete mixing in a shorter time. It has more potential in various aspects, such as being more favorable for nucleation and growth of nanoparticles during the nucleation process of nanoparticles.
3.3 Continuous synthesis and characterization of CsPbBr3 NCs
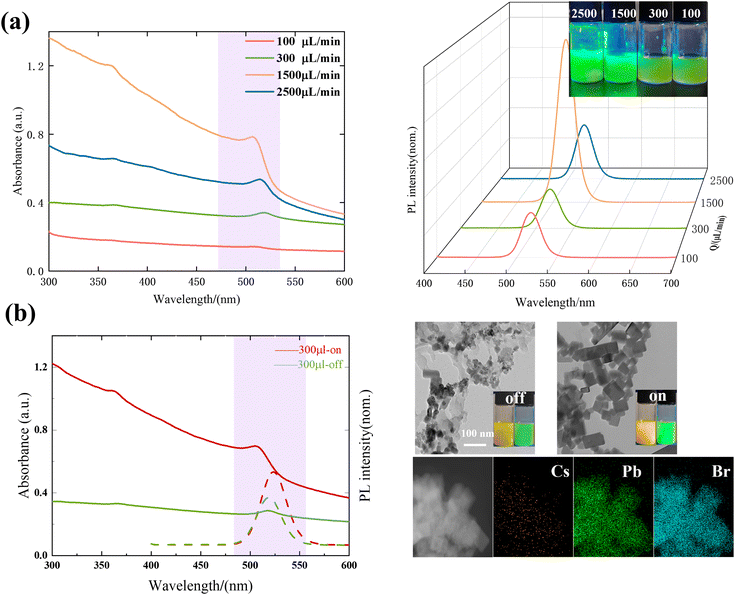
To further validate the superiority of acoustic mixers for controlling the nanocrystal formation stage and explore the effect of various external parameters on the properties of nanocrystals, a synthesis of perovskite nanocrystals was conducted using the LARP method. Please refer to section 2.3 and the ESI† for a detailed account of the synthesis steps.Consequently, the rapid and thorough mixing of the two solutions is a fundamental aspect of the synthesis, which generates a more uniform supersaturation and provides a more homogeneous environment for the nucleation and subsequent growth.
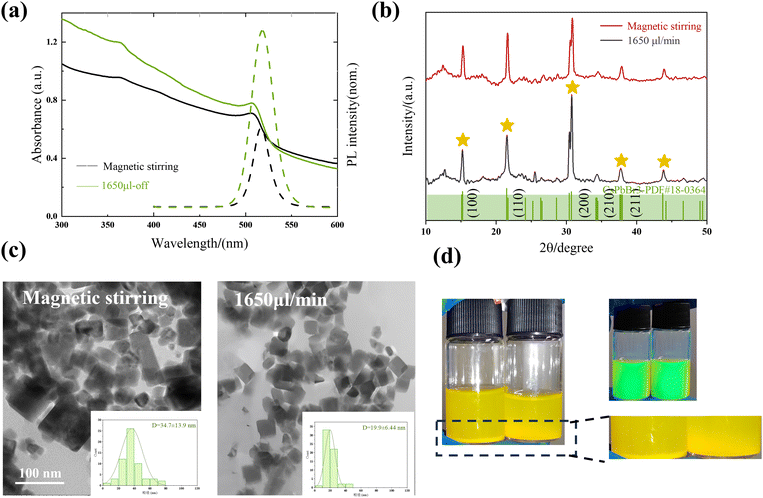
The sizes of samples synthesized by the acoustic micromixer and magnetic stirring were 19.9 ± 6.44 nm and 34.9 ± 13.9 nm, respectively (Fig. 6c), with a cubic structure, in agreement with previous reports.56 Meanwhile, the larger size of samples synthesized by magnetic stirring led to the generation of more precipitates, as shown in Fig. 6d. The TEM images further demonstrated that the samples synthesized by the micromixer exhibited a more uniform size distribution and superior dispersion. This is attributed to the micromixer's ability to rapidly and uniformly mix the precursor reagents with the anti-solvent to produce higher quality nanocrystal dispersions.
4. Conclusions
In summary, this paper proposes a new acoustic mixer structure that exploits the synergistic effect of acoustic flow generated by sharp edges and bubbles to achieve millisecond mixing with adjustable flow ratios. The acoustic flow perturbations are effectively achieved even when the mixing interface is at different locations in the channel. Homogeneous mixing has been achieved at nearly ambient temperatures within 5 ms. With this homogeneous and fast mixing time, the synthesized samples have higher photoluminescence intensity, better dispersion, more homogeneous size distribution and fewer by-products. In addition, the flow ratio of the micromixer reactants is controlled with a syringe pump, ensuring precise and reproducible ratio control. The acoustically driven micromixer demonstrated advantages in rapid nucleation and ultra-fast growth of nanoparticles, providing a new avenue for sequential synthesis of nanoparticles.Data availability
The authors confirm that the data supporting the findings of this study are available within the article and its ESI.†Author contributions
Z. L. conceived the idea, designed the experiments, analyzed the data and wrote the manuscript. Y. L. analyzed the data. All authors discussed the results and commented on the manuscript. G. Z. and Y. L. participated in the revision of the manuscript. G. Z. and W. T. supervised the project.Conflicts of interest
There are no conflicts to declare.Acknowledgements
This study was supported by the National Natural Science Foundation of China (22078236) and the Science and Technology Plan Project of Tianjin (21JCZDJC00420).References
- W. Wang, Y. Li, P. Ning, P. Niu, H. Liu and H. Zhan, J. Lumin., 2018, 39, 627–632 CAS.
- J. Song, J. Li, X. Li, L. Xu, Y. Dong and H. Zeng, Adv. Mater., 2015, 27, 7162–7167 CrossRef CAS.
- L.-J. Chen, J.-H. Dai, J.-D. Lin, T.-S. Mo, H.-P. Lin, H.-C. Yeh, Y.-C. Chuang, S.-A. Jiang and C.-R. Lee, ACS Appl. Mater. Interfaces, 2018, 10, 33307–33315 CrossRef CAS.
- H. Zhu, Y. Fu, F. Meng, X. Wu, Z. Gong, Q. Ding, M. V. Gustafsson, M. T. Trinh, S. Jin and X. Y. Zhu, Nat. Mater., 2015, 14, 636–642 CrossRef CAS.
- Z. Shi, S. Li, Y. Li, H. Ji, X. Li, D. Wu, T. Xu, Y. Chen, Y. Tian, Y. Zhang, C. Shan and G. Du, ACS Nano, 2018, 12, 1462–1472 CrossRef CAS PubMed.
- H. Bi, M. Wang, L. Liu, J. Yan, R. Zeng, Z. Xu and J. Wang, J. Mater. Chem. A, 2024, 12, 12744–12751 RSC.
- L. Wang, J. Liu, Y. Gong, J. Yu, Q. Li, Z. Liu, C. Zhang, S. Wang, X. Zhang and X. Yang, Nano Lett., 2024, 24, 7004–7011 CrossRef CAS PubMed.
- L. Protesescu, S. Yakunin, M. I. Bodnarchuk, F. Krieg, R. Caputo, C. H. Hendon, R. X. Yang, A. Walsh and M. V. Kovalenko, Nano Lett., 2015, 15, 3692–3696 CrossRef CAS PubMed.
- X. Li, Y. Wu, S. Zhang, B. Cai, Y. Gu, J. Song and H. Zeng, Adv. Funct. Mater., 2016, 26, 2435–2445 CrossRef CAS.
- X. Cheng, Y. Zhai, X. Wang, X. Cao, D. Guan, H. Zhang, Q. Zhu, S. Fang and L. Wang, J. Lumin., 2024, 271, 120610 CrossRef CAS.
- S. Tu, M. Chen and L. Wu, J. Mater. Chem. C, 2021, 9, 17444–17450 RSC.
- V. K. Ravi, Z. Li, S. J. Paul and A. Sahu, Chem. Commun., 2024, 60, 3307–3310 RSC.
- H. Yang, Y. Zhang, J. Pan, J. Yin, O. M. Bakr and O. F. Mohammed, Chem. Mater., 2017, 29, 8978–8982 CrossRef CAS.
- Q. A. Akkerman, S. Park, E. Radicchi, F. Nunzi, E. Mosconi, F. De Angelis, R. Brescia, P. Rastogi, M. Prato and L. Manna, Nano Lett., 2017, 17, 1924–1930 CrossRef CAS PubMed.
- P. Conceição, A. Perdomo, D. F. Carvalho, J. P. Teixeira, P. M. P. Salomé and T. Trindade, Green Chem., 2024, 26, 7837–7848 RSC.
- B. H. Kwon, K. G. Lee, T. J. Park, H. Kim, T. J. Lee, S. J. Lee and D. Y. Jeon, Small, 2012, 8, 3257–3262 CrossRef CAS.
- A. Schejn, M. Frégnaux, J.-M. Commenge, L. Balan, L. Falk and R. Schneider, Nanotechnology, 2014, 25, 145606 CrossRef PubMed.
- C. K. Ng, H. Deng, H. Li, W. Yin, T. Alan and J. J. Jasieniak, J. Mater. Chem. C, 2021, 9, 313–321 RSC.
- M. Li, Z. Liu, W. Yao, C. Xu, Y. Yu, M. Yang and G. Chen, Chin. J. Chem. Eng., 2023, 59, 32–41 CrossRef CAS.
- W. Lai, C. Wu and X. Han, Chem. Eng. J., 2023, 451, 138383 CrossRef CAS.
- I. Seder, T. Zheng, J. Zhang, C. C. Rojas, S. H. Helalat, R. C. Téllez and Y. Sun, Nano Lett., 2024, 24, 5132–5138 CrossRef CAS.
- H. Xu, Z. Wang, W. Wei, T. Li and X. Duan, Lab Chip, 2024, 24, 2802–2810 RSC.
- S. O. Hong, K.-S. Park, D.-Y. Kim, S. S. Lee, C.-S. Lee and J. M. Kim, Lab Chip, 2021, 21, 513–520 RSC.
- I. Koryakina, S. Bikmetova, D. Khmelevskaia, D. Markina, A. Kuleshova, L. Logunov, A. S. Timin, A. Pushkarev, S. Makarov and M. V. Zyuzin, ACS Appl. Nano Mater., 2023, 6, 4370–4378 CrossRef CAS.
- Y. Geng, H. Lv, S. Xu and C. Geng, Nanoscale, 2023, 15, 6371–6378 RSC.
- X. Tang and F. Yang, Lab Chip, 2022, 22, 2832–2843 RSC.
- X. Tang, X. Wen and F. Yang, Nanoscale, 2022, 14, 17641–17653 RSC.
- Z. Zhang, Y. Liu, C. Geng, S. Shi, X. Zhang, W. Bi and S. Xu, Nanoscale, 2019, 11, 18790–18796 RSC.
- I. G. Koryakina, M. Naumochkin, D. I. Markina, S. A. Khubezhov, A. P. Pushkarev, A. A. Evstrapov, S. V. Makarov and M. V. Zyuzin, Chem. Mater., 2021, 33, 2777–2784 CrossRef CAS.
- I. Lignos, S. Stavrakis, G. Nedelcu, L. Protesescu, A. J. deMello and M. V. Kovalenko, Nano Lett., 2016, 16, 1869–1877 CrossRef CAS.
- H. Ma, L. Pan, J. Wang, L. Zhang and Z. Zhang, Chin. Chem. Lett., 2019, 30, 79–82 CrossRef CAS.
- A. D. Stroock, S. K. W. Dertinger, A. Ajdari, I. Mezić, H. A. Stone and G. M. Whitesides, Science, 2002, 295, 647–651 CrossRef CAS PubMed.
- A. Qamareen, M. A. Ansari, S. S. Alam and A. Alazzam, Chem. Eng. Commun., 2021, 209, 648–667 CrossRef.
- M. Juraeva and D. J. Kang, Micromachines, 2020, 11, 685 CrossRef PubMed.
- L. Balasubramaniam, R. Arayanarakool, S. D. Marshall, B. Li, P. S. Lee and P. C. Y. Chen, J. Micromech. Microeng., 2017, 27, 095016 CrossRef.
- K. Matsubara and T. Narumi, Chem. Eng. J., 2016, 288, 638–647 CrossRef CAS.
- X. Zhao, H. Chen, Y. Xiao, J. Zhang, Y. Qiu, J. Wei and N. Hao, Chem. Eng. J., 2022, 447, 137547 CrossRef CAS.
- H. Bachman, C. Chen, J. Rufo, S. Zhao, S. Yang, Z. Tian, N. Nama, P.-H. Huang and T. J. Huang, Lab Chip, 2020, 20, 1238–1248 RSC.
- N. H. An Le, H. Deng, C. Devendran, N. Akhtar, X. Ma, C. Pouton, H.-K. Chan, A. Neild and T. Alan, Lab Chip, 2020, 20, 582–591 RSC.
- P.-H. Huang, Y. Xie, D. Ahmed, J. Rufo, N. Nama, Y. Chen, C. Y. Chan and T. J. Huang, Lab Chip, 2013, 13, 3847–3852 RSC.
- D. Ahmed, X. Mao, J. Shi, B. K. Juluri and T. J. Huang, Lab Chip, 2009, 9, 2738–2741 RSC.
- D. Ahmed, X. Mao, B. K. Juluri and T. J. Huang, Microfluid. Nanofluid., 2009, 7, 727–731 CrossRef CAS.
- Y. Lu, W. Tan, S. Mu and G. Zhu, Anal. Chim. Acta, 2023, 1239, 340742 CrossRef CAS.
- Z. Dong, D. Fernandez Rivas and S. Kuhn, Lab Chip, 2019, 19, 316–327 RSC.
- Z. Dong, A. P. Udepurkar and S. Kuhn, Ultrason. Sonochem., 2020, 60, 104800 CrossRef CAS PubMed.
- X. Zhao, H. Chen, Y. Xiao, J. Zhang, S. Watanabe and N. Hao, Mater. Today Nano, 2023, 22, 100338 CrossRef CAS.
- Y. Zhang, H. Chen, X. Zhao, X. Ma, L. Huang, Y. Qiu, J. Wei and N. Hao, Chem. Eng. J., 2022, 450, 138273 CrossRef CAS.
- X. Li, Z. He, C. Li and P. Li, Anal. Chim. Acta, 2021, 1172, 338677 CrossRef CAS PubMed.
- P. Ohlsson, M. Evander, K. Petersson, L. Mellhammar, A. Lehmusvuori, U. Karhunen, M. Soikkeli, T. Seppä, E. Tuunainen, A. Spangar, P. von Lode, K. Rantakokko-Jalava, G. Otto, S. Scheding, T. Soukka, S. Wittfooth and T. Laurell, Anal. Chem., 2016, 88, 9403–9411 CrossRef CAS PubMed.
- Y. Lu, W. Tan, S. Mu and G. Zhu, Anal. Chem., 2024, 96, 3859–3869 CrossRef CAS PubMed.
- J. Yao, J. Chen, X. Cao and H. Dong, Talanta, 2019, 196, 546–555 CrossRef CAS PubMed.
- R. Jiang, S. Agrawal, M. Aghaamoo, R. Parajuli, A. Agrawal and A. P. Lee, Lab Chip, 2021, 21, 875–887 RSC.
- P.-H. Huang, C. Y. Chan, P. Li, N. Nama, Y. Xie, C.-H. Wei, Y. Chen, D. Ahmed and T. J. Huang, Lab Chip, 2015, 15, 4166–4176 RSC.
- G. Cai, Y. Wang, Y. Zhang, L. Zheng and J. Lin, Chin. Chem. Lett., 2023, 34, 108059 CrossRef CAS.
- H. Huang, J. Raith, S. V. Kershaw, S. Kalytchuk, O. Tomanec, L. Jing, A. S. Susha, R. Zboril and A. L. Rogach, Nat. Commun., 2017, 8, 996 CrossRef PubMed.
- R. Begum, M. R. Parida, A. L. Abdelhady, B. Murali, N. M. Alyami, G. H. Ahmed, M. N. Hedhili, O. M. Bakr and O. F. Mohammed, J. Am. Chem. Soc., 2016, 139, 731–737 CrossRef PubMed.
Footnote |
| † Electronic supplementary information (ESI) available. See DOI: https://doi.org/10.1039/d4lc00721b |
| This journal is © The Royal Society of Chemistry 2025 |

