
 Open Access Article
 This Open Access Article is licensed under a Creative Commons Attribution-Non Commercial 3.0 Unported Licence
In situ thermal solvent-free synthesis of doped ZIF-8 as a highly efficient visible-light-driven photocatalyst†
Farah
Naz
ab,
Chun Hong
Mak
ab,
Zhe
Wang
ab,
Haihang
Tong
ab,
Shella Permatasari
Santoso
*c,
Minshu
Du
 d,
Ji-Jung
Kai
e,
Kuan-Chen
Cheng
fghij,
Chang-Wei
Hsieh
klo,
Wenxin
Niu
m,
Zheng
Hu
n and
Hsien-Yi
Hsu
*ab
d,
Ji-Jung
Kai
e,
Kuan-Chen
Cheng
fghij,
Chang-Wei
Hsieh
klo,
Wenxin
Niu
m,
Zheng
Hu
n and
Hsien-Yi
Hsu
*ab
aSchool of Energy and Environment, Department of Materials Science and Engineering, Centre for Functional Photonics (CFP), City University of Hong Kong, Kowloon Tong, Hong Kong, China. E-mail: sam.hyhsu@cityu.edu.hk
bShenzhen Research Institute of City University of Hong Kong, Shenzhen, 518057, China
cDepartment of Chemical Engineering, Faculty of Engineering, Widya Mandala Surabaya Catholic University, Kalijudan No. 37, Surabaya 60114, East Java, Indonesia. E-mail: shella@ukwms.ac.id
dSchool of Materials Science and Engineering, Northwestern Polytechnical University, Xi'an, Shaanxi 710072, China
eDepartment of Mechanical Engineering, City University of Hong Kong, Kowloon Tong, Hong Kong, China
fInstitute of Biotechnology, National Taiwan University, No. 1, Sec. 4, Roosevelt Rd., Taipei 10617, Taiwan
gDepartment of Optometry, Asia University, 500, Lioufeng Rd., Wufeng, Taichung, Taiwan
hDepartment of Medical Research, China Medical University Hospital, China Medical University, 91, Hsueh-Shih Road, Taichung, Taiwan
iInstitute of Food Science and Technology, National Taiwan University, No. 1, Sec. 4, Roosevelt Rd., Taipei 10617, Taiwan
jDept of Food Science, Fu Jen Catholic University, 24205, New Taipei City, Taiwan
kDepartment of Food Science and Biotechnology, National Chung Hsing University, 145 Xingda Rd., South Dist., Taichung City, Taiwan
lDepartment of Food Science, National Ilan University, Shennong Road, Yilan City 26047, Taiwan
mState Key Laboratory of Electroanalytical Chemistry, Changchun Institute of Applied Chemistry, Chinese Academy of Sciences, 5625 Renmin Street, Changchun, Jilin 130022, P. R. China
nKey Laboratory of Mesoscopic Chemistry of MOE and Jiangsu Provincial Laboratory for Nanotechnology, School of Chemistry and Chemical Engineering, Nanjing University, Nanjing 210023, China
oDepartment of Medical Research, China Medical University Hospital, Taichung City, Taiwan
First published on 12th February 2025
Abstract
Developing an economical and effective catalyst to remove organic pollutants from wastewater remains a significant challenge to maintaining a healthy, green environment. The metal–organic frameworks (MOFs) have drawn considerable attention to renewable energy and environmental remediation due to their porous crystalline structure. In this context, we develop a straightforward, environmentally friendly, solvent-free, in situ thermal (IST) method to synthesize doped zeolitic imidazole frameworks (ZIF-8). The solvent-free IST technique surpasses the traditional synthesis procedures in efficiency due to a single-step and solvent-free process with a short processing time and a low precursor ratio. Notably, doped ZIF-8 photocatalysts against concentrated methylene blue (MB) and rhodamine B (RhB) degradation exhibit superior photocatalytic performance under visible light exposure. An in-depth study of the effect of dye concentration and pH on doped ZIF-8 is also performed. The kinetic study via photocatalytic isotherms confirms that the photodegradation mechanism follows the pseudo-first-order kinetic model. Following active species trapping experiments, we confirm that the hydroxyl radicals play a substantial role in MB degradation with optimized Fe@ZIF-8. Moreover, the Fe@ZIF-8 does not significantly lose its photocatalytic activity for degrading MB after three cycles, indicating its enduring reusability and stability. Thus, this study provides a novel approach to developing the doped MOF as a photocatalyst with enhanced photocatalytic activity for wastewater treatment.
1. Introduction
Water is an indispensable element that sustains all organisms on our planet. In the past few years, we have witnessed a consistent rise in population, an increase in the worldwide economy, and our reliance on conventional fossil fuels, giving rise to water pollution.1 The above-mentioned issues arose simultaneously with the shortage of water resources; therefore, the main task of the scientific community is to remove water pollutants. Such strategies require the development of more advanced technologies or adapting presently used materials or technology.2 The detrimental effects of dye effluent on the environment have been widely noticed, including aesthetic contamination, toxicity, and impact on aquatic life.3 Furthermore, mainly textile dyes provide long-lasting color and are non-biodegradable. The majority of colors are also challenging to remove from the wastewater.2e A limited variety of water treatment technologies, including chemical, physical, and biological approaches, have succeeded in dye removal from effluent.4 Adsorption of activated carbon to remove organic contaminants is one of the most effective color removal processes; nevertheless, the issue of its high cost remains. Despite oxidation by ozonation and hypochlorite being an effective decolorization method, there are more efficient methods for dye removal due to the high cost of apparatus, operation, and secondary pollution.5 As a result, improving advanced processing technology to remove dyes from wastewater is an essential environmental preservation.Based on the ongoing research and development of technologies for environmental protection, advanced oxidation processes (AOPs) are considered a possible way to solve the abovementioned ecological problems.4d,6 Among AOP technologies, photocatalysis has drawn attention to energy conservation and environmental remediation (e.g., organic dye degradation), solar energy conversion, and organic photosynthesis due to its ease of use, low selectivity, and moderate reaction conditions. Thus, the photocatalytic approach is a cost-effective, versatile, and efficient water treatment method.6a,f
Photocatalytic technology has advanced tremendously since Fujishima and Honda et al. discovered in 1972 that single titanium dioxide (TiO2) crystals can catalyze water hydrolysis to produce hydrogen when exposed to ultraviolet light.7 Photocatalytic oxidation technologies have grown fast and recently become increasingly important in the water treatment industries. Several semiconductor photocatalysts are introduced to remove organic pollutants from wastewater, e.g. TiO2,8 Fe2O3,9 ZnO,10 MoS2,11 g-C3N4,12 CdS, etc.13 The technology of green photocatalysis has effectively eliminated hazardous effluents in industrial wastewater. However, some problems still need to be addressed, such as inadequate mineralization, inefficient charge transfer efficiency, and restricted solar energy usage.14 To completely mineralize organic effluents, photocatalysts must efficiently separate charges and maximize light absorption while retaining oxidation capability. Nonetheless, the broader bandgap of these systems as photocatalysts may substantially restrict their efficiency.15 A practical and straightforward method is to combine materials with narrow band gaps to increase the efficiency of photocatalysis by facilitating electron transport and reducing the rate of electron–hole recombination.
It is essential to find photocatalytic materials that are durable and affordable to replace traditional ones. Metal–organic frameworks (MOFs) are crystalline materials with metals or metal clusters connecting nodes and polyfunctional molecular building blocks having high specific surface area and well-organized structures that have drawn significant interest in various domains. These fields include gas storage,16 gas separation,17 drug delivery,18 chemical sensors,19 heterogeneous catalyst20 and photocatalyst.2e,15a,21 Compared to other metal–organic frameworks (MOFs), ZIF-8, primarily made of imidazolate organic ligand and Zn2+ center ions, displays exceptional chemical and thermal stability.22 The more specific surface area and uniform distribution of active sites in ZIF-8 make it a desirable candidate for functionalization to increase its efficiency as a photocatalysis.23
As a class of MOFs, ZIFs are topologically isomorphic with zeolites. ZIFs and MOFs can be prepared using different synthesis methods for various applications. In the conventional method for preparing ZIFs and MOFs, the precursor ligand and metal ion are typically dispersed in organic solvents before heating under specific conditions. The procedure may be executed for an extended duration, ranging from several hours to one week. In synthesizing ZIFs and MOFs, organic solvents such as dimethylformamide (DMF), tetrahydrofuran (THF), or alcohol are frequently utilized due to their significant ability to solubilize precursors and facilitate crystal formation. An environmentally sustainable approach was discovered at ambient temperature, employing water as the solvent to make nanocrystal products with a significantly higher yield than solvothermal synthesis.24 However, only a few precursors, including metals and ligands, show water solubility, leading to a shortage of successes in synthesizing ZIFs and MOFs. The green approach was then improved by advances in synthesis methods, including spray drying, microwave, electrochemistry, mechanochemical, etc.25 A microwave-assisted method for the rapid crystallization of MOFs has been developed. However, a particular instrument characterized by a sophisticated operation is needed. Unconventional nucleation agent inoculation and electrochemical deposition techniques have produced ZIFs. In comparison to previously reported methods, several drawbacks to the utilization of contemporary methods remain, e.g., high energy demands, procurement of cost or hazardous precursors and organic solvents, lengthened reaction durations, surplus ligand (ligand/metal > 1), use of additives (acid/base), and dependence on sophisticated instruments. The traditional process results in a non-environmentally friendly materials synthesis due to the different wastes generated throughout the synthesis and post-treatment processes. In terms of utilizing MOF and ZIF materials for practical applications, undergoing extra post-treatments, such as purification or activation of solvent, salt residue, or side product, is imperative. Accordingly, ZIF production and exploitation for diverse applications are restricted for the aforementioned reasons. Furthermore, industrialization is still a significant problem in the large-scale synthesis of ZIFs and MOFs.26 Therefore, for ZIFs and MOFs applied in the real market, developing a new synthetic strategy with an environmentally friendly and facile approach is essential and challenging.
This study presents a practical approach for synthesizing doped ZIF-8, utilizing a simple and direct one-pot synthesis procedure, specifically called an in situ thermal treatment (IST) method. Noticeably, the ZIFs prepared using this technique have yet to be reported for use in photocatalytic wastewater treatment. This method can quickly produce highly porous crystalline materials without adding additives or solvents. After comparing as-synthesized materials with traditionally synthesized ZIFs, it is noticed that the prepared materials are isostructural and possess the same properties in terms of surface area, porosity, and thermal stability. It is worth noting that the produced materials do not require any posttreatment or activation procedure. The ZIFs produced by this efficient, cost-effective IST method ultimately perform enhanced chemical and physical properties. Metal nanoparticles, such as Fe and Ni, have gained significant attention as co-catalysts compared with other material options due to their ability to efficiently separate charges through the formation of Schottky barriers at the heterogeneous nanoscale junctions and surface plasmon resonance (SPR), thereby significantly improving the photocatalytic performance.15a,27 The catalytic activity of the as-prepared materials has been determined by the photocatalytic degradation of dyes in wastewater treatment. We confirm doped ZIF-8 exhibits superior performance compared with ZIF-8, potentially making a significant contribution to real-world uses in wastewater treatment. Consequently, ZIF-8 prepared using the IST method instead of traditional synthesis processes opens up an avenue for metal–organic frameworks for commercializing photocatalytic energy and environmental applications.
2. Materials and methods
2.1. Materials
The chemicals used in this work were bought from commercial suppliers and utilized without going through any purification processes. Aladdin supplied zinc acetylacetonate hydrate (97%), 2-methylimidazole (2-MIM, 98%), iron acetylacetonate (98%), and nickel acetylacetonate (97%), benzoquinone (97%) and ammonium oxalate (98), which were utilized as initially received. MACKLIN and Aladdin supplied Methylene Blue (MB, 98%) and rhodamine B (RhB, 99%). Duksan Pure Chemicals, Korea, provided hydrochloric acid (HCL, 37%) and sodium hydroxide (NaOH, 99.9%). Anaqua Global International Inc. limited supplied N,N-dimethylformamide (DMF, 99.8%), isopropyl alcohol (IPA, 99.8%), and methanol (MeOH, 99.8%). Merck's Milli-Q® Direct Water Purification System provides deionized (DI) water.2.2. Preparation of ZIF-8
First, the Zn(II) acetylacetonate (0.959 mmol, 263 mg) and 2-methylimidazole (3.99 mmol, 328 mg) were combined and mashed in a mortar for almost five minutes in an ambient atmosphere to synthesize ZIF-8. After that, the resulting solid mixtures were put in an alumina boat (30 × 60 × 15 mm3) and then moved inside the muffle furnace (TL 1200, Nanjing Bo Yun Tong Instrument Technology Co. Ltd) into a quartz tube (O.D.: 60 mm, length: 1000 mm). An Ar or N2 (100 cm3 min−1) stream was flown in the system. Two steps were employed to set the temperature program: a 30-minute rise from room temperature to 100 °C, then raised to 200 °C (5 °C min−1) and maintained constant for one hour. After cooling, the final product was collected and employed for further characterization and applications. The product's yield was calculated using the eqn (1). | (1) |
2.3. Preparation of M@ZIF-8
In a typical synthesis of M@ZIF-8, the as-prepared ZIF-8 (300 mg), 2-methylimidazole (0.84 mmol, 69 mg), and Fe(III) acetylacetonate (0.11 mmol, 37.2 mg) were mixed and ground in a mortar for about 5 minutes under an ambient atmosphere to produce Fe@ZIF-8. Ni@ZIF-8 was prepared in the same way as Fe@ZIF-8, with Ni(II) acetylacetonate (0.11 mmol, 27 mg) replacing Fe(III) acetylacetonate. Fe@ZIF-8 and Ni@ZIF-8 used the same product mixing, synthesis, temperature program, time, and recovery procedures that ZIF-8 did.2.4. Characterization
The crystalline phases of the ZIF-8 and doped ZIF-8 as-made photocatalyst were examined using a PANalytical X'Pert3 X-ray diffractometer in the 2theta range of 5–90 degrees at a tension of 40 kV and 40 mA current under Cu-Kα radiation (λ = 1.54 Å). The morphology was confirmed by transmission electron microscopy (TEM, American, FEI Talos F200X G2), scanning electron microscopy (ZEISS EVO MA10 SEM at 15 kV), and field-emission scanning electron microscopy (FESEM; Hitachi, SU-8010, 10 kV, working distance: 6.8 mm). Surface electronic valence states were analyzed utilizing a Thermo Scientific apparatus (ESCALAB220i-XL) and a monochromatic Al Kα X-ray source (1486.68 eV). The carbon 1s peak at 284.6 eV was used to calibrate the binding energy. Thermogravimetric analyses (TGA) were performed using TA SDT650 equipment with a 20 °C min−1 heating rate in a nitrogen atmosphere. The ATR-FTIR (attenuated total reflectance-Fourier transform infrared spectroscopy) analysis was studied using an IRaffinity-1 (Shimadzu Corporation, Japan) spectrometer equipped with a PIKE MIRacle ATR module to observe the functional group of synthesized samples. All samples were recorded in the 400–4500 cm−1 range with 50 scans and 4 cm−1 resolution. Raman spectra were collected using Renishaw's inVia Raman microscopy. Under 99.999% pure N2, the adsorption–desorption was measured using an ASAP 2020 Analyzer (Micrometrics Instruments). Furthermore, materials were activated for three hours at 200 °C under a dynamic vacuum before the adsorption measurement. The Langmuir and Brunauer–Emmett–Teller (BET) analysis was employed to study the surface area and porosity of the prepared material. The fitting range for the linearized BET and Langmuir equations was 0.003 < P/P0 < 0.05. Nitrogen (N2) was used in a constant volume adsorption/desorption device (Autosorb iQ Station 1) to study the surface properties. To prevent moisture, the prepared materials were degassed at 200 °C for approximately two hours before the Brunauer–Emmett–Teller (BET) method (surface-area nova-touch device) was used to analyze the surface area at −196 °C. MB and RhB's ultraviolet-visible diffused reflectance spectroscopy (UV-vis DRS) spectra were measured via a UV-vis spectrophotometer (PerkinElmer, lambda 1050+) before and after the photodegradation. The Kubelka–Munk theory was used to draw Tauc plots from these spectra.2.5. Photocatalytic activity measurements
The photocatalytic performance of the prepared materials was studied by utilizing MB and RhB degradation. The photocatalysis studies were carried out in the photoreactor under ambient circumstances. Photocatalytic studies were carried out using a PLS-SXE300E high-power xenon light source with a cut-off filter of 420 nm, which produces visible light. For each photodegradation test, photocatalyst (10 mg) was added to a 25 mL aqueous solution of MB and RhB (10 and 20 mg L−1, respectively). Before the visible light illuminations, the sample solutions were stirred under the dark for 30 minutes to achieve adsorption–desorption stability. After 30 minutes, the sample solution was transported to a reactor, which started the photodegradation reaction. The visible light was exposed to the as-prepared solution for a set time. After the allotted time, 5 mL of solution was removed from the bulk sample solution. The solution underwent filtering through a hydrophobic syringes filtration (Sartorius, PTFE, 0.2 μm pore-size) to remove solid particles and obtain the translucent dye liquid. The degradation of MB and RhB in the solutions was measured using a UV-visible spectrophotometer, and the degradation rate was estimated using the equation below. | (2) |
The photocatalytic degradation rate is denoted by η, C0 represents the initial concentrations, and Ct represents the final concentration at time t. The MB's and RhB's most noteworthy absorption peaks were 664 nm and 556 nm, respectively. Furthermore, the pH and dye concentrations were studied. To adjust the pH, HCl and NaOH were added to the solution. HCl and NaOH were added to the dye solutions. For the recycling investigation, the photocatalyst was pulled out from the photoreactor after every run, and a 5 mL sample was taken, washed, and dried before the photocatalytic tests were performed using comparable techniques.
3. Results and discussion
3.1. Material characterizations
ZIFs based on the 2-methylimidazole linker have been widely synthesized and used in various applications.26g,28 ZIF-8 and doped ZIFs, in particular, exhibit exceptional properties and performance in various applications, comprising molecular separation, gas adsorption, electrochemistry, catalysis, and so on.29 This study adopts the in situ thermal (IST) strategy to develop ZIF-8 and doped ZIF-8. To synthesize ZIF-8, mixtures of 2-methylimidazole and Zn(II) acetylacetonate were heated up in a tube-shaped furnace under an inert atmosphere (Ar or N2). Then, ZIF-8 reacted with Fe(III) acetylacetonate and Ni(II) acetylacetonate to synthesize Fe and Ni-doped ZIF-8, respectively.ZIFs are known for their outstanding properties among MOFs, notably because of porosity, high crystallinity, thermal stability, and surface area. The solid crystalline products prepared via thermal treatment are characterized using powder X-ray diffraction (XRD), as illustrated in Fig. 1a. The XRD patterns of the as-prepared sample demonstrate the crystal transformation after the IST treatment at 200 °C. The diffraction patterns of the prepared materials are observed within the range of 5 to 55°. The 2θ values corresponding to these patterns are found to be 7.09, 10.05, 12.49, 14.44, 16.24, and 17.79°, which are assigned to the lattice planes 110, 200, 211, 220, 310, and 222, respectively. As previously reported,15a the presence of well-defined peaks in the ZIF-8 material suggests a high level of crystallinity. The crystalline pattern was also studied for Fe and Ni-doped ZIF-8 materials, as depicted in Fig. 1a. The crystalline pattern of the materials doped with Fe and Ni in ZIF-8 exhibits a remarkable similarity to that observed in pure ZIF-8. The dispersion of iron (Fe) and nickel (Ni) particles within ZIF-8 crystals results in a slight improvement in crystallinity. This finding confirms that the prepared catalysts possess the sodalite-type topology (SOD), as reported previously,30 proving the pure crystal phase of prepared materials. Furthermore, it is noteworthy that no impurity or supplementary peak was detected in any of the spectra analyzed after Fe or Ni doping.
 | ||
| Fig. 1 (a) X-ray diffraction pattern (XRD), (b) the thermo-gravimetric analysis (TGA), (c) Raman spectrum, and (d) N2 adsorption–desorption isotherms of ZIF-8, Fe@ZIF-8, and Ni@ZIF-8. Transmission electron microscopy (TEM) of (e) Fe@ZIF-8 and (f) Ni@ZIF-8. | ||
ZIF's excellent thermal stability is one of its most significant benefits over other MOFs. The thermal gravimetric analysis (TGA) was used to check the thermal stability and impurities of synthesized ZIF-8 and doped ZIF-8. The percentage weight change or mass change of the synthesized samples is observed in terms of temperature. It is worth mentioning that the as-prepared ZIFs using the IST method were assessed via TGA without any pre-treatment or post-activation (Fig. 1b). The TGA results reveal that thermal activities occurred up to 550 °C shortly after degradation (21.803% weight change at 656.78 °C), as shown in the TGA profile of ZIF-8 (Fig. 1b). At 500 °C, a slight weight change can be attributed to inadequate coordination or a structural flaw as that temperature exceeds the 2-MIM boiling point.26g TGA study revealed that ZIF-8 is thermally stable up to 500 °C. Concerning doped ZIFs, Fe@ZIF-8 shows a stable crystal structure up to 500 °C, the same as ZIF-8. After that, 38.35% weight loss is observed at 702.77 °C. The TGA of Ni@ZIF-8 shows good stability until 450 °C; (a) after that, the materials gradually degrade with the increment in temperature (12.68% weight loss occurs at 573.66 °C). The initial weight loss of 1–3% is noticed for ZIF-8 and Fe@ZIF-8, while 7% weight loss is observed for Ni@ZIF-8 until 500 °C. The ZIF-8 material under analysis deteriorates progressively as the temperature rises, ultimately transforming into carbon and zinc species. At the same time, in the case of doped Fe and Ni ZIF-8, there are carbon, zinc, nickel, and iron species (>700 °C). The materials have no precursor residuals, by-products, or guest molecules, as evidenced by the absence of a discernible weight shift at temperatures below 500 °C. Also, moisture desorption from the material pores and surfaces is missing and does not contribute to deterioration.31 The ZIF-8 and doped ZIF-8 prepared using the IST method shows higher thermal stability than the ZIF-8 or Fe and Ni-doped ZIF-8 synthesized through the traditional methods.2e,22 The decrease in weight seen at 500 °C in all produced materials is attributed to structural deterioration and deterioration of organic ligands. This indicates that all catalysts exhibit excellent thermal stability, with a collapse temperature of 500 °C for ZIF-8 and Fe@ZIF-8 and 400 °C for Ni@ZIF-8.
The structural identification of the ZIF-8 and Fe and Ni-doped ZIF-8 material was also investigated using Raman spectroscopy (Fig. 1c). The developed samples' spectra exhibit different peaks correlating with the molecule's stretching, bending, out-of-plane, aromatic, and asymmetric bands. The Zn–N stretching responsible for the characteristic Raman shift of ZIF-8 is observed at 285 cm−1. The C–H out-of-plane bend bands are 839 cm−1, 952 cm−1, and 1026 cm−1. The band viewed at 685 cm−1 is attributed to the puckering of the imidazole ring. The 1147 cm−1 and 1185 cm−1 bands are assigned to C5–N and C–N stretching, respectively. The 1385 cm−1, 1460 cm−1, and 1508 cm−1 bands are associated with the bending CH3, C–H wag, and stretching C–C, respectively. The Raman spectra of Ni@ZIF-8 strongly reflect a similar bond of ZIF-8. Ni@ZIF-8 shows a small shift, indicating that the bond length of ZIF molecules has increased. The Raman spectra of Fe@ZIF-8 show identical peaks as ZIF-8 and Ni@ZIF-8. Bands at 1385 cm−1, 1460 cm−1, and 1508 cm−1 are absent in the case of F2@ZIF-8, possibly due to their molecular, crystal structure, and fluorescence interference from the sample.32 The Raman spectra of prepared samples further prove the XRD results, confirming the successful formation of prepared samples, which is in good agreement with previously reported work.15a,33
Further analysis was done on the prepared materials' porosity and surface area (Fig. 1d). The adsorption behavior of all samples exhibits type I isotherms, confirming that all prepared materials have microporous structures.15a The release of gas throughout the decomposition process of precursor materials or the IST process chemical reactions indicates the possible formation of hysteresis in the N2-isotherm. The prepared materials' surface area and porosity were determined using the amount of adsorbed N2 at a temperature of −196 °C. The Brunauer–Emmett–Teller (BET) specific surface area of ZIF-8 and doped Fe and Ni@ZIF-8 are approximately 1718.62 m2 g−1, 1439.92 m2 g−1, and 1619.43 m2 g−1, respectively, higher than the values reported in the literature.15a,30 Also, the total pore volume values were recorded: 0.554 cc g−1, 0.496 cc g−1, and 0.521 cc g−1 for ZIF-8, Fe@ZIF-8, and Ni@ZIF-8, respectively (Table 1). ZIF-8 exhibits a higher specific surface area than doped ZIF-8. According to Fig. 1d, the doped Ni has little effect on the particular surface area, although Fe doping decreases the high surface area. The decline in surface area results from the presence of Fe and Ni particles on the surface and within the porous structure of the ZIF-8 materials. Using the IST method, the XRD and BET results confirm the absence of contaminants in the prepared materials. The characteristics of surface area and porosity for the as-prepared sample are presented in Table 1. The microstructure of the doped ZIF-8 was observed using TEM (Fig. 1e and f).
| Sample | Surface area (m2 g−1) | Pore size (nm) | Pore volume (cc g−1) | External surface area m2 g−1 | Producta (% yield) | |
|---|---|---|---|---|---|---|
| BET | Langmuir | |||||
| a The product yield was calculated from the average product weight acquired from two syntheses with theoretical molecular weight (MW) of ZIFs (ZIF-8 = 226 mol g−1). | ||||||
| ZIF-8 | 1003.705 | 1718.613 | 1.076 | 0.554 | 28.211 | 83 |
| Fe@ZIF-8 | 870.206 | 1439.918 | 1.076 | 0.496 | 65.265 | 80 |
| Ni@ZIF-8 | 932.808 | 1619.424 | 1.076 | 0.521 | 41.881 | 81 |
The crystal morphology of the prepared materials was further investigated using scanning electron microscopy analysis (SEM). The SEM images (Fig. 2a–c) reveal the presence of irregular particle morphologies with fused nanocrystals in the sample, possibly attributed to the short reaction time. As a result, rhombic dodecahedron crystals grew incompletely. The morphology of metal-doped ZIF-8 catalysts is seen as monodisperse nanoparticles with irregular particle morphologies with fused nanocrystal structure, suggesting that the presence of metal ions in the catalyst has minimal influence on the morphology of ZIF-8. Additionally, the lack of solvent in the IST system may lead to uneven material shapes, which agrees with the previously reported studies. For example, Lin et al. demonstrated the synthesis of MOF materials without using solvents or additives, resulting in a non-uniform distribution of particle sizes.34 The TEM also confirmed the SEM. The elemental mapping of ZIF-8 and doped ZIF-8 was further confirmed using energy-dispersive X-ray spectroscopy (EDS) (Fig. S1–S3†). The analysis reveals the presence of five elements in the optimized hybrid, including oxygen (O), nitrogen (N), zinc (Zn), nickel (Ni), and iron (Fe). The corresponding images are illustrated in Fig. 2(d–f). The presence of all possible elements confirms the successful formation of materials.
 | ||
| Fig. 2 SEM photos of (a) ZIF-8, (b) Fe@ZIF-8, and (c) Ni@ZIF-8, and FE-SEM images of the distributions of Zn, N, O, Ni, and Fe elements in (d) Fe@ZIF-8, (e) Ni@ZIF-8, and (f) ZIF-8. | ||
ATR-FTIR was employed to identify the specific bonding groups of the synthesized materials. Due to the complexity of ZIF-8 material, it is difficult to identify each band in ZIF-8 and doped ZIF-8 FTIR spectra (Fig. S4†). Nevertheless, most bands are linked to the bonding within the imidazolate ring. The bands absorption below 800 cm−1 is attributed to the ring's out-of-plane bending, from 900 cm−1 to 1350 cm−1, to the ring's in-plane bending; the entire ring stretching from 1300 cm−1 to 1500 cm−1, at 1583 cm−1 for C![[double bond, length as m-dash]](https://www.rsc.org/images/entities/char_e001.gif) N stretching, and at 2930 and 3135 cm−1 for aliphatic and aromatic C–H stretching, respectively. Doped ZIF-8 samples exhibit the full ranges of bands in their FTIR spectra. However, slight changes can be seen in the bands corresponding to convoluted bands and CN stretching. The FTIR spectra of ZIF-8 and doped ZIF-8 are consistent with the literature.35
N stretching, and at 2930 and 3135 cm−1 for aliphatic and aromatic C–H stretching, respectively. Doped ZIF-8 samples exhibit the full ranges of bands in their FTIR spectra. However, slight changes can be seen in the bands corresponding to convoluted bands and CN stretching. The FTIR spectra of ZIF-8 and doped ZIF-8 are consistent with the literature.35
X-ray photoelectron spectroscopy (XPS) determines the surface chemistry and valance states of ZIF-8 and dopped ZIFs (Fig. 3). The ZIF-8 and doped ZIF-8 are primarily composed of Zn 2p, C 1s, N 1s, Fe 2p, and Ni 2p, respectively. The spectra for ZIF-8, Fe@ZIF-8, and Ni@ZIF-8 are shown in Fig. 3(a). The high-resolution XPS spectra of Fe@ZIF-8, Ni@ZIF-8, and ZIF-8 are shown in Fig. 3(b–l), respectively. The deconvoluted profile of Zn 2p for both ZIF-8 and doped ZIF-8 is further classified into two bands consisting of 2p3/2 and 2p1/2. These bands are noticed at 1021.4 eV and 1044.5 eV, respectively, for all samples in which the presence of Zn(II) is confirmed (Fig. 3b, e, and i).15a,36
 | ||
| Fig. 3 XPS spectrum (a) XPS survey spectrum of ZIF-8, Fe@ZIF-8, and Ni@ZIF-8. High-resolution spectrum of ZIF-8, such as (b) Zn 2p, (c) C 1s, (d), N 1s, high-resolution spectrum of Fe@ZIF-8 such as (e) Zn 2p, (f) C 1s, (g) N 1s (h) Fe 2p, and high-resolution XPS spectrum of Ni@ZIF-8 such as (i) Zn 2p, (j) C 1s, (k) N 1s (l) Ni 2p, respectively. | ||
In Fig. 3c, the C 1s of the ZIF-8 displays a prominent C–C peak at 284.2 eV for the binding energy, in addition to shoulder peaks of C–O–C and O–CC at 285.1 and 286.5 eV, respectively. Analogous C 1s peaks have been detected in doped ZIF-8. Fe@ZIF-8 displays a prominent C–C peak at 283.64 eV, with shoulder peaks denoting C–O–C and O–CC at 284.24 and 285.11 eV, respectively (Fig. 3f). Ni@ZIF-8 shows the same peaks as Fe@ZIF-8 for C–C and C–O–C, while O–CC at the binding energy of 284.83 eV is observed (Fig. 3j).15a,36b,37Fig. 3(d, g, and k) illustrate the N 1s ZIF-8 and doped ZIF-8 binding energy spectra. The presence of the imidazole ring in the prepared samples is confirmed by the deconvoluted peaks of N 1s ZIF-8, which are pyrrole-N, pyridine-N, oxidized-N, and graphitic-N.15a For ZIF-8, the Fe 2p and Ni 2p peaks are inconspicuous, confirming their absence in ZIF-8. The presence of Fe is confirmed by the deconvoluted profile of Fe 2p on Fe@ZIF-8 (Fig. 3h), which is further subdivided into 2p3/2 and 2p1/2 bands at 710.25 eV and 723.96 eV, respectively.38 Ni@ZIF-8 peak (Fig. 3l) at the binding energy of 854.1 eV and 871.7 eV is observed for Ni 2p3/2 and 2p1/2, respectively, confirming the presence of Ni doping.39 The atomic percentage in the prepared sample calculated by XPS is shown in Table S1.† Therefore, the XPS measurements have confirmed the successfully synthesized ZIF-8 and doped ZIF-8.
As illustrated in Fig. S5,† UV-vis diffuse reflectance spectroscopy (DRS) was used to analyze the optical properties of the prepared photocatalyst. Fig. S5(a)† displays UV-vis spectra of the samples as they were prepared. ZIF-8's absorption spectrum shows a band span with a 340–390 nm wavelength interval. After incorporating Fe and Ni into ZIF-8, the UV-vis spectra display a UV absorption band similar to that of ZIF-8. Despite this, a slight variation in absorption margins is observed from 320 to 380 nm. The first band is attributed to the n–π* transition of the carbonyl group or the π–π* transition (–CC–, sp2 hybridization) and the trapped excited-state energy of surface states.40
The band gap energy has been calculated using UV-vis DRS analysis, as shown in Fig. S5(b).† The band gap energies of the prepared materials were calculated by plotting (αhν)2versus photon energy (hν), where α represents the absorption coefficient. The energy band gaps are confirmed by the plot intercepts (dash lines) on the energy axis.41 Fig. S5(b)† shows that the band gap value for ZIF-8 is 4.28 eV. In comparison, the band gap value (4.25 eV) of Fe@ZIF-8 is lower than ZIF-8. The band gap value of Ni@ZIF-8 is similar to that of ZIF-8. Notably, the band gap of ZIF-8 and doped ZIF-8 synthesized using the IST method is lower than in previously reported works.2e,23,29a The findings of this study indicate that ZIF-8 and doped ZIF-8 exhibit the ability to undergo photoexcitation, resulting in the generation of additional electron–hole pairs upon absorption of visible light. This phenomenon ultimately contributes to an enhanced photocatalytic efficiency.41,42 Therefore, the observed morphological properties of the as-synthesized material are expected to adsorb and penetrate large dye molecules effectively.
3.2. Photocatalytic activity
 | ||
| Fig. 4 UV-vis. Absorption change of MB in the presence of (a) ZIF-8, (b) Fe@ZIF-8, and (c) Ni@ZIF-8 under visible irradiation. UV-vis. Absorption change of RhB in the presence of (d) ZIF-8, (e) Fe@ZIF-8, and (f) Ni@ZIF-8 under visible irradiation. | ||
As depicted in Fig. 4(a–c), the MB absorption spectra are reduced by employing the ZIF-8 and doped ZIF-8 under exposure to visible light for approximately 55 minutes. Under dark for 30 min, MB almost shows 7–38% adsorption using ZIF-8 and doped ZIF-8, respectively. The 94% degradation of MB with ZIF-8 is observed after applying the visible radiation exposure for around 55 minutes (Fig. 4a), while 7% absorption is observed under dark after 30 min. Using the Fe@ZIF-8 as a photocatalyst for the degradation of MB, almost 21% absorption happens in the dark after 30 min, and 99% of MB degrades under visible light after 55 min (Fig. 4b). In the case of Ni@ZIF-8, as shown in Fig. 4c, 38% absorption is observed after 30 min under dark, which is high compared to ZIF-8 and Fe@ZIF-8, while under visible light for 55 min, 95% MB photodegradation occurs. Fe@ZIF-8 is the most effective photocatalyst for MB degradation under visible light exposure compared to previous ZIF-8 and Ni@ZIF-8. All the prepared photocatalysts reveal good photocatalytic activity towards MB degradation under visible light during a short time compared to previously reported doped ZIF-8 prepared by executing conventional techniques.2e
The ZIF-8 and doped ZIF-8 photocatalytic activity was further examined for the degradation of RhB in the presence and absence of visible light irradiation (Fig. 4d–f). The prepared photocatalysts show different photocatalytic activity towards the degradation of RhB compared to the photodegradation of MB. In the absence of visible light, ZIF-8 and Fe@ZIF-8 showed no absorbance of RhB under dark. In contrast, Ni@ZIF-8 shows an increment in the absorbance spectra of RhB under dark. The increase in absorbance of RhB using Ni@ZIF-8 is probably due to the desorption process and linked to the pH and surface charge of the semiconductor or photocatalyst,43 as shown in Fig. 4f. Under the visible irradiation of about 120 min, the photodegradation of RhB for ZIF-8, Fe@ZIF-8, and Ni@ZIF-8 is 90.5%, 85.5%, and 99.5%, respectively. The best photocatalyst for degrading RhB under visible light is Ni@ZIF-8, which exhibits the complete degradation of RhB under visible light after 120 min. The Ni@ZIF-8 prepared via IST shows good photocatalytic activity towards the degradation of concentrated RhB compared to the recently reported doped Ru@ZIF-8 (ref. 15a) synthesized using solvothermal method in which photocatalytic activity was studied for 5 mg L−1 dye solution of RhB. The as-prepared photocatalyst shows a different trend toward the photodegradation of MB and RhB dyes. It is possibly due to the active site on the catalyst surface and metal, which are responsible for enhancing the degradation efficiency of the organic dyes.15a
Fig. S6(a and b)† display the MB and RhB degradation plots utilizing the ZIF-8 and doped ZIF-8 photocatalysts. The photodegradation efficiency curves indicate that Fe@ZIF-8 exhibits superior photocatalytic activity in the degradation of MB, surpassing both ZIF-8 and Ni@ZIF-8. By contrast, Ni@ZIF-8 shows remarkable photocatalytic activity in the degradation of RhB compared to ZIF-8 and Ni@ZIF-8. Interestingly, the differences in photocatalytic efficacy of the synthesized samples are insignificant in the case of MB.
The kinetic analysis provides significant details on the reaction pathways in the treatment process employing nanoparticles in an aqueous solution.2e,44 Fig. S6(c and d)† illustrates the linear fitting plots of ln(C0 − Ct) = Kapp t for the as-prepared photocatalysts during the direct evaluations. The C0 and Ct represent the starting and final concentrations of the MB and RhB dyes, respectively. The photodegradation of the MB and RhB using the as-prepared materials follows the pseudo-first-order kinetic models, with the squared correlation coefficient (R2) of 0.96, 0.93, and 0.96 for the MB and 0.97, 0.99, and 0.89 for the RhB observed from their linear fitting plots (Fig. S6c and d†). The slope of the line fitting is denoted as the rate constant, k, in kinetics. Based on this study, the rate constant for the degradation of MB is 0.056, 0.070, and 0.048 min−1, while the rate constants of RhB degradation are determined to be 0.02, 0.016, and 0.039 min−1, respectively using ZIF-8, Fe@ZIF-8, and Ni@ZIF-8. As reported in the literature, the catalytic activity typically happens at the interface between the catalytic and dye materials.15a,45 This is why a catalyst with a higher surface-to-volume ratio performs better in photocatalysis. During reduction and oxidation reactions, photocatalytic degradation occurs mainly on the catalyst's surface.15a,45,46 Consequently, the active sites on the surface of photocatalysis become more accessible with the increment in the surface-to-volume ratio, resulting in a significant enhancement in the catalytic process. The outstanding Fe@ZIF-8 performance for MB and Ni@ZIF-8 for RhB can be attributed to their excellent surface-to-volume ratio when compared to the other catalysts.
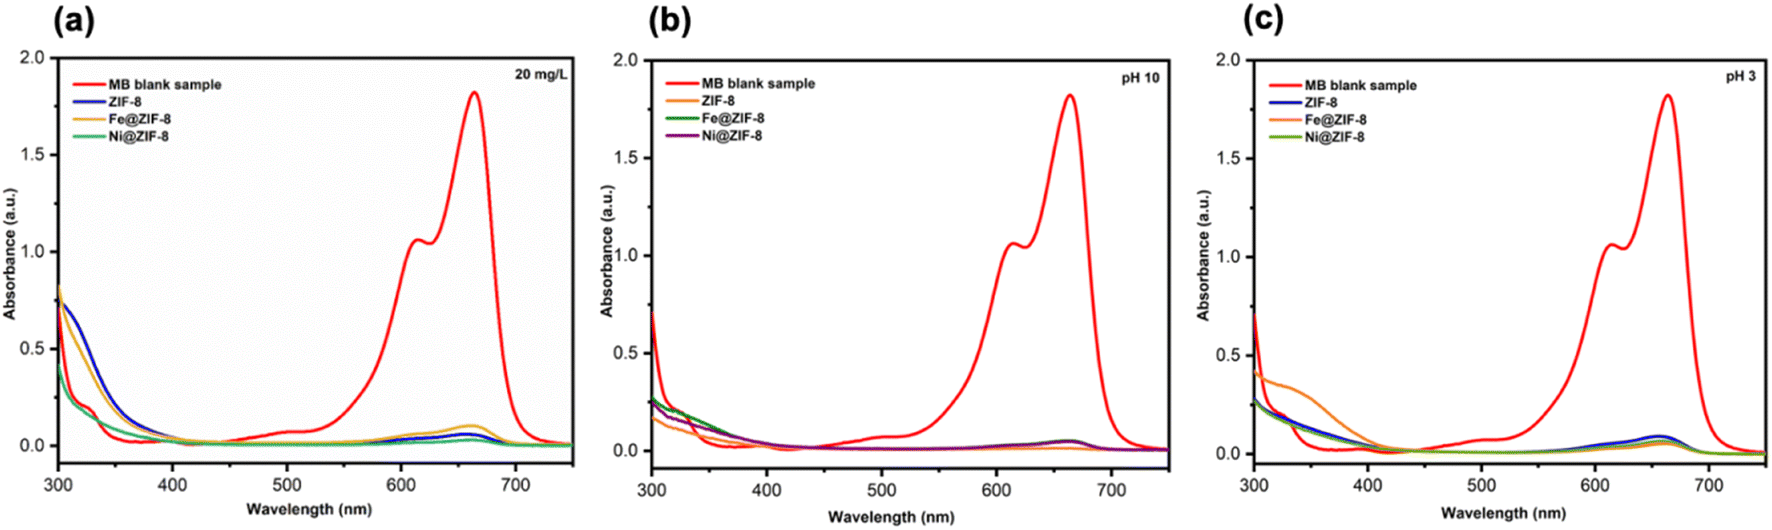 | ||
| Fig. 5 (a) UV-vis. Absorption of 20 mg L−1 MB−1 using prepared samples and UV-vis. Absorption of MB using prepared samples under (b) pH 10 and (c) pH 3. | ||
Furthermore, the impact of the pH value in the dye solution is a considerable concern as it is linked to the properties of surface charge for the as-prepared photocatalysts during the reaction on its surface.2e,48 The experiments were carried out at pH = 3 and 10 for MB using prepared photocatalysts under visible light irradiation, as displayed in the detailed results of Fig. 5(b and c). The absorbance spectra of the MB following 55 minutes of visible irradiations. In the presence of the prepared photocatalyst at pH 7 are shown in Fig. 4a–c. The inverse trend is found under pH = 10 along with the prepared photocatalyst, as seen in Fig. 5b. The 99% of MB dye removal is obtained using ZIF-8, Fe@ZIF-8, and Ni@ZIF-8 after 60, 35, and 45 minutes, respectively. Under the pH = 3, the MB degradation percentages are 95%, 97%, and 96% after 120, 80, and 90 min, respectively, in the presence of the prepared photocatalyst (Fig. 5c). Results show that pH = 7 and 11 enhances photocatalysis degradation of MB, leading to a more efficient and rapid generation of reactive oxygen species (ROS).2e,48
 | ||
| Fig. 6 (a) UV-vis. Absorption of MB and (b) MB photodegradation efficiency after 3rd cycle using Fe@ZIF-8, (c) X-ray diffraction pattern (XRD) after the 3rd cycle, (d) SEM of Fe@ZIF-8 after the 3rd cycle. | ||
| Fe@ZIF-8 + hv → Fe@ZIF-8 (e− + h+) | (3) |
| e− + O2− → ˙O2− | (4) |
| ˙O2− + H+ → ˙OOH | (5) |
| ˙OOH + H+ + e− → H2O2 | (6) |
| H2O2 + e− → ˙OOH + OH− | (7) |
| h+ + H2O → ˙OH + H+ | (8) |
| h+ + OH− → ˙OH | (9) |
| MB + Visible light → [MB]˙ | (10) |
| ˙OH + ˙O2− + [MB]˙ → H2O + CO2 + degradation products | (11) |
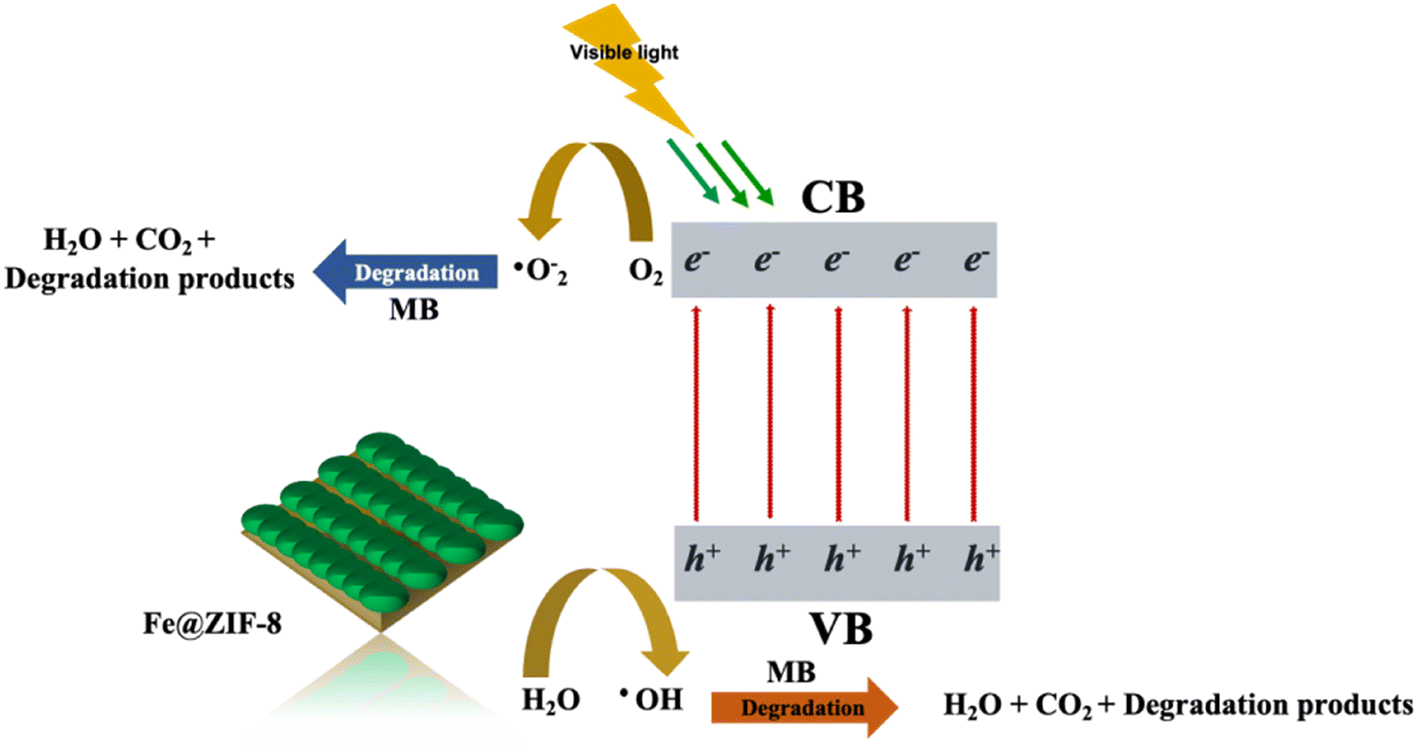 | ||
| Fig. 7 Schematic illustration of the mechanism suggested for photocatalytic degradation of MB by Fe@ZIF-8. | ||
4. Conclusion
In summary, for the first time, we reported an in situ thermal (IST) approach for synthesizing high-porosity and crystalline doped ZIF-8 in good yield without solvents, additives, and post-treatment or an activation process in a short reaction duration. Moreover, the IST approach has been proven to be a cost-effective technique because it is free of the challenges of removing guest molecules from the final product. The photocatalytic efficiency of prepared materials using the IST method has been confirmed for the degradation of concentrated MB and RhB under visible light exposure. Based on the experimental outcomes, we demonstrate that under the optimum conditions, 98.4% and 99.5% degradation of MB and RhB are observed using Fe@ZIF-8 and Ni@ZIF-8 after 55 and 120 min, respectively. After three successive cycles, the optimized Fe@ZIF-8 shows good stability, recyclability, and almost 93.5% MB removal. A quenching experiment was used to investigate a plausible mechanism for MB in Fe@ZIF-8, and the scavenger experiment revealed that ˙OH is the main radical for MB photolysis. The materials prepared using the IST method exhibit distinct advantages in chemical properties, giving rise to an improved photocatalytic performance.Consequently, this IST method for synthesizing doped MOFs does not require hazardous reagents or solvents. Also, it can produce porous materials with a high yield within a short period. Therefore, this IST method allows for the development of highly efficient and stable environmentally friendly metal–organic frameworks for commercializing energy and environmental applications.
Data availability
Data available on request from the authors.Author contributions
F. N. is responsible for conceptualization, methodology, experimentation, and original draft writing. C. H. M. is responsible for data curation. Z. W. is responsible for the experiment. H. T., S. P. S., M. D., J.-J. Kai, K.-C. C., C.-W. H., and W. N. are responsible for methods and validation. H.-Y. H. is responsible for supervision, funding acquisition, writing, and editing.Conflicts of interest
The authors confirm that they have no known conflicting financial interests or personal ties that might have influenced the work presented in this study.Acknowledgements
The authors acknowledge financial support from the Research Grants Council of Hong Kong (grant no. CityU 21203518 and F-CityU106/18), Innovation and Technology Commission (grant no. MHP/104/21), Shenzhen Science Technology and Innovation Commission (grant no. JCYJ20210324125612035, R-IND12303 and R-IND12304), City University of Hong Kong (grant no. 9229160, 9360140, 7005289, 7005580, 7005720, 9667213, 9667229, 9680331, 9052029 and 9678291), and National Natural Science Foundation of China (grant no. 51701159 and 21974131). Z. H thanks the National Key Research and Development Program of China (no. 2021YFA1500900) and the National Natural Science Foundation of China (no. 52071174).References
- (a) G. Karia, R. Christian and N. D. Jariwala, Wastewater treatment: Concepts and design approach, PHI Learning Pvt. Ltd., 2023 Search PubMed; (b) C. A. Richard, Z. Pan, H.-Y. Hsu, S. Cekli, K. S. Schanze and J. R. Reynolds, ACS Appl. Mater. Interfaces, 2014, 6, 5221–5227 CrossRef CAS; (c) L. Fu, K. Fu, X. Gao, S. Dong, B. Zhang, S. Fu, H.-Y. Hsu and G. Zou, Anal. Chem., 2021, 93, 2160–2165 CrossRef CAS; (d) X. Fu, T. He, S. Zhang, X. Lei, Y. Jiang, D. Wang, P. Sun, D. Zhao, H.-Y. Hsu and X. Li, Chem, 2021, 7, 3131–3143 CrossRef CAS; (e) H. Solayman, M. A. Hossen, A. Abd Aziz, N. Y. Yahya, K. H. Leong, L. C. Sim, M. U. Monir and K.-D. Zoh, J. Environ. Chem. Eng., 2023, 11, 109610 CrossRef CAS.
- (a) M. D. Khan, A. Singh, M. Z. Khan, S. Tabraiz and J. Sheikh, J. Water Process Eng., 2023, 53, 103579 CrossRef; (b) S. Rao, X. Zou, S. Wang, T. Shi, Y. Lu, L. Ji, H.-Y. Hsu, Q. Xu and X. Lu, J. Electrochem. Soc., 2019, 166, D427 CrossRef CAS; (c) S. Javaid, X. Xu, W. Chen, J. Chen, H.-Y. Hsu, S. Wang, X. Yang, Y. Li, Z. Shao, F. Jones and G. Jia, Nano Energy, 2021, 89, 106463 CrossRef CAS; (d) S. P. Santoso, S.-P. Lin, T.-Y. Wang, Y. Ting, C.-W. Hsieh, R.-C. Yu, A. E. Angkawijaya, F. E. Soetaredjo, H.-Y. Hsu and K.-C. Cheng, Int. J. Biol. Macromol., 2021, 175, 526–534 CrossRef CAS PubMed; (e) A. A. Abd El Khalk, M. A. Betiha, A. S. Mansour, M. G. Abd El Wahed and A. M. Al-Sabagh, ACS Omega, 2021, 6, 26210–26220 CrossRef CAS.
- X. Dong, Y. Lin, G. Ren, Y. Ma and L. Zhao, Colloids Surf., A, 2021, 608, 125578 CrossRef CAS.
- (a) M. Roy and R. Saha, Intelligent environmental data monitoring for pollution management, 2021, pp. 127–160 Search PubMed; (b) H. Wu, T. H. Tan, R. Liu, H.-Y. Hsu and Y. H. Ng, Solar RRL, 2021, 5, 2000423 CrossRef CAS; (c) C.-N. Wu, L.-C. Sun, Y.-L. Chu, R.-C. Yu, C.-W. Hsieh, H.-Y. Hsu, F.-C. Hsu and K.-C. Cheng, Food Chem., 2020, 330, 127244 CrossRef CAS PubMed; (d) M. S. Khan, Y. Li, D.-S. Li, J. Qiu, X. Xu and H. Y. Yang, Nanoscale Adv., 2023, 5, 6318–6348 RSC.
- C. K. Benny and S. Chakraborty, J. Environ. Manage., 2023, 331, 117213 CrossRef CAS PubMed.
- (a) T. Xia, Y. Lin, W. Li and M. Ju, Chin. Chem. Lett., 2021, 32, 2975–2984 CrossRef CAS; (b) X. Lei, M. You, F. Pan, M. Liu, P. Yang, D. Xia, Q. Li, Y. Wang and J. Fu, Chin. Chem. Lett., 2019, 30, 2216–2220 CrossRef CAS; (c) H.-Y. Hsu, H.-H. Hsieh, H.-Y. Tuan and J.-L. Hwang, Sol. Energy Mater. Sol. Cells, 2010, 94, 955–959 CrossRef CAS; (d) X. Yang, J. Yang, M. I. Ullah, Y. Xia, G. Liang, S. Wang, J. Zhang, H.-Y. Hsu, H. Song and J. Tang, ACS Appl. Mater. Interfaces, 2020, 12, 42217–42225 CrossRef CAS PubMed; (e) A. Andreas, Z. G. Winata, S. P. Santoso, A. E. Angkawijaya, M. Yuliana, F. E. Soetaredjo, S. Ismadji, H.-Y. Hsu, A. W. Go and Y.-H. Ju, J. Mol. Liq., 2021, 329, 115579 CrossRef CAS; (f) K. Tanji, I. El Mrabet, Y. Fahoul, I. Jellal, M. Benjelloun, M. Belghiti, M. El Hajam, Y. Naciri, A. El Gaidoumi and B. El Bali, J. Water Process Eng., 2023, 53, 103682 CrossRef.
- A. Fujishima and K. Honda, Nature, 1972, 238, 37–38 CrossRef CAS.
- C. Dong, J. Ji, Z. Yang, Y. Xiao, M. Xing and J. Zhang, Chin. Chem. Lett., 2019, 30, 853–862 CrossRef CAS.
- F. De Andrade, G. De Lima, R. Augusti, M. Coelho, J. Ardisson and O. Romero, Chem. Eng. J., 2012, 180, 25–31 CrossRef CAS.
- J. Miao, H. B. Lu, D. Habibi, M. H. Khiadani and L. C. Zhang, Clean:Soil, Air, Water, 2015, 43, 1037–1043 CAS.
- H. Liang, P. Hua, Y. Zhou, Z. Fu, J. Tang and J. Niu, Chin. Chem. Lett., 2019, 30, 2245–2248 CrossRef CAS.
- G. Li, X. Nie, Y. Gao and T. An, Appl. Catal., B, 2016, 180, 726–732 CrossRef CAS.
- Y. Xue, Q. Chang, X. Hu, J. Cai and H. Yang, J. Environ. Manage., 2020, 274, 111184 CrossRef CAS PubMed.
- (a) F. Wang, J. Xu, Z. Wang, Y. Lou, C. Pan and Y. Zhu, Appl. Catal., B, 2022, 312, 121438 CrossRef CAS; (b) S. Rao, X. Zou, S. Wang, Y. Lu, T. Shi, H.-Y. Hsu, Q. Xu and X. Lu, Mater. Chem. Phys., 2019, 232, 6–15 CrossRef CAS; (c) H.-Y. Hsu, L. Ji, C. Zhang, C. H. Mak, R. Liu, T. Wang, X. Zou, S.-Y. Leu and E. T. Yu, J. Mater. Chem. C, 2018, 6, 11552–11560 RSC; (d) R. Liu, C. H. Mak, X. Han, Y. Tang, G. Jia, K.-C. Cheng, H. Qi, X. Zou, G. Zou and H.-Y. Hsu, J. Mater. Chem. A, 2020, 8, 23803–23811 RSC; (e) F. Meng, Y. Jia, J. Wang, X. Huang, Z. Gui, L. Huang, R. Li, R. Chen, J. Xu, W. Chen, Z. He, H.-Y. Hsu, E. Zhu, G. Che and H.-L. Wang, Solar RRL, 2019, 3, 1900319 CrossRef CAS; (f) H. B. Truong, B. T. Huy, Y.-I. Lee, H. T. Nguyen, J. Cho and J. Hur, Chem. Eng. J., 2023, 453, 139777 CrossRef CAS.
- (a) I. Rabani, M. S. Tahir, F. Afzal, H. B. Truong, M. Kim and Y.-S. Seo, J. Environ. Chem. Eng., 2023, 11, 109235 CrossRef CAS; (b) Z. Chen, H.-Y. Hsu, M. Arca and K. S. Schanze, J. Phys. Chem. B, 2015, 119, 7198–7209 CrossRef CAS PubMed; (c) H.-Y. Hsu, L. Ji, M. Du, J. Zhao, T. Y. Edward and A. J. Bard, Electrochim. Acta, 2016, 220, 205–210 CrossRef CAS; (d) C. H. Mak, X. Huang, R. Liu, Y. Tang, X. Han, L. Ji, X. Zou, G. Zou and H.-Y. Hsu, Nano Energy, 2020, 73, 104752 CrossRef CAS; (e) J. Abdi, Colloids Surf., A, 2020, 604, 125330 CrossRef CAS.
- A. R. Millward and O. M. Yaghi, J. Am. Chem. Soc., 2005, 127, 17998–17999 CrossRef CAS.
- M. Jia, Y. Feng, S. Liu, J. Qiu and J. Yao, J. Membr. Sci., 2017, 539, 172–177 CrossRef CAS.
- P. Horcajada, T. Chalati, C. Serre, B. Gillet, C. Sebrie, T. Baati, J. F. Eubank, D. Heurtaux, P. Clayette and C. Kreuz, Nat. Mater., 2010, 9, 172–178 CrossRef CAS.
- L. E. Kreno, K. Leong, O. K. Farha, M. Allendorf, R. P. Van Duyne and J. T. Hupp, Chem. Rev., 2012, 112, 1105–1125 CrossRef CAS PubMed.
- (a) F. Naz, M. Ciprian, B. Mousavi, S. Chaemchuen, M. Zhu, S. Yan and F. Verpoort, Eur. Polym. J., 2021, 142, 110127 CrossRef CAS; (b) C. H. Mak, R. Liu, X. Han, Y. Tang, X. Zou, H. H. Shen, Y. Meng, G. Zou and H. Y. Hsu, Adv. Opt. Mater., 2020, 8, 2001023 CrossRef CAS; (c) C. H. Mak, X. Han, M. Du, J.-J. Kai, K. F. Tsang, G. Jia, K.-C. Cheng, H.-H. Shen and H.-Y. Hsu, J. Mater. Chem. A, 2021, 9, 4454–4504 RSC; (d) Y. Peng, C. H. Mak, J.-J. Kai, M. Du, L. Ji, M. Yuan, X. Zou, H.-H. Shen, S. P. Santoso, J. C. Colmenares and H.-Y. Hsu, J. Mater. Chem. A, 2021, 9, 26628–26649 RSC; (e) Y. Tang, C. H. Mak, R. Liu, Z. Wang, L. Ji, H. Song, C. Tan, F. Barrière and H. Y. Hsu, Adv. Funct. Mater., 2020, 2006919 CrossRef CAS; (f) F. Naz, M. Ciprian, Z. Luo, S. Yan, S. Z. Iqbal, M. Zhu, S. Chaemchuen and F. Verpoort, Chem. Afr., 2021, 1–9 CAS.
- (a) W. Pei, J. Zhang, H. Tong, M. Ding, F. Shi, R. Wang, Y. Huo and H. Li, Appl. Catal., B, 2021, 282, 119575 CrossRef CAS; (b) J. Qin, S. Wang and X. Wang, Appl. Catal., B, 2017, 209, 476–482 CrossRef CAS.
- F. Naz, F. Mumtaz, S. Chaemchuen and F. Verpoort, Catal. Lett., 2019, 149, 2132–2141 CrossRef CAS.
- H.-P. Jing, C.-C. Wang, Y.-W. Zhang, P. Wang and R. Li, RSC Adv., 2014, 4, 54454–54462 RSC.
- A. F. Gross, E. Sherman and J. J. Vajo, Dalton Trans., 2012, 41, 5458–5460 RSC.
- Y.-R. Lee, J. Kim and W.-S. Ahn, Korean J. Chem. Eng., 2013, 30, 1667–1680 CrossRef CAS.
- (a) Y.-R. Lee, M.-S. Jang, H.-Y. Cho, H.-J. Kwon, S. Kim and W.-S. Ahn, Chem. Eng. J., 2015, 271, 276–280 CrossRef CAS; (b) F. Lorignon, A. Gossard and M. Carboni, Chem. Eng. J., 2020, 393, 124765 CrossRef CAS; (c) Y. Tang, C. H. Mak, G. Jia, K.-C. Cheng, J.-J. Kai, C.-W. Hsieh, F. Meng, W. Niu, F.-F. Li, H.-H. Shen, X. Zhu, H. M. Chen and H.-Y. Hsu, J. Mater. Chem. A, 2022, 10, 12296–12316 RSC; (d) Y. Tang, C. H. Mak, J. Zhang, G. Jia, K.-C. Cheng, H. Song, M. Yuan, S. Zhao, J.-J. Kai, J. C. Colmenares and H.-Y. Hsu, Adv. Mater., 2023, 35, 2207835 CrossRef CAS PubMed; (e) C. H. Mak, Y. Peng, M. H. Chong, L. Yu, M. Du, L. Ji, X. Zou, G. Zou, H.-H. Shen and S. P. Santoso, J. Mater. Chem. C, 2023, 11, 11303–11311 RSC; (f) Y. Tang, C. H. Mak, C. Wang, Y. Fu, F.-F. Li, G. Jia, C.-W. Hsieh, H.-H. Shen, J. C. Colmenares, H. Song, M. Yuan, Y. Chen and H.-Y. Hsu, Small Methods, 2022, 6, 2200326 CrossRef CAS PubMed; (g) J. Wang, S. Chaemchuen, N. Klomkliang and F. Verpoort, Cryst. Growth Des., 2021, 21, 5349–5359 CrossRef CAS.
- M. Dahl, Y. Liu and Y. Yin, Chem. Rev., 2014, 114, 9853–9889 CrossRef CAS PubMed.
- J. Wang, L. Yuan, P. Zhang, J. Mao, J. Fan and X. L. Zhang, Nanoscale, 2024, 7323–7340 RSC.
- (a) K. Li, N. Miwornunyuie, L. Chen, H. Jingyu, P. S. Amaniampong, D. Ato Koomson, D. Ewusi-Mensah, W. Xue, G. Li and H. Lu, Sustainability, 2021, 13, 984 CrossRef CAS; (b) Y. Zhou, Y. Wang, Z. Chen, H. Gong, L. Chen and H. Yu, J. Phys. Chem. C, 2023, 127, 7184–7196 CrossRef CAS; (c) O. Assila, N. Vilaça, A. R. Bertão, A. M. Fonseca, P. Parpot, O. S. Soares, M. F. Pereira, F. Baltazar, M. Bañobre-López and I. C. Neves, Chemosphere, 2023, 339, 139634 CrossRef CAS PubMed; (d) Z. M. Lighvan, S. R. Hosseini, S. Norouzbahari, B. Sadatnia and A. Ghadimi, Fuel, 2023, 351, 128991 CrossRef; (e) A. Paul, I. K. Banga, S. Muthukumar and S. Prasad, ACS Omega, 2022, 7, 26993–27003 CrossRef CAS PubMed; (f) E. M. Khudhair, Y. S. Kareem, S. H. Ammar and A. S. Mahdi, Mater. Today: Proc., 2023 DOI:10.1016/j.matpr.2023.04.058.
- L. Hu, L. Chen, X. Peng, J. Zhang, X. Mo, Y. Liu and Z. Yan, Microporous Mesoporous Mater., 2020, 299, 110123 CrossRef CAS.
- B. Wang, A. P. Côté, H. Furukawa, M. O'Keeffe and O. M. Yaghi, Nature, 2008, 453, 207–211 CrossRef CAS PubMed.
- F. Adar, Spectroscopy, 2014, 29 Search PubMed.
- G. Kumari, K. Jayaramulu, T. K. Maji and C. Narayana, J. Phys. Chem. A, 2013, 117, 11006–11012 CrossRef CAS PubMed.
- J.-B. Lin, R.-B. Lin, X.-N. Cheng, J.-P. Zhang and X.-M. Chen, Chem. Commun., 2011, 47, 9185–9187 RSC.
- (a) S. Sharma, K. Sudarshan, A. Yadav, S. Jha, D. Bhattacharyya and P. Pujari, J. Phys. Chem. C, 2019, 123, 22273–22280 CrossRef CAS; (b) S. Bhattacharyya, S. H. Pang, M. R. Dutzer, R. P. Lively, K. S. Walton, D. S. Sholl and S. Nair, J. Phys. Chem. C, 2016, 120, 27221–27229 CrossRef CAS.
- (a) M. T. Thanh, T. V. Thien, P. D. Du, N. P. Hung and D. Q. Khieu, J. Porous Mater., 2018, 25, 857–869 CrossRef CAS; (b) B. Shen, B. Wang, L. Zhu and L. Jiang, Nanomaterials, 2020, 10, 1636 CrossRef CAS PubMed.
- S.-W. Lv, J.-M. Liu, N. Zhao, C.-Y. Li, Z.-H. Wang and S. Wang, New J. Chem., 2020, 44, 1245–1252 RSC.
- P. Liu, S. Liu and S.-W. Bian, J. Mater. Sci., 2017, 52, 12121–12130 CrossRef CAS.
- Z. Fu, J. Hu, W. Hu, S. Yang and Y. Luo, Appl. Surf. Sci., 2018, 441, 1048–1056 CrossRef CAS.
- J. Ju and W. Chen, Biosens. Bioelectron., 2014, 58, 219–225 CrossRef CAS PubMed.
- S. Goyal, M. S. Shaharun, C. F. Kait and B. Abdullah, J. Phys.: Conf. Ser., 2018, 1123, 012062 CrossRef.
- V. Jeyalakshmi, R. Mahalakshmy, K. Krishnamurthy and B. Viswanathan, Indian J. Chem., 2012, 1263–1283 CAS.
- H. Mallah, D. Naoufal, A. Safa and M. El-Jamal, Port. Electrochim. Acta, 2013, 31, 185–193 CrossRef.
- É. C. Lima, M. A. Adebayo and F. M. Machado, Carbon nanomaterials as adsorbents for environmental and biological applications, 2015, pp. 33–69 Search PubMed.
- S. Dey, S. Das and A. K. Kar, Mater. Chem. Phys., 2021, 270, 124872 CrossRef CAS.
- Q. Wan, T. Wang and J. Zhao, Appl. Phys. Lett., 2005, 87 Search PubMed.
- (a) M. Shaban, A. M. Ahmed, N. Shehata, M. A. Betiha and A. M. Rabie, J. Colloid Interface Sci., 2019, 555, 31–41 CrossRef CAS PubMed; (b) L. Yang, L. Xu, X. Bai and P. Jin, J. Hazard. Mater., 2019, 365, 107–117 CrossRef CAS PubMed.
- M. F. Hanafi and N. Sapawe, Mater. Today: Proc., 2020, 31, 272–274 CAS.
- T. V. Tran, M. Alsaiari, F. A. Harraz, W. Nabgan, D. T. D. Nguyen and C. V. Nguyen, Water, 2023, 15, 2186 CrossRef CAS.
Footnote |
| † Electronic supplementary information (ESI) available. See DOI: https://doi.org/10.1039/d4lf00410h |
| This journal is © The Royal Society of Chemistry 2025 |