 Open Access Article
Polymer-based solid electrolyte interphase for stable lithium metal anodes†
Martino
Airoldi
a,
José Augusto
Berrocal
 ab,
Ilja
Gunkel
 a and
Ullrich
Steiner
 *a
*a
aAdolphe Merkle Institute, University of Fribourg, Chemin des Verdiers 4, 1700 Fribourg, Switzerland. E-mail: ullrich.steiner@unifr.ch
bInstitute of Chemical Research of Catalonia (ICIQ), Barcelona Institute of Science and Technology (BIST), Av. da Països Catalans 16, 43007 Tarragona, Spain
First published on 9th December 2024
Abstract
The uncontrolled formation of a heterogeneous solid electrolyte interphase (SEI) and the growth of dendrites prevent the use of lithium metal anodes in Li-ion batteries. Possible strategies addressing these problems involve the formation of passivation surface coatings on the electrode. This study introduces a surface passivation strategy based on a covalently attached polymer coating to a hydroxide-modified lithium metal surface. The designed layer establishes a homogeneous and ion-permeable artificial SEI layer that is more stable than the untreated lithium metal anode, effectively preventing dead lithium aggregates and dendritic growth.
Introduction
It has long been established that lithium metal is the optimal anode for lithium-ion batteries (LIBs). Specifically, the low density, 0.534 g cm−3, and low atomic weight, combined with the lowest reduction potential, 3.3044 V vs. standard calomel electrode (SCE), optimize the energy-to-weight ratio. The light weight and the specific capacity of 3860 mA h g−1 maximize the stored energy per unit mass.1–3 Therefore, metallic lithium is identified as the quintessential candidate driving the research of high energy density electrode materials.4–6Despite the advantages, the intrinsically irreversible phenomena that occur during electrochemical cycling can lead to uncontrolled heating of the organic liquid electrolyte. The resulting thermal runaway promotes the evaporation of the organic liquid electrolyte, greatly accelerating capacity fading, and poses a serious risk of self-ignition and explosion. In addition, factors such as the effect of deep charge–discharge cycles on the cyclable capacity and the influence of current density further exacerbate these safety concerns. Taken together, these issues critically compromise the large-scale operational safety of lithium metal anode batteries and present significant barriers to their commercialization.7,8 The leading explanation for this phenomenon is the morphological instability of lithium stripping and plating during the electrochemical cycling of the battery, leading to dendrite formation at locations where the electrolyte is in direct contact with the lithium metal.9–13 However, irreversible chemical side reactions form a solid electrolyte interphase (SEI), separating lithium metal from the organic electrolyte. While SEI formation can, in principle, prevent dendrite formation, these layers are often brittle and fracture during electrochemical cycling, caused by the substantial volume fluctuations arising from the repetitive lithium stripping and plating. The emerging cracks in the SEI expose lithium metal and may enhance the formation of dendritic structures. Alternatively, the perpetual generation of new SEI at crack locations consumes the electrolyte and gradually thickens the passivation layer, impeding the diffusion of lithium ions to the metal anode. The accumulation of inactive lithium deposits leads to the capacity fading of the electrochemical cell over time.14,15
One approach to enable the employment of lithium metal anodes in rechargeable batteries relies on forming a robust SEI that is stable during the electrochemical cycling of the electrode. The main approaches to achieve this rely on the composition of the liquid electrolyte through the design of the carrier liquid electrolyte, the choice of lithium salts, or electrolyte doping with additives.16–22 Electrolyte additives can neutralize the byproducts formed when the salt-doped electrolyte solution breaks down. Since the degradation products are directly tied to the corrosion of the lithium metal at the electrode interface, giving rise to the above-described SEI formation, suppression of the SEI chemistries stabilizes an initially formed, thin SEI during electrochemical cycling, avoiding the problems caused by unstable SEIs. Despite this strategy's apparent simplicity and ease, controlling the homogeneity of the SEI during its natural formation is complex.
In a second approach, improved control over the SEI composition is achieved by forming an artificial SEI layer on the electrode surface before the battery is assembled. This thin SEI layer protects the electrode by regulating ion diffusion and preventing electrolyte contact, ensuring electrochemical stability. The produced layer should not thicken during electrochemical cycling, as this hampers ion transport, causing capacity fading. Although the mechanism and composition of SEI formation remain unresolved due to the complexity of the reduction reactions during the electrolyte degradation, the formation of an artificial, controlled SEI on the electrode surface promotes homogeneity in the chemical composition, enhancing the stability of the layer and its cyclability.23,24 Several strategies were explored, ranging from the use of inorganic layers,25–29 to organic-based passivation films,30–36 and more complex artificial SEI (ASEI) layers synthesized at the surface of the lithium metal anode.37–41 Inorganic-based SEI layers possess better compatibility with the lithium metal anode. They prevent volume expansion upon plating of lithium ions. However, their characteristic rigidity can cause cracks during charge–discharge cycling, which can lead to the above-mentioned problems. Polymer-based films enhance elasticity and self-healing properties, promoting long-lasting passivation layer protection. However, their low modulus fails to prevent dendrite formation and protrusion.42,43 Controlling the lithium plating44 by structuring the electrode with a porous,45 hierarchical,46–48 or lithiophilic49,50 layer is promising to improve the electrochemical performance and safety. This method efficiently prevents the formation and growth of dendritic morphologies.
This study explores an alternative approach to passivate the lithium metal surface by covering it with a statistical copolymer brush. Our protocol entails a two-step process. First, an lithium hydroxide inorganic layer is created on the metal surface. Next, a poly(styrene-r-methyl methacrylate) P(S-r-MMA) statistical block copolymer brush is covalently bonded to the lithium hydroxide, serving as an artificial SEI layer.
The selection of the statistical brush is driven by the ability of the methyl methacrylate monomer unit to assist in lithium-ion diffusion by acting as a lithium-ion bridge, allowing their migration through the interfacial layer into the electrolyte.51,52 Moreover, the brush's high Tg of 81 °C aims to provide rigidity of this SEI layer, and the presence of a carboxylic acid end group allows for a library of end group modifications, enabling the control of interfacial interaction of the brush with the electrode. Our study focuses on the isocyanate chemistry to anchor the organic molecule to the lithium surface. The advantage of employing isocyanate chemistry lies in the selective reaction between the polymer and the lithium substrate, which proceeds without generating byproducts. In contrast, the commonly employed protocols for surface functionalization, for instance, siloxane chemistry, produce byproducts that can react with the lithium metal surface, affecting the homogeneity of the artificial SEI layer. Our protocol does not rely on sterically hindered intermediates acting as linkers for selective brush attachment and does not necessitate catalysts either to promote the attachment reaction or to initiate the in situ polymerization of the polymer onto the surface.53–55
Results and discussion
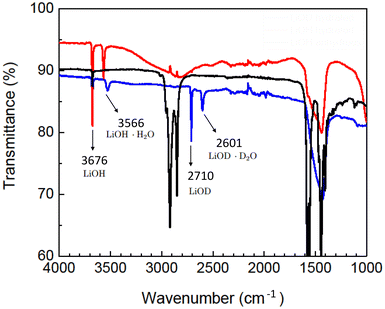
We investigated the isocyanate-driven reaction of a P(S-r-MMA) copolymer brush (Mn = 4 kg mol−1, Mw = 6 kg mol−1, PDI = 1.50, PS molar fraction = 58%) with hydroxide surfaces of metallic lithium electrodes.Lithium hydroxide on the surface of lithium metal electrodes was formed by exposure to water vapors. Exposing lithium metal to a carefully adjusted water partial vapor pressure enables control over the exothermic reaction leading to the formation of the hydrated lithium hydroxide, Li(s) + H2O(g) → LiOH·nH2O(s) + H2(g).56 Fourier transform infrared (FT-IR) spectroscopy confirms the hydroxide formation on lithium metal, Fig. 1. Lithium hydroxide formation is characterized by the stretching mode of LiOH, νOH, which corresponds to the peak at 3676 cm−1 (ref. 57) and persists across all FT-IR spectra. Table 1 compares the peaks of the FT-IR spectra of all substrates after reaction with water, deuterated water, and after thermal treatment. The peak at 3566 cm−1 arises from the hydration of the lithium hydroxide layer caused by its hygroscopic nature. Interestingly, deuterated water as a reagent provides insights into the hydration composition. Hydration traces are present in both hydrogenated and deuterated water treated lithium substrates but are absent in the thermally treated samples, confirmed by the suppression of the peak at 3566 cm−1. Reacting the lithium metal surface with deuterated water gives rise to the appearance of a new set of peaks at 2710 cm−1 and 2601 cm−1, the stretching modes of LiOD and LiOD·D2O, respectively.57 The minor deviations of the measured FT-IR signals from the literature reference stem from inhomogeneities in the surface chemical composition, giving rise to competing reactions with the lithium metal substrate.
| Sample | LiOH | LiOH·H2O | LiOD | LiOD·D2O |
|---|---|---|---|---|
| Li metal + H2O | 3676 | 3566 | — | — |
| Li metal + D2O | 3676 | 3527 | 2710 | 2601 |
| LiOH anhydrous | 3676 | — | — | — |
| Reference study57 | 3676 | 3564 | 2709 | 2630 |
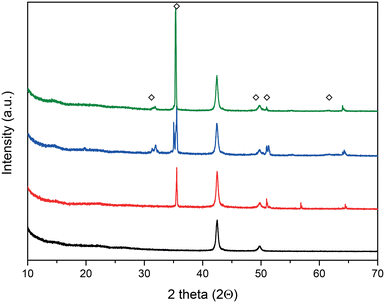
X-ray diffraction (XRD) analysis was employed to characterize the formation of the crystalline LiOH layer. Fig. 2 shows the scattering angles, 2Θ, of 31.9°, 35.32°, 49.6°, 51.04°, and 61.48° in agreement with the tabulated values for the LiOH phase.58
Scanning electron microscopy (SEM) allows the comparison of the pristine lithium metal surface with the water-treated substrate, as shown in Fig. 3. After water treatment, the hydroxide layer was ca. 40 μm thick.
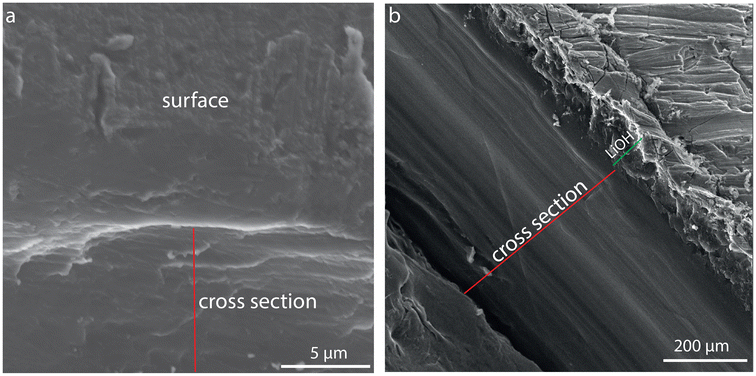 | ||
| Fig. 3 Cross-sectional SEM images of an as-received lithium metal substrate (a) and after forming a LiOH layer (b). The red line marks the cross-section, and the green line indicates the LiOH layer. | ||
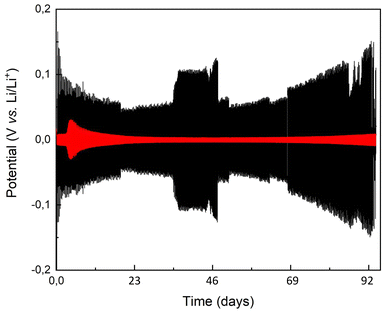
The galvanostatic cycling (GC) experiment enables the assessment of the Li+ permeability and electrochemical stability of the LiOH-covered electrode with respect to metallic lithium. GC traces of pristine and LiOH-covered lithium electrodes in symmetric cells are shown in Fig. 4. The symmetric cell utilizing LiOH-covered lithium electrodes exhibits a lower polarization response in comparison to the cell employing pristine lithium electrodes, indicating a reduced resistance for the bidirectional diffusion of lithium ions into and out of the lithium electrodes during the cycling lifetime.14 The observed increase in potential during galvanostatic cycling stems from the deposition of electrolyte decomposition byproducts on the electrode surface, which form a solid electrolyte interface. This layer obstructs ion diffusion, impedes the movement of dissolved species, and promotes the establishment of concentration gradients, adversely affecting the overall electrochemical behavior. The altered kinetics of charge transfer reactions consequently influence the electrode's working potential. Furthermore, mechanical stresses induced by cycling can lead to structural changes such as cracking, causing potential fluctuations during electrochemical cycling. Achieving precise control over the thickness of the LiOH layer remains a challenge, with the formation of extremely thin layers proving difficult using the proposed method. However, the observed electrode performance indicates that this limitation is not critical. The synergistic effects of the mechanical stiffness provided by the thicker layer and the sufficient diffusion of lithium ions through it do not seem to adversely affect the functionality.
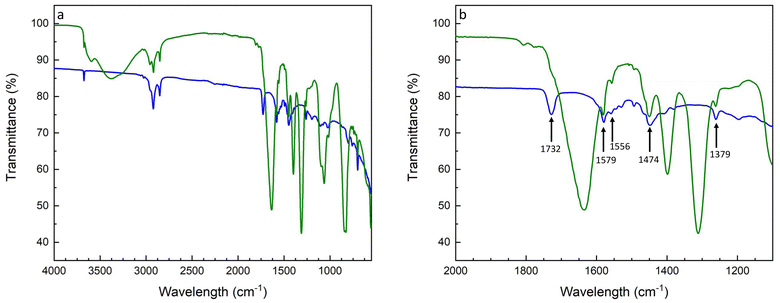
Next, a statistical P(S-r-MMA) copolymer brush was grafted onto the hydroxide-modified lithium substrate. Prior to the branching reaction, the copolymer end group was converted from a carboxylic acid to an isocyanate. The protocol is described in the Experimental section, and the characterization of the end group is shown in Fig. S1 and S2.† The presence of the polymer coating was demonstrated by XRD, as shown in Fig. S3.† The observed attenuation of the scattering peaks in the diffractogram of the brush-covered lithium metal can be attributed to the presence of both the brush layer and the surface layer. The latter is not exclusively composed of the pure LiOH crystalline phase but likely includes a new mixed organic-metallic phase that interacts with and potentially interferes with the underlying structure. The resulting urethane bond was characterized by FT-IR spectroscopy, as shown in Fig. 5. The isocyanate end-group stretching signal, νNCO, at 2262 cm−1 is absent after the reaction with the lithium hydroxide surface, indicating the complete conversion of the isocyanate reagent, Fig. 5a. The formation of the urethane group after the reaction appears in the amide region of the FT-IR spectrum, Fig. 5b. The carbonyl stretching signal is mainly seen in the amide I region, 1600–1700 cm−1. Between 1480 and 1580 cm−1, the amide II region combines the N–H in-plane bending and C–N stretching signals. The amide III region combines various vibrational modes and covers signals between 1300 and 1450 cm−1.59
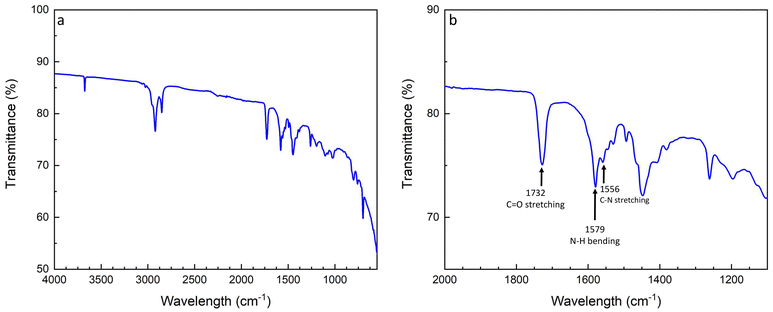 | ||
| Fig. 5 FT-IR spectra of the P(S-r-MMA) isocyanate reaction to the lithium hydroxide substrate (a) and zoom into the amide characterization region to confirm the conversion reaction (b). | ||
The covalent bond was confirmed by comparison of the amide region of the carbonyl stretching signal at 1732 cm−1, the N–H bending and C–N stretching signals at 1579 cm−1 and 1556 cm−1, respectively, and the amide III signals from 1474 cm−1 to 1379 cm−1. The overlap of the signals confirms the progress of the conversion. Moreover, the high selectivity of the reaction is indicated by the ubiquitous presence of the urethane carbonyl signal, without traces arising from parasitic reactions leading to allophanate or biuret-type side products.
Water contact angle measurements were used to characterize the presence of the brush, providing insight into the surface polarity of the lithium substrate. The intrinsic reactivity of lithium metal posed a challenge to the use of many polar solvents that are typically effective for the brush. To maintain the integrity of the electrode, benzene was chosen as the solvent during the casting process and no further rinsing was performed. In addition, the stability of the brush-covered lithium substrate to water (Fig. 6c) compared to the high reactivity of metallic lithium to water (Fig. 6a) serves as a powerful illustration of the presence of the brush.
To demonstrate that the reactivity of the substrate does not affect the measurement of Fig. 6c, a similar measurement was performed on a P(S-r-MMA) brush grafted onto an inert, oxide-covered silicon wafer. The similar contact angle values observed on the P(S-r-MMA) brush-coated silicon wafer of 89.7° ± 3.08° and the brush-coated lithium surface of 89.7° ± 2.15° show the passivating effect of the brush, which completely inhibits surface reactivity. The water contact angle measurements thus served a dual purpose, by (1) quantifying the brush formation on the lithium substrate and (2) demonstrating the enhanced stability of the electrode against polar molecules.
Fig. 7, shows the pristine and the copolymer-covered lithium electrode plating and stripping CV signals, permitting insights into the polymer layer properties and its function as an artificial SEI with a commercial liquid electrolyte.
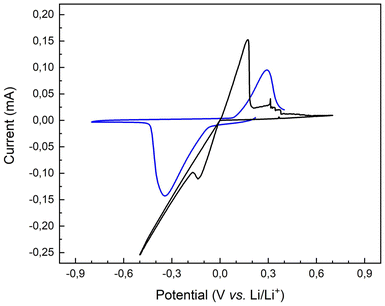 | ||
| Fig. 7 Cyclic voltammetry traces of a pristine lithium surface (black trace) and a P(S-r-MMA)-covered lithium substrate (blue trace). | ||
The oxidation and reduction peaks migrate to higher and lower voltages, respectively, compared to the pristine lithium substrate. The change in potential caused by the polymer layer is related to the different energies required to insert or extract electrons into/from of the corresponding molecular orbital. The representation and evolution of the highest occupied molecular orbital (HOMO) and the lowest unoccupied molecular orbital (LUMO) energy levels for both pristine and brush-covered lithium chips are shown in Fig. S4.†
EIS analysis of the copolymer-covered lithium substrates was also performed. Fig. 8 shows a Nyquist plot of the copolymer-covered electrode, red trace, with a resistance of 880 Ω. The interfacial resistance of the polymer brush-covered Li–metal substrate is increased compared to the pristine Li–metal electrode (ca. 200 Ω, cf. Fig. S5†). After electrochemical cycling of the same sample, the Nyquist plot shows a further increase in surface resistance to 1800 Ω.
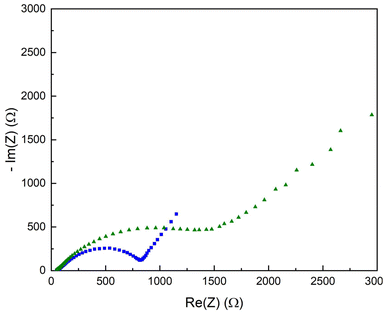 | ||
| Fig. 8 Nyquist plot of the P(S-r-MMA) copolymer covered lithium substrate before (blue squares) and after (green triangles) electrochemical cycling. | ||
The rise in the resistance is related to changes in the electrode interfacial layer, namely the growth in thickness and changing composition. The resistance increase is rooted in the instability of the liquid electrolyte relative to the electrochemical cell's low working potential, even though the metallic lithium electrode has been passivated. The breakdown of the liquid electrolyte produces insoluble byproducts that accumulate on the electrode surface, altering the electrochemical properties of the artificial SEI layer.
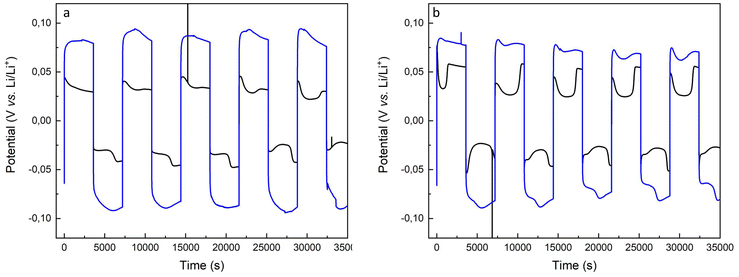
Fig. 9 shows several charge and discharge cycles of the pristine lithium anode and the copolymer-covered electrode. The GC plots illustrate the diffusion of lithium ions across both the pristine lithium and brush-covered electrode surfaces. The increase in potential compared to the pristine and brush-covered electrodes is attributed to the increased resistive interfacial layer, which is consistent with the Nyquist plots in Fig. 8 and S5.†
The dynamic evolution of the lithium-ion concentration directly affects the interfacial kinetics and results in changes in the cell polarization due to the lithium surface morphology evolution, i.e., dendrite formation, and dead lithium aggregates. The variation of the heterogeneous kinetic rate constant, which depends on the electrode morphology along the electrode/electrolyte interphase polarization, is the determining factor in the shape of the potential response, creating a well-peaked profile.9
In contrast, the brush coverage of the lithium electrode creates a tortuous path for lithium ions to diffuse across the electrode/electrolyte interfacial region, resulting in a variation in the diffusion coefficient.
A significant concentration gradient must be established when using brush-covered electrodes to sustain lithium ion transport across the interfacial layer. As the interfacial Li concentration changes, the electrode overpotential increases, corresponding to the arc shape of the black trace in the voltage profile, Fig. 9a.
The arc behavior is lost upon an increase in the current intensity. Instead, a well-shaped pattern appears, arising from the assisted diffusion of the ions. The potential drop of the well is less pronounced in brush-covered surfaces compared to pristine lithium electrodes, black vs. red traces in Fig. 9b.60,61 Further increases in current intensity are detrimental to the stability of the brush-passivated lithium electrode, leading to an enhancement of the well-shape in the potential response, Fig. S6.† The datasets provided represent cycling experiments performed under conditions designed to reveal variations in cyclability with increasing current density. Although the current charge and discharge levels provide valuable insight into the enhanced stability of the SEI, we recognize that testing with deeper charge and discharge cycles would provide a more thorough assessment of its effectiveness. Future research will investigate the performance of the artificial SEI under higher capacity conditions and in full-cell configurations to further establish its durability and practical significance.
The resilience of the copolymer brush on the lithium electrode after galvanostatic cycling (Fig. S7†) was confirmed by postmortem FT-IR analysis, Fig. 10. The spectrum of the brush-covered electrode after cycling in Fig. 10 shows pronounced peaks arising from degradation byproducts of the liquid electrolyte. The broad signal at 3379 cm−1 conforms with several functional groups, including amine stretching and hydroxyl groups associated with either carboxylic acid or alcohol. The sharp signals at 1637, 1397, and 1310 cm−1 are associated with alkene stretching, carbon–hydrogen bending, and alcohol bending.
Fig. 10b contains information about brush retention after cycling. The preservation of the peaks at 1732, 1579, 1556, 1474, and 1379 cm−1, highlighted by arrows, stem from the urethane bond of the brush, confirming its stability during charge and discharge cycling.
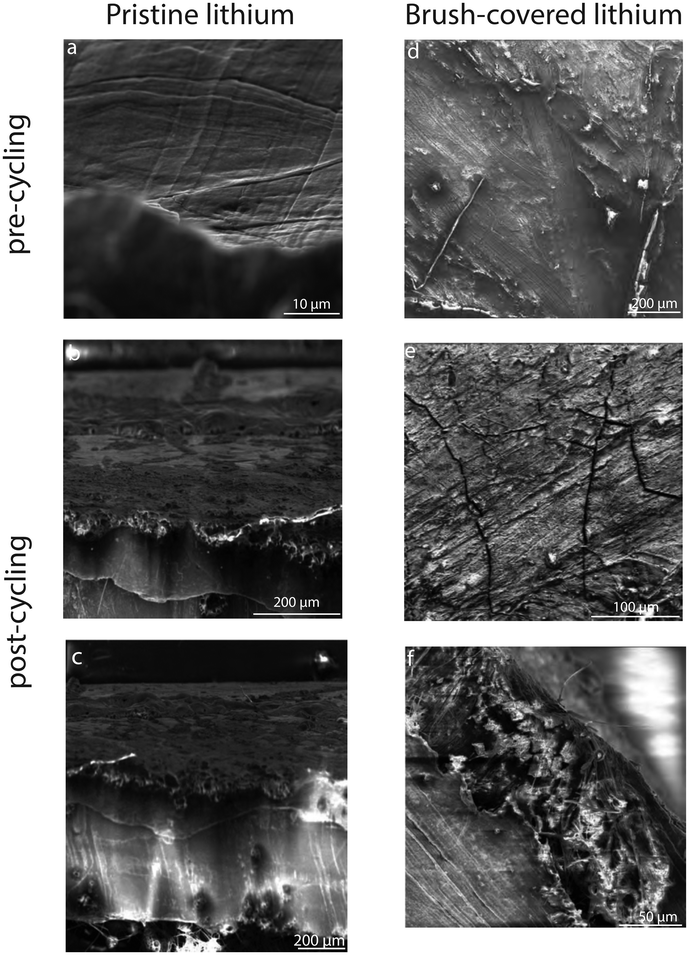
Scanning electron microscopy imaging allows the evolution of the surface morphology of lithium electrodes before and after electrochemical cycling. A comparison of pre-cycling images of pristine and brush-covered lithium electrodes, Fig. 11a and d, respectively, shows the presence of a coating on the surface of the latter, revealing the presence of homogeneous coverage of the surface with the copolymer layer. Post-cycling imaging shows the coexistence of nucleation areas for parasitic morphologies such as dead lithium deposits and dendritic spikes on the cycled pristine electrode, Fig. 11b.
While the crack formation observed on the brush-covered surface, Fig. 11e, results from the brittle crystal lattice nature of the lithium hydroxide layer, post-cycling surface imaging revealed the absence of any parasitic structures. This suggests a stable surface morphology after electrochemical cycling, where the organic self-healing properties of the copolymer coating contribute to mitigate degradation under the applied current density. Future studies could focus on optimizing the composition and structure of the brush layer to improve its durability under more extreme cycling conditions. In addition, SEM imaging of the cross-section of the brush-covered lithium metal electrode after cycling shows no bulk aggregates on the surface. The observed increase in ASEI layer thickness is consistent with the tabulated SEI thickness of pristine and brush-covered lithium samples before and after galvanostatic cycling, Table 2, illustrating the evolution of the SEI layer and confirming the increase in impedance of the Nyquist plot, Fig. 8.
| Metallic lithium electrode | Pre cycling | Post cycling |
|---|---|---|
| Pristine | N.A. | 35.1 ± 4.7 μm |
| Brush-covered | 18.4 ± 0.7 μm | 78.5 ± 10.1 μm |
Postmortem FT-IR analysis further confirms the presence of signals from both the urethane and LiOH layers, indicating that these layers remain exposed and are not buried beneath the electroplated lithium. To gain a deeper understanding of the surface chemistry and to further validate the robustness of the brush after electrochemical cycling, future XPS analysis would provide comprehensive insight into the surface composition.
Conclusion
To develop high-energy-density batteries employing lithium metal anodes, it is essential to stabilize the anode–electrolyte interface during cycling to enable their safe utilization. This study develops a polymer-based passivation layer, functioning as an artificial solid electrolyte interface on the surface of a lithium metal electrode.Since the polymer grafting reaction requires a metal oxide surface, the build-up of lithium hydroxide on the surface was first studied by FT-IR and XRD. The lithium hydroxide layer was electrochemically characterized by impedance analysis and cyclic voltammetry. Galvanostatic cycling was also used to examine the electrochemical properties. The hydroxide layer improved the stability during charge–discharge cycles while allowing lithium ions to diffuse through it. The surface was further modified using isocyanate chemistry to covalently attach a statistical P(S-r-MMA) copolymer brush.
While the combination of block-copolymer and lithium hydroxide coverage of the electrode increases the overall impedance, cyclic voltammetry analysis showed the reversibility of lithium plating and stripping. The combination of EIS Nyquist plots and SEM imaging established a correlation between the thickness and impedance of the natural and the artificial SEI layers covering metallic lithium. While the relatively thick artificial SEI layer (lithium hydroxide plus polymer brush) has an increased resistivity compared to pristine lithium, the electrode surface remains more homogeneous during cycling and reduces the formation of dendritic morphologies, dead lithium, and nucleation sites for lithium deposition.
Long-term galvanostatic cycling demonstrated the stability of the brush-covered lithium electrode for 400 charge–discharge cycles after an initial potential loss. The persistence of the brush was confirmed by postmortem FT-IR analysis, which revealed the presence of peaks characteristic of the urethane bond, along with additional peaks indicating either degradation byproducts or residual electrolyte molecules absorbed at the interface.
Our study shows that lithium metal electrodes covered with a polymer brush have improved cycling stability compared to unmodified electrodes. Particularly, dendrite formation was suppressed. This opens up promising avenues for further improvement. While an oxide layer on metallic lithium is required for covalent brush formation, the LiOH thickness of more than 50 μm in our study was too thick. A LiOH thickness of a few Ångström should be sufficient to reduce the interfacial resistivity close to the value of pristine lithium. However, the primary objective of this study was to explore a new strategy for combining inorganic and organic artificial solid–electrolyte interfaces (ASEI). Further work is needed to optimize the balance between the ion transport resistance and the enhanced mechanical properties of the LiOH layer. The use of a monoatomic deposition of LiOH may provide an alternative strategy for exposing the Li surface to water vapor.
Brush-covered electrodes have also been employed to reduce the interfacial impedance in block-copolymer electrolytes, rendering the surface neutral with respect to the two polymer blocks.62–65 Our study, therefore, paves the way for using lithium metal anodes with block copolymer solid electrolytes.
Experimental section
Materials
Lithium hexafluorophosphate solution in ethylene carbonate and dimethyl carbonate, 1 M LiPF6 in EC/DMC = 50/50 (v/v) battery grade, ethyl chloroformate, triethylamine, sodium azide, benzene were purchased from Sigma Aldrich (Buchs, Switzerland). Poly(styrene-random-methyl methacrylate) was purchased from Polymer Source (Dorval, Canada). Metallic lithium chips were purchased from MTI (California, USA).Methods
A solution of sodium azide (0.3154 g) in deionized water (1.5 mL) was added with a syringe, causing the precipitate to redissolve into the brownish-yellow solution, which was allowed to warm to room temperature for 1.5 h.
The solution was extracted with THF, the combined organic phases were washed with brine, and evaporated at 50 °C overnight in a vacuum oven.
Brush formation
Depending on the sample surface, either allyl isocyanate or the P(S-r-MMA) copolymer was employed as the brush molecule. The P(S-r-MMA) isocyanate-terminated polymer brush was dissolved in benzene in a glovebox at a weight-to-volume ratio of 1 to 10. Allyl isocyanate was either cast as received or diluted in benzene at volume ratios of 1 to 5, 1 to 10, and 1 to 15. 3 drops of the respective solution were cast onto the lithium metal substrate covered with the lithium hydroxide and allowed to dry. This process was repeated 4 times. The sample was placed in a sealed flask in a vacuum oven at 80 °C for 12 hours with an exhausting needle to allow the remaining solvent to evaporate. The sample was then imported into a glovebox.Sample preparation for electrochemical testing
Liquid electrolyte samples were assembled in a coin half-cell (CR2032, MTI, USA) with a separator (Grade GF/B Glass, Healthcare Life Sciences) and 120 μL of liquid electrolyte (EC/DMC = 50/50 (v/v), 1 M LiPF6).Electrochemical impedance spectroscopy (EIS)
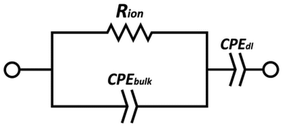
EIS data were acquired using a BioLogic SP-300 instrument, with single sine mode scanning in a frequency range between 5 MHz and 0.1 Hz, 100 mV amplitude, 10 points per decade. An average of 3 measurements per frequency were taken in the scanning range with a resolution of 333 μV per measurement. The cell temperature was controlled in a Binder oven with ≈1 hour dwell time for temperature equilibration starting from room temperature to 90 °C. Measurements were taken at intervals of 15 °C.The measured impedance was converted to ionic conductivity, σ, using the equation σ = L/(RionS), where L and S are the thickness and the area of the films, respectively. The resistance values were obtained by fitting the data to an equivalent circuit, using the EC-Lab software, consisting of a constant-phase element CPEdl of the double layer, a constant-phase element CPEbulk of the bulk electrolyte, and a resistance Rion of the electrolyte. The equivalent circuit is shown in Fig. 12.
Cyclic voltammetry (CV)
Cyclic voltammetry data were acquired using a BioLogic SP-300 instrument. The samples were measured in through-plane configurations at a scan rate dE/dt of 0.5 mV s−1. The temperature was controlled in a Binder oven.Galvanostatic cycling (GC)
Constant current cycling tests were performed using a BioLogic SP-300 instrument. Parameters were 2 hours of constant-current charge–discharge cycles, and current densities varied from 0.095 mA (0.047 mA cm−2), 0.19 mA (0.095 mA cm−2), to 0.5 mA (0.25 mA cm−2) in a voltage range of −0.5 to 0.8 V vs. Li/Li+ at ambient temperature. Long-term GC cycling was carried out with a constant current of 0.2 mA (0.1 mA cm−2).X-Ray diffraction (XRD)
X-ray diffraction was performed on a Rigaku Ultima IV equipped with a copper target. The samples were measured in a Kapton sealed holder assembled in a glovebox and measured within 5 minutes.Contact angle measurements
The contact angle of water on the prepared surfaces was measured using an OCA15pro contact angle goniometer. 2 μL of deionized water was employed in all cases to ensure a consistent drop size. The contact angles of the three-phase interface of sessile drops were determined by fitting a tangent to the drop profile using the SCA20 software.Fourier-transform infrared spectroscopy (FT-IR)
Fourier-transform infrared spectroscopy spectra were recorded on a PerkinElmer Spectrum 65 spectrometer between 4000 and 450 cm−1 with a resolution of 8 cm−1, averaging 16 scans per sample.Scanning electron microscopy (SEM)
The pre-cycled lithium metal electrodes, both pristine and brush-coated, were mounted on SEM stubs with carbon tape and sealed in a vial in an argon-filled glovebox for transport. Exposure to ambient air was minimized during the transition from the inert atmosphere vial to the SEM chamber, with an air exposure time of approximately 20 seconds prior to starting the vacuum in the microscope. Scanning electron microscopy was performed using a Tescan Mira 3 LMH microscope. After electrochemical cycling, the cells were disassembled under inert conditions in an argon-filled glovebox. The post-cycled electrodes were dried in the glovebox at room temperature, and the identical procedure was used to transfer the samples into the SEM.Data availability
Upon publication, the data for this article will be made available on Zenodo.Conflicts of interest
There are no conflicts of interest to declare.Acknowledgements
This work was funded by the Adolphe Merkle Foundation.References
- J. Choi and P. J. Kim, Curr. Opin. Electrochem., 2022, 31, 1–9 Search PubMed.
- M. Winter, B. Barnett and K. Xu, Chem. Rev., 2018, 118, 11433–11456 CrossRef CAS PubMed.
- G. Lewis and F. Keyes, J. Am. Chem. Soc., 1913, 35, 340–344 CrossRef CAS.
- Z. Sun, S. Jin and H. Ji, ACS Appl. Energy Mater., 2023, 6, 1–11 CrossRef CAS.
- Y. Guo, S. Wu, Y.-B. He, F. Kang, L. Chen, H. Li and Q.-H. Yang, eScience, 2022, 2, 138–163 CrossRef.
- Z. Shen, Y. Cheng, S. Sun, X. Ke, L. Liu and Z. Shi, Carbon Energy, 2021, 3, 482–508 CrossRef CAS.
- W. Mei, Z. Liu, C. Wang, C. Wu, Y. Liu, P. Liu, X. Xia, X. Xue, X. Han, J. Sun, G. Xiao, H. Tam, J. Albert, Q. Wang and T. Guo, Nat. Commun., 2023, 14, 5251 CrossRef CAS PubMed.
- D. Doughty and E. P. Roth, Electrochem. Soc. Interface, 2012, 21, 37–44 CAS.
- K. N. Wood, E. Kazyak, A. F. Chadwick, K. H. Chen, J. G. Zhang, K. Thornton and N. P. Dasgupta, ACS Cent. Sci., 2016, 2, 790–801 CrossRef CAS PubMed.
- D. R. Ely and R. E. García, J. Electrochem. Soc., 2013, 160, A662–A668 CrossRef CAS.
- T. Foroozan, S. Sharifi-Asl and R. Shahbazian-Yassar, J. Power Sources, 2020, 461, 228135 CrossRef CAS.
- J. I. Yamaki, S. I. Tobishima, K. Hayashi, K. Saito, Y. Nemoto and M. Arakawa, J. Power Sources, 1998, 74, 219–227 CrossRef CAS.
- W. Xu, J. Wang, F. Ding, X. Chen, E. Nasybulin, Y. Zhang and J. G. Zhang, Energy Environ. Sci., 2014, 7, 513–537 RSC.
- Q. Li, B. Quan, W. Li, J. Lu, J. Zheng, X. Yu, J. Li and H. Li, Nano Energy, 2018, 45, 463–470 CrossRef CAS.
- D. Lin, Y. Liu and Y. Cui, Nat. Nanotechnol., 2017, 12, 194–206 CrossRef CAS PubMed.
- J. G. Han, M. Y. Jeong, K. Kim, C. Park, C. H. Sung, D. W. Bak, K. H. Kim, K. M. Jeong and N. S. Choi, J. Power Sources, 2020, 446, 227366 CrossRef CAS.
- H. Dai, X. Gu, J. Dong, C. Wang, C. Lai and S. Sun, Nat. Commun., 2020, 11, 643 CrossRef CAS PubMed.
- X. Zhang, Q. Wu, X. Guan, F. Cao, C. Li and J. Xu, J. Power Sources, 2020, 452, 227833 CrossRef CAS.
- Y. Che, X. Lin, L. Xing, X. Guan, R. Guo, G. Lan, Q. Zheng, W. Zhang and W. Li, J. Energy Chem., 2020, 52, 361–371 CrossRef.
- M. T. Nguyen, H. Q. Pham, J. A. Berrocal, I. Gunkel and U. Steiner, J. Mater. Chem. A, 2023, 11, 7670–7678 RSC.
- S.-K. Jeong, H.-Y. Seo, D.-H. Kim, H.-K. Han, J.-G. Kim, Y. B. Lee, Y. Iriyama, T. Abe and Z. Ogumi, Electrochem. Commun., 2008, 10, 635–638 CrossRef CAS.
- L. Suo, Y.-s. Hu, H. Li, M. Armand and L. Chen, Nat. Commun., 2013, 1–9 Search PubMed.
- U. S. Meda, L. Lal, M. Sushantha and P. Garg, J. Energy Storage, 2022, 47, 103564 CrossRef.
- H. Adenusi, G. A. Chass, S. Passerini, K. V. Tian and G. Chen, Adv. Energy Mater., 2023, 13, 2203307 CrossRef CAS.
- Q. Gao, D. Wu, X. Zhu, P. Lu, T. Ma, M. Yang, L. Chen, H. Li and F. Wu, Nano Energy, 2023, 117, 108922 CrossRef CAS.
- J. Seo, W. Jeong, M. Lim, B. Choi, S. Park, Y. Jo, J.-W. Lee and H. Lee, Energy Storage Mater., 2023, 60, 102827 CrossRef.
- H. Zhang, X. Liao, Y. Guan, Y. Xiang, M. Li, W. Zhang, X. Zhu, H. Ming, L. Lu, J. Qiu, Y. Huang, G. Cao, Y. Yang, L. Mai, Y. Zhao and H. Zhang, Nat. Commun., 2018, 9, 1–11 CrossRef PubMed.
- R. Xu, X. Q. Zhang, X. B. Cheng, H. J. Peng, C. Z. Zhao, C. Yan and J. Q. Huang, Adv. Funct. Mater., 2018, 28, 1–7 Search PubMed.
- A. Wang, S. Tang, D. Kong, S. Liu, K. Chiou, L. Zhi, J. Huang, Y. Y. Xia and J. Luo, Adv. Mater., 2018, 30, 1–7 Search PubMed.
- S. Neuhold, J. T. Vaughey, C. Grogger and C. M. López, J. Power Sources, 2014, 254, 241–248 CrossRef CAS.
- R. S. Thompson, D. J. Schroeder, C. M. López, S. Neuhold and J. T. Vaughey, Electrochem. Commun., 2011, 13, 1369–1372 CrossRef CAS.
- Y. Wang, Z. Wang, L. Zhao, Q. Fan, X. Zeng, S. Liu, W. K. Pang, Y.-B. He and Z. Guo, Adv. Mater., 2021, 33, 2008133 CrossRef CAS PubMed.
- H. Irfan and A. Shanmugharaj, Appl. Surf. Sci., 2022, 586, 152806 CrossRef CAS.
- M. Buonaiuto, S. Neuhold, D. J. Schroeder, C. M. Lopez and J. T. Vaughey, ChemPlusChem, 2015, 80, 363–367 CrossRef CAS.
- B. Yi, S. Wang, C. Hou, X. Huang, J. Cui and X. Yao, Chem. Eng. J., 2021, 405, 127023 CrossRef CAS.
- Y. Wang, A. Attam, H. Fan, W. Zheng and W. Liu, Small, 2023, 19, 2303804 CrossRef CAS PubMed.
- X. Xie, L. Wei, J. Lu, A. Xu, B. Wang, X. Xiao, A. Wang, Z. Jin, Z. Shi and W. Wang, Energy Storage Mater., 2024, 67, 103323 CrossRef.
- Y. Cheng, Z. Wang, J. Chen, Y. Chen, X. Ke, D. Wu, Q. Zhang, Y. Zhu, X. Yang, M. Gu, Z. Guo and Z. Shi, Angew. Chem., Int. Ed., 2023, 62, e202305723 CrossRef CAS PubMed.
- X. Xie, J. Chen, X. Chen and Z. Shi, J. Electroanal. Chem., 2023, 949, 117862 CrossRef CAS.
- K. Yu, J. Chen, X. Xie, K. Lin, J. Li and Z. Shi, Surf. Interfaces, 2022, 34, 102326 CrossRef CAS.
- M. Yu, H. Zhou and X. Ning, ACS Appl. Mater. Interfaces, 2024, 16, 13316–13325 CrossRef CAS PubMed.
- Y. Wang, E. Sahadeo, G. Rubloff and C.-f. Lin, J. Mater. Sci., 2019, 54, 3671–3693 CrossRef CAS.
- S. Wei, S. Choudhury, Z. Tu, K. Zhang and L. A. Archer, Acc. Chem. Res., 2018, 51, 80–88 CrossRef CAS PubMed.
- W. Cao, Q. Li, X. Yu and H. Li, eScience, 2022, 2, 47–78 CrossRef.
- Y. Liang, Y. Chen, X. Ke, Z. Zhang, W. Wu, G. Lin, Z. Zhou and Z. Shi, J. Mater. Chem. A, 2020, 8, 18094–18105 RSC.
- X. Ke, Y. Cheng, J. Liu, L. Liu, N. Wang, J. Liu, C. Zhi, Z. Shi and Z. Guo, ACS Appl. Mater. Interfaces, 2018, 10, 13552–13561 CrossRef CAS PubMed.
- Y. Cheng, J. Chen, Y. Chen, X. Ke, J. Li, Y. Yang and Z. Shi, Energy Storage Mater., 2021, 38, 276–298 CrossRef.
- Z. Luo, C. Liu, Y. Tian, Y. Zhang, Y. Jiang, J. Hu, H. Hou, G. Zou and X. Ji, Energy Storage Mater., 2020, 27, 124–132 CrossRef.
- Y. Cheng, X. Ke, Y. Chen, X. Huang, Z. Shi and Z. Guo, Nano Energy, 2019, 63, 103854 CrossRef CAS.
- S. Zhang, Y. Wan, Y. Cao, Y. Zhang, H. Gong, X. Liang, B. Zhang, X. Wang, S. Fang, J. Wang, W. Li and J. Sun, eScience, 2024, 100328 CrossRef.
- S. Kang, Z. Yang, C. Yang, S. Zhao, N. Wu and F. Liu, Ionics, 2021, 27, 2037–2043 CrossRef CAS.
- M. Kufian, S. Ramesh and A. Arof, Opt. Mater., 2021, 120, 111418 CrossRef CAS.
- G. Chakraborty, R. Padmashree and A. Prasad, J. Mater. Sci. Eng. B, 2023, 297, 116817 CrossRef CAS.
- N. Demirbilek, N. Cengiz and T. N. Gevrek, J. Macromol. Sci., Part A:Pure Appl. Chem., 2023, 60, 505–514 CrossRef CAS.
- J. Lai, X. Xing, H. Feng and Z. Wang, Polym. Chem., 2023, 14, 4381–4406 RSC.
- B. Deal and H. Svec, J. Am. Chem. Soc., 1953, 75, 6173–6175 CrossRef CAS.
- I. Bezverkhyy, J. M. Salazar, G. Weber, E. Sciora, J. Guichard and B. Herve, J. Therm. Anal. Calorim., 2018, 132, 1055–1064 CrossRef.
- O. Li, X. Operando, Z. Li, S. Ganapathy, Y. Xu, J. R. Heringa, Q. Zhu, W. Chen and M. Wagemaker, Chem. Mater., 2017, 29, 1577–1586 CrossRef PubMed.
- F. Mallamace, C. Corsaro, D. Mallamace, S. Vasi, C. Vasi and G. Dugo, Comput. Struct. Biotechnol. J., 2015, 13, 33–37 CrossRef CAS PubMed.
- K.-H. Chen, K. N. Wood, E. Kazyak, W. S. LePage, A. L. Davis, A. J. Sanchez and N. P. Dasgupta, J. Mater. Chem., 2017, 5, 11671–11681 RSC.
- Y. Lu, C.-Z. Zhao, H. Yuan, X.-B. Cheng, J.-Q. Huang and Q. Zhang, Adv. Funct. Mater., 2021, 31, 2009925 CrossRef CAS.
- J. B. Kerr, Y. B. Han, G. Liu, C. Reeder, J. Xie and X. Sun, Electrochim. Acta, 2004, 50, 235–242 CrossRef CAS.
- J. Min, S. Bae, D. Kawaguchi, K. Tanaka and M. J. Park, J. Chem. Phys., 2023, 159, 174906 CrossRef CAS PubMed.
- K. Guo, S. Li, J. Wang, Z. Shi, Y. Wang and Z. Xue, ACS Energy Lett., 2024, 9, 843–852 CrossRef CAS.
- M. Egashira, Y. Utsunomiya, N. Yoshimoto and M. Morita, Electrochim. Acta, 2006, 52, 1082–1086 CrossRef CAS.
Footnote |
| † Electronic supplementary information (ESI) available. See DOI: https://doi.org/10.1039/d4lp00293h |
| This journal is © The Royal Society of Chemistry 2025 |

