 Open Access Article
Synthesis, characterization, and dielectric properties of bentonite clay modified with (3-chloropropyl)triethoxysilane and Co(II) porphyrin complex for technological and electronic device applications†
Sahar H. El-Khalafy *a,
Mahmoud T. Hassaneina,
Mohamed M. Alaskarya,
Galal H. Ramzyb and
Ahmed I. Ali
 *cd
*cd
aDepartment of Chemistry, Faculty of Science, University of Tanta, Tanta 31527, Egypt. E-mail: Sehar_hasouna@science.tanta.edu.eg
bPhysics Department, Faculty of Science, Cairo University, Giza 12613, Egypt
cBasic Science Department, Faculty of Technology and Education, Helwan University, Sary El-Qopa P.O. 11281, Cairo, Egypt. E-mail: Ahmed_Ali_2010@techedu.helwan.edu.eg
dDepartment of Applied Physics and Institute of Natural Sciences, College of Applied Science, Kyung Hee University, Suwon 446-701, Republic of Korea
First published on 28th January 2025
Abstract
The present work reports the dielectric behavior of bentonite clay, (3-chloropropyl)triethoxysilane-modified bentonite clay (CPTES-modified bentonite clay), and a 5,10,15,20-tetrakis-(4-hydroxyphenyl)porphyrinatocobalt(II) complex covalently bonded to CPTES-modified bentonite clay ([Co(II)TP-OHPP]/CPTES–bentonite clay). The structures and morphologies of these composites were characterized by techniques such as 1H NMR spectroscopy, UV/vis spectroscopy, FT-IR spectroscopy, scanning electron microscopy (SEM), X-ray diffraction (XRD), TGA, DSC, and BET analysis. We meticulously analyzed their dielectric properties and AC conductivities, considering the effects of frequency and temperature. The dielectric constant (ε′), dielectric loss (ε′′), and AC conductivity (σAC) were determined over a frequency range of f = 103–105 Hz and at temperatures ranging from 30 °C to 200 °C. The results show that bentonite clay exhibits the highest values of ε′ and ε′′ at 30 °C, particularly at low frequencies (103 Hz). However, the dielectric constants of CPTES–bentonite clay and [Co(II)TP-OHPP]/CPTES–bentonite clay enhanced the dielectric loss (ε′′) and showed an adjustment in ε′ values with a corresponding acceptable loss. Functionalizing bentonite clay with CPTES and subsequently complexing it with [Co(II)TP-OHPP] enhances its thermal resistance, making the modified bentonite clay more stable both under thermal conditions and at high frequencies. These composites are, therefore, promising candidates for high-temperature applications.
1. Introduction
In recent years, the development of advanced materials with tailored dielectric properties has become increasingly important for fabrication of electronics, sensors, capacitors, and insulating layers due to their ability to store and release electrical energy. The performance of these materials is determined mainly by their dielectric constant, dielectric loss, and AC conductivity, all of which are sensitive to external conditions such as frequency and temperature.1–5 The dielectric constant (ε′) is a measure of a material's ability to store electrical energy in an electric field; the dielectric loss (ε′′) parameter indicates the energy dissipation within the material when subjected to an alternating current (AC) field; and AC conductivity (σ) reflects how well a material conducts alternating current.6–11Bentonite clay, a naturally occurring aluminosilicate, primarily consists of montmorillonite, a type of smectite clay that forms from the weathering of volcanic ash. Its structure includes a layered framework of alumina (Al2O3) and silica (SiO2) sheets, which endow it with unique physical and chemical properties.12,13 However, researchers have explored various modification strategies to enhance its performance further and extend its applicability. One such approach involves the incorporation of chemical additives to modify the properties of bentonite clay and make it suitable for widespread use in electronic and environmental applications, driven by its abundance and inherent properties.14–17
The structural and molecular diversity of porphyrins and porphyrin analogues containing N-donor macrocyclic systems enhances their application potential and capacity to provide specific chemical and physical features. Researchers have been interested in these macrocycles because of their stable π-ring system, caused by the type of substituent in the macrocycle's meso- and/or β-positions and the central metal ion's capacity to coordinate. They have found applications in numerous fields, including coordination chemistry,18 photochemistry and photophysics,19 optical materials,20 fluorescent materials,21 semiconductors,22 solar photovoltaic cells,23 and intermediates for drug production.24 It is known that several porphyrin-based transition metal (Mn, Co, Cu, and Fe) complexes are of great interest for usage as catalysts for activation in a variety of oxidation processes and for dye degradation.25–28 Studying these materials, especially their electrical characteristics, is a crucial area of research that enables the exploitation and refinement of their intriguing technological uses.29–31
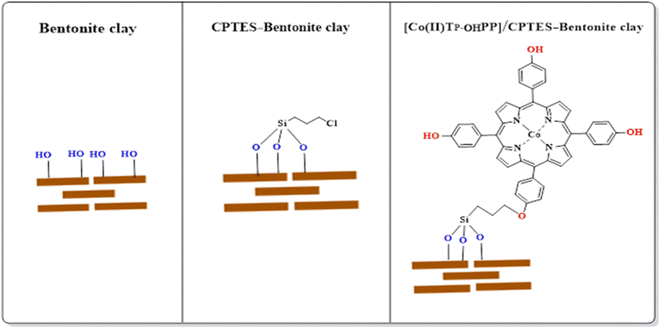
During our studies on the synthesis, characterization and modification of bentonite clay with a metalloporphyrin complex and an organosilane compound, we have identified and characterized a new complex of CEPTES-bentonite clay, tetrakis(4-hydroxyphenyl)porphyrinato cobalt(II) complex/CEPTES-bentonite clay, as shown in Fig. 1. The dielectric properties of these materials have not been reported so far. Therefore, in this work, the attention has been focused on the investigation of the dielectric constant (ε′), dielectric loss (ε′′), and AC conductivity (σAC) as a function of frequency and temperature for the pure bentonite clay, CPTES-modified bentonite clay, and composite incorporating a tetrakis(4-hydroxyphenyl)porphyrinato cobalt(II) complex with CPTES grafted on the bentonite clay, to get the maximum amount of information from the experimental data.
2. Experimental setup
2.1. Chemicals and reagents
Pyrrole (97%) was distilled before use, and bentonite clay with a cation exchange capacity (CEC) and surface area of 104 meq/100 g and 67.6 m2 g−1, respectively, was purchased from Merck Darmstadt, Germany. 4-Hydroxybenzaldehyde (98%), propionic acid (99.5%), N,N-dimethylformamide (DMF) (99.8%), cobalt(II) chloride hexahydrate (≥97%), and (3-chloropropyl)triethoxysilane (95%) were obtained from Sigma-Aldrich. Toluene (99.9%) and triethylamine (99%) were obtained from Alpha-Chemika, India. El-Nasr Pharmaceutical Chemicals, Egypt supplied chloroform (99.4%), methylene chloride (99.9%), methanol (99.9%), ethyl acetate (99.9%), and potassium carbonate. Silica gel (60–120 mesh) was purchased from Fisher Co., New Jersey, USA.2.2. Synthesis of [TP-OHPP], [Co(II)TP-OHPP], CPTES–bentonite clay, and [Co(II)TP-OHPP]/CPTES–bentonite clay
1H NMR (400 MHz, in DMSO): δ (ppm) 10.03 (s, 4H, OH), 8.9 (s, 8H, βH), 8.03 (d, 8H, ArH), 7.24 (d, 8H, ArH), −2.84 (s, 2H, NH).
UV-vis (CHCl3) λmax: 416, 516, 554, 592 and 649 nm.
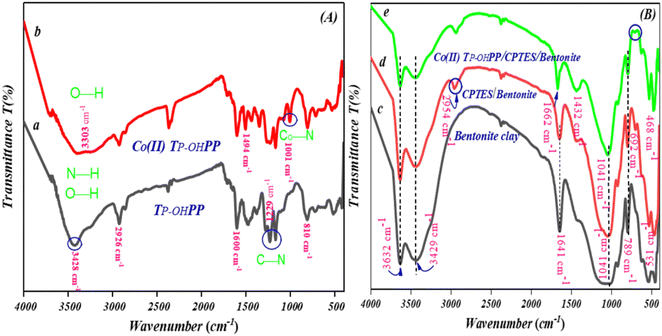
IR (ν, cm−1): 3423 ν(O−H,N–H), 1469 ν(C![[double bond, length as m-dash]](https://www.rsc.org/images/entities/char_e001.gif) N), 808, ν(macrocycle ring's N–H out-of-plane bending vibration), 1599 ν(N−H bending), 1228 ν(C−N), 1001 ν(Co−N).
N), 808, ν(macrocycle ring's N–H out-of-plane bending vibration), 1599 ν(N−H bending), 1228 ν(C−N), 1001 ν(Co−N).
1H NMR (400 MHz, in DMSO): δ (ppm) 10.03 (s, 4H, OH), 9.13 (s, 8H, βH), 7.9 (d, 8H, ArH), 7.25 (d, 8H, ArH).
UV-vis (CHCl3) λmax: 448, 544, 581 nm.
IR (ν, cm−1): 3423 ν(O−H) became broad and slightly shifted, and a new band appeared around 1001 ν(Co−N).
IR (ν, cm−1): 3632, 3429 ν(O−H), 2954 ν(–CH2–), 1641 ν(H–O–H), 1032 ν(Si–O–Si), 692 ν(C–Cl).
IR (ν, cm−1): 3632, 3429 ν(O−H), 2954 ν(–CH2–), 1662 ν(C![[double bond, length as m-dash]](https://www.rsc.org/images/entities/char_e001.gif) C), 1469 ν(C
C), 1469 ν(C![[double bond, length as m-dash]](https://www.rsc.org/images/entities/char_e001.gif) N), 1032 ν(Si–O–Si).
N), 1032 ν(Si–O–Si).
2.3. Instrumental measurements
On a Bruker Advance II spectrometer operating at 400 MHZ, 1H NMR spectra were recorded in the presence of CDCl3 and the chemical shifts were provided. FTIR was performed using a JASCO FT-IR-4100, Japan in the range 400–4000 cm−1 utilizing liquid samples of semi-solid polymers or KBr pellets for powdered polymers with chloroform as the solvent. The crystal structure was analyzed using an X-ray powder diffractometer (APD 2000 Pro, Italy). The experiment utilized Cu-K radiation, which has a wavelength of 1.5406 Å. The angle range for the scan was set from 5 to 90º, with a scanning rate of 0.05 s−1 at 45 kV and 0.8 mA. Scanning electron microscopy (SEM) analysis at 10 kV was performed to detect the existence of elements within the nanocomposite using a JSM-IT200 In Touch Scope™ Scanning Electron Microscope. Optical spectra were recorded using a spectrophotometer (Agilent Cary 5000 UV-vis spectrophotometer), and absorption was recorded in the wavelength range from 200 to 800 nm. Thermogravimetry analysis (TGA) and differential scanning calorimetry (DSC) were performed using a PerkinElmer thermogravimetric analyzer (TGA7, USA) from room temperature to 200 °C in a nitrogen atmosphere at a heating rate of 3–7 °C min−1. A Quantachrome NOVA 2200 Brunauer–Emmett–Teller (BET) surface area analyzer was used to determine the surface area and pore size distribution. A Zetasizer (Malvern Nano Z, UK) was used for the zeta potential measurements. The dielectric properties were measured at temperatures of 25–200 °C using an LCR analyzer, Haioki im-3533, with active Kelvin electrodes. The experimental data were measured as a function of frequency over the range 1 kHz–200 kHz from which dielectric parameters could be estimated using the known relations.3. Results and discussion
5,10,15,20-Tetrakis[4-(hydroxyl)phenyl]porphyrin [TP-OHPP] was prepared by condensing pyrrole and 4-hydroxybenzaldehyde in propionic acid.27 Metalation of porphyrin with CoCl2·6H2O in methanol forms [Co(II)TP-OHPP].32 Simultaneously, the bentonite clay chlorosilylation with (3-chloropropyl)triethoxysilane in toluene was performed.33 Finally [Co(II)TP-OHPP] was covalently bonded to the chlorosilylated bentonite clay by refluxing in the presence of potassium carbonate,34 as shown in Fig. 2.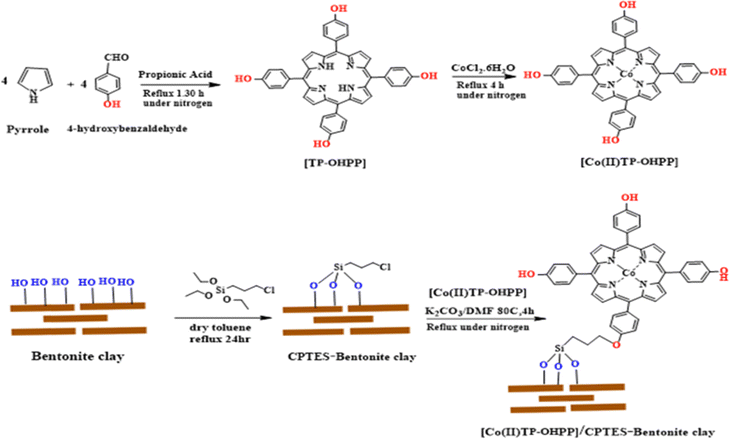 | ||
| Fig. 2 The schematic illustration of the bentonite clay and the preparation of CPTES–bentonite clay and [Co(II)TP-OHPP]/CPTES–bentonite clay. | ||
3.1. Structural characterization and morphology analysis
![[double bond, length as m-dash]](https://www.rsc.org/images/entities/char_e001.gif) N vibrations were identified by the peaks at 1599 and 1469 cm−1, respectively. Ultimately, the N–H out-of-plane bending vibration of the macrocycle ring was identified as the source of the peak at 810 cm−1. The [Co(II)TP-OHPP] spectrum shows a broad peak formed at 3303 cm−1. Fig. 3(A-b) indicates the phenol O–H stretching peak and the disappearance of free base porphyrin's N–H vibration frequency.27,35,36 The characteristic absorption of the Co–N(equatorial) bond generated in [Co(II)TP-OHPP] is represented by the newly formed peak at 1001 cm−1 as shown in Fig. 3(A-b).28,37 Fig. 3(B) presents the FTIR spectrum of bentonite and its composites respectively. In Fig. 3(B-c), the wide peak at 3632 and 3429 cm−1 is owing to the stretching vibration of O–H of bentonite and adsorbed water. The presence of adsorbed water H–O–H is confirmed by the bending vibration around 1641 cm−1. The strong large peak at 1032 cm−1 is owing to Si–O–Si and Si–O– vibrations. The bending vibrations of Si–O and Al–O–Si yielded peaks at 789 cm−1 and 531 cm−1 respectively.33 Fig. 3(B-d) shows that the spectra exhibited peaks due to bentonite; there is a peak at 2954 cm−1 due to the stretching vibration of –CH2– groups. A new peak at 692 cm−1 confirmed the presence of C–Cl in the CPTES group.38 For the [Co(II)TP-OHPP]/CPTES–bentonite clay spectrum (Fig. 3(B-e)), the IR band shifts from 1641 cm−1 to 1662 cm−1, indicating a more confined and organized environment for adsorbed water molecules. This shift suggests reduced water mobility and more stable hydrogen bonding, resulting in distinct vibrational modes that reflect greater order and stability around the water molecules compared to environments with fluctuating hydrogen bonds,39,40 and a new band appeared at 1432 cm−1 due to attaching [Co(II)TP-OHPP] to CPTES–bentonite. The disappearance of the peak at 692 cm−1 proves that the Co(II)TP-OHPP molecules were covalently anchored to the bentonite–Cl. As seen, signature bands for [Co(II)TP-OHPP] did not appear anywhere in the spectrum of [Co(II)TP-OHPP]/CPTES–bentonite due to the overlap of the spectra of CPTES–bentonite and [Co(II)TP-OHPP] in the entire infrared region.28
N vibrations were identified by the peaks at 1599 and 1469 cm−1, respectively. Ultimately, the N–H out-of-plane bending vibration of the macrocycle ring was identified as the source of the peak at 810 cm−1. The [Co(II)TP-OHPP] spectrum shows a broad peak formed at 3303 cm−1. Fig. 3(A-b) indicates the phenol O–H stretching peak and the disappearance of free base porphyrin's N–H vibration frequency.27,35,36 The characteristic absorption of the Co–N(equatorial) bond generated in [Co(II)TP-OHPP] is represented by the newly formed peak at 1001 cm−1 as shown in Fig. 3(A-b).28,37 Fig. 3(B) presents the FTIR spectrum of bentonite and its composites respectively. In Fig. 3(B-c), the wide peak at 3632 and 3429 cm−1 is owing to the stretching vibration of O–H of bentonite and adsorbed water. The presence of adsorbed water H–O–H is confirmed by the bending vibration around 1641 cm−1. The strong large peak at 1032 cm−1 is owing to Si–O–Si and Si–O– vibrations. The bending vibrations of Si–O and Al–O–Si yielded peaks at 789 cm−1 and 531 cm−1 respectively.33 Fig. 3(B-d) shows that the spectra exhibited peaks due to bentonite; there is a peak at 2954 cm−1 due to the stretching vibration of –CH2– groups. A new peak at 692 cm−1 confirmed the presence of C–Cl in the CPTES group.38 For the [Co(II)TP-OHPP]/CPTES–bentonite clay spectrum (Fig. 3(B-e)), the IR band shifts from 1641 cm−1 to 1662 cm−1, indicating a more confined and organized environment for adsorbed water molecules. This shift suggests reduced water mobility and more stable hydrogen bonding, resulting in distinct vibrational modes that reflect greater order and stability around the water molecules compared to environments with fluctuating hydrogen bonds,39,40 and a new band appeared at 1432 cm−1 due to attaching [Co(II)TP-OHPP] to CPTES–bentonite. The disappearance of the peak at 692 cm−1 proves that the Co(II)TP-OHPP molecules were covalently anchored to the bentonite–Cl. As seen, signature bands for [Co(II)TP-OHPP] did not appear anywhere in the spectrum of [Co(II)TP-OHPP]/CPTES–bentonite due to the overlap of the spectra of CPTES–bentonite and [Co(II)TP-OHPP] in the entire infrared region.28
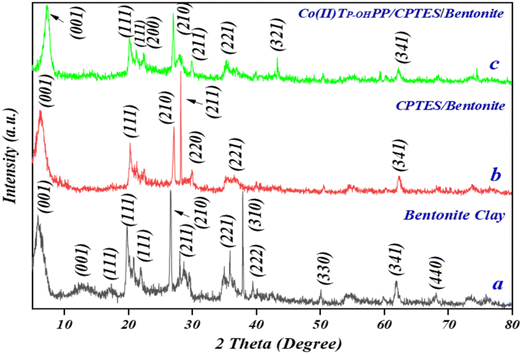 | ||
| Fig. 4 X-ray diffraction patterns of (a) bentonite clay, (b) CPTES–bentonite, and (c) [Co(II)TP-OHPP]/CPTES–bentonite. | ||
As shown in Fig. 4, the 2θ values of the (001) lattice planes of (a) bentonite clay, (b) CPTES–bentonite, and (c) [Co(II)TP-OHPP]/CPTES–bentonite are 5.83°, 6.37°, and 7.50°, corresponding to the interlayer spacings of 15.34 Å, 13.80 Å, and 12.67 Å, which is attributed to the intercalation of CPTES and Co(II)TP-OHPP, leading to the smaller interlayer spacing of bentonite. However, it can also be seen that the other diffraction peaks of the three samples in XRD patterns are not changed, suggesting that the organosilane CPTES and Co(II)TP-OHPP molecules cannot change the crystalline form of bentonite. The result demonstrates that Co(II)TP-OHPP molecules are successfully grafted with CPTES-pillared bentonite clay.41 Bentonite clay exhibits strong crystallinity with well-defined peaks typical of its mineral composition. CPTES-modified bentonite clay shows reduced crystallinity compared to pristine bentonite, indicating successful surface modification with CPTES, which impacts the crystal structure. [Co(II)TP-OHPP]/CPTES-modified bentonite clay demonstrates a further reduction in crystallinity, likely due to the incorporation of the porphyrin complex, which disrupts the regular crystal lattice of the modified bentonite clay. This XRD finding suggests a progressive modification of the bentonite clay's structure, starting from pristine bentonite to surface-modified clay and finally to a composite material incorporating a cobalt porphyrin complex, with each step showing increasing structural disorder. Rietveld refinement of X-ray diffraction patterns and lattice parameters of bentonite clay, CPTES–bentonite clay, and Co(II)TP-OHPP/CPTES–bentonite clay are shown in Fig. S1 and Table SI (ESI†), respectively.
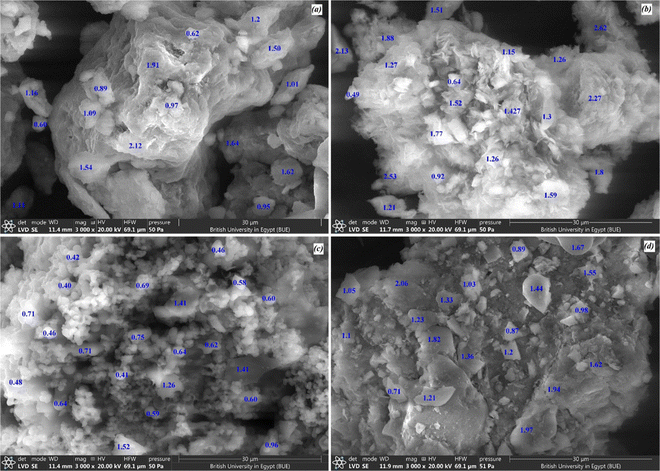 | ||
| Fig. 5 SEM images of (a) bentonite clay, (b) CPTES–bentonite, (c) [Co(II)TP-OHPP] and (d) [Co(II)TP OHPP]/CPTES–bentonite clay. | ||
The image reveals much smaller, more uniform particles with a granular appearance. The densely packed particles exhibit less overall cohesion than the clay samples, indicating a distinct particulate structure typical of organic or organometallic complexes. The uniformity and granular texture suggests that the complex forms small, consistent particles, likely due to the molecular structure of the cobalt porphyrin complex. But [Co(II)TP-OHPP]/CPTES-modified bentonite clay composite material (d) shows a combination of features from both the CPTES-modified bentonite clay and the cobalt porphyrin complex. The structure appears to be more cohesive than the [Co(II)TP-OHPP] complex alone, with larger aggregates forming but still retaining some of the granular texture seen in the [Co(II)TP-OHPP] image. This suggests that the cobalt complex has been successfully integrated into the clay matrix, with the resulting composite material exhibiting a mixed morphology, reflecting both the organic complex and the modified clay. The important point is that the SEM images depict the structural evolution of the materials from pristine bentonite clay to surface-modified clay and further to a composite material. The pristine bentonite clay exhibits a dense, layered structure typical of clay minerals. The CPTES modification reduces aggregation and introduces a more open structure. The cobalt porphyrin complex forms smaller, granular particles, and when combined with the modified clay, the resulting composite shows a hybrid structure that retains the characteristics of both the clay and the complex. These morphological changes can significantly affect the physical properties of the materials, particularly in applications involving dielectric properties, adsorption, or catalysis. Their surface morphological features are among the most significant variables influencing their nature, properties, and applications.
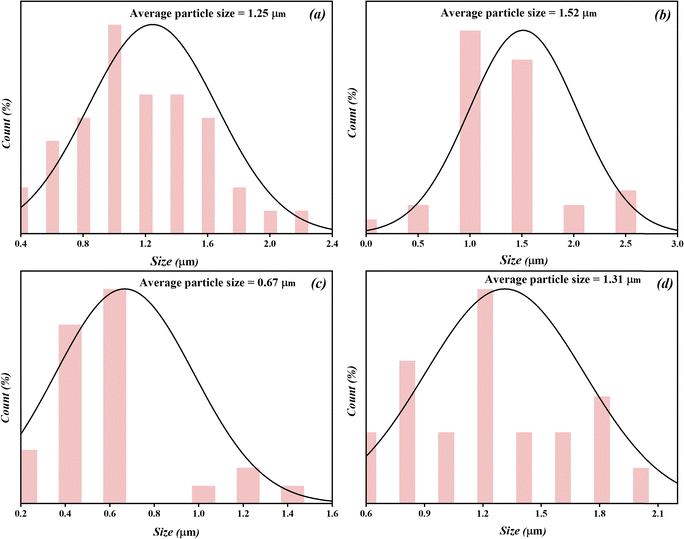
Fig. 6 presents histograms illustrating the particle size distribution of four different materials: (a) bentonite clay, (b) CPTES-modified bentonite clay, (c) [Co(II)TP-OHPP], and (d) [Co(II)TP-OHPP]/CPTES-modified bentonite clay. Each histogram reflects the frequency distribution of particle sizes for the respective materials, providing insights into the changes in particle size due to modifications and complexation. For the bentonite clay (a), the histogram shows a broad distribution of particle sizes, with a noticeable peak in the mid-sized range. This suggests that the bentonite clay has a relatively heterogeneous particle size distribution, with particles spanning a wide range of sizes, typical for natural clays, while the CPTES-modified bentonite clay (b) shows a shift in the particle size distribution compared to pristine bentonite. The distribution becomes more focused, with a reduction in larger particle sizes. This indicates that the surface modification with CPTES likely affected the aggregation behavior or broke down larger particles into smaller, more uniform sizes. In addition, the particle size distribution of the [Co(II)TP-OHPP] complex (c) is markedly different from those of the bentonite samples. The histogram shows a narrower distribution, suggesting that the particles are more uniform in size, with a peak concentrated in a specific size range. This indicates that the cobalt porphyrin complex forms particles with a more defined size range, likely due to the structured nature of the complex. Furthermore, the sample [Co(II)TP-OHPP]/CPTES-modified bentonite clay (d) shows a distribution that combines the characteristics of both the modified clay and the cobalt porphyrin complex. The distribution remains broad but with a more defined peak than that for the pristine bentonite clay. This suggests that incorporating the [Co(II)TP-OHPP] complex into the CPTES-modified bentonite clay matrix influences the particle size distribution, potentially leading to a more uniform distribution while retaining some of the heterogeneity of the clay. The histograms demonstrate how the particle size distribution evolves with each modification. Pristine bentonite clay shows a broad distribution, which becomes narrower after modification with CPTES. The [Co(II)TP-OHPP] complex exhibits a more uniform size distribution, and when combined with CPTES-modified bentonite clay, the resulting composite shows a balance of the two characteristics, suggesting an interaction between the clay matrix and the cobalt porphyrin complex that affects particle size distribution. These insights are valuable for understanding how surface modification and complexation impact the material properties, especially in applications where the particle size plays a crucial role, such as in dielectric or catalytic materials.
3.1.4.1. Zeta potential analysis. Table 1 shows the data for the zeta potentials of all three samples. For the bentonite sample, the zeta potential values range from −29.3 mV to −24.9 mV. These moderate negative values indicate a reasonably stable suspension, as particles should have some repulsive force preventing aggregation. However, it's not exceptionally high in stability compared to CPTES–bentonite. However, for the CPTES–bentonite composite, the zeta potential is more negative, ranging from −40.4 mV to −36.4 mV. This increase in negative charge is likely due to the functionalization with CPTES, which enhances the surface charge. A zeta potential in this range generally indicates a highly stable suspension with strong repulsive forces that help prevent aggregation. On the other hand, [Co(II)TP-OHPP]/CPTES–bentonite clay has a much lower zeta potential, between −13.3 mV and −13.1 mV, indicating reduced electrostatic repulsion and, consequently, lower stability. This reduced zeta potential may be due to adding the porphyrin group, which could partially shield the negative charge or alter the surface chemistry, decreasing the electrostatic repulsion among particles.
| No. | Sample | Zeta potential (mV) | ||
|---|---|---|---|---|
| 1 | Bentonite clay | −29.3 | −26.9 | −24.9 |
| 2 | CPTES–bentonite clay | −40.4 | −40 | −36.4 |
| 3 | [Co(II)TP-OHPP]/CPTES–bentonite clay | −13.3 | −13.2 | −13.1 |
3.1.4.2. Average particle size. Table 2 shows that the particle size for this unmodified bentonite clay sample is relatively large, ranging from 1.28 μm to 1.47 μm. The moderate zeta potential of this sample might allow some particle aggregation, leading to the larger size values being observed, while the functionalized CPTES–bentonite sample has an even larger particle size range, from 1.32 μm to 1.89 μm. Despite the increased zeta potential (higher stability), the functionalization may have increased the particle size due to the added CPTES layer on the bentonite surface, which increases the effective hydrodynamic diameter measured by DLS. But the [Co(II)TP-OHPP]/CPTES–bentonite clay shows particle sizes in the range of 1.38 μm to 1.44 μm, which are slightly smaller than those of the CPTES–bentonite sample but still larger than those of the bentonite clay sample. The addition of porphyrin might have contributed to a slight reduction in particle size due to partial aggregation induced by the lower zeta potential.
| No. | Sample | Average size, d (μm) |
|---|---|---|
| 1 | Bentonite clay | 1.35 |
| 2 | CPTES–bentonite clay | 1.65 |
| 3 | [Co(II)TP-OHPP]/CPTES–bentonite clay | 1.41 |
3.1.4.3. Comparing zeta potential and particle size. The effect of higher zeta potential: for the CPTES–bentonite sample, the high zeta potential (−40.4 to −36.4 mV) suggests good stability, meaning particle aggregation should be minimal. However, the larger particle size compared to bentonite is likely due to the additional CPTES layer, not due to aggregation. The effect of lower zeta potential: for the [Co(II)TP-OHPP]/CPTES-modified bentonite clay sample, the low zeta potential (around −13 mV) shows that the particles are more prone to aggregation. The particle size values here are slightly reduced compared to CPTES–bentonite clay, which may indicate that adding porphyrin altered surface interactions and led to some degree of particle clustering or condensation.
Here, the bentonite has moderate stability with relatively large particles, likely due to some degree of aggregation. CPTES–bentonite shows high stability due to the increased zeta potential, though the particle size is larger due to the CPTES coating rather than aggregation. However, the [Co(II)TP-OHPP]/CPTES-modified bentonite clay shows reduced stability, as indicated by the lower zeta potential, which may lead to some aggregation and potentially influence the optical and surface properties of the particles. In summary, the DLS data indicate that surface modifications with CPTES and porphyrin affect zeta potential and particle size. CPTES enhances stability while increasing particle size, while adding porphyrin reduces stability, leading to potential aggregation effects, as seen in the particle size and zeta potential data.
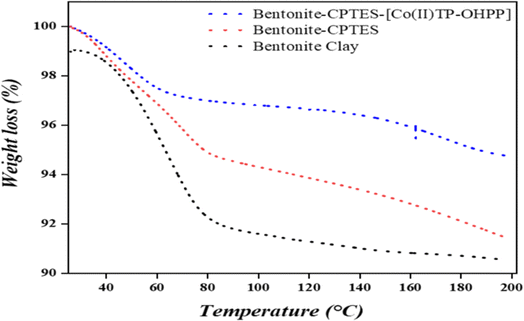
3.1.6.1. Thermogravimetric analysis (TGA). Fig. 8 shows the weight loss (%) as a function of temperature (°C) ranging from about 30 °C to 200 °C for three samples, including bentonite clay, CPTES–bentonite, and [Co(II)TP-OHPP]/CPTES–bentonite clay. Here's a breakdown of the trends observed in each curve: the bentonite clay sample shows a steady weight loss as the temperature increases. The weight loss reaches around 92% when the temperature hits 200 °C. The steady decline indicates that the material loses weight consistently over this temperature range, likely due to the release of adsorbed water or the decomposition of volatile components. The CPTES–bentonite sample has a slightly reduced weight loss compared to bentonite clay, suggesting enhanced thermal stability due to CPTES (3-chloropropyltriethoxysilane). The curve starts at 100% and declines gradually, indicating a lower thermal decomposition rate, probably due to stronger bonds formed between CPTES and the clay matrix. Furthermore, the [Co(II)TP-OHPP]/CPTES–bentonite clay sample shows the highest thermal stability, with the smallest weight loss by 200 °C. The improved thermal stability may be attributed to the coordination complex [Co(II)TP-OHPP], which seems to reduce the decomposition rate, possibly due to the shielding effect of the complex on the clay surface, reducing volatilization or decomposition. The addition of CPTES and [Co(II)TP-OHPP] enhances the thermal stability of bentonite clay, with [Co(II)TP-OHPP]/CPTES–bentonite showing the least weight loss. This suggests that functionalization with CPTES and the subsequent complexation with [Co(II)TP-OHPP] provide increased thermal resistance, making the modified bentonite clay more stable under thermal conditions.
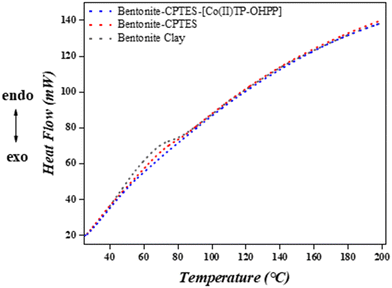
3.1.6.2. Differential scanning calorimetry (DSC). Fig. 9 illustrates the heat flow (in mW) as a function of temperature (°C) for three samples: bentonite clay, CPTES–bentonite, and [Co(II)TP-OHPP]/CPTES–bentonite, over a temperature range from about 30 °C to 200 °C. It was observed that bentonite clay samples exhibit a steady increase in heat flow with temperature. Initially, they show a slightly lower heat flow than the other two samples, indicating a difference in thermal response. This lower heat flow may result from fewer interactions within the clay, as the modified samples lack the additional functional groups or complexes, while the CPTES–bentonite sample shows a slightly higher heat flow than bentonite clay, especially at lower temperatures, and follows a similar upward trend. This increase in heat flow is likely due to the presence of CPTES (3-chloropropyltriethoxysilane) groups, which can introduce additional thermal effects due to bond interactions or energy requirements for phase transitions. In addition, the [Co(II)TP-OHPP]/CPTES–bentonite sample has the highest heat flow throughout the temperature range, closely tracking CPTES–bentonite but slightly higher overall. The increased heat flow suggests that the [Co(II)TP-OHPP] complex may enhance thermal activity in the sample, potentially due to additional molecular interactions or energy absorption associated with the complex. Finally, the DSC results indicate that functionalization with CPTES and further complexation with [Co(II)TP-OHPP] increases heat flow compared to pure bentonite clay. This implies that these modifications may require more energy during heating, possibly due to additional phase transitions or interactions introduced by the CPTES and [Co(II)TP-OHPP] groups. This enhanced heat flow may correlate with increased thermal stability or unique structural changes in the modified bentonite samples.
3.2. Study of dielectric properties of bentonite clay, CPTES–bentonite clay, and [Co(II)TP-OHPP]/CPTES–bentonite clay
Fig. 10(a) shows the dielectric constant (ε′) of bentonite clay as a function of frequency (f) across a range of temperatures from 30 °C to 200 °C. The dielectric constant is significantly high at lower frequencies (around 103 Hz), with values exceeding 50![[thin space (1/6-em)]](https://www.rsc.org/images/entities/char_2009.gif) 000 at 30 °C. This high dielectric constant at low frequencies can be attributed to the interfacial polarization and the high mobility of ions within the clay structure. As the frequency increases, the dielectric constant sharply decreases, indicating that the dipoles and charge carriers within the bentonite clay cannot reorient quickly enough to keep up with the alternating electric field. This decrease in ε′ continues consistently across all temperatures, levelling off at higher frequencies (around 105 Hz). Furthermore, the ε′ value decreases with increasing temperature at lower frequencies, suggesting that thermal agitation reduces the polarization effect. However, at higher frequencies, the temperature variation has a less pronounced effect on the dielectric constant, indicating a convergence in behavior. This frequency-dependent dielectric response highlights the significant role of frequency and temperature in the dielectric properties of bentonite clay, which is crucial for its applications in electronic devices and sensors.
000 at 30 °C. This high dielectric constant at low frequencies can be attributed to the interfacial polarization and the high mobility of ions within the clay structure. As the frequency increases, the dielectric constant sharply decreases, indicating that the dipoles and charge carriers within the bentonite clay cannot reorient quickly enough to keep up with the alternating electric field. This decrease in ε′ continues consistently across all temperatures, levelling off at higher frequencies (around 105 Hz). Furthermore, the ε′ value decreases with increasing temperature at lower frequencies, suggesting that thermal agitation reduces the polarization effect. However, at higher frequencies, the temperature variation has a less pronounced effect on the dielectric constant, indicating a convergence in behavior. This frequency-dependent dielectric response highlights the significant role of frequency and temperature in the dielectric properties of bentonite clay, which is crucial for its applications in electronic devices and sensors.
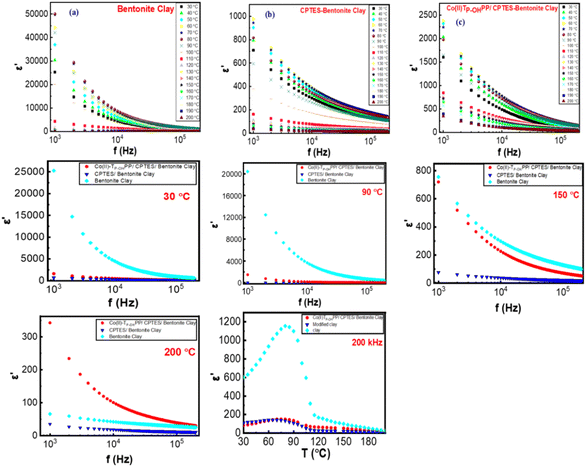 | ||
| Fig. 10 Dielectric constants are functions of frequency and temperature for the three composites: (a) bentonite clay, (b) CPTES–bentonite clay, and (c) [Co(II)TP-OHPP]/CPTES–bentonite clay. | ||
Fig. 10(b) shows the dielectric constant (ε′) of the (3-chloropropyltriethoxysilane) (CPTES)–bentonite clay composite as a function of frequency and temperature. At lower frequencies (around 103 Hz), the dielectric constant is notably high (ε′ = 1000), which can be attributed to the interfacial polarization and mobile charge carriers within the composite material. This high dielectric constant at low frequencies decreases sharply as the frequency increases, indicating the limited ability of dipoles and charge carriers to reorient in response to the rapidly alternating electric field. The graph also shows that the dielectric constant decreases with increasing temperature at lower frequencies, suggesting that increased thermal energy disrupts the alignment of dipoles and reduces polarization. However, at higher frequencies (105 Hz), the effect of temperature on the dielectric constant becomes less pronounced, and the dielectric constant values tend to converge to around 200. This frequency-dependent dielectric behavior highlights the complex interplay between the CPTES modification and the bentonite clay matrix, which is influenced by the frequency of the applied field and the temperature. Comparing these results with those obtained for the bentonite clay in Fig. 10(a), the value of the dielectric constant decreased; as we can expect from these results, the CPTES increased the leakage current inside the matrix, making this composite material potentially useful for applications in electronic devices and sensors due to the enhanced dielectric properties.
Fig. 10(c) depicts the dielectric constant (ε′) of the composite material composed of [Co(II)TP-OHPP]/CPTES-modified bentonite clay as a function of frequency and temperature. From this figure, it was found that the composites exhibited a distinctive characteristic. At lower frequencies (around 103 Hz), the dielectric constant is significantly high (ε′ = 2400), reflecting the contribution of interfacial polarization and the high mobility of charge carriers within the composite. This high initial dielectric constant decreases sharply with increasing frequency, indicating that the dipoles and charge carriers in the composite cannot align quickly enough to respond to the rapidly oscillating electric field. As temperature rises, the dielectric constant at low frequencies generally decreases, suggesting that thermal agitation disrupts the polarization mechanisms. However, at higher frequencies (around 105 Hz), the ε′ values decreased, showing less temperature dependence. This behavior suggests that the intrinsic properties of the composite materials, rather than thermal effects, dominate the dielectric response at higher frequencies. The complex interplay between [Co(II)TP-OHPP], CPTES, and bentonite clay within the composite, modulated by both frequency and temperature, highlights its potential for use in advanced electronic and sensor applications where precise dielectric properties are essential.
In comparing the dielectric properties of the three composites, pure bentonite clay's dielectric constant (ε′) is very high at low frequencies, exceeding 50![[thin space (1/6-em)]](https://www.rsc.org/images/entities/char_2009.gif) 000 at around 103 Hz and 30 °C. Moreover, the dielectric constant decreases sharply with increasing frequency, indicating intense interfacial polarization and the presence of mobile charge carriers. At higher frequencies (105 Hz), the values level off, showing a reduced ability of dipoles to reorient with the electric field. Higher temperatures generally reduce the dielectric constant at low frequencies due to increased thermal agitation, which disrupts dipole alignment. At higher frequencies, the effect of temperature is less pronounced.45–47
000 at around 103 Hz and 30 °C. Moreover, the dielectric constant decreases sharply with increasing frequency, indicating intense interfacial polarization and the presence of mobile charge carriers. At higher frequencies (105 Hz), the values level off, showing a reduced ability of dipoles to reorient with the electric field. Higher temperatures generally reduce the dielectric constant at low frequencies due to increased thermal agitation, which disrupts dipole alignment. At higher frequencies, the effect of temperature is less pronounced.45–47
For the CPTES–bentonite clay composite, the addition of CPTES to bentonite clay retains a high dielectric constant at low frequencies, similar to pure bentonite clay, but may show slightly modified values due to the presence of the organic modifier. Furthermore, the dielectric constant decreases with increasing frequency, exhibiting a similar trend to that of pure bentonite clay. The organic modification can influence the interfacial polarization, potentially altering the frequency response. CPTES might affect the temperature dependence by stabilizing or destabilizing the dipole interactions within the composite. Generally, higher temperatures still reduce the dielectric constant at lower frequencies, but the convergence at higher frequencies may differ slightly from the pure bentonite clay.
As for the composite of [Co(II)TP-OHPP]/CPTES–bentonite clay, this complex composite also starts with a high dielectric constant at low frequencies, influenced by the contributions from the porphyrinato cobalt(II) complex, CPTES, and bentonite clay. In addition, the dielectric constant exhibits a sharp decrease with increasing frequency, similar to the other composites. The intricate molecular structure of [Co(II)TP-OHPP] can introduce additional polarization mechanisms, affecting the overall frequency response. Furthermore, the temperature dependence of this composite shows that the dielectric constant decreases at low frequencies with increasing temperature. However, the convergence at higher frequencies might display unique behavior due to the combined effects of the metal–organic complex, the organic silane, and the clay matrix. This could lead to a slightly different thermal stability compared to the other two composites.
The dielectric constant (ε′) as a function of temperature at a constant frequency of 200 kHz is presented in Fig. 10 for bentonite clay, CPTES–bentonite clay, and [Co(II)TP-OHPP]/CPTES–bentonite clay. For bentonite clay, the dielectric constant increases significantly with temperature, reaching a pronounced peak around 80–90 °C before decreasing. This peak suggests strong relaxation behavior, likely due to dipolar or interfacial polarization. The behavior can be attributed to water molecules or other adsorbed species within the clay structure becoming more mobile and contributing to polarization as the temperature rises. The subsequent decline at higher temperatures may result from the evaporation of water or the destabilization of polarized species. In contrast, CPTES–bentonite clay and [Co(II)TP-OHPP]/CPTES–bentonite clay exhibit relatively low and stable dielectric constants over the entire temperature range, indicating minimal temperature-dependent polarization. For CPTES–bentonite clay (blue triangles), the absence of a pronounced peak suggests that functionalization with CPTES reduces the mobility of dipolar entities or blocks interfacial polarization. This implies that functionalization limits the availability of polarizable species or traps them, thereby stabilizing the dielectric behavior across the temperature range. For [Co(II)TP-OHPP]/CPTES–bentonite clay (red squares), the dielectric constant is lower compared to raw and functionalized clay, indicating further structural stabilization. The presence of the Co(II) complex may hinder polarization mechanisms through steric effects or electronic interactions, thereby suppressing relaxation phenomena. At lower temperatures, dipoles or interfacial charges exhibit limited mobility due to reduced thermal energy. As the temperature increases, the mobility of dipoles or charges enhances, leading to a peak in ε′ (as observed in bentonite clay). Beyond a critical temperature, the energy becomes sufficient to overcome bonding forces, resulting in depolarization or structural changes, such as water loss in clays, which leads to a drop in ε′. The functionalization of bentonite clay with CPTES and the incorporation of the Co(II) complex modify the material's dielectric response. These treatments likely reduce the number of free or loosely bound polar species, thereby stabilizing the material against temperature-induced relaxation effects. At the relatively high frequency of 200 kHz, only fast-relaxing processes such as dipolar relaxation are observed, while slower mechanisms (e.g., interfacial polarization) are suppressed. This emphasizes the differences in intrinsic relaxation properties of the materials.
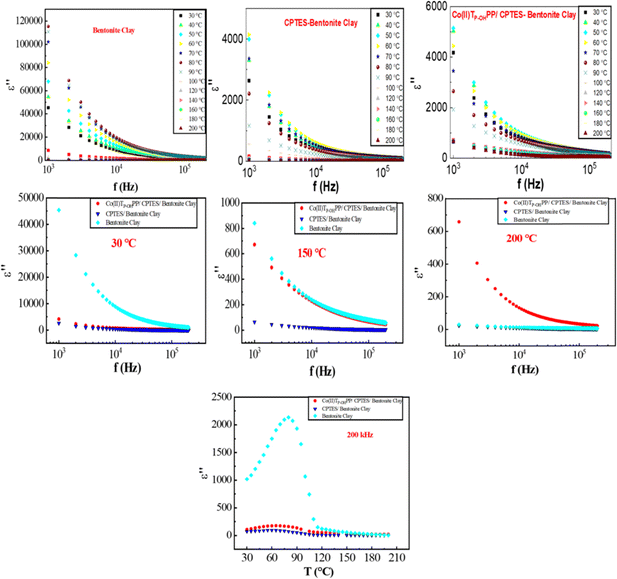 | ||
| Fig. 11 Dielectric loss as functions of frequency and temperature for the three composites: bentonite clay, CPTES–bentonite clay, and [Co(II)TP-OHPP]/CPTES–bentonite clay. | ||
The observation of temperature shows the dielectric loss (ε′′) over a frequency range from 103 Hz to 105 Hz at various temperatures from 30 °C to 200 °C. The dielectric loss quantifies the energy dissipated as heat in a dielectric material when subjected to an alternating electric field. It is a critical parameter for understanding the efficiency and performance of dielectric materials in electronic applications. The dielectric loss is relatively high at 30 °C and low frequency (103 Hz), indicating significant energy dissipation. This is due to interfacial polarization and the movement of charge carriers within the composite. As the frequency increases, the dielectric loss decreases, suggesting that the dipoles and charge carriers cannot align with the rapidly changing electric field, resulting in lower energy dissipation. However, with increasing temperature (40 °C to 80 °C) and low frequency, the dielectric loss remains high at low frequencies. Still, it slightly increases compared to 30 °C due to enhanced thermal agitation, increasing the mobility of charge carriers and dipoles, leading to more energy dissipation. The decreasing trend with frequency continues, and the dielectric loss values at high frequencies are slightly higher than that at 30 °C, but the overall decreasing trend remains consistent. At higher temperatures (100 °C) and lower frequencies, there is a noticeable increase in dielectric loss at low frequencies, as higher thermal energy further increases the mobility of charge carriers. While at high frequencies, the dielectric loss decreases but remains higher than that at lower temperatures, retaining the trend of reduced energy dissipation with increasing frequency. At increased temperatures between 120 °C and 160 °C and at low frequencies, the dielectric loss continues to increase, indicating more significant energy dissipation due to higher thermal energy enhancing the movement of dipoles and charge carriers. While in a higher frequency range, the dielectric loss decreases, following the same trend, but the values at these frequencies are consistently higher than those at 100 °C, showing the influence of temperature. Upon increasing the temperature to 180 °C and at lower frequencies, the dielectric loss peaks show maximum energy dissipation due to the high thermal agitation and mobility of the charge carriers and dipoles within the composite. However, at high frequencies, the dielectric loss is higher than that at 160 °C, but it still follows the general trend of decreasing with increasing frequency. At 200 °C and lower frequencies, the dielectric loss is substantial, reflecting the significant energy dissipation due to extreme thermal effects. Even at high frequencies, the dielectric loss, lower than that at low frequencies, remains higher compared to that at all other temperatures, indicating that high thermal energy significantly influences the dielectric behavior across the frequency spectrum.
Fig. 11 demonstrates that the dielectric loss of the [Co(II)TP-OHPP]/CPTES–bentonite clay composite is highly dependent on both frequency and temperature. At low frequencies, the dielectric loss is high. It increases with temperature, indicating significant energy dissipation due to interfacial polarization and the movement of charge carriers, which is enhanced by thermal agitation. As the frequency increases, the dielectric loss decreases across all temperatures, reflecting the reduced ability of dipoles and charge carriers to follow the rapidly alternating electric field. This trend remains consistent but with elevated values at higher temperatures, highlighting the composite's sensitivity to thermal effects. These observations are crucial for understanding the performance and efficiency of this composite material in applications where dielectric loss is a critical factor.
The dielectric loss (ε′′) as a function of temperature at a constant frequency of 200 kHz for three samples is illustrated in Fig. 11 for the bentonite clay, CPTES–bentonite clay, and [Co(II)TP-OHPP]/CPTES–bentonite clay. Dielectric loss (ε′′) represents energy dissipation within a material under an applied AC electric field and is primarily influenced by relaxation processes such as dipolar relaxation, ionic conduction, and interfacial polarization. Analyzing ε′′ as a function of temperature provides insights into the underlying polarization and dissipation mechanisms. For bentonite clay, the dielectric loss exhibits a significant peak around 80–90 °C. This peak corresponds to relaxation phenomena, likely caused by dipolar or interfacial polarization. At lower temperatures, water molecules or other adsorbed species in the clay matrix are less mobile, leading to minimal energy dissipation. As the temperature increases, the mobility of these dipoles or charge carriers is enhanced, resulting in increased dielectric loss. The peak represents the temperature at which polarization mechanisms are most active. Beyond 90 °C, the decline in ε′′ can be attributed to water evaporation, reduced dipole mobility, or the breakdown of interfacial polarization. In the case of CPTES–bentonite clay, the dielectric loss is slightly higher than that of pure bentonite clay but remains relatively steady, with no distinct peaks or significant increases. This indicates that functionalization with CPTES reduces the number of polarizable species or restricts their mobility, thereby minimizing energy dissipation. The absence of a pronounced peak suggests that the functionalization modifies the material's structure, suppressing relaxation mechanisms such as interfacial or dipolar polarization. The dielectric loss for [Co(II)TP-OHPP]/CPTES–bentonite clay is even lower than that of CPTES–bentonite clay, indicating further suppression of relaxation processes. The incorporation of the Co(II) complex likely stabilizes the clay structure through steric effects or electronic interactions, thereby hindering the mobility of charge carriers and dipoles. This stabilization reduces energy dissipation and enhances the material's resistance to temperature-dependent relaxation phenomena. At low temperatures, dielectric loss is minimal due to limited thermal energy, which restricts the mobility of dipoles or charge carriers. As the temperature increases, thermal energy becomes sufficient to activate relaxation processes, leading to a peak in ε′′. This is particularly evident for bentonite clay, where the peak corresponds to enhanced dipolar or interfacial polarization. Beyond a critical temperature, polarization mechanisms weaken due to depolarization, structural changes, or water evaporation, resulting in a decline in ε′′. At the relatively high frequency of 200 Hz, only fast-relaxing processes, such as dipolar relaxation, are active, while slower processes (e.g., interfacial polarization or ionic conduction) are suppressed. The differences in ε′′ across the three materials reflect their intrinsic ability to support fast-relaxation mechanisms. The peak in dielectric loss for bentonite clay highlights the dominance of temperature-activated dipolar or interfacial polarization. Functionalization with CPTES and the addition of the Co(II) complex significantly suppress relaxation mechanisms, stabilizing the dielectric loss across the temperature range. These modifications enhance the material's resistance to energy dissipation, making it more suitable for applications requiring low dielectric loss and stable performance under varying thermal conditions.
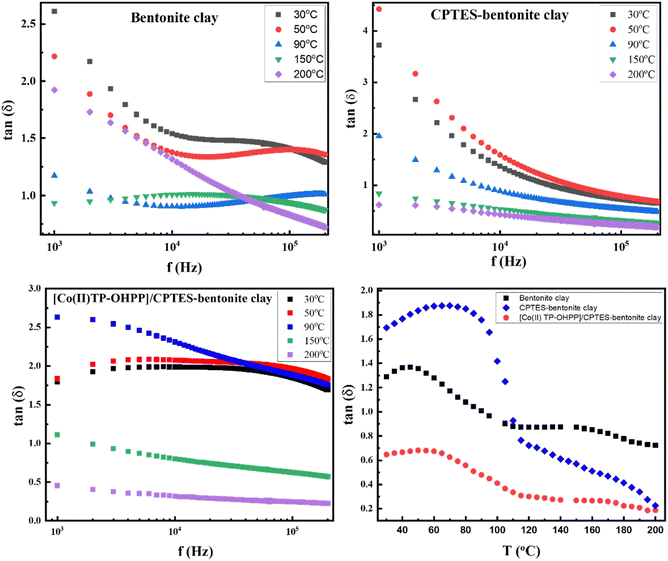
Fig. 12 illustrates the variation of the dielectric loss tangent (tan![[thin space (1/6-em)]](https://www.rsc.org/images/entities/char_2009.gif) δ) as a function of temperature (T) and frequency (f) for three different composites: bentonite clay, CPTES–bentonite clay, and [Co(II)TP-OHPP]/CPTES–bentonite clay. Firstly, for dielectric loss vs. temperature, the dielectric loss tangent is the highest for unmodified bentonite clay, indicating significant energy dissipation during polarization. The trend shows an initial increase followed by a decrease at higher temperatures. This behavior suggests that interfacial polarization and ion mobility dominate at lower temperatures, while thermal agitation reduces polarization at higher temperatures, leading to lower dielectric loss. However, the functionalization with CPTES reduces the dielectric loss tangent compared to unmodified bentonite clay, indicating improved thermal stability and reduced energy dissipation. The peak in the curve occurs at a lower temperature, reflecting changes in the material's structure and polarization mechanisms due to functionalization. On the other hand, the [Co(II)TP-OHPP]/CPTES–bentonite clay composite exhibits the lowest dielectric loss tangent across the temperature range, indicating superior thermal stability and reduced energy dissipation. The lower values are attributed to enhanced charge carrier immobilization and improved resistance to polarization loss due to the addition of [Co(II)TP-OHPP]. Secondly, for dielectric loss vs. frequency in the case of bentonite clay, the dielectric loss is significantly high at low frequencies, attributed to interfacial polarization and the dominance of charge carrier mobility. The dielectric loss decreases sharply as the frequency increases, reflecting reduced energy dissipation.
δ) as a function of temperature (T) and frequency (f) for three different composites: bentonite clay, CPTES–bentonite clay, and [Co(II)TP-OHPP]/CPTES–bentonite clay. Firstly, for dielectric loss vs. temperature, the dielectric loss tangent is the highest for unmodified bentonite clay, indicating significant energy dissipation during polarization. The trend shows an initial increase followed by a decrease at higher temperatures. This behavior suggests that interfacial polarization and ion mobility dominate at lower temperatures, while thermal agitation reduces polarization at higher temperatures, leading to lower dielectric loss. However, the functionalization with CPTES reduces the dielectric loss tangent compared to unmodified bentonite clay, indicating improved thermal stability and reduced energy dissipation. The peak in the curve occurs at a lower temperature, reflecting changes in the material's structure and polarization mechanisms due to functionalization. On the other hand, the [Co(II)TP-OHPP]/CPTES–bentonite clay composite exhibits the lowest dielectric loss tangent across the temperature range, indicating superior thermal stability and reduced energy dissipation. The lower values are attributed to enhanced charge carrier immobilization and improved resistance to polarization loss due to the addition of [Co(II)TP-OHPP]. Secondly, for dielectric loss vs. frequency in the case of bentonite clay, the dielectric loss is significantly high at low frequencies, attributed to interfacial polarization and the dominance of charge carrier mobility. The dielectric loss decreases sharply as the frequency increases, reflecting reduced energy dissipation.
Additionally, thermal agitation further disrupts polarization at higher frequencies and temperatures, leading to lower dielectric loss. However, the functionalized CPTES–bentonite clay shows a higher dielectric loss tangent at lower temperatures and frequencies than unmodified bentonite, likely due to increased charge carrier mobility introduced by CPTES. However, tan![[thin space (1/6-em)]](https://www.rsc.org/images/entities/char_2009.gif) δ decreases with increasing frequency and temperature, similar to bentonite clay, demonstrating reduced energy dissipation at higher frequencies. On the other hand, the [Co(II)TP-OHPP]/CPTES–bentonite clay composite exhibits the lowest dielectric loss tangent values across the frequency range, reflecting enhanced dielectric properties. The decrease in tan
δ decreases with increasing frequency and temperature, similar to bentonite clay, demonstrating reduced energy dissipation at higher frequencies. On the other hand, the [Co(II)TP-OHPP]/CPTES–bentonite clay composite exhibits the lowest dielectric loss tangent values across the frequency range, reflecting enhanced dielectric properties. The decrease in tan![[thin space (1/6-em)]](https://www.rsc.org/images/entities/char_2009.gif) δ is attributed to better charge carrier immobilization and structural stability, making it suitable for high-performance applications. The experimental data confirm that the functionalization of bentonite clay with CPTES and the subsequent addition of [Co(II)TP-OHPP] significantly improve the dielectric properties. The reduced dielectric loss tangent and increased thermal stability make these composites promising candidates for energy storage applications.
δ is attributed to better charge carrier immobilization and structural stability, making it suitable for high-performance applications. The experimental data confirm that the functionalization of bentonite clay with CPTES and the subsequent addition of [Co(II)TP-OHPP] significantly improve the dielectric properties. The reduced dielectric loss tangent and increased thermal stability make these composites promising candidates for energy storage applications.
The dielectric loss tangent (tan![[thin space (1/6-em)]](https://www.rsc.org/images/entities/char_2009.gif) δ) as a function of temperature at a constant frequency of 200 kHz reveals distinct behaviors for the bentonite clay, CPTES–bentonite clay, and [Co(II)TP-OHPP]/CPTES–bentonite clay composites. For bentonite clay and CPTES–bentonite clay, the dielectric loss tangent value increased and showed a hump at 90 °C and then decreased rapidly around 100 °C. Then it decreased slowly across the temperature range (200 °C), indicating minimal energy dissipation and limited polarization or conduction effects at this high temperature. In contrast, [Co(II)TP-OHPP]/CPTES–bentonite clay exhibits a noticeable increase in tan
δ) as a function of temperature at a constant frequency of 200 kHz reveals distinct behaviors for the bentonite clay, CPTES–bentonite clay, and [Co(II)TP-OHPP]/CPTES–bentonite clay composites. For bentonite clay and CPTES–bentonite clay, the dielectric loss tangent value increased and showed a hump at 90 °C and then decreased rapidly around 100 °C. Then it decreased slowly across the temperature range (200 °C), indicating minimal energy dissipation and limited polarization or conduction effects at this high temperature. In contrast, [Co(II)TP-OHPP]/CPTES–bentonite clay exhibits a noticeable increase in tan![[thin space (1/6-em)]](https://www.rsc.org/images/entities/char_2009.gif) δ with temperature and a small hump around 60 °C. This result suggests enhanced thermal stability, which is likely influenced by the incorporation of the [Co(II)TP-OHPP] complex. The subsequent decrease at higher temperatures indicates the saturation or breakdown of the polarization mechanisms, possibly due to reduced dipole alignment efficiency at elevated temperatures.
δ with temperature and a small hump around 60 °C. This result suggests enhanced thermal stability, which is likely influenced by the incorporation of the [Co(II)TP-OHPP] complex. The subsequent decrease at higher temperatures indicates the saturation or breakdown of the polarization mechanisms, possibly due to reduced dipole alignment efficiency at elevated temperatures.
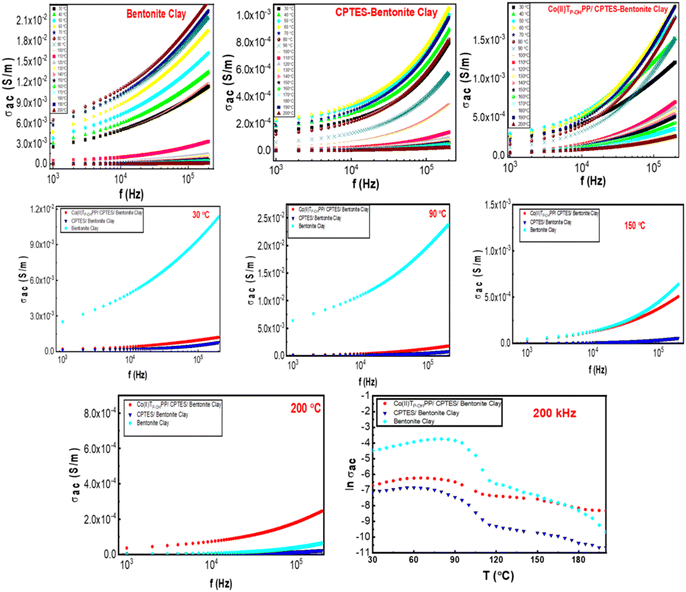 | ||
| Fig. 13 AC conductivity as functions of frequency and temperature for the three composites: bentonite clay, CPTES–bentonite clay, and [Co(II)TP-OHPP]/CPTES–bentonite clay. | ||
The AC conductivity (σAC) as a function of temperature at a constant frequency of 200 kHz shows notable differences among bentonite clay, CPTES–bentonite clay, and [Co(II)TP-OHPP]/CPTES–bentonite clay. For bentonite clay and CPTES–bentonite clay, the AC conductivity remains relatively low and exhibits minimal variation with temperature; there is a hump observed at temperature 90 °C; with increasing temperature up to 120 °C, it decreased, indicating limited charge carrier mobility and minimal conduction processes. However, for [Co(II)TP-OHPP]/CPTES–bentonite clay, the AC conductivity increases significantly with temperature, reflecting the thermal activation of charge carriers. The enhanced conductivity of this sample is likely due to the introduction of the [Co(II)TP-OHPP] complex, which facilitates the movement of charges through improved structural conductivity or additional charge carrier pathways. The increase in AC conductivity with temperature demonstrates the strong dependence of charge transport on thermal energy, particularly for the [Co(II)TP-OHPP]-modified sample.
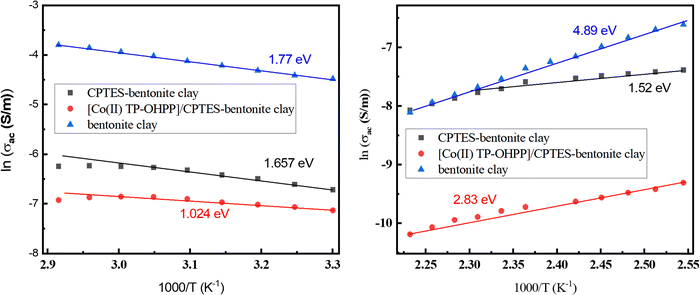
The conductivity data were analyzed using the Arrhenius equation, highlighting linear regions indicative of thermally activated processes in all samples, albeit with different slopes. Fig. 14 depicts the conductivity (ln![[thin space (1/6-em)]](https://www.rsc.org/images/entities/char_2009.gif) σ) as a function of the reciprocal temperature (1000/T) for three composites: bentonite clay, CPTES-modified bentonite clay, and [Co(II)TP-OHPP]/CPTES-modified bentonite clay. Both CPTES-modified and [Co(II)TP-OHPP]/CPTES-modified bentonite clay exhibit Arrhenius-like behavior (a linear relationship between ln
σ) as a function of the reciprocal temperature (1000/T) for three composites: bentonite clay, CPTES-modified bentonite clay, and [Co(II)TP-OHPP]/CPTES-modified bentonite clay. Both CPTES-modified and [Co(II)TP-OHPP]/CPTES-modified bentonite clay exhibit Arrhenius-like behavior (a linear relationship between ln![[thin space (1/6-em)]](https://www.rsc.org/images/entities/char_2009.gif) σ and 1000/T), indicative of thermally activated conduction. The activation energies in the low-temperature region are 1.77, 1.657, and 1.024 eV, while in the high-temperature region, they are 4.89, 1.52, and 2.83 eV for bentonite clay, CPTES-modified bentonite clay, and [Co(II)TP-OHPP]/CPTES-modified bentonite clay, respectively. A comparison of the composites reveals that the addition of CPTES and [Co(II)TP-OHPP] enhances conductivity compared to pure bentonite clay, as reflected in their higher slope values. This analysis demonstrates that functionalization with CPTES or [Co(II)TP-OHPP] modifies the material's structure, enhancing charge carrier mobility and making it more suitable for energy harvesting applications.
σ and 1000/T), indicative of thermally activated conduction. The activation energies in the low-temperature region are 1.77, 1.657, and 1.024 eV, while in the high-temperature region, they are 4.89, 1.52, and 2.83 eV for bentonite clay, CPTES-modified bentonite clay, and [Co(II)TP-OHPP]/CPTES-modified bentonite clay, respectively. A comparison of the composites reveals that the addition of CPTES and [Co(II)TP-OHPP] enhances conductivity compared to pure bentonite clay, as reflected in their higher slope values. This analysis demonstrates that functionalization with CPTES or [Co(II)TP-OHPP] modifies the material's structure, enhancing charge carrier mobility and making it more suitable for energy harvesting applications.
4. Conclusion
XRD patterns of bentonite clay, CPTES-modified bentonite clay, and [Co(II)TP-OHPP]/CPTES-modified bentonite clay show that the well-defined crystallographic planes of the bentonite had been distorted by sequential modification using CPTES and [Co(II)TP-OHPP], which introduced more disorder into the structure of the bentonite clay. FT-IR revealed the stretching vibrations of the most specific functional groups, which indicated that the samples were prepared well. The dielectric properties of the investigated composites reveal a nuanced interplay between frequency, temperature, and material composition. Pure bentonite clay demonstrates the highest dielectric constants at low frequencies, but the introduction of CPTES and [Co(II)TP-OHPP] retains high dielectric constants with some variability. All materials show a decrease in the dielectric constant with increasing frequency, with [Co(II)TP-OHPP] exhibiting distinctive frequency-dependent behavior due to additional polarization effects. Temperature generally reduces the dielectric constant at low frequencies across all materials, with less impact at high frequencies and unique stability features observed in the porphyrinato cobalt(II) composite. Dielectric loss and AC conductivity are significantly influenced by both frequency and temperature, with high dielectric loss at low frequencies and increased AC conductivity with temperature and frequency. The results show that bentonite clay exhibits the highest values of ε′ and ε′′ at 30 °C, particularly at low frequencies (103 Hz). However, the dielectric constants of CPTES–bentonite clay and [Co(II)TP-OHPP]/CPTES–bentonite clay enhanced the dielectric loss (ε′′). The CPTES–bentonite clay and [Co(II)TP-OHPP]/CPTES–bentonite clay materials showed an adjustment in ε′ values with a corresponding acceptable loss, making the modified bentonite clay more stable under thermal conditions and at high frequencies. These findings are crucial for optimizing the use of these composites in electronic and sensor technologies, where both dielectric performance and conductivity are essential.Ethical approval
No ethical approval was granted to conduct the experiments involved within the manuscript.Author contributions
Mohamed M. Alaskary fabricated and characterized the composites. G. H. Ramzy investigated the dielectric results. A. I. Ali, Sahar H. El. Khalafy and Mahmoud T. Hassanein contributed to the analysis of the data, writing the draft of the manuscript and reviewing the manuscript.Data availability
The data that support the findings of this study are available from the corresponding author upon reasonable request.Conflicts of interest
The authors declare that they have no known competing financial interests or personal relationships that could have appeared to influence the work reported in this work.References
- W. Liu, et al., Review of Energy Storage Capacitor Technology, Batteries, 2024, 10(8), 271 CrossRef CAS.
- M. Hussain, et al., Flexible Dielectric Materials: Potential and Applications in Antennas and RF Sensors, Adv. Electron. Mater., 2024, 2400240 CrossRef CAS.
- Z. Rahimi-Ahar and L. R. Ahar, Thermal, optical, mechanical, dielectric, and electrical properties of nanocomposites, Eur. Polym. J., 2024, 113337 CrossRef CAS.
- K. L. Routray and S. Saha, Graphene nanoplatelets anchored into Ag doped spinel CoFe2O4 nanohybrid: Synthesis, structural, electrical, superior dielectric and room temperature induced ferromagnetism performance for high frequency device application, Diamond Relat. Mater., 2024, 141, 110680 CrossRef CAS.
- K. L. Routray, S. Saha and D. Behera, Insight Into the Anomalous Electrical Behavior, Dielectric and Magnetic Study of Ag-Doped CoFe2O4 Synthesised by Okra Extract-Assisted Green Synthesis, J. Electron. Mater., 2020, 49(12), 7244–7258 CrossRef.
- S. Pattipaka, et al., Ceramic-Based Dielectric Materials for Energy Storage Capacitor Applications, Materials, 2024, 17(10), 2277 CrossRef CAS.
- R.-L. Liu, et al., AI for dielectric capacitors, Energy Storage Mater., 2024, 71, 103612 CrossRef.
- M. Shehata, et al., Effect of electron irradiation on alternating current electrical properties of gelatin–cadmium sulfide nano-composite films, Mater. Sci. Eng. Technol., 2023, 54(10), 1196–1212 CAS.
- A. I. Ali, et al., Preparation, structural and dielectric properties of nanocomposite Al2O3/BaTiO3 for multilayer ceramic capacitors applications, J. Mater. Res. Technol., 2022, 18, 2083–2092 CrossRef CAS.
- A. A. Moez, H. Elmeleegi and A. I. Ali, Preparation and investigation of structure, optical, nonlinear optical and thermoelectric properties of Bi2Se3 thin film, Mater. Technol., 2022, 37(10), 1450–1458 CrossRef CAS.
- A. A. Moez and A. I. Ali, Investigation of structure, dielectrical, optical, and electronic properties for Y0.225Sr0.775CoO3 thin films deposited on different single crystal substrates using pulsed laser deposition (PLD) method, J. Mater. Sci.: Mater. Electron., 2021, 32, 19275–19283 CrossRef CAS.
- L. Perelomov, et al., Organoclays Based on Bentonite and Various Types of Surfactants as Heavy Metal Remediants, Sustainability J., 2024, 16(11), 4804 CrossRef CAS.
- B. K. Theng, The chemistry of clay-organic reactions, CRC Press, 2024 Search PubMed.
- A. H. Bashal, et al., Enhancing dielectric properties of bentonite with Ce and Zn: structural insights and industrial applications, J. Sol-Gel Sci. Technol., 2024, 1–16 Search PubMed.
- A. H. Bashal, The Impact of Different Metal Dopants on the Structural, Dielectric, and Electrical Characteristics of Bentonite: Electrical Measurements Supported by Tight-Binding Calculations, J. Electron. Mater., 2024, 1–10 Search PubMed.
- J. Wang, et al., A review of barrier properties of polymer-modified bentonite applied to vertical cutoff walls under dry-wet cycling and chemical erosion, J. Water Process Eng., 2024, 65, 105759 CrossRef.
- J. Cheng, et al., Preparation and characterization analysis of modified bentonite-based powder for improving explosion suppression effects, Powder Technol., 2024, 440, 119758 CrossRef CAS.
- B. Cirera, et al., Lanthanide-porphyrin species as Kondo irreversible switches through tip-induced coordination chemistry, Nanoscale, 2021, 13(18), 8600–8606 RSC.
- M. P. Militello, et al., Photophysics and photochemistry of porphyrin core PAMAM dendrimers. Excited states interaction with quinones, J. Photochem. Photobiol., A, 2020, 388, 112167 CrossRef CAS.
- Z. Liu, et al., Ether-linked porphyrin covalent organic framework with broadband optical switch, iScience, 2021, 24, 102526 CrossRef CAS PubMed.
- Y. Pang, et al., A novel fluorescence sensor based on Zn porphyrin MOFs for the detection of bisphenol A with highly selectivity and sensitivity, Food Control, 2022, 132, 108551 CrossRef CAS.
- X. Wang, et al., Highly sensitive artificial visual array using transistors based on porphyrins and semiconductors, Small, 2021, 17(2), 2005491 CrossRef CAS PubMed.
- V. Cuesta, et al., Gold(III) porphyrin was used as an electron acceptor for efficient organic solar cells, ACS Appl. Mater. Interfaces, 2022, 14(9), 11708–11717 CrossRef CAS PubMed.
- M. Fathalla, Synthesis and characterization of a porphyrin-crown ether conjugate as a potential intermediate for drug delivery application, J. Porphyrins Phthalocyanines, 2021, 25(02), 95–101 CrossRef CAS.
- S. H. El-Khalafy, M. T. Hassanein and A. A. Mubarak, Efficient and green oxidation of 2-aminophenol catalyzed by tetra-(p-methoxyphenyl) porphyrin complexes anchored on chitosan in bicarbonate solution, Chem. Pap., 2024, 78(2), 1205–1215 CrossRef CAS.
- S. H. El-Khalafy, et al., Synthesis and characterization of Co(II) porphyrin complex supported on chitosan/graphene oxide nanocomposite for efficient green oxidation and removal of Acid Orange 7 dye, Sci. Rep., 2024, 14(1), 17073 CrossRef CAS PubMed.
- S. H. El-Khalafy, et al., Catalytic activity of Mn(III) porphyrin complex supported onto cross linked polymers in the green oxidation of malathion with hydrogen peroxide in aqueous solution, Arabian J. Chem., 2023, 16(8), 104969 CrossRef CAS.
- S. H. El-Khalafy, et al., Catalytic activity of Co(II)-porphyrin anchored onto polymeric support of electrospun polyacrylonitrile nanofiber: synthesis and efficient green oxidation of crystal violet dye with hydrogen peroxide, Biomass Convers. Biorefin., 2023, 1–12 Search PubMed.
- W. Yang, et al., Multifunctional phosphorus-containing porphyrin dye for efficiently improving the thermal, toughness, flame retardant and dielectric properties of epoxy resins, Prog. Org. Coat., 2024, 186, 107967 CrossRef CAS.
- N. Amiri, et al., Bis (DMAP) cobalt(II) porphyrin complexes: Dielectric properties and visible light irradiated photocatalytic degradation of toluidine blue studies, Inorg. Chem. Commun., 2023, 158, 111551 CrossRef CAS.
- N. Amiri, et al., Synthesis, molecular structure, spectroscopic characterization and dielectric properties of new cobalt(II) meso-tetraphenylporphyrin-based coordination complex, Inorg. Chem. Commun., 2020, 118, 107995 CrossRef CAS.
- V. Gómez-Vidales, et al., Design and Synthesis of a Multi Cu(II)-porphyrin Array, Open Chem. J., 2016, 3(1), 25–34 CrossRef.
- F. Koohestani, S. Sadjadi and M. Heravi, Composite of bentonite and cyclodextrin as an efficient catalyst for promoting chemical transformations in aqueous media, Sci. Rep., 2021, 11(1), 5102 CrossRef CAS PubMed.
- X.-Q. Yu, et al., Polymer-supported ruthenium porphyrins: versatile and robust epoxidation catalysts with unusual selectivity, J. Am. Chem. Soc., 2000, 122(22), 5337–5342 CrossRef CAS.
- K. Ezzayani, et al., Complex of hexamethylenetetramine with magnesium-tetraphenylporphyrin: Synthesis, structure, spectroscopic characterizations and electrochemical properties, J. Mol. Struct., 2017, 1137, 412–418 CrossRef CAS.
- C. Cretu, et al., Synthesis and spectroscopic characterization of meso-tetra (3-hydroxyphenyl) porphyrin, Rev. Chim., 2008, 59, 979–981 CAS.
- R. Wang, W. Jiao and B. Gao, Efficient biomimetic aerobic oxidation of phenylethane catalyzed by P(4VP-co-St)/SiO2-supported metalloporphyrins, Appl. Surf. Sci., 2009, 255(17), 7766–7772 CrossRef CAS.
- R. Vinodh, et al., Bentonite clay incorporated 3-aminopropyl triethoxy silane composite (bentonite/APTES) for CO2 Adsorption, Mater. Lett., 2021, 294, 129811 CrossRef CAS.
- D. P. Kgabi and A. A. Ambushe, Removal of Pb(II) ions from aqueous solutions using natural and HDTMA-modified bentonite and kaolin clays, Heliyon, 2024, 10, e38136 CrossRef CAS PubMed.
- C.-C. Yu, et al., Vibrational couplings and energy transfer pathways of water's bending mode, Nat. Commun., 2020, 11(1), 5977 CrossRef CAS PubMed.
- W. Li, et al., Preparation and characterization of 5,10,15,20-tetrakis(4-carboxyphenyl) porphyrin grafted on organosilane-pillared montmorillonite by covalent bonding, Adv. Compos. Hybrid Mater., 2020, 3, 541–545 CrossRef CAS.
- A. M. Elnahrawy, et al., Synthesis of hybrid chitosan/calcium aluminosilicate using a sol-gel method for optical applications, J. Alloys Compd., 2016, 676, 432–439 CrossRef CAS.
- A. Ali, Y. Kim and A. A. Moez, WITHDRAWN: Influence of different single crystal substrates on the structure, optical properties and dielectric results of Y0.225Sr0.775CoO3 thin films prepared by Pulsed Laser Deposition (PLD) method, Elsevier, 2013 Search PubMed.
- A. Ali, et al., Influence of substrate temperature on structural, optical properties and dielectric results of nano-ZnO thin films prepared by Radio Frequency technique, Superlattices Microstruct., 2014, 65, 285–298 CrossRef CAS.
- O. A. Salam, et al., A comparative study of PMMA/PEG polymer nanocomposites doped with different oxides nanoparticles for potential optoelectronic applications, Sci. Rep., 2024, 14(1), 19295 CrossRef CAS PubMed.
- M. A. Alsaiari, et al., Advantages incorporating V2O5 nanoparticles into PMMA composite membranes for the structural, optical, electrical, and mechanical properties for conductive polymeric membrane applications, Mater. Adv., 2024, 5(8), 3297–3308 RSC.
- A. I. Ali, et al., Dielectric and dynamic antibacterial investigations of organic–inorganic conductive membranes based on oxidized cellulose with BNKT nanoceramics, Cellulose, 2023, 30(14), 9027–9046 CrossRef CAS.
Footnote |
| † Electronic supplementary information (ESI) available. See DOI: https://doi.org/10.1039/d4ma00982g |
| This journal is © The Royal Society of Chemistry 2025 |

