 Open Access Article
Creative Commons Attribution 3.0 Unported Licence
On the band gap variation in CH3NH3Pb(I1−xBrx)3
Sergei M.
Butorin

Condensed Matter Physics of Energy Materials, X-ray Photon Science, Department of Physics and Astronomy, Uppsala University, P. O. Box 516, SE-751 20 Uppsala, Sweden. E-mail: sergei.butorin@physics.uu.se
First published on 13th March 2025
Abstract
The electronic structure and the band gap behavior of CH3NH3Pb(I1−xBrx)3 for x = 0.25, 0.33, 0.50, 0.67, 0.75, 1.00 were studied using the full-relativistic density-functional-theory calculations. A combination of the parameter-free Armiento–Kümmel generalized gradient approximation exchange functional with the nonseparable gradient approximation Minnesota correlation functional was employed. The calculated band gap sizes for the CH3NH3Pb(I1−xBrx)3 series were found to be similar to the experimentally measured values. While the change of the optimized lattice parameter with an increasing Br content can be described by a linear fit, the calculated band gap variation exhibits rather a quadratic-like behavior over the x region of the cubic crystal structure. While the experimental reports are divided on whether the bowing parameter value is being very small or significant, our calculated results support the latter case.
1 Introduction
Hybrid metal halide perovskites (HaPs) are considered to be advanced materials for solar cell applications.1 One of the valuable properties of HaPs is an ease of the adjustment of their band gap by an interchange of the halogen atoms. In particular, in the mixed halide MAPb(I1−xBrx)3 system (MA stands for methylammonium), the band gap varies from ∼1.5 eV for x = 0 to ∼2.3 eV for x = 1. Although, that was demonstrated in a number of publications,2–11 the published data are not always consistent with each other. For example, different x values were reported for the observed phase transition in the MAPb(I1−xBrx)3 series from the MAPbI3-like tetragonal structure to the cubic one. The dependence of the increasing band gap on the Br content, replacing I, was found to be linear6,9 or quadratic-like2,4,7,10,11 with a positive bowing parameter12 value (coefficient for the x2 term) in the fitting equation. Moreover, Zhang et al.9 reported a fit with a negative bowing parameter. It was also hinted that the non-linear behavior of the band gap with increasing Br fraction may be connected to a non-equivalent replacement of I with Br or to a deviation from the intended Br quantity during the sample synthesis as suggested by alternative methods of the estimation of the Br content.A number of the density functional theory (DFT) calculations were also performed13–17 to study the crystal and electronic structure of MAPb(I1−xBrx)3. However, in most cases, the spin–orbit coupling (SOC) was not included in the DFT analysis. SOC is strong in the Pb-based HaPs and significantly affects the density of states (DOS) close to the conduction band minimum (CBM) in these materials. Therefore, it is important to take into account SOC for HaPs. Chang et al.15 applied SOC as well as hybrid functional HSE06 in their calculations but investigated only MAPbI2Br and MAPbIBr2 compounds out of the whole MAPb(I1−xBrx)3 series. Note that most of the cited computational work was based on utilizing the tetragonal-like unit cells while recent experiments10,11 for single crystals and polycrystalline samples indicated the cubic structure of MAPb(I1−xBrx)3 for x above 0.2.
The goals of the present work are to investigate the electronic structure changes for the whole MAPb(I1−xBrx)3 series using the DFT method taking into account SOC, to estimate the band gaps and their dependence on the x value in the view of some discrepancies between various experimental data and to confirm the validity and accuracy of the recently suggested computational approach18 in the case of the electronic structure assessment of doped HaPs when the use of supercells with large number of atoms is necessary in the DFT calculations.
The approach18 combining the parameter-free Armiento–Kümmel generalized gradient approximation (AK13-GGA) exchange functional19 with the nonseparable gradient approximation Minnesota correlation functional (GAM)20 was applied. This allows for an efficient band gap estimation with accuracy similar to the GW approximation method but at the computational cost of conventional DFT. For comparison, calculations using the mBJ potential, which is considered to be very good for the band gap estimation, are around 10–50 times slower21 and require some readjustment of the mBJ parameters to obtain correct values/results for HaPs.22,23 In turn, calculations using hybrid functionals and the GW method can be 500 times slower and require larger operational memory.
2 Results and discussion
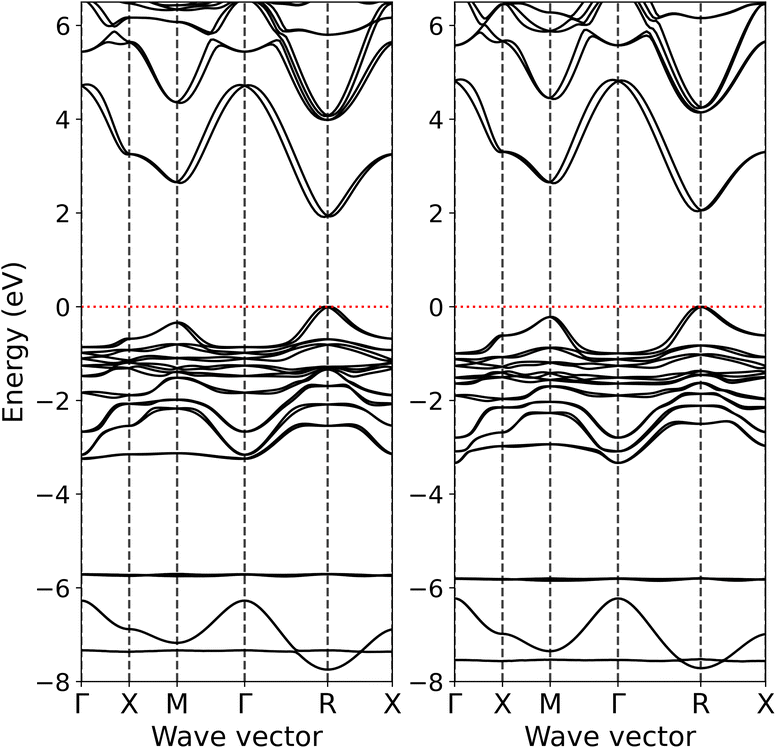
The electronic structure of MAPb(I1−xBrx)3 was studied for x = 0.25, 0.33, 0.50, 0.67, 0.75, 1.00 compositions. The x = 0.33 and 0.67 systems correspond to MAPbI2Br and MAPbIBr2 compounds, respectively. For this purpose, the 2 × 2 × 2 supercells (96 atoms in total) were constructed where the corresponding number of Br and I atoms interchanged to obtained the required composition. In the case of MAPbI2Br and MAPbIBr2, the conventional unit cells were used in the DFT calculations for simplicity. Since the most recent experimental reports10,11 on the crystal structure of MAPb(I1−xBrx)3 indicate that the tetragonal to cubic transition takes place for x ≥ 0.2, in present work, the DFT calculations of the electronic structure were performed for optimized pseudocubic crystal structures for all described compositions. In other words, the cubic crystal structure region of the MAPb(I1−xBrx)3 phase diagram was sampled.Fig. 1 displays the calculated band structure for MAPbI2Br and MAPbIBr2. It is evident that having both smaller and larger fractions of I or Br atoms in the cubic crystal structure does not lead to any dramatic changes in the band structure and band dispersion. Besides an increasing direct band gap at high-symmetry point R from 1.94 to 2.08 eV upon going from MAPbI2Br to MAPbIBr2, the topmost occupied band at high-symmetry point M appears to be closer to valence band maximum (VBM) in MAPbIBr2 than in MAPbI2Br. Some differences are also observed for the unoccupied bands above 6 eV, in particular at high-symmetry points X, M and Γ and for the X−M−Γ path. These calculated band structures are in good correspondence with that published earlier18 for cubic MAPbBr3 which was also calculated using the AK13/GAM combination.
 | ||
| Fig. 1 Band structure of pseudocubic MAPbI2Br (left hand side) and MAPbIBr2 (right hand side) calculated at the level of AK13/GAM theory. Zero eV is at the valence band maximum. | ||
Table 1 compares the calculated band gap sizes of MAPb(I1−xBrx)3 for various x with experimental ones10,11 for single crystals and polycrystalline samples. Besides the optically measured actual data, the experimental band gap sizes for some compositions were derived from equations used to fit the band gap dependence on x in ref. 10,11. The values for tetragonal MAPbI3 are also included in Table 1 to span the full x range. Note that the AK13/GAM calculated band gap for the 2 × 2 × 2 supercell of MAPbBr3 was the same as that in ref. 18.
An inspection of Table 1 reveals that calculated band gaps are in agreement with experimental results by Nakamura et al.11 but appear to be somewhat overestimated when compared with data published by Wang et al.10 Overall, there are also some variations in the band gap sizes among experimental reports2–11 when the same compositions are compared. That may be connected to the varying quality of the samples and different methods of their synthesis.
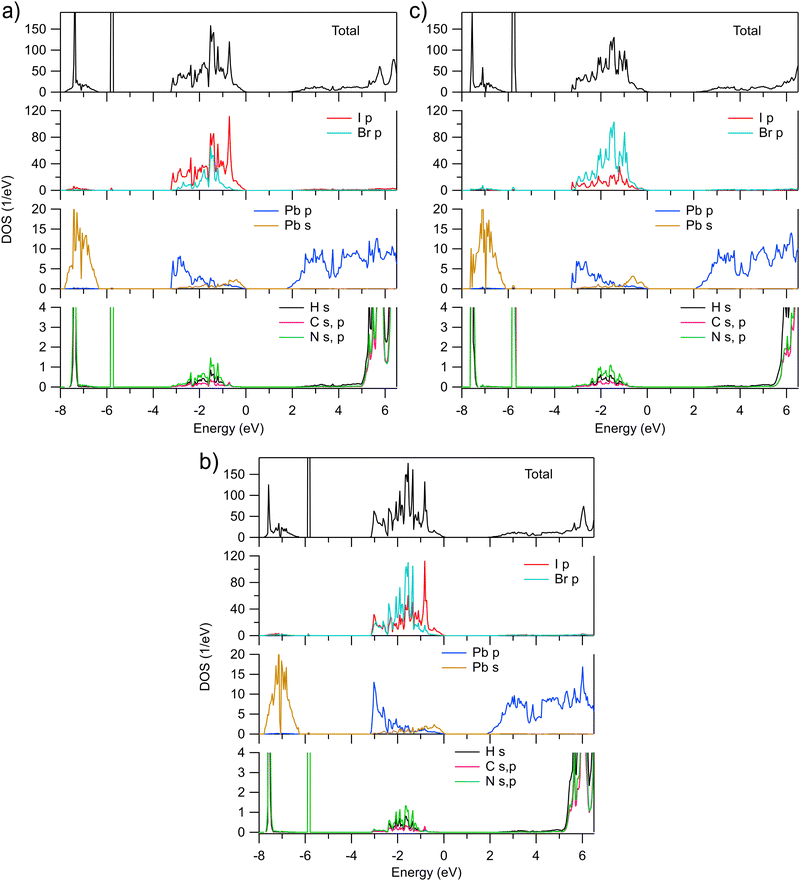
The AK13/GAM calculated total and partial densities of states (DOS) of MAPb(I1−xBrx)3 for x = 0.25, 0.50, and 0.75 are shown in Fig. 2. As expected, the valence band is dominated by I and Br p states. However, their distribution over the extent of the valence band differs. The gravity center of the Br p DOS appears to be at lower energies and the I p states tend to contribute more in vicinity of VBM, at least for x ≤ 0.5. Such a behavior can be one of the reasons why the band gap in MAPbI3 is smaller than in MAPbBr3. The calculated results are in line with observed changes in X-ray photoelectron spectroscopy (XPS) of the valence band of MAPbI3 doped with Br (ref. 6). Upon increasing Br content, the spectra shift to the higher binding energies and change their shape so that the spectral weight decreases on the low binding energy side. In turn, the calculated Pb p and s DOSs in the valence band qualitatively similar to those in MAPbI3 and MAPbBr3 where the Pb p and s states mainly contribute at the bottom and top of the valence band, respectively. The fractions of the H s, C and N s, p states in the valence band are quite small and negligible at VBM.
 | ||
| Fig. 2 Total and partial densities of states of pseudocubic MAPb(I1−xBrx)3 calculated for (a) x = 0.25, (b) x = 0.50, and (c) x = 0.75, respectively. Zero eV is at the valence band maximum. | ||
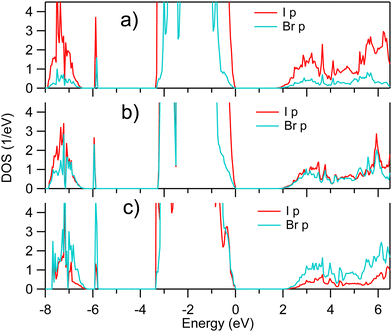
Since SOC affects strongly the unoccupied states in vicinity of CBM, a zoomed view on the AK13/GAM calculated unoccupied I and Br p DOSs of MAPb(I1−xBrx)3 is depicted in Fig. 3. A comparison of results in Fig. 2 and 3 shows that the shape of the unoccupied Pb p DOS is closely repeated by the distribution of the unoccupied I and Br p DOSs, despite the contributions by both I, Br pπ and pσ states (ref. 24) which are expected to have a different degree of hybridization.
 | ||
| Fig. 3 Zoom onto unoccupied I p and Br p densities of states of pseudocubic MAPb(I1−xBrx)3 calculated for (a) x = 0.25, (b) x = 0.50, and (c) x = 0.75, respectively. | ||
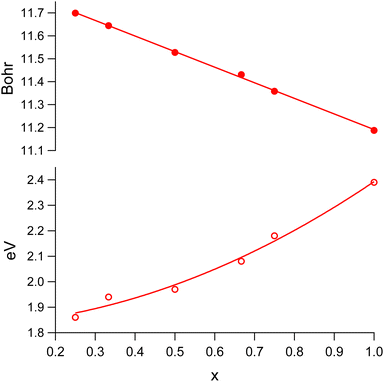
Fig. 4 displays the dependence of the optimized lattice parameter and band gap size of MAPb(I1−xBrx)3 on x in the cubic structure region. While the change of the lattice parameter value with an increasing Br content can be described by a linear fit, the band gap (Eg) variation exhibits rather a quadratic-like behavior. The result of the least-squares fit can be described by the following equation:
| Eg = 0.490x2 + 0.074x + 1.828. | (1) |
 | ||
| Fig. 4 The optimized lattice parameter (solid markers) and band gap size (open markers) of MAPb(I1−xBrx)3 in the cubic structure region. | ||
The calculated band gap size for x = 0.33 is only noticeably off the fitting curve in the latter case. While the experimental reports are divided on whether the bowing parameter value is being very small4,7,10 or significant,2,11 our calculated results (bowing parameter value 0.490) support the latter case.
3 Conclusions
The employment of the AK13/GAM combination in the DFT calculations of the electronic structure of the MAPb(I1−xBrx)3 series allowed for an accurate estimation of the band gaps as compared with reported experimental data. Calculated DOS reveals differences in the distribution of the I and Br p states as dominating components in the valence band of MAPb(I1−xBrx)3. The gravity center of the Br p DOS appears to be at lower energies and the I p states tend to contribute more in vicinity of VBM, at least for x ≤ 0.5. Such a behavior was found to be in agreement with observed changes in the shape of the XPS spectra of the valence band for this series upon varying the Br content. The calculated band gap size in MAPb(I1−xBrx)3 shows a quadratic-like dependence on the x value in the cubic crystal structure region and the derived bowing parameter supports the experimental reports claiming it being significant.4 Methods
The DFT calculations were performed in the full-relativistic mode using the Quantum Espresso v.6.8 code.25 A combination of AK13/GAM (as they are defined in the LibXC v.5.1.6 library26) was applied for MAPb(I1−xBrx)3 with varying x. The full-relativistic norm-conserving PBE (Perdew, Burke, and Ernzerhof27) pseudopotentials for hydrogen, carbon, nitrogen, bromine, iodine and lead were generated by the code of the ONCVPSP v.4.0.1 package28 using input files from the SPMS database.29 The pseudopotentials were generated without non-linear core correction. An additional feature of this ONCVPSP version is its ability to check for positive ghost states. The valence configurations for the pseudopotentials were defined as 1s1 for H, 2s2 2p2 for C, 2s2 2p3 for N, 4s2 4p5 for Br, 5s2 5p5 for I, and 5d10 6s2 6p2 for Pb. The plane-wave cut-off energy was set to 60 Ry. The convergence threshold for density was 1.0 × 10⁻¹² Ry. The van der Waals correction was applied using Grimme's D2 method.30 The Brillouin zone was sampled using the Monkhorst–Pack scheme31 and sizes of the shifted k-point mesh were chosen to be 4 × 4 × 4 for the 2 × 2 × 2 supercells of MAPb(I1−xBrx)3 and 10 × 10 × 10 for MAPbI2Br and MAPbIBr2. The crystal structure of MAPbBr3 from ref. 32 was used as a starting point to construct the 2 × 2 × 2 supercells and replace the required number of Br atoms by I. The structure optimization was performed by variable-cell relaxation using built-in routine “vc-relax” in Quantum Espresso. The Broyden–Fletcher–Goldfarb–Shanno quasi-Newton algorithm was used for ion and cell dynamics. The convergence thresholds on the total energy, forces for the ionic minimization and pressure were set to 1.0 × 10⁻⁴ Ry and 1.0 × 10⁻³ Ry bohr−1 and 0.5 Kbar, respectively. The geometry optimization was performed using the PBE functional because it has been shown33 that AK13 is not accurate for this kind of optimization.Data availability
The code for Quantum Espresso can be found at https://www.quantum-espresso.org. The version of the code employed for this study is version 6.8. The code for LibXC can be found at libxc.gitlab.io. The version of the code employed for this study is version 5.1.6. The code for ONCVSP can be found at https://www.mat-simresearch.com. The version of the code employed for this study is version 4.0.1. The SPMS table of pseudopotentials can be found at github.com/SPARC-X/SPMS-psps.Conflicts of interest
There are no conflicts to declare.Acknowledgements
The author acknowledges the support from the Swedish Research Council (research grant 2018-05525). The computations and data handling were enabled by resources provided by the Swedish National Infrastructure for Computing (SNIC) at National Supercomputer Centre at Linköping University partially funded by the Swedish Research Council through grant agreement no. 2018-05973.Notes and references
- A. Kojima, K. Teshima, Y. Shirai and T. Miyasaka, J. Am. Chem. Soc., 2009, 131, 6050–6051 CrossRef CAS PubMed.
- J. H. Noh, S. H. Im, J. H. Heo, T. N. Mandal and S. I. Seok, Nano Lett., 2013, 13, 1764–1769 CrossRef CAS PubMed.
- S. A. Kulkarni, T. Baikie, P. P. Boix, N. Yantara, N. Mathews and S. Mhaisalkar, J. Mater. Chem. A, 2014, 2, 9221–9225 RSC.
- P. Fedeli, F. Gazza, D. Calestani, P. Ferro, T. Besagni, A. Zappettini, G. Calestani, E. Marchi, P. Ceroni and R. Mosca, J. Phys. Chem. C, 2015, 119, 21304–21313 CrossRef CAS.
- A. Sadhanala, F. Deschler, T. H. Thomas, S. E. Dutton, K. C. Goedel, F. C. Hanusch, M. L. Lai, U. Steiner, T. Bein, P. Docampo, D. Cahen and R. H. Friend, J. Phys. Chem. Lett., 2014, 5, 2501–2505 CAS.
- B.-W. Park, B. Philippe, S. M. Jain, X. Zhang, T. Edvinsson, H. Rensmo, B. Zietz and G. Boschloo, J. Mater. Chem. A, 2015, 3, 21760–21771 CAS.
- L. Atourki, E. Vega, B. Marí, M. Mollar, H. Ait Ahsaine, K. Bouabid and A. Ihlal, Appl. Surf. Sci., 2016, 371, 112–117 CrossRef CAS.
- R. K. Misra, L. Ciammaruchi, S. Aharon, D. Mogilyansky, L. Etgar, I. Visoly-Fisher and E. A. Katz, ChemSusChem, 2016, 9, 2572–2577 CrossRef CAS.
- Y. Zhang, Y. Liu, Y. Li, Z. Yang and S. F. Liu, J. Mater. Chem. C, 2016, 4, 9172–9178 RSC.
- W. Wang, J. Su, L. Zhang, Y. Lei, D. Wang, D. Lu and Y. Bai, CrystEngComm, 2018, 20, 1635–1643 RSC.
- Y. Nakamura, N. Shibayama, A. Hori, T. Matsushita, H. Segawa and T. Kondo, Inorg. Chem., 2020, 59, 6709–6716 CrossRef CAS PubMed.
- R. Hill, J. Phys. C: Solid State Phys., 1974, 7, 521–526 CrossRef CAS.
- E. Mosconi, A. Amat, M. K. Nazeeruddin, M. Grätzel and F. De Angelis, J. Phys. Chem. C, 2013, 117, 13902–13913 CrossRef CAS.
- S. Chen, T. Bimenyimana and M. Guli, Results Phys., 2019, 14, 102408 Search PubMed.
- J. Chang, H. Yuan, B. Wang, Y. Huang, X. Chen and H. Chen, ChemPhysChem, 2019, 20, 489–498 CAS.
- M. Martynow, D. Głowienka, Y. Galagan and J. Guthmuller, ACS Omega, 2020, 5, 26946–26953 CrossRef CAS PubMed.
- A. Roy, H. Ullah, A. Ghosh, H. Baig, S. Sundaram, A. A. Tahir and T. K. Mallick, J. Phys. Chem. C, 2021, 125, 18058–18070 CrossRef CAS.
- S. M. Butorin, ACS Appl. Energy Mater., 2024, 7, 7285–7290 CAS.
- R. Armiento and S. Kümmel, Phys. Rev. Lett., 2013, 111, 036402 CAS.
- H. S. Yu, W. Zhang, P. Verma, X. He and D. G. Truhlar, Phys. Chem. Chem. Phys., 2015, 17, 12146–12160 CAS.
- P. Borlido, J. Schmidt, A. W. Huran, F. Tran, M. A. L. Marques and S. Botti, npj Comput. Mater., 2020, 6, 96 CAS.
- R. A. Jishi, O. B. Ta and A. A. Sharif, J. Phys. Chem. C, 2014, 118, 28344–28349 CrossRef CAS.
- B. Traoré, G. Bouder, W. Lafargue-Dit-Hauret, X. Rocquefelte, C. Katan, F. Tran and M. Kepenekian, Phys. Rev. B, 2019, 99, 035139 Search PubMed.
- G. J. Man, C. Kamal, A. Kalinko, D. Phuyal, J. Acharya, S. Mukherjee, P. K. Nayak, H. Rensmo, M. Odelius and S. M. Butorin, Nat. Commun., 2022, 13, 3839 CAS.
- P. Giannozzi, O. Andreussi, T. Brumme, O. Bunau, M. Buongiorno Nardelli, M. Calandra, R. Car, C. Cavazzoni, D. Ceresoli, M. Cococcioni, N. Colonna, I. Carnimeo, A. Dal Corso, S. de Gironcoli, P. Delugas, R. A. DiStasio, A. Ferretti, A. Floris, G. Fratesi, G. Fugallo, R. Gebauer, U. Gerstmann, F. Giustino, T. Gorni, J. Jia, M. Kawamura, H.-Y. Ko, A. Kokalj, E. Küçükbenli, M. Lazzeri, M. Marsili, N. Marzari, F. Mauri, N. L. Nguyen, H.-V. Nguyen, A. Otero-de-la Roza, L. Paulatto, S. Poncé, D. Rocca, R. Sabatini, B. Santra, M. Schlipf, A. P. Seitsonen, A. Smogunov, I. Timrov, T. Thonhauser, P. Umari, N. Vast, X. Wu and S. Baroni, J. Phys.: Condens. Matter, 2017, 29, 465901 CAS.
- S. Lehtola, C. Steigemann, M. J. Oliveira and M. A. Marques, SoftwareX, 2018, 7, 1–5 CrossRef.
- J. P. Perdew, K. Burke and M. Ernzerhof, Phys. Rev. Lett., 1996, 77, 3865–3868 CrossRef CAS PubMed.
- D. R. Hamann, Phys. Rev. B: Condens. Matter Mater. Phys., 2013, 88, 085117 CrossRef.
- M. F. Shojaei, J. E. Pask, A. J. Medford and P. Suryanarayana, Comput. Phys. Commun., 2023, 283, 108594 CrossRef CAS.
- S. Grimme, J. Comput. Chem., 2006, 27, 1787–1799 CAS.
- H. J. Monkhorst and J. D. Pack, Phys. Rev. B, 1976, 13, 5188–5192 Search PubMed.
- Materials Design Group (Department of Materials, Imperial College London) led by Prof. Aaron Walsh., Database of crystal structures of halide perovskites, https://github.com/WMD-group/hybrid-perovskites.
- A. Lindmaa and R. Armiento, Phys. Rev. B, 2016, 94, 155143 Search PubMed.
| This journal is © The Royal Society of Chemistry 2025 |
