
 Open Access Article
 This Open Access Article is licensed under a Creative Commons Attribution-Non Commercial 3.0 Unported Licence
Facile, selective and cost-effective detection of creatinine from human urine using a cyclometalated dinuclear iridium(III) complex through creatinine-triggered emission†
Pramod C. Raichure ,
Bharat Kaushik,
Annu Agarwal and
Inamur Rahaman Laskar*
,
Bharat Kaushik,
Annu Agarwal and
Inamur Rahaman Laskar*
Department of Chemistry, Birla Institute of Technology and Science, Pilani Campus, Pilani, Rajasthan 333031, India. E-mail: ir_laskar@pilani.bits-pilani.ac.in
First published on 6th February 2025
Abstract
A new cyclometalated oxalyl-bridged dinuclear iridium(III)-based phosphorescent complex (M3) was synthesized, which detected creatinine in the solid phase by increasing the emission intensity with a blue shift. The probe M3 was synthesized in a straightforward synthetic route by forming a dichloro-bridged iridium(III) intermediate. The creatinine detection process was developed on a low-cost filter paper strip impregnated with M3, and it was successfully tested on human urine samples. It was observed that the probe was highly selective towards creatinine, and no response was observed with most of the other components present in human urine. Furthermore, the mechanism of creatinine detection was rationally explored.
Introduction
Worldwide, 8–16% of the population is affected by chronic kidney disease (CKD).1 Millions of people die each year as a result of the lack of affordable treatment options for CKD.1 In the early stage of CKD, as there are no signs or symptoms, most of the affected persons remain unidentified. CKD can be treated, and it is possible to slow down or stop the progression of kidney disease with early-stage diagnosis and treatment. The leading indicator of kidney function is the level of creatinine from the blood and waste products (i.e., urine) excreted by the kidneys.2 If kidney function is reduced, an elevated level of creatinine is found in urine or blood. Hence, blood and urine tests are used to check for the progression of kidney disease. Conventionally, laboratory tests are performed on urine (to measure creatinine and albumin excretion) and blood samples (to measure creatinine content and estimate the glomerular filtration rate, which measures the blood filtration rate by the kidneys). The presence of excess protein in urine is also a marker for the risk of CKD progression. Excess protein can be detected via the “dipstick test,” which is used for urinalysis, which has a finite lifespan and is very sensitive to air exposure.3 Kidney disease biomarkers are used for both diagnosis and monitoring of kidney diseases. Typically, mass spectrometry, immunoassays or electrophoresis are frequently used to analyze biomolecules such as proteins or creatinine.4 Although these approaches have the benefits of good sensitivity and high accuracy, they frequently require sophisticated instruments, and the process can be time-consuming and expensive. Fluorescent materials are widely used in bioimaging,5,6 chemical vapor sensing,7 mechanofluorochromism,8 metal ion sensing,9 and multi-stimuli responsive polymeric materials,10 owing to their fast response and excellent photosensitivity.11–14 Fluorescence-based optical sensors also have numerous advantages, including biocompatibility, small size, light weight, low cost, small volume detection, and remote sensing capability.15–17 For greater effectiveness, heavy metal-based phosphorescent organometallic complexes [such as iridium(III) and platinum(II)] are mainly used because of their ability to employ a variety of excited states, including metal-to-ligand charge-transfer (MLCT), ligand-to-metal charge-transfer (LMCT), and ligand-to-ligand charge-transfer (LLCT) states, which distinguishes transition-metal complexes from organic fluorophores.18 As a result, they have attracted much attention for various applications, such as optoelectronics, metal cation sensing, and explosive sensing,19 owing to their long luminescence lifetimes (micro- to milli-seconds) and high quantum yield.20Solution-based creatinine (Crt9) detection using organic fluorescent moieties was previously reported with tetraphenylethene based on the hydrogen bonding between the –COO− group of the probes and creatinine.21 However, they studied Crt9 detection with artificial urine (i.e., tested with the urine prepared in the laboratory). Furthermore, this organic probe showed fluorescence in both probe solutions in water and artificial urine in the absence of Crt9. It increased the emission intensity up to 1 mM of Crt9 concentration and then decreased with further increasing concentration, which might be difficult to monitor the sensing response in real urine samples. Unob and co-workers reported a paper-based platform for the colorimetric detection of creatinine from urine using the Jaffé reaction.22 In the Jaffé reaction, a cationic form of creatinine was extracted onto paper using the ion exchange mechanism. Thus, this method required washing the paper three times with deionized water and 40 μL of an alkaline picrate solution, which led to the formation of a complex that was yellow-orange. Despite being an effective technique, this method lacks selectivity.23 Biomolecule-capped metal nanoclusters were also reported for creatinine detection.24 A cholic acid-capped gold nanocluster was synthesized and used as a fluorescence-enhanced probe for creatinine detection in human urine and serum samples.25 That nanocluster was synthesized at a high temperature (180 °C), and required maintaining the pH at 12.0. Using picric acid as a binder, Joseph et al. reported on a gluten-stabilized fluorescent gold quantum cluster, and applied it to fluorescence-based human blood creatinine detection.26 Picric acid is treated with a gold quantum cluster to form a picrate complex. Although picric acid has a good binding affinity with creatinine, it may result in fluorescence quenching based on photoinduced electron transfer (PET). Glutathione-capped copper nanoclusters are also used for creatinine detection based on aggregation in the presence of Al3+ ions.27 The coordination interaction between creatinine and aluminum cations led to the emission quenching of copper nanoclusters. Bovine serum albumin (BSA)-capped carbon-gold (C-Au) nanocomposites were synthesized and applied as an optical sensor for creatinine detection.28 The emission quenching was observed for the BSA-capped (C-Au) nanocomposite in the presence of creatinine. Creatinine detection using infrared fluorescent quantum dots with molecularly imprinted polymer (MIP) capping has been reported.29 Several MIP-capped nanocomposites were reported for creatinine detection.30,31 Apart from the lengthy synthetic process, MIP strategies have some other drawbacks, such as leakage or incomplete template removal, irregular morphology, and random distribution of binding sites.32 Recently, the SERS-based nanobiosensors (gold nanoparticles) have also been reported for the ultrasensitive detection of creatinine (up to 10−15 M).33 A substituted porphyrin molecule was synthesized and used to detect creatinine in aqueous medium.34 Green fluorescent La3+-doped titanium carbide nanosheets fabricated by using Ti3AlC2 as the MAX phase material and La(NO3)3 as a doping agent were also used for the sensitive recognition of creatinine in real human urine and plasma samples, and the sensing mechanism involved the electrostatic interaction between the La3+-doped Ti3C2NSs and creatinine.35
For the detection of creatinine, numerous colorimetric and electrochemical methods were studied.36 However, the outstanding photosensitivity and quick response time of the fluorescence-based method proved its excellent performance.37 Although various biomolecule-capped (gluten, glutathione, cholic acid, BSA, MIP, etc.) nanoclusters have been previously reported for creatinine detection,38 a phosphorescence-based facile, selective and cost-effective method for the detection of creatinine have not been explored yet. The creatinine detection based on the potential interaction between creatinine and the ester group of methyl methacrylate inspired the design of the ester-functionalized phosphorescent iridium(III) metal complex M3.39 Herein, we present a cyclometalated dinuclear iridium(III)-based probe for the detection of creatinine in a simple and efficient strategy.
Experimental section
Materials
4-(2-Pyridyl) benzaldehyde and iridium(III) chloride hydrate were purchased from TCI chemicals. Silver nitrate (AgNO3), sodium hydroxide (NaOH), ethanol (C2H5OH), sulfuric acid (H2SO4), and sodium carbonate (Na2CO3) were purchased from Merck company. 2-Ethoxyethanol (Sigma-Aldrich) and methanol, hexane, dichloromethane (DCM), tetrahydrofuran (THF), oxalyl chloride (C2O2Cl2) (all from Spectrochem Private Limited) were also purchased.Instrumentation
1H and 13C NMR spectra were recorded using a 400 MHz Bruker NMR spectrometer. High-resolution mass spectra were recorded on an Agilent 6545 Q-TOF LC/MS. UV-VIS absorption spectra were recorded using a Shimadzu spectrophotometer (models UV-1800 and 2550). The steady-state photoluminescence (PL) spectra were recorded on a Horiba ‘FluoroLog-3’ spectrofluorimeter and Horiba Jobin Yvon spectrofluorometer (FluoroMax-4). The quantum yield was measured by the Horiba Fluoromax®Plus with a Quantaphi-2 integrating sphere. The infrared spectra were recorded on a Shimadzu FTIR spectrophotometer (IRAffinity-1S). The lifetime decay was recorded on TCSPC HORIBA Jobin Yvon FluoroCube. The clinical data of the CKD-person's urine analysis were obtained from the Compact Urine Analyzer PocketChem UA PU-4010. The morphology of M3 was examined using the “APREO S”-model FE-SEM.Synthesis
The synthesis of the iridium(III) complex M1 [(ppy-COOMe)2Ir(μ-Cl)2Ir(ppy-COOMe)2] is shown in Scheme 1.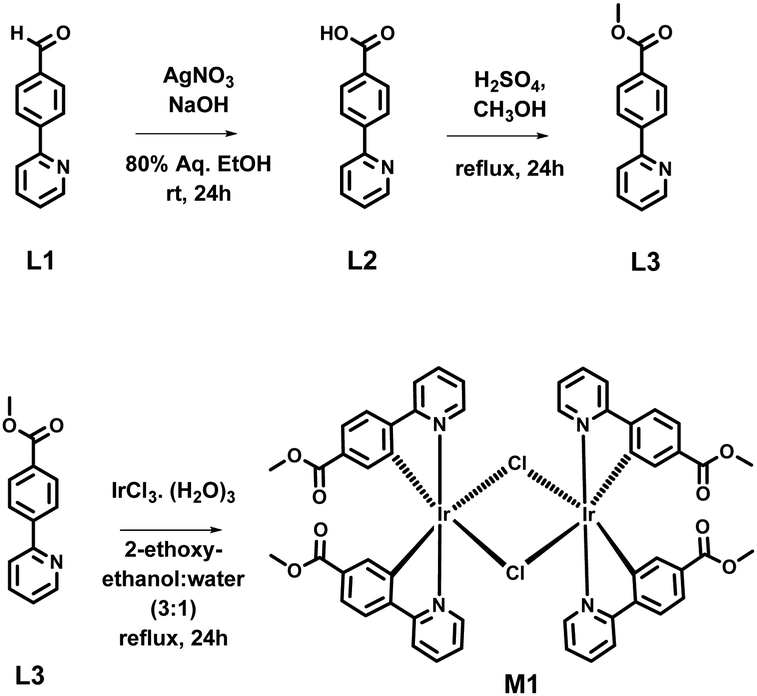 | ||
| Scheme 1 Synthesis of ligands L2, L3, and the iridium(III) complex M1. | ||
Synthesis of L2 (4-(pyridin-2-yl)benzoic acid)
In 80% aq. ethanol (50 mL), 15 mL of NaOH (1 M), and 695 mg (4.09 mmol, 1.5 eq.) of AgNO3 were mixed. 500 mg of 4-(2-pyridinyl) benzaldehyde (L1) (2.72 mmol, 1 eq.) was added to the reaction mixture dropwise with continuous stirring. Then, the reaction mixture was stirred for 24 hours at room temperature. The reaction mixture was filtered, and the filtrate was acidified with concentrated HCl to precipitate out the product. The solid was filtered, washed with water, and subsequently dried. We obtained the solid product with a 75–76% yield. Then, the solid product, L2, was characterized by 1H and 13C NMR analysis (Fig. S1 and S2, ESI†). The 1H NMR peak at 13 ppm and 13C NMR peak at 168 ppm indicate the presence of the carboxylic group in L3.1H NMR (400 MHz, DMSO-d6) δ 13.07 (s, 1H), 8.74–8.69 (m, 1H), 8.25–8.19 (m, 2H), 8.10–8.02 (m, 3H), 7.93 (td, J = 7.7, 1.9 Hz, 1H), 7.42 (ddd, J = 7.5, 4.7, 1.1 Hz, 1H).
13C NMR (101 MHz, DMSO-d6) δ 167.58, 155.33, 150.22, 143.04, 137.90, 131.49, 130.25, 127.09, 123.83, 121.37.
Synthesis of L3 [methyl 4-(pyridin-2-yl)benzoate (i.e., ppy-COOMe)]
In a clean and dry round-bottomed flask, 15 mL of methanol was added and cooled under an ice bath. Concentrated H2SO4 (1 mL) was then slowly added to the methanol. The ligand L2 (400 mg, 2.007 mmol) was added into the mixture slowly and refluxed under N2 atm for 24 hours. The crude product was neutralized with a saturated Na2CO3 solution. Then, the aqueous phase was extracted with ethyl acetate. The combined organic phases were dried over Na2SO4. The solvent was removed under vacuum to obtain methyl 4-(2-pyridyl) benzoate with up to 88–90% yield. The synthesized L3 was characterized by 1H and 13C NMR analysis (Fig. S3 and S4, ESI†). In the 1H NMR spectra, the observation of a disappearing peak at 13 ppm and the formation of a new peak at 4 ppm, and in the 13C NMR spectrum, the appearance of a new peak at 51 ppm indicates the presence of methyl ester in L4.1H NMR (400 MHz, chloroform-d) δ 8.75 (dt, J = 4.8, 1.4 Hz, 1H), 8.18–8.15 (m, 2H), 8.12–8.07 (m, 2H), 7.83–7.79 (m, 2H), 7.31 (td, J = 4.8, 3.7 Hz, 1H), 3.97 (s, 3H).
13C NMR (101 MHz, chloroform-d) δ 165.90, 155.22, 148.88, 142.51, 135.89, 129.35, 129.03, 125.82, 121.85, 119.99, 51.17.
Synthesis of the iridium(III) complex, M1 [(ppy-COOMe)2Ir(μ-Cl)2Ir(ppy-COOMe)2]
L3 (380 mg, 1.78 mmol) was dissolved in a mixture of 2-ethoxyethanol and water (3![[thin space (1/6-em)]](https://www.rsc.org/images/entities/char_2009.gif) :1). Iridium(III) trichloride hydrate (IrCl3·3H2O) (266 mg, 0.89 mmol) was added to the reaction mixture. The reaction mixture was refluxed for 20–24 hours. The solution was then cooled to room temperature. The precipitate was collected and washed with hexane and ether. The obtained crude product was purified by column chromatography. We obtained the product with a 35–40% yield. The synthesized M1 was characterized by 1H and 13C NMR analysis (Fig. S5 and S6, ESI†).
:1). Iridium(III) trichloride hydrate (IrCl3·3H2O) (266 mg, 0.89 mmol) was added to the reaction mixture. The reaction mixture was refluxed for 20–24 hours. The solution was then cooled to room temperature. The precipitate was collected and washed with hexane and ether. The obtained crude product was purified by column chromatography. We obtained the product with a 35–40% yield. The synthesized M1 was characterized by 1H and 13C NMR analysis (Fig. S5 and S6, ESI†).
1H NMR (400 MHz, DMSO-d6) δ 9.88 (d, J = 5.9 Hz, 1H), 9.59 (d, J = 5.8 Hz, 1H), 8.38 (dd, J = 34.2, 8.2 Hz, 2H), 8.19 (dd, J = 36.0, 7.8 Hz, 2H), 7.93 (dd, J = 24.6, 8.1 Hz, 2H), 7.68 (dt, J = 39.8, 6.7 Hz, 2H), 7.46 (dd, J = 21.0, 8.1 Hz, 2H), 6.88 (s, 1H), 6.30 (s, 1H), 3.65 (d, J = 8.7 Hz, 5H).
13C NMR (101 MHz, DMSO-d6) δ 166.52, 152.88, 149.09, 145.00, 140.14, 139.18, 132.00, 130.33, 125.20, 124.18, 122.00, 79.65, 52.44.
Synthesis of iridium(III) complex M2 [Ir(ppy-COOMe)2(pic)]
A mixture of 0.092 mmol chloro-bridged dimer (M1) complex (120 mg), 0.184 mmol (25.59 mg) of 3-hydroxy picolinic acid (L4), and 90 mg of sodium carbonate was refluxed in an inert atmosphere in 2-ethoxyethanol for 12–15 hours (Scheme 2). After cooling the reaction mixture to room temperature, a yellow-colored precipitate was obtained and washed with hexane, followed by ether. The crude product was dissolved in dichloromethane and filtered. The solvent was evaporated under vacuum and dried, and the product was obtained with a yield of 70%. An analysis using 1H NMR, 13C NMR, and HRMS identified the synthesized M2 (Fig. S7–S9, ESI†). | ||
| Scheme 2 Synthesis of the iridium(III) complex M2 from M1. | ||
1H NMR (400 MHz, DMSO-d6) δ 8.64 (d, J = 5.7 Hz, 1H), 8.38–8.28 (m, 2H), 8.08–7.92 (m, 4H), 7.71 (d, J = 5.7 Hz, 1H), 7.51 (dt, J = 10.0, 5.2 Hz, 1H), 7.48–7.35 (m, 3H), 6.99 (s, 2H), 6.84–6.79 (m, 1H), 6.71 (dt, J = 7.0, 2.3 Hz, 1H), 6.60 (s, 1H), 4.17 (dq, J = 4.3, 2.2 Hz, 2H), 3.65 (d, J = 3.2 Hz, 3H).
13C NMR (101 MHz, DMSO-d6) δ 167.00, 166.18, 150.13, 149.65, 149.04, 148.38, 138.76, 132.40, 129.35, 124.91, 120.99, 72.23, 68.13, 66.17, 65.96, 60.70, 52.27, 15.62.
HRMS for M2: The observed mass is m/z 756.1308 [M + H]+; calculated for [C32H24IrN3O7 + H]+ is 756.12.
Synthesis of the iridium(III) complex M3 [(ppy-COOMe)4Ir2(pic)2C2O2]
A 2-mL volume of THF was taken in a clean and dried round-bottomed flask equipped with nitrogen gas, and then 80 mg (0.105 mmol) of M2 was added to it with continuous stirring. Oxalyl chloride (4.65 μL, 0.052 mmol) was added slowly to the reaction mixture. The reaction mixture was stirred at 50 °C for five hours under a nitrogen atmosphere (Scheme 3). The completion of the reaction was confirmed by TLC and the reaction mixture was quenched with water. The water layer was then extracted with dichloromethane. The organic layers were washed, then dried over sodium sulfate, and the organic layer was subsequently evaporated under reduced pressure. We obtained an orange color solid product with a yield of 54%. The synthesized M3 was characterized by 1H, 13C NMR, and HRMS study (Fig. S10–S12, ESI†). The solid-state absorption wavelength for M3 was observed at 375 nm (Fig. S13, ESI†) and showed a lifetime decay of 6 μs, which reveals the characteristic phosphorescence emission (Fig. S14, ESI†).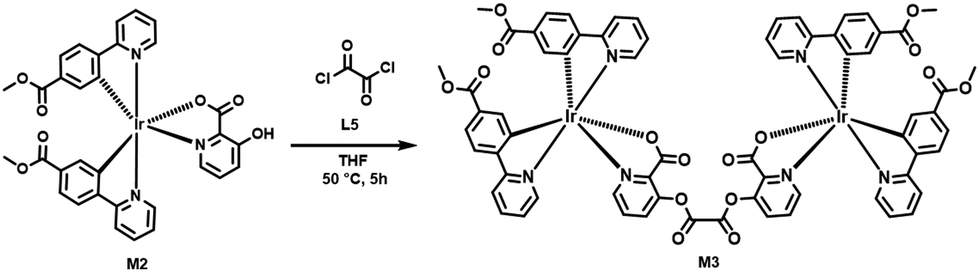 | ||
| Scheme 3 Synthesis of the iridium(III) complex M3 from M2. | ||
1H NMR (400 MHz, DMSO-d6) δ 9.68 (t, J = 4.2 Hz, 1H), 9.35 (s, 1H), 8.48 (dd, J = 30.0, 8.0 Hz, 2H), 8.38–8.24 (m, 2H), 8.11–7.97 (m, 2H), 7.79 (d, J = 7.5 Hz, 1H), 7.63 (s, 1H), 7.55 (dd, J = 14.0, 8.4 Hz, 2H), 6.89 (s, 1H), 6.41 (d, J = 5.6 Hz, 1H), 4.18 (dd, J = 9.5, 5.0 Hz, 2H), 3.66 (dd, J = 11.6, 3.3 Hz, 3H).
13C NMR (101 MHz, DMSO-d6) δ 165.97, 165.38, 163.43, 155.39, 152.87, 151.53, 151.47, 149.35, 148.37, 140.14, 131.16, 130.10, 129.44, 125.50, 124.75, 68.06, 66.14, 64.45, 52.41, 15.59.
HRMS for M3: observed m/z 1563.2428 [M]+; calculated value for [C66H46Ir2N6O16]+ is 1563.55.
Possible approaches for creatinine detection with probe M3
(1) Powder-state creatinine detection: here, we have taken the solid powder of the M3 probe and added aqueous creatinine to it. The solution was thoroughly mixed and dried well. The orange-colored photoluminescence (PL) of solid-state M3 changed to yellow emission, as shown (Fig. 1a).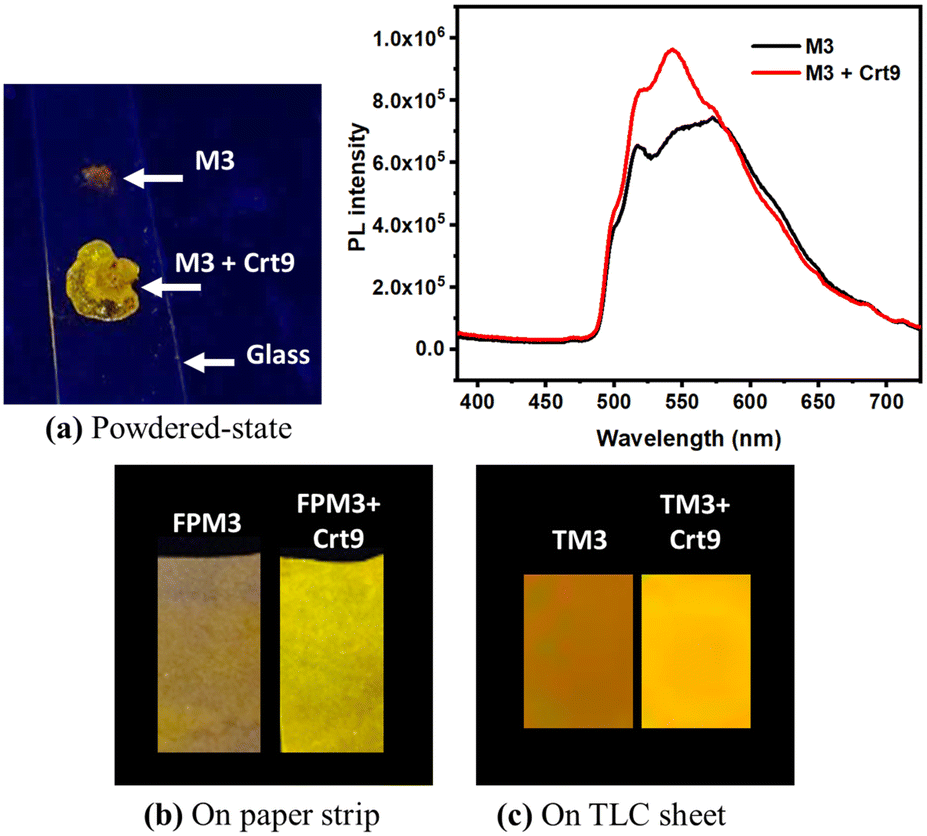 | ||
| Fig. 1 Photographs of creatinine (Crt9) detection under a UV lamp (365 nm): (a) Powdered state with the corresponding PL spectra (excitation wavelength = 370 nm); (b) on a paper strip (filter paper impregnated with M3, i.e., FPM3); (c) on a TLC sheet impregnated with M3 (i.e., TM3). | ||
(2) Paper-based creatinine detection: low-cost Whatman filter paper (FP) strips are used here. The strip was impregnated with an M3 probe (FPM3) and thoroughly dried. The observed quantum yield for FPM3 is 6.59%. It was dipped into an aqueous creatinine solution. Then, the soaked filter paper was dried well and observed under a UV lamp. It shows an emission intensity enhancement with a blue shift (Fig. 1b). Similarly, the study was performed on a TLC sheet that was impregnated with an M3 probe, and a similar color change was observed under a UV lamp (Fig. 1c).
Creatinine detection from human urine with M3 probe
We have also studied creatinine detection from human urine samples. The M3 probe-impregnated filter paper was dipped in human urine, and the emission change was observed under a UV lamp (λexc, 365 nm) (Fig. 2). Herein, although M3 shows an emission change with Crt9 in the urine sample of a non-CKD person, it may also help to assess the Crt9 concentration in a CKD patient's sample to determine the albumin-creatinine ratio (ACR).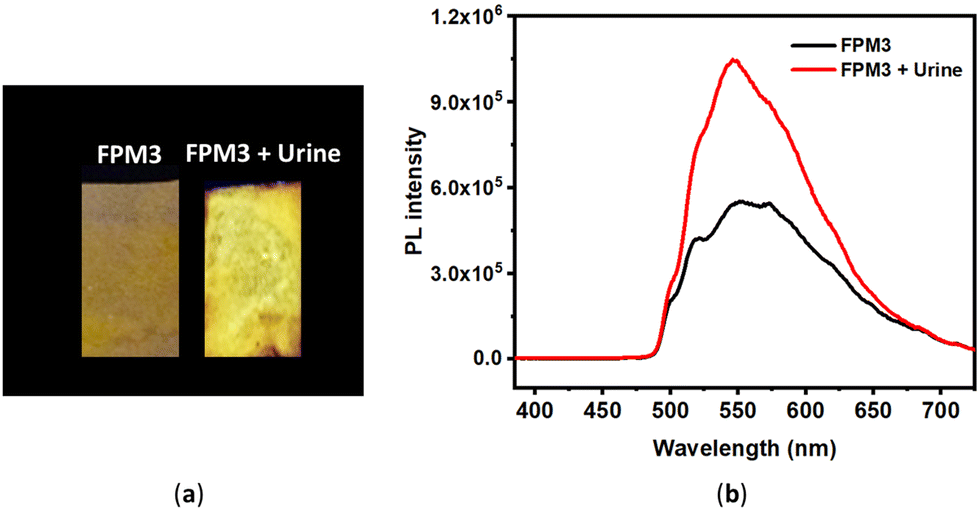 | ||
| Fig. 2 (a) Photographs of M3-impregnated filter paper strips (FPM3) under a UV lamp (365 nm) before and after dipping in human urine; (b) corresponding PL spectra (excitation wavelength of 370 nm). | ||
Paper-based creatinine detection with different concentrations of aqueous Crt9
The normal population's urine creatinine concentration ranges from 2.8 to 25.9 mg dL−1,40 and it may be elevated in the case of CKD. M3 was screened with different concentrations of aqueous Crt9. It was observed that 50 mg dL−1 is the minimum Crt9 concentration that can be detected by M3 (Fig. S15, ESI†). Therefore, the titration was carried out with M3 starting at 50 mg dL−1, and the corresponding PL emission spectra were recorded (Fig. 3 and Fig. S16, ESI†). We observed that with increasing concentration of aqueous crt9, the PL intensity increases with blue-shifted emission. Thus, probe M3 shows an instantaneous phosphorescent response for Crt9 detection, demonstrating its ease of functionalization, whereas other competing reported techniques are costly and generally require relatively lengthy procedures (Table S1, ESI†). Furthermore, we quantitatively analyzed Crt9 detection from the urine samples of a healthy (non-CKD) person and a person suffering from CKD (Fig. S17, ESI†). | ||
| Fig. 3 Photographs of the filter paper impregnated with M3 (FP-M3) before and after being dipped in aq. creatinine (Crt9) (300 dL) under a UV lamp (365 nm) and their corresponding PL intensity plot for FP-M3 at an excitation wavelength of 370 nm, showing a steady variation of the PL intensity with gradually increasing concentrations of aq. creatinine (Crt9) (dotted arrow indicates the blue shift with emission enhancement). | ||
Selectivity
The selectivity study for the M3 probe was performed in the presence of different constituents found in human urine (Fig. 4). The M3 probe selectively shows bright yellow emission only with creatinine under a UV lamp (λexc, 365 nm), rather than other constituents. A similar response was observed for Crt9 in the presence of the above constituents (Fig. S18, ESI†).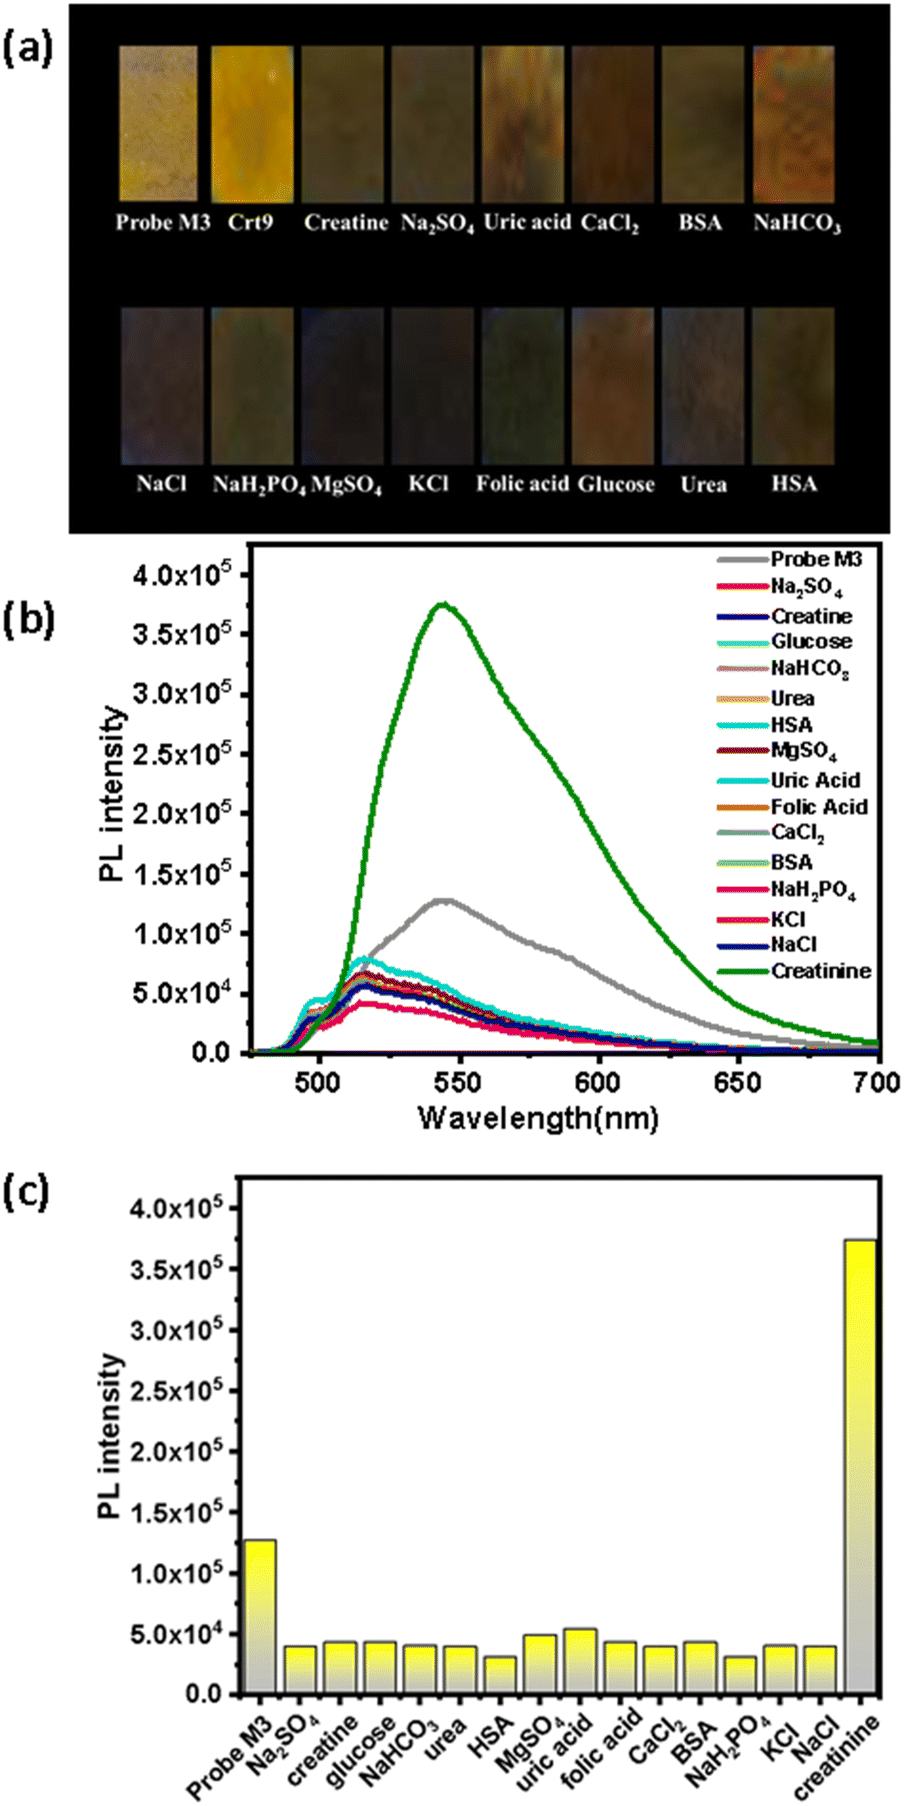 | ||
| Fig. 4 (a) Photographs of M3-impregnated filter paper strips under a UV lamp (365 nm) after dipping into different aqueous solutions of urine components; (b) corresponding PL spectra (excitation wavelength of 370 nm); (c) bar graph showing the PL intensity for the corresponding solutions. | ||
Results and discussion
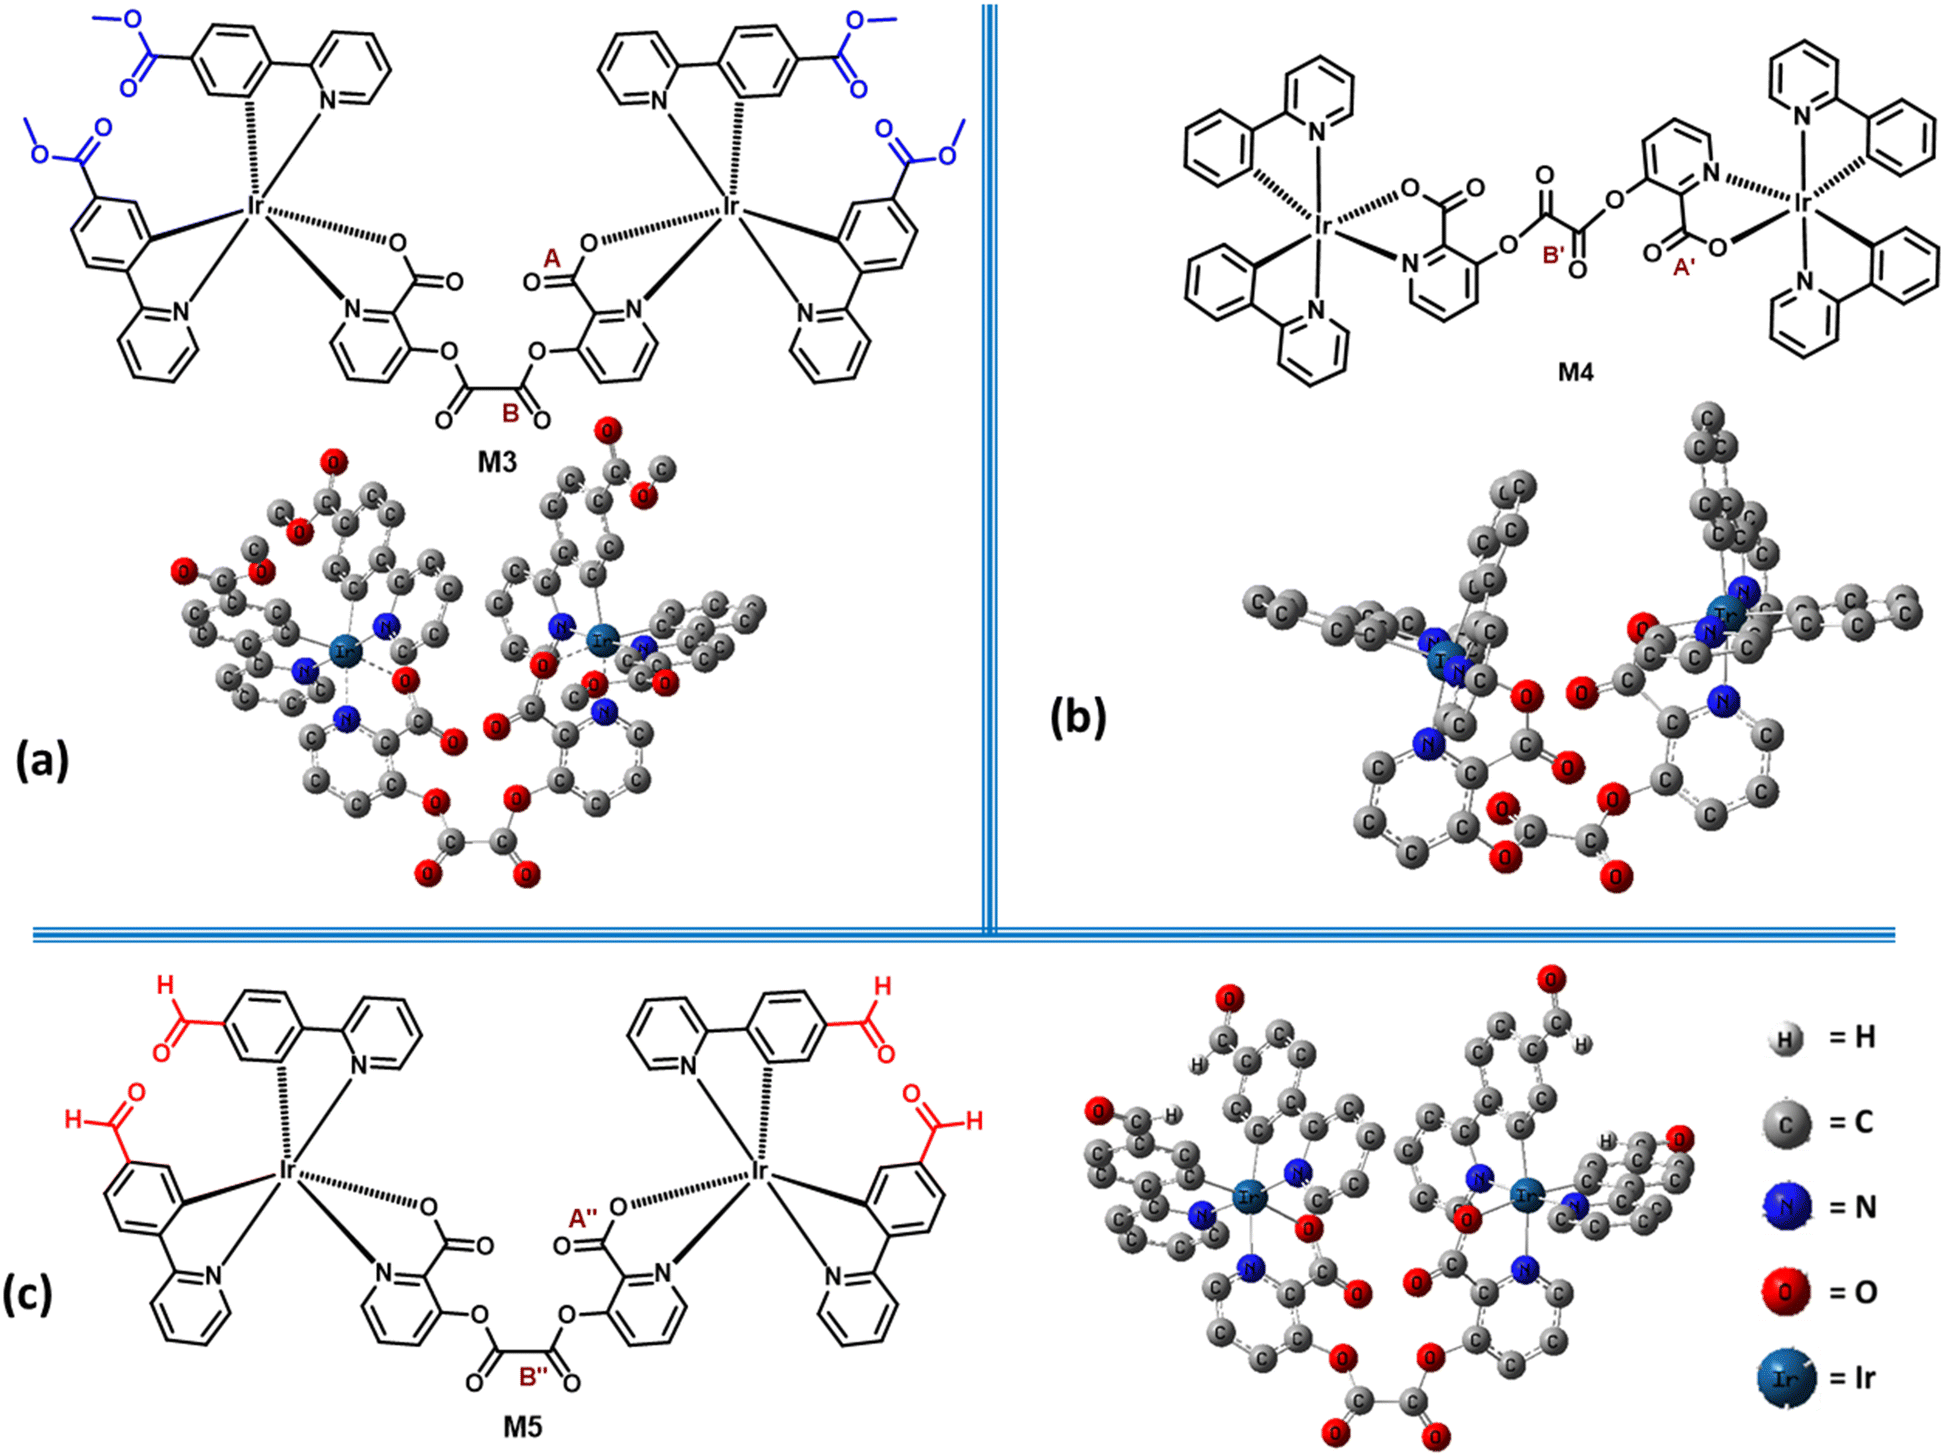
To investigate the interaction between M3 and Crt9, the 1H NMR analysis of M3, M3 + Crt9, and Crt9 was performed (Fig. S19, ESI†). Although there was no significant shifting found for the M3′ peaks after treatment with Crt9, the observed sharp peaks indicated possible weak interactions. To understand the role of the terminal ester functional groups on the probe involved in the interaction with creatinine, another analogous iridium(III) complex (M4) without the terminal ester functional groups was synthesized and characterized by 1H NMR analysis (Fig. 5 and Fig. S20, ESI†). M4 emits greenish-blue emission on a paper strip. The luminescence response of the impregnated paper strip was tested with creatinine (Fig. 5), but there was no change in luminescence observed. Then, the M5 probe was designed to check the possible interaction of creatinine with the carbonyl of the terminal ester group of M3 (Fig. 6). It was designed by replacing the terminal ester group with an aldehyde functional group. The M5 probe was synthesized using an approach similar to that for M3, and characterized by 1H NMR analysis (Fig. S21, ESI†). The M5 probe was tested with creatinine and a luminescence change was found (Fig. 6). | ||
| Fig. 5 (a) Chemical structure for the synthesized dinuclear iridium(III) complex M4 and (b) luminescent response on a filter paper strip impregnated with M4 (i.e., FPM4) under a UV lamp (365 nm) with the corresponding PL intensity spectra (excitation at λexc = 370 nm). | ||
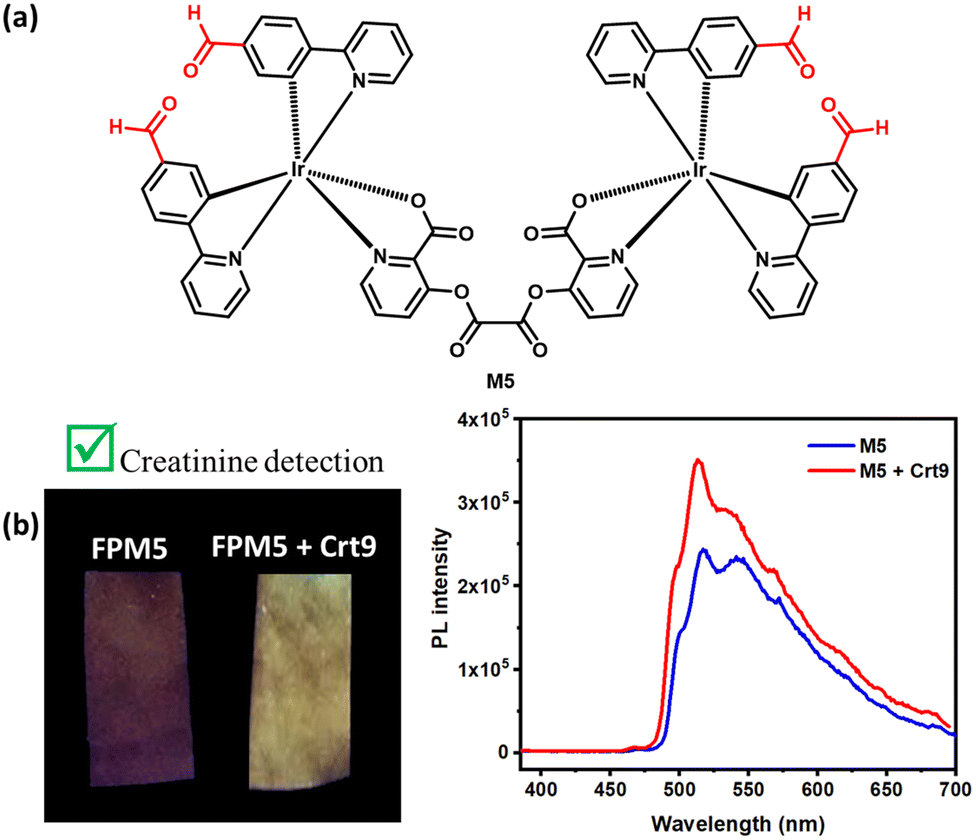 | ||
| Fig. 6 (a) Chemical structure of the synthesized dinuclear iridium(III) complex (M5) and (b) luminescent response on a filter paper strip impregnated with M5 (i.e., FPM5) under a UV lamp (365 nm) with the corresponding PL intensity spectra (excitation at λexc = 370 nm). | ||
To check the structural arrangement of the M3, M4, and M5 probes, the Gaussian 16 program was used to optimize the structure of all three probes (Fig. 7). The optimized geometries of M3 and M5 indicate that both are almost similar. In these cases, the picolinate carbonyl groups (A) and (A′′) come closer [the distance between two oxygens of carbonyl (A) and (A′′) present in picolinate is 4.70 Å and 4.73 Å, respectively] (Fig. 7). Also, both oxalate carbonyls (B) and (B′′) are observed on the same side for M3 and M5 [dihedral angle between two oxalyl carbonyl (B) and (B′′) group is 40.60° and 40.74°, respectively] (Fig. 7). However, for M4, both oxalate carbonyls (B′) are observed on the opposite side [dihedral angle between two oxalyl carbonyl (B′) groups is 154.6°]. From this study, we assume that the V-shaped scaffold network is necessary for showing interactions with creatinine.
 | ||
| Fig. 7 Basic unit structure and the optimized geometry using DFT via Gaussian 16 with the LanL2DZ basis set and PBEPBE functional: (a) for M3, (b) for M4, and (c) for M5 with the labeled characteristic bonds, i.e., picolinate carbonyl (as A, A′, and A′′) and oxalate carbonyls as (B, B′, and B′′). | ||
FTIR spectral analysis was performed to investigate the interaction of creatinine with the carbonyl group of M3 (Fig. 8). The observed IR frequency for the picolinate carbonyl (A) (C![[double bond, length as m-dash]](https://www.rsc.org/images/entities/char_e001.gif) O) stretching of M3 was 1606 cm−1,41 and reduced to 1592 cm−1 after treatment with Crt9. At the same time, the other two carbonyl (B) and (C) stretching bands were retained at 1764 and 1712 cm−1,42–44 respectively (Fig. 8a–c and Table 1).41 The IR spectra for solid-phase Crt9 were also recorded (Fig. 8d). The stretching of the N–H (D) and carbonyl (E) groups of creatinine was observed at 3242 and 1666 cm−1, respectively (Fig. 8d).45,46 The frequency of N–H (D) changed to 3234 cm−1, and that for the carbonyl (E) of Crt9 was retained at 1666 cm−1 after treating with M3. From the FTIR spectrum, a lowering of the above values for carbonyl (A) of M3 and N–H (D) of Crt9 indicates that the N–H (D) bonds of Crt9 might be participating in the weak hydrogen bonding with the picolinate carbonyl (A) of the M3 molecules, as shown in Fig. 9.
O) stretching of M3 was 1606 cm−1,41 and reduced to 1592 cm−1 after treatment with Crt9. At the same time, the other two carbonyl (B) and (C) stretching bands were retained at 1764 and 1712 cm−1,42–44 respectively (Fig. 8a–c and Table 1).41 The IR spectra for solid-phase Crt9 were also recorded (Fig. 8d). The stretching of the N–H (D) and carbonyl (E) groups of creatinine was observed at 3242 and 1666 cm−1, respectively (Fig. 8d).45,46 The frequency of N–H (D) changed to 3234 cm−1, and that for the carbonyl (E) of Crt9 was retained at 1666 cm−1 after treating with M3. From the FTIR spectrum, a lowering of the above values for carbonyl (A) of M3 and N–H (D) of Crt9 indicates that the N–H (D) bonds of Crt9 might be participating in the weak hydrogen bonding with the picolinate carbonyl (A) of the M3 molecules, as shown in Fig. 9.
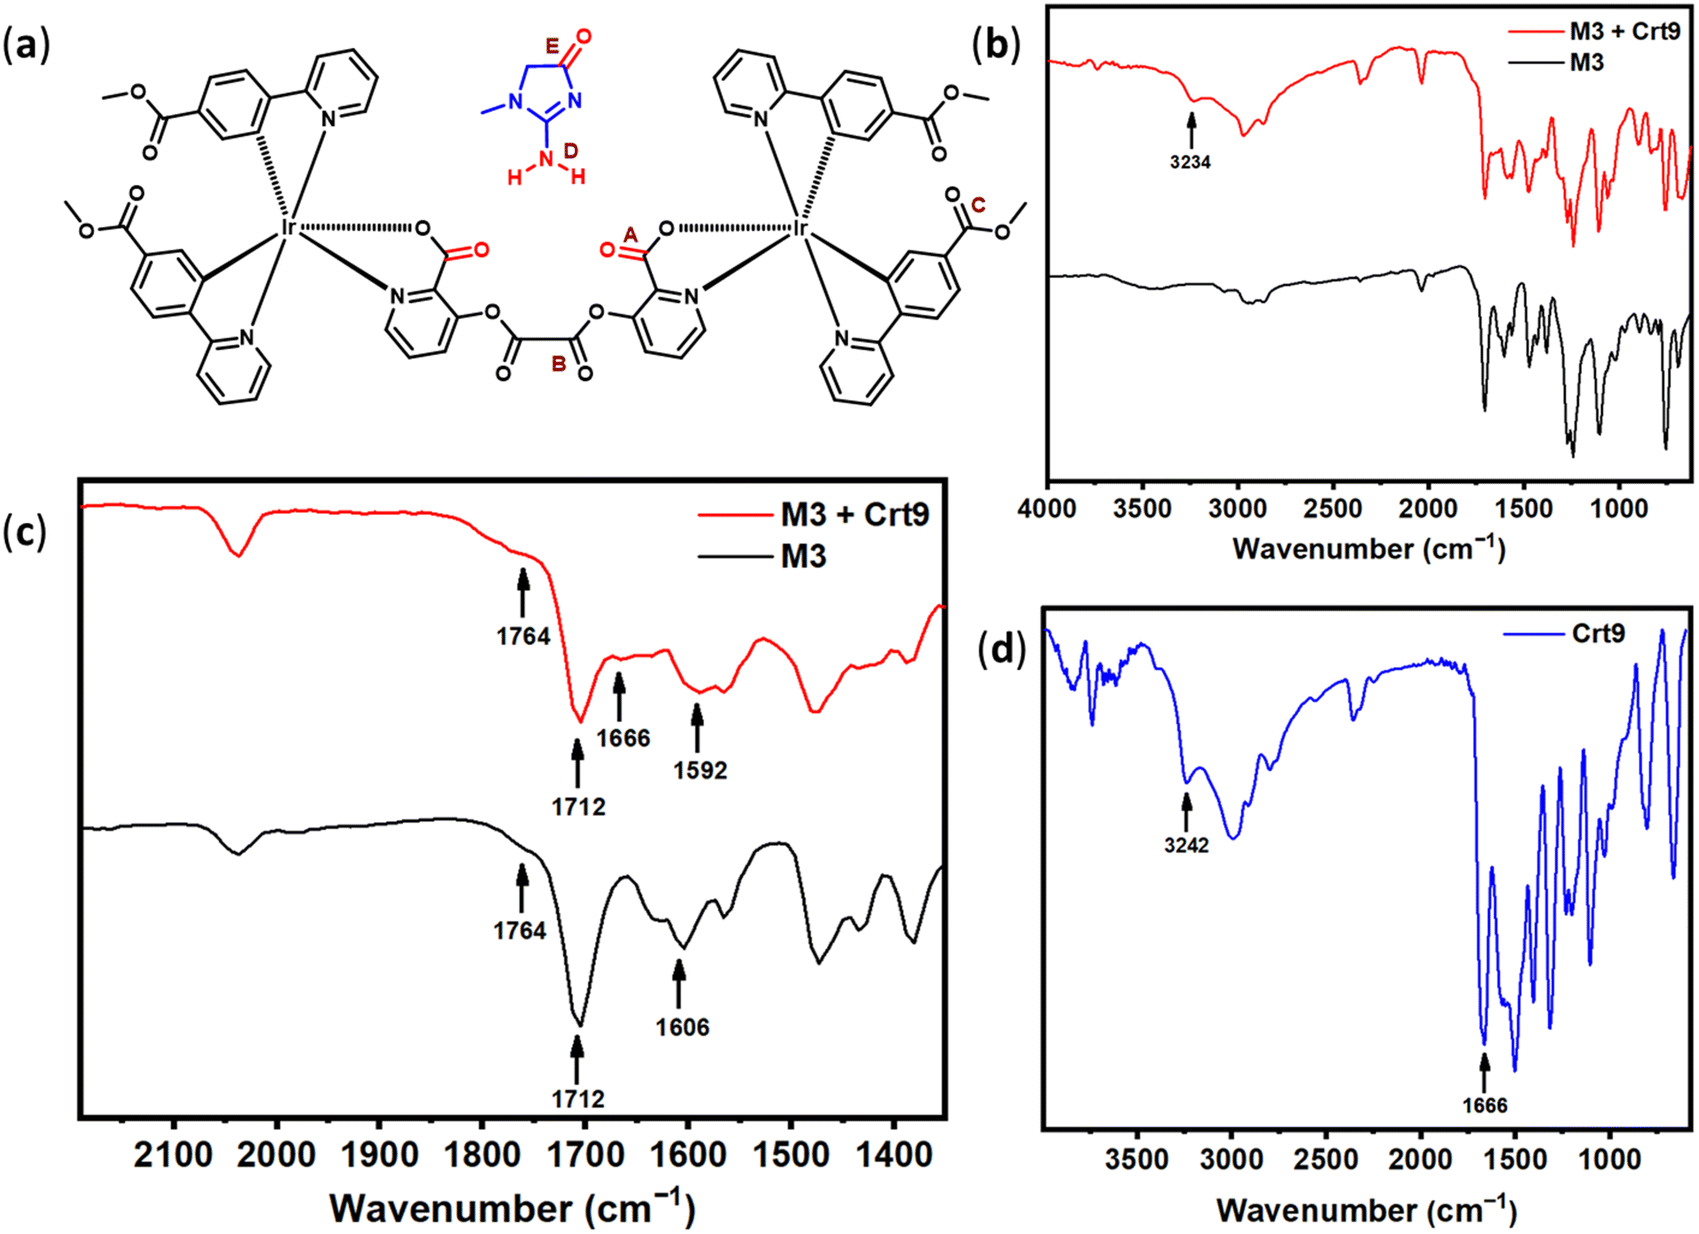 | ||
| Fig. 8 (a) Chemical structures for M3 and Crt9 with labeled characteristic bonds (as A, B, C, D, and E); (b) FTIR spectra for solid-state M3 and creatinine (Crt9) treated M3 (M3 + Crt9); (c) enlarged view for the same spectra; (d) FTIR spectra for solid-state Crt9. | ||
| Vibrational modes | IR wavenumber (cm−1) | ||
|---|---|---|---|
| M3 | M3 + Crt9 | Crt9 | |
| Carbonyl stretching of M3 (A) | 1606 | 1592 | — |
| Carbonyl stretching of M3 (B) | 1764 | 1764 | — |
| Carbonyl stretching of M3 (C) | 1712 | 1712 | — |
| N–H stretching of Crt9 (D) | — | 3234 | 3242 |
| Carbonyl stretching of Crt9 (E) | — | 1666 | 1666 |
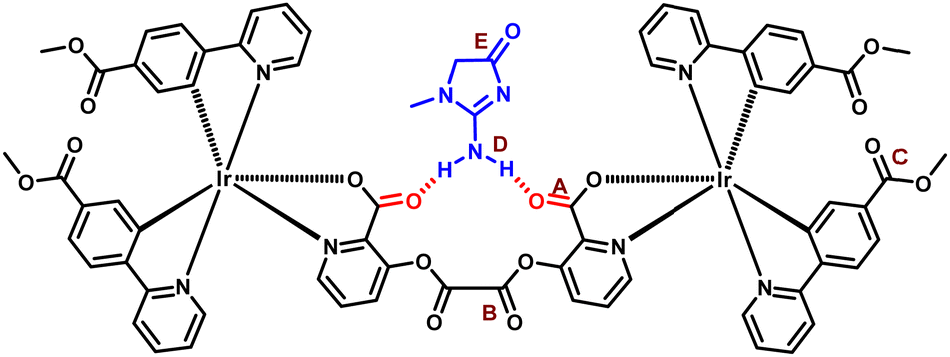 | ||
| Fig. 9 (a) Schematic of the structural model for the interaction of creatinine (Crt9) with M3, with the labeled characteristic bonds (as A, B, C, D, and E). | ||
Another probe, M6, was designed by extending the four-carbon chain between the two bridged carbonyl groups of M3 (Fig. 10). The probe M6 was synthesized similarly to M3 by using adipoyl chloride instead of oxalyl chloride, and it was structurally characterized by 1H NMR (Fig. S22, ESI†). The 1H NMR peaks at 3.2 and 4.1 ppm indicate the middle two –CH2– group and two –CH2– adjacent to oxalyl carbonyl. The M6 probe was also tested for creatinine detection similar to M3 on a paper strip, and no luminescence response was observed in the presence of creatinine. This study supports that the observed change in the luminescence of M3 in the presence of creatinine might result from the interaction of the carbonyl of picolinate ester with creatinine. From the FESEM images, a very distinct nano-structured morphological difference was observed for solid M3 and M3 mixed with Crt9 (nanowire-based network structure vs. continuous uniform nanostructure with scattered porosity) (Fig. S23, ESI†). As a result, the absorbance study also provides support for the interactions between creatinine and M3 molecules. As per solid-state UV-VIS analysis, the solid M3 shows a change in absorption in the presence of creatinine (M3 + Crt9) because of the formation of a new complex (Fig. S24, ESI†). From the present work, such multinuclear iridium(III)-based scaffolds framework may serve as effective luminescent-based probes for sensing important biological analytes.
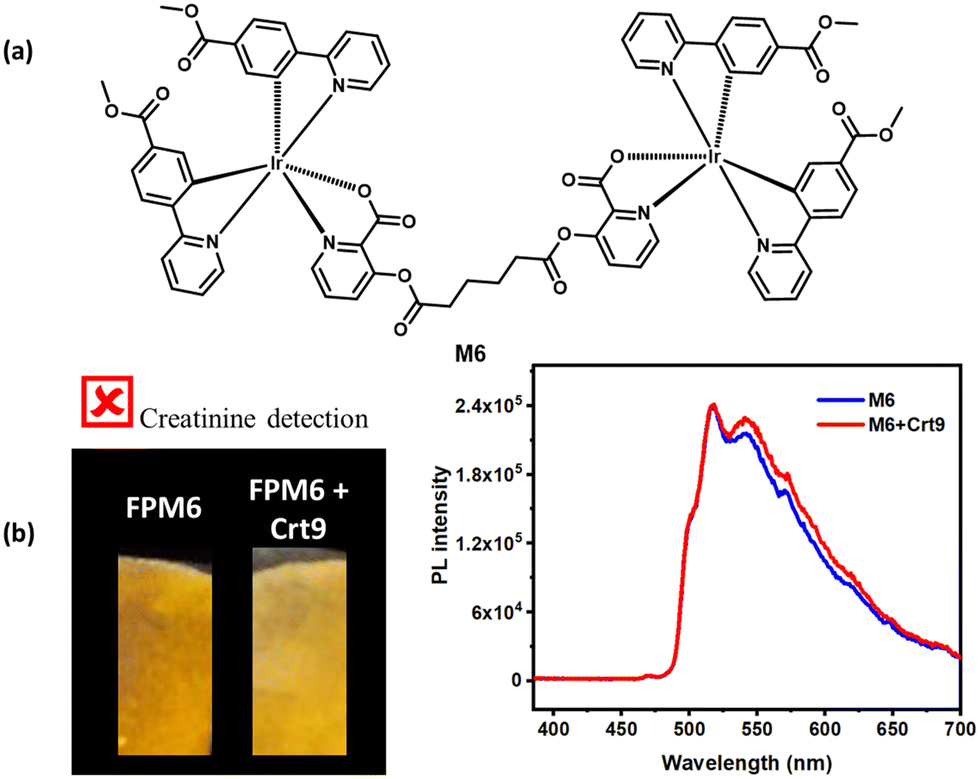 | ||
| Fig. 10 (a) Chemical structure for the synthesized dinuclear iridium(III) complex M6 and (b) luminescent response on a filter paper strip impregnated with M6 (i.e., FPM6) under a UV lamp (365 nm) with the corresponding PL intensity spectra (excitation at λexc. = 370 nm). | ||
Conclusions
Herein, we developed a new oxalyl-bridged dinuclear iridium(III) complex (M3). The M3 probe shows an emission enhancement with a blue shift in response to the presence of creatinine. With a low-cost approach, it detects creatinine in a paper-based method and a solid (powder) state. Additionally, the M3 probe successfully exhibited a response to creatinine with a human urine sample. A selectivity study was performed with all of the co-analytes present in human urine, which indicated that the newly designed probe is highly selective to creatinine. In supporting the proposed mechanism, three more iridium(III) complexes were synthesized, evidencing the proposed mechanism for the interaction between carbonyls and amine. The shifting of the IR frequency of the interacting carbonyls and amines in the combined state likely occurs as a result of the proposed binding of the probe and analytes. This study demonstrated the feasibility of detecting creatinine on a cheaper filter paper strip mode through the practicality of this method. The benefits of the developed analytical platform are compatible analysis, noninvasiveness, selectivity, low sample volume requirement, and no requirement for sample pre-treatments. Furthermore, it extends the successful detection of creatinine from human urine, drawing attention to the development of suitable probes for ACR study and obtaining a prior indication of early-stage kidney disease.Author contributions
Pramod C. Raichure: conceptualization, investigation, methodology, writing – original draft. Bharat Kaushik: synthetic investigation, UV-vis and fluorescence experiments, formal analysis. Annu Agarwal: UV-vis and fluorescence experiments. Inamur Rahaman Laskar: conceptualization, methodology, supervision, writing – review & editing.Data availability
The data supporting this article have been included as part of the ESI.†Conflicts of interest
There are no conflicts to declare.Acknowledgements
The authors gratefully acknowledge the Department of Biotechnology (DBT), Govt. of India (project number: BT/PR33133/MED/32/704/2019) for financial assistance, and the ‘UGC-sponsored Special Assistance Programme (F.540/14/DRS/2007, SAP-I)’ and DST-FIST (SR/FST/CSI-270/2015) for the HRMS facility in the chemistry department, BITS Pilani. P. C. R. acknowledges BITS Pilani, Pilani campus, for a fellowship and for instrumental support. We acknowledge the Medical Centre, BITS Pilani, Pilani Campus, and Clinical Laboratory facilities for providing urine samples and clinical data.Notes and references
- V. Jha, G. Garcia-Garcia, K. Iseki, Z. Li, S. Naicker, B. Plattner, R. Saran, A. Y.-M. Wang and C.-W. Yang, Lancet, 2013, 382, 260–272 CrossRef PubMed.
- W. G. Couser, G. Remuzzi, S. Mendis and M. Tonelli, Kidney Int., 2011, 80, 1258–1270 CrossRef PubMed.
- J. R. Roberts, Emerg. Med. News, 2007, 29(6), 24–27 CrossRef.
- A. P. de Silva, H. Q. N. Gunaratne, T. Gunnlaugsson, A. J. M. Huxley, C. P. McCoy, J. T. Rademacher and T. E. Rice, Chem. Rev., 1997, 97, 1515–1566 CrossRef CAS PubMed.
- S. S. Pasha, P. Das, N. P. Rath, D. Bandyopadhyay, N. R. Jana and I. R. Laskar, Inorg. Chem. Commun., 2016, 67, 107–111 CrossRef CAS.
- P. Alam, P. Das, C. Climent, M. Karanam, D. Casanova, A. R. Choudhury, P. Alemany, N. R. Jana and I. R. Laskar, J. Mater. Chem. C, 2014, 2, 5615–5628 RSC.
- P. C. Raichure, V. Kachwal and I. R. Laskar, Molecules, 2022, 27(1), 202 CrossRef CAS PubMed.
- C. Wang, B. Xu, M. Li, Z. Chi, Y. Xie, Q. Li and Z. Li, Mater. Horiz., 2016, 3, 220–225 RSC.
- P. Alam, G. Kaur, C. Climent, S. Pasha, D. Casanova, P. Alemany, A. Roy Choudhury and I. R. Laskar, Dalton Trans., 2014, 43, 16431–16440 RSC.
- P. C. Raichure, R. Bhatt, V. Kachwal, T. C. Sharma and I. R. Laskar, New J. Chem., 2022, 46, 6560–6569 RSC.
- Q. Li and Z. Li, Adv. Sci., 2017, 4, 1600484 CrossRef PubMed.
- C. W. T. Leung, Y. Hong, S. Chen, E. Zhao, J. W. Y. Lam and B. Z. Tang, J. Am. Chem. Soc., 2013, 135, 62–65 CrossRef CAS PubMed.
- T. Han, C. Gui, J. W. Y. Lam, M. Jiang, N. Xie, R. T. K. Kwok and B. Z. Tang, Macromolecules, 2017, 50, 5807–5815 CrossRef CAS.
- C. Zhou, M. Jiang, J. Du, H. Bai, G. Shan, R. T. K. Kwok, J. H. C. Chau, J. Zhang, J. W. Y. Lam, P. Huang and B. Z. Tang, Chem. Sci., 2020, 11, 4730–4740 RSC.
- X.-d Wang and O. S. Wolfbeis, Anal. Chem., 2016, 88, 203–227 CrossRef CAS PubMed.
- M.-j Yin, B. Gu, Q.-F. An, C. Yang, Y. L. Guan and K.-T. Yong, Coord. Chem. Rev., 2018, 376, 348–392 CrossRef CAS.
- C. Elosua, F. J. Arregui, I. D. Villar, C. Ruiz-Zamarreño, J. M. Corres, C. Bariain, J. Goicoechea, M. Hernaez, P. J. Rivero, A. B. Socorro, A. Urrutia, P. Sanchez, P. Zubiate, D. Lopez-Torres, N. D. Acha, J. Ascorbe, A. Ozcariz and I. R. Matias, Sensors, 2017, 17(10), 2312 CrossRef PubMed.
- D.-L. Ma, S. Lin, W. Wang, C. Yang and C.-H. Leung, Chem. Sci., 2017, 8, 878–889 RSC.
- W. Che, G. Li, X. Liu, K. Shao, D. Zhu, Z. Su and M. R. Bryce, Chem. Commun., 2018, 54, 1730–1733 RSC.
- P. C. Raichure, V. Kachwal, D. Sengottuvelu and I. R. Laskar, Macromolecules, 2022, 55, 10377–10384 CrossRef CAS.
- T. Chen, N. Xie, L. Viglianti, Y. Zhou, H. Tan, B. Z. Tang and Y. Tang, Faraday Discuss., 2017, 196, 351–362 RSC.
- J. Sittiwong and F. Unob, Anal. Sci., 2016, 32, 639–643 CrossRef CAS PubMed.
- K. Kotaska, B. Jedlicková and R. Průsa, Cas. Lek. Cesk., 2008, 147, 392–395 CAS.
- M. T. Alula, L. Karamchand, N. R. Hendricks and J. M. Blackburn, Anal. Chim. Acta, 2018, 1007, 40–49 CrossRef CAS PubMed.
- X. Jin, J. Shi, J. Guan, G. Ni and J. Peng, NANO, 2017, 12, 1750070 CrossRef CAS.
- M. S. Mathew and K. Joseph, ACS Sustainable Chem. Eng., 2017, 5, 4837–4845 CrossRef CAS.
- R. Jalili and A. Khataee, Microchim. Acta, 2018, 186, 29 CrossRef PubMed.
- P. J. Babu, A. M. Raichur and M. Doble, Sens. Actuators, B, 2018, 258, 1267–1278 CrossRef CAS.
- M. Hassanzadeh, M. Ghaemy, S. M. Amininasab and Z. Shami, Sens. Actuators, A, 2021, 331, 112936 CrossRef CAS.
- R. Narimani, M. Esmaeili, S. H. Rasta, H. T. Khosroshahi and A. Mobed, Anal. Sci. Adv., 2021, 2, 308–325 CrossRef CAS PubMed.
- R. A. A. U. H. K. J. A. U. V. V. M. A. U. C. S. A. T. I. M. I. P. w. F. Almotiri, Journal, 2019, 12.
- M. Niu, C. Pham-Huy and H. He, Microchim. Acta, 2016, 183, 2677–2695 CrossRef CAS.
- D. Kukkar, M. Chhillar and K.-H. Kim, Biosens. Bioelectron., 2023, 232, 115311 CrossRef CAS PubMed.
- S. Francis, N. Sunny and L. Rajith, J. Photochem. Photobiol., A, 2023, 438, 114534 CrossRef CAS.
- D. J. Joshi, S. Jha, N. I. Malek, T. J. Park and S. K. Kailasa, FlatChem, 2024, 47, 100719 CrossRef CAS.
- C. L. Gonzalez-Gallardo, N. Arjona, L. Álvarez-Contreras and M. Guerra-Balcázar, RSC Adv., 2022, 12, 31890 RSC.
- S. Sargazi, I. Fatima, M. Hassan Kiani, V. Mohammadzadeh, R. Arshad, M. Bilal, A. Rahdar, A. M. Díez-Pascual and R. Behzadmehr, Int. J. Biol. Macromol., 2022, 206, 115–147 CrossRef CAS PubMed.
- B. Yao, M.-C. Giel and Y. Hong, Mater. Chem. Front., 2021, 5, 2124–2142 RSC.
- T. S. Anirudhan, J. R. Deepa and N. Stanly, Appl. Surf. Sci., 2019, 466, 28–39 CrossRef CAS.
- E. Liotta, R. Gottardo, L. Bonizzato, J. P. Pascali, A. Bertaso and F. Tagliaro, Clin. Chim. Acta, 2009, 409, 52–55 CrossRef CAS PubMed.
- V. Kachwal, P. K. Sharma, A. Sarmah, S. Chowdhury and I. R. Laskar, J. Mater. Chem. C, 2020, 8, 6605–6614 RSC.
- N. B. Colthup, L. H. Daly and S. E. Wiberley, in Introduction to Infrared and Raman Spectroscopy, ed. N. B. Colthup, L. H. Daly and S. E. Wiberley, Academic Press, San Diego, 1990, pp. 289–325 DOI:10.1016/B978-0-08-091740-5.50012-0.
- S.-D. Zhang, Y.-R. Zhang, H.-X. Huang, B.-Y. Yan, X. Zhang and Y. Tang, J. Polym. Res., 2009, 17, 43 CrossRef.
- D. Lin-Vien, N. B. Colthup, W. G. Fateley and J. G. Grasselli, in The Handbook of Infrared and Raman Characteristic Frequencies of Organic Molecules, ed. D. Lin-Vien, N. B. Colthup, W. G. Fateley and J. G. Grasselli, Academic Press, San Diego, 1991, pp. 117–154 DOI:10.1016/B978-0-08-057116-4.50015-8.
- S. Shariati and G. Khayatian, Microfluid. Nanofluid., 2022, 26, 30 CrossRef CAS.
- D. Gangopadhyay, M. Das, K. K. Singh, R. K. Singh and P. Tandon, J. Raman Spectrosc., 2020, 51, 1056–1066 CrossRef CAS.
Footnote |
| † Electronic supplementary information (ESI) available: Experimental details, 1H, and 13C NMR, HRMS analysis, absorbance plot, lifetime decay plot, and FESEM images. See DOI: https://doi.org/10.1039/d4ma01084a |
| This journal is © The Royal Society of Chemistry 2025 |