 Open Access Article
Creative Commons Attribution 3.0 Unported Licence
Nanoscale modification of MOC-based composites: the influence of alumina nanosheets on the microstructure and material properties
Anna-Marie
Lauermannová
 *a,
Adéla
Jiříčková
a,
Martina
Záleská
 ab,
Milena
Pavlíková
b,
Adam
Pivák
b,
Ondřej
Jankovský
a and
Zbyšek
Pavlík
b
aDepartment of Inorganic Chemistry, Faculty of Chemical Technology, University of Chemistry and Technology, Technická 5, 166 28 Praha 6, Czech Republic. E-mail: Anna-Marie.Lauermannova@vscht.cz
bDepartment of Materials Engineering and Chemistry, Faculty of Civil Engineering, Czech Technical University in Prague, Thákurova 7, 166 29 Prague, Czech Republic
First published on 14th May 2025
Abstract
The presented study deals with the optimization of alumina nanosheets (ANS) content in magnesium oxychloride cement (MOC)-based construction composites filled with silica sand. The experimental setup was designed in such a way that the optimal content of ANS in these composites was determined while ensuring the highest possible values of mechanical parameters (compressive and flexural strength, and Young's dynamic modulus) while maintaining good water resistance of the prepared composite, which is a crucial parameter in terms of MOC-based materials. The designed composites were studied concerning the changes in their structure after the addition of ANS, especially in their porosity and density. The prepared composites were also examined in detail using scanning electron microscopy in order to show changes in their microstructure. It was revealed that the addition of 0.1 wt% of ANS was the most beneficial, causing an 8.4% increase in compressive strength, a 3.4% increase in flexural strength, and an 8.4% increase in the dynamic Young's modulus compared to the sample with no additives. On the other hand, the sample containing 0.5 wt% of ANS showed the best hygric properties with a water absorption coefficient of 3.21 kg m2 s−1/2 and 24-h water absorption of 68.3 kg m−3 and the best resistance to water damage defined by the softening coefficient (78.3%) and the residual compressive strength (61.3 MPa) after 24 h immersion in water.
Introduction
Construction composites based on magnesium oxychloride cement (MOC) have gained much attention in construction and building material research. This is caused by their high potential in the applications where they can replace Portland cement (PC)-based composites as their eco-friendly alternative. The eco-friendly character of MOC is based on the lower processing temperature compared to PC1 and also its increased ability to sequester atmospheric CO2.2,3 These properties, together with its high mechanical strength, non-hydraulic character, low thermal conductivity, and good fire and abrasion resistance, make it a suitable alternative to PC.4–6 The current research into MOC mainly concerns the design of MOC-based composites containing suitable admixtures to address its primary issue – poor water resistance.7,8 Generally, exposure to excess humidity causes an undesirable deterioration of the mechanical properties of MOC-based composites. The MOC phases decompose during contact with moisture while forming Mg(OH)2, MgCl2, and H2O.9,10 The decomposition takes place according to the following equations (eqn (1) for MOC phase 5 – 5 Mg(OH)2·MgCl2·8H2O – and eqn (2) for MOC phase 3 – 3 Mg(OH)2·MgCl2·8H2O) first presented by He et al.:11 | (1) |
 | (2) |
This results in the change of microstructure from the typical needle- and rod-shaped crystals of MOC to the flake-like layered microstructure of Mg(OH)2.12,13 The water intrusion is further supported by the porous structure of MOC, manifested in voids, pores, and crystal contact points at which the solubility is very high, while the thermodynamical stability is very low.14 Researchers nowadays propose the addition of admixtures based on inorganic acids and their salts,15–19 organic polymers,20,21 resins,22–24 and lately also various types of nanomaterials. Recently, it was shown that the addition of nanomaterials can positively affect not only the water resistance of MOC-based composites but also help to enhance other material properties, such as mechanical, thermal, or structural parameters, including compressive strength, flexural strength, porosity, electrical and thermal conductivity, and many others.25–32 Alumina nanosheets (ANS) are α-Al2O3-based nanosized particles with high mechanical strength, durability, low electrical conductivity, and high corrosion resistance. The main fields of the application of ANS are catalysis, filtration, abrasives, and various types of composites or ceramics.33–36 The application of ANS in construction materials was previously studied by multiple researchers, showing their potential for improvement of various material properties. Multiple experiments concerning the early-stage properties of PC-based blends containing ANS were conducted, showing that ANS cause the increase in the cumulative heat released during the PC hydration reaction, which leads to an improvement in the nucleation and growth of crystalline hydration products.37,38 Barbhuiya et al. studied the influence of the addition of 2–4 wt% of ANS into PC-based paste, showing its positive influence on the densification of its microstructure.39 Nazari et al. studied the influence of ANS on the workability and compressive strength of blended PC-based concrete. It was shown that even though the workability of the fresh concrete somewhat decreased, the compressive strength increased by 14.9% after 28 days of curing when 1 wt% of ANS was added.40 Farzadnia et al. demonstrated that the utilization of ANS in the amount of 1 to 3 wt% helped to improve the mechanical strength, gas permeability, and the relative elastic modulus of PC-based mortars. Furthermore, the prepared samples underwent thermal treatment up to 1000 °C. It was shown that the ANS additive helps to improve the residual strength after this treatment.41ANS were also incorporated in non-PC-based composites in previous studies. Feng et al. described the effectiveness of ANS addition into magnesium potassium phosphate cement in terms of compressive and flexural strength and, most importantly, water resistance improvement. It was shown that the content of ANS up to 8 wt% was very beneficial, considering the mechanical and hygric properties of the prepared composite materials. It was also shown that the addition of ANS improves the compactness of the matrix microstructure and, furthermore, propagates the bonding of the matrix and filler material in the composite structure.42 The incorporation of ANS in MOC-based composite materials was studied by Jiříčková et al., showing that 1 wt% of ANS can significantly improve the flexural strength (57% improvement) and softening coefficient after 24-h immersion in water (23% improvement), which is a crucial parameter considering the low water resistance of pure MOC.43
This study deals with optimizing the ANS additive content in MOC-based composites filled with silica sand to obtain the highest possible values of mechanical parameters while ensuring good water resistance. A comprehensive study of the basic structural parameters, such as bulk and matrix density and total open porosity, together with a detailed microscopic analysis of the sample microstructure, helped to determine the influence of the nanoadditive on the structural level. Furthermore, the chemical relations in terms of the phase composition of the crystalline phases present and chemical composition both in the bulk and on the fracture surface of the prepared samples in the designed systems were thoroughly studied.
Experimental
Analytical methods
A wide range of analytical methods and tests was used to characterize the precursors and the prepared composite materials. X-ray diffraction (XRD) was used to determine the phase composition. The chemical composition of the samples was studied using X-ray fluorescence (XRF). The microstructure and morphology were examined using scanning electron microscopy (SEM), and elemental maps of the studied fracture surfaces were recorded using energy dispersive spectroscopy (EDS).Open porosity, bulk density, and matrix density were studied among the physical parameters of the prepared samples. Pore size distribution curves (incremental and cumulative), total pore volume, and average pore diameter were studied using mercury intrusion porosimetry (MIP). Specific density was determined using helium pycnometry, and bulk density was analyzed using a standardized test. The composite samples also underwent a series of tests in order to obtain their mechanical parameters, namely compressive and flexural strength, as well as Young's dynamic modulus. Furthermore, the water resistance of the samples was determined by measuring their hygric parameters. Among these, the 24-hour water absorption and water absorption coefficient were determined using standardized tests. To show the resistance to water-induced damage in terms of mechanical strength, the softening coefficient, which is a ratio of the residual compressive strength of the sample after immersion in water for 24 hours and the compressive strength after 28 days of curing, was determined. More detailed information on the apparatuses, techniques, and standards used can be found in the description of our previous experimental work in.44,45
Alumina nanosheets characterization
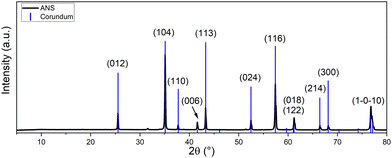
Before the preparation of the MOC-based composites doped with ANS, the nanomaterial itself was characterized. The characterization of the nanomaterial was crucial when designing the mixture composition for the MOC-based composites and determining the influence of the ANS at the microstructural level.The phase composition was studied using XRD. The sample ANS manifested the presence of aluminum oxide in the form of corundum (ICDD 01-075-1862). The obtained diffraction pattern with the indexed reflection planes is shown in Fig. 1. Some of the intensities of the reflections were intensified by the effect of the preferential orientation of the platelet-shaped ANS.
The chemical composition was studied with XRF. The content of the detected elements was subsequently recalculated to the amount of their oxides. The results were normalized to make a sum of 100 wt%. Most of the sample was Al2O3 with only trace amounts of other elements, such as Na, Cl, Si, Fe, and Ca. The obtained results are summarized in Table 1.
| Element | Content [wt%] | Oxide | Content [wt%] |
|---|---|---|---|
| Al | 98.80 | Al2O3 | 99.27 |
| Na | 0.48 | Na2O | 0.48 |
| Cl | 0.45 | Cl | 0.12 |
| Si | 0.12 | SiO2 | 0.07 |
| Fe | 0.09 | Fe2O3 | 0.04 |
| Ca | 0.06 | CaO | 0.02 |
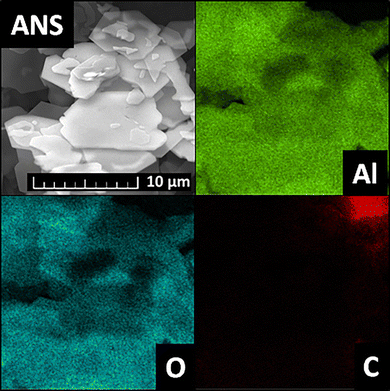
The XRF results were further supported by EDS. The elemental maps obtained from this analysis are shown in Fig. 2. The maps show the presence of Al and O originating from the alumina nanoparticles and C, which is present due to the placement of the sample on a conductive carbon tape. The content of the detected elements in the scanned area was determined to be 51.0 wt% of O and 49.0 wt% of Al.
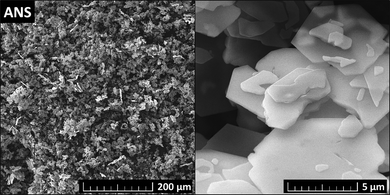
The microstructure and morphology of ANS were studied using SEM. The particles have hexagonal platelet shapes with a thickness of ∼10 nm and a diameter of 3–10 μm. The obtained SEM micrographs are shown in Fig. 3.
Composite sample preparation
The designed composites were prepared using the following chemicals: magnesium oxide (MgO, purity >98%, Penta, Czech Republic), magnesium chloride hexahydrate (MgCl2·6H2O, purity >98%, Lachner, s.r.o., Czech Republic), tap water, silica sand in three size fractions 0.0–0.5 mm, 0.5–1.0 mm, and 1.0–2.0 mm (PG1, PG2, and PG3, Filtrační písky spol. s r.o., Czech Republic), and alumina nanosheets (ANS, purity >98%, Merck, Germany). Overall, five sets of MOC-based composite samples were prepared. The designation of the samples shows whether the sample is a reference (REF) sample containing only the MOC Phase 5 matrix and silica sand filler or a composite doped with ANS in a ratio respective to the amount of the matrix – 0.05, 0.1, 0.5, and 1.0 wt% (ANS 0.05, ANS 0.1, ANS 0.5, and ANS 1.0). The composition of the initial mixtures is summarized in Table 2.| MgO | MgCl2·6H2O | Water | PG1 | PG2 | PG3 | ANS | |
|---|---|---|---|---|---|---|---|
| REF | 709.90 | 716.17 | 444.24 | 709.90 | 709.90 | 709.90 | 0.00 |
| ANS 0.05 | 709.90 | 716.17 | 444.24 | 709.90 | 709.90 | 709.90 | 0.94 |
| ANS 0.1 | 709.90 | 716.17 | 444.24 | 709.90 | 709.90 | 709.90 | 1.87 |
| ANS 0.5 | 709.90 | 716.17 | 444.24 | 709.90 | 709.90 | 709.90 | 9.35 |
| ANS 1.0 | 709.90 | 716.17 | 444.24 | 709.90 | 709.90 | 709.90 | 18.70 |
The raw material mixtures were prepared in a standard planetary mortar mixer. First, the liquid part consisting of a magnesium chloride aqueous solution in the case of REF and a suspension of ANS in a magnesium chloride aqueous solution in the case of ANS-containing samples was prepared. The ANS suspension was pre-dispersed using a rotor-stator homogenizer to ensure its homogeneity. The liquid part was then poured over the MgO powder and mixed in a planetary mortar mixer. After low-speed mixing, the silica sand filler was added and mixed at a high speed. After mixing, the samples were poured into molds, in which they remained for 1 day, and then they were taken out and left to cure for an additional 27 days. For both periods, the temperature was set to 23 ± 2 °C, and the relative humidity was set to 50 ± 5%. After 28 days of controlled curing, the samples were thoroughly analyzed using the aforementioned methods.
Results and discussion
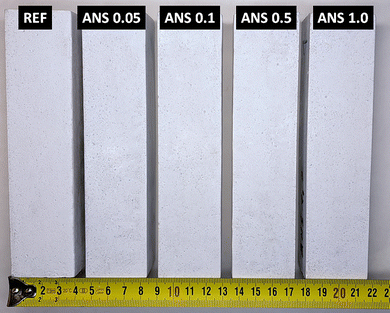
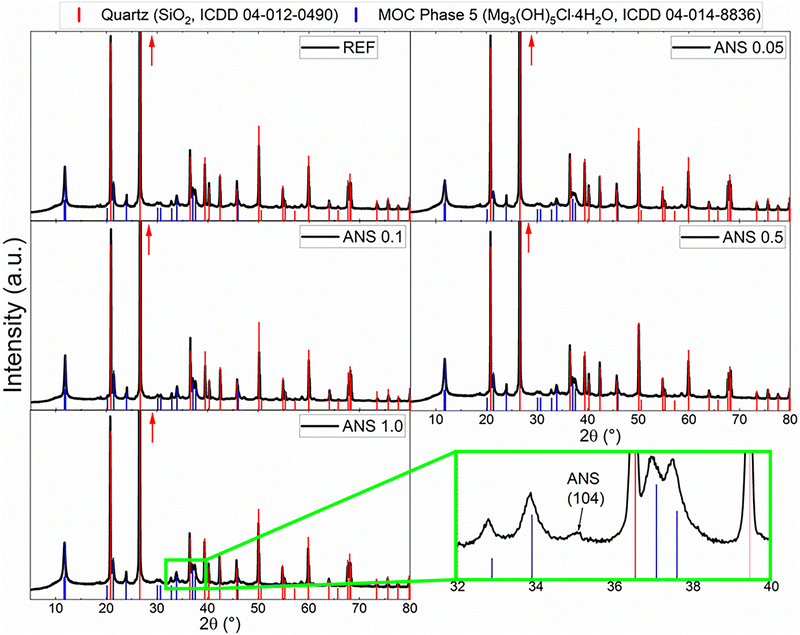
A photograph of the prepared prismatic samples is shown in Fig. 4. The addition of ANS did not cause any apparent color change, and all of the samples maintained their ivory-like appearance.The phase composition of the prepared samples is shown in the diffraction patterns obtained from XRD in Fig. 5. All of the prepared composites show the presence of two crystalline phases, MOC Phase 5 (Mg3(OH)5Cl·4H2O, ICDD 04-014-8836), which is the main crystalline phase in the matrix, and quartz (SiO2, ICDD 01-070-3755), which originates in the presence of the silica sand filler. As the content of the ANS nanoadditive is very low, its reflections cannot be seen in the patterns in most of the diffraction patterns of the prepared samples. However, due to the increase in the reflection intensities of ANS due to the preferential orientation (mentioned above), the presence of ANS manifested in the diffraction pattern of the sample ANS 1.0 at 2θ ≈ 35.08° (magnified reflection indexed as (104)).
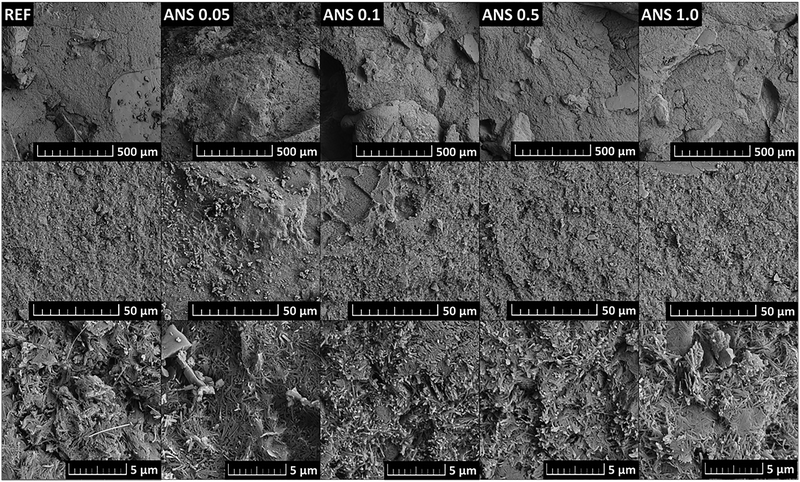
The SEM micrographs (Fig. 6) show the microstructure of the fracture surface of the prepared samples. All of the micrographs at the highest magnification show the presence of needle-shaped crystals, which are typical for MOC Phase 5. It can be seen that these crystals grow through each other. This intergrowing is responsible for the dense microstructure and low porosity of the composites, which results in high mechanical parameters, which will be further discussed. At the highest magnification, it can be seen that the ANS-containing samples show a somewhat oriented growth of the MOC needle-shaped crystals, which originates in the nucleation center function of the nanoadditive. The actual ANS platelets cannot be seen, as they are covered in MOC crystals, however, the specific orientation of the MOC needles proves their presence. The result of this phenomenon, and therefore the presence of ANS, causes further densification of the composite microstructure by augmenting the intergrowth of the acicular crystals.
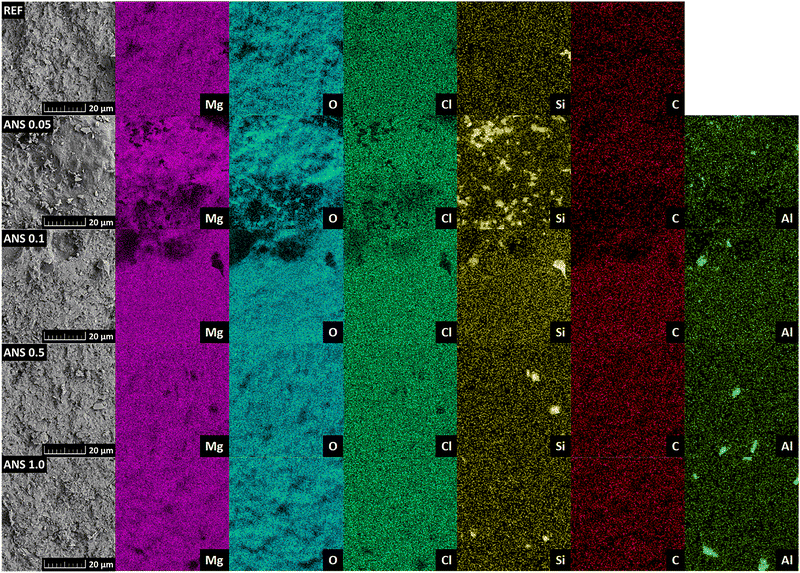
The fracture surface studied by SEM was also analyzed using EDS in order to determine the chemical composition and obtain the elemental maps (see Fig. 7). The elemental maps show the presence of Mg, O, Cl, C, and Si for all samples and also Al for the ANS-doped samples. The presence of carbon is caused by the carbon conducting tape, on which the samples are attached for this measurement, and to a smaller extent also by the surface reaction of the samples with atmospheric CO2, which causes the formation of a chlorocarbonate phase, which was described in detail in our previous publication.3 In the elemental maps, the Si-rich regions represent the silica sand filler grains, and the Al-rich regions represent agglomerates of the ANS nanoadditive. The diameter of these agglomerates is between 2 and 5 μm. The structural parameters of the hardened composites measured in the aforementioned tests are summarized in Table 3. The effect of ANS on the studied physical parameters was evident but ambiguous with respect to the ANS dosage. The addition of ANS resulted in a densified structure of the composites, followed by increased bulk density and considerably reduced porosity. Compared to the control composite REF, the maximum reduction in open porosity reached 21.6%. Such a decrease in porosity was obtained for the composite ANS 0.5. On the other hand, there was no trend in the measured structural parameters among the nanomodified composites, i.e., the dependence of the assessed material properties on the content of ANS in the composites was not identified. The changes in specific density were within the measurement uncertainty of the helium pycnometry test.
| Bulk density [kg m−3] | Specific density [kg m−3] | Total open porosity [%] | |
|---|---|---|---|
| REF | 2023 ± 28 | 2275 ± 27 | 10.9 ± 0.2 |
| ANS 0.05 | 2047 ± 29 | 2254 ± 27 | 9.7 ± 0.2 |
| ANS 0.1 | 2038 ± 29 | 2269 ± 27 | 10.2 ± 0.2 |
| ANS 0.5 | 2044 ± 29 | 2234 ± 27 | 8.5 ± 0.2 |
| ANS 1.0 | 2048 ± 29 | 2250 ± 27 | 9.0 ± 0.2 |
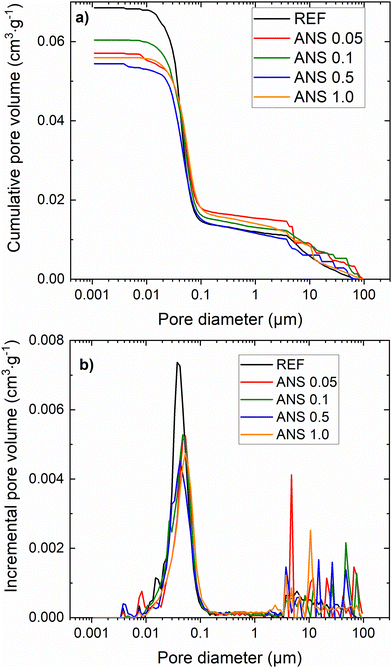
The microstructure of the composites was analyzed by MIP. The studied parameters were cumulative and incremental pore size distribution curves, total pore volume, and average pore diameter. The incremental and cumulative pore size distribution curves shown in Fig. 8a and b were used to calculate the total pore volume and average pore diameter, which are presented in Table 4. The pore size distribution curves demonstrate the reduced porosity of the ANS composites compared to the REF material. The decrease in pore volume in the 0.01 μm to 0.1 μm diameter range is clearly visible. The total pore volume followed the trend of total open porosity obtained by helium pycnometry combined with the gravimetric assessment of dry bulk density. In agreement with the macrostructural parameters of the MOC composites, the lowest total pore volume was found for sample ANS 0.5 (0.0544 cm3 g−1), and the highest total pore volume (0.0685 cm3 g−1) was recorded for the reference sample without the nanoadditive. This was most probably caused by sufficient filling of the MOC matrix pores in ANS 0.5, while the content of the ANS was still low enough for them to agglomerate in the mixture. In the case of smaller content, the filling of the pores was not as efficient in the case of the sample with a higher content of ANS, the agglomeration of the ANS particles took place, and therefore, the macro- and mesopores could not have been filled efficiently. Also, for other samples with ANS, the total pore volume values were lower than that of the reference material, indicating the solidification of the MOC matrix by the applied nanoadditive. The average pore diameter varied from 0.0509 μm to 0.0404 μm and was reduced for ANS-containing composites compared to the control sample REF. The refinement of the porous structure can thus be attributed to the entrapment of ANS in the MOC Phase 5 crystals.
| Total pore volume [cm3 g−1] | Average pore diameter [μm] | |
|---|---|---|
| REF | 0.0685 | 0.0509 |
| ANS 0.05 | 0.0571 | 0.0470 |
| ANS 0.1 | 0.0604 | 0.0459 |
| ANS 0.5 | 0.0544 | 0.0404 |
| ANS 1.0 | 0.0559 | 0.0412 |
Compressive strength, flexural strength, and dynamic Young's modulus were the tested mechanical parameters. They are presented in Fig. 9–11. Table 5 summarizes the average values (in Fig. 9–11 marked in red lines) calculated from multiple measurements, where the outliers (in Fig. 9–11 marked in light gray points) were left out of the calculation. Quantitatively, the acquired mechanical properties are high, evincing the resistance of the composites to mechanical load.46,47 Moreover, the high Young's modulus, a measure of stiffness, assigned the tested composites as brittle materials,48 which was well visible in both strength tests. In agreement with the densifying of the MOC matrix by the intergrowth of ANS in MOC Phase 5 and interlocking of its crystals, which led to the lower porosity of ANS-modified composites, the investigated mechanical parameters were enhanced, and the mechanical strength improved using ANS. The action of ANS can be referred to as a nano-domain-limited effect impacting the crystallization mechanisms of MOC by a change in the nucleation environment, growth, and the final stabilization of the products.49 The improvement in the mechanical parameters is rather limited, mostly due to the formation of agglomerates of ANS in the microstructure of MOC-based samples (mentioned above). Additional homogenization may be the solution to this issue, resulting in better dispersion of this nanoadditive, followed by a more significant improvement of the mechanical parameters, especially in the case of higher dosages of ANS.
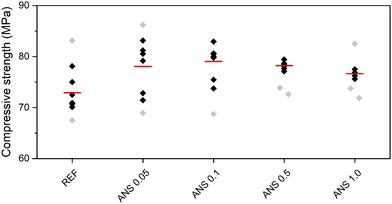 | ||
| Fig. 9 Compressive strength of the composites (black – data used for calculation of average, grey – outliers, red – average). | ||
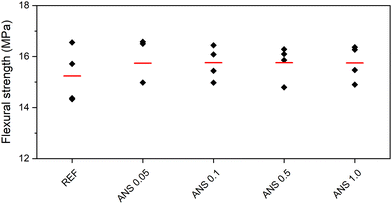 | ||
| Fig. 10 Flexural strength of the composites (black – data used for calculation of average, grey – outliers, red – average). | ||
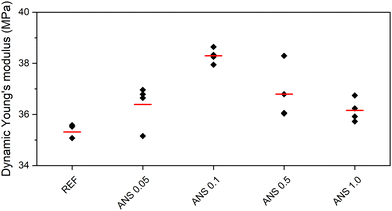 | ||
| Fig. 11 Dynamic Young's modulus of the composites (black – data used for calculation of average, grey – outliers, red – average). | ||
| Compressive strength [MPa] | Flexural strength [MPa] | Dynamic Young's modulus [GPa] | |
|---|---|---|---|
| REF | 72.90 | 15.24 | 35.31 |
| ANS 0.05 | 78.06 | 15.74 | 36.39 |
| ANS 0.1 | 79.01 | 15.76 | 38.29 |
| ANS 0.5 | 78.23 | 15.76 | 36.80 |
| ANS 1.0 | 76.63 | 15.75 | 36.16 |
Similarly to the macrostructural and microstructural parameters, no trend was observed in the obtained mechanical parameters and the concentration of ANS in the composites. The increase in compressive strength varied from 5.1% measured for ANS 1.0 to 8.4% for ANS 0.1. In the case of the flexural strength values, the differences in the obtained data varied only slightly (3.3–3.4%), i.e., considering the expanded combined uncertainty of the flexural strength test, the contribution of ANS to the total flexural strength was insignificant. This was consistent with the brittleness of the MOC matrix itself.50,51
The increase in Young's modulus (compared to the sample REF) caused by the addition of ANS was observed for all the investigated composites. The highest dynamic modulus (38.3 GPa) was obtained for the ANS 0.1 sample. For other ANS-containing composites, the increase in dynamic modulus varied between 2.4% and 4.2%. Again, there was no apparent dependence of Young's modulus on the dosage of the nanoadditive in the composite. The hygric properties are given in Table 6. In general, they follow the trend of the total open porosity. The material with the highest porosity (REF) exhibited the highest ability to transport water, expressed by the water absorption coefficient, and the highest capability to accommodate liquid moisture, i.e., water absorption, expressed in the form of 24-hour water absorption. The incorporation of ANS reduced the water absorption and water transport rate of the composites, which could be effective in improving their water resistance.
| Water absorption coefficient × 103 [kg m2 s−1/2] | 24-h water absorption [kg m−3] | |
|---|---|---|
| REF | 3.75 ± 0.09 | 73.1 ± 1.5 |
| ANS 0.05 | 3.52 ± 0.08 | 72.0 ± 1.4 |
| ANS 0.1 | 3.55 ± 0.08 | 71.3 ± 1.4 |
| ANS 0.5 | 3.21 ± 0.07 | 68.3 ± 1.4 |
| ANS 1.0 | 3.32 ± 0.08 | 70.6 ± 1.4 |
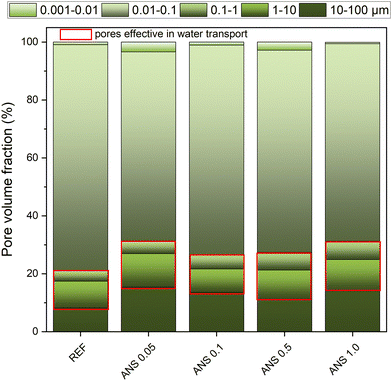
Except for the total porosity of the sample, its pore continuity, tortuosity, distribution, and size also affect water transport in capillary media. Adapting the concept of the effective porosity introduced by Mehta and Monteiro52 for concrete samples, i.e., the porosity enabling liquid water transport, the pores larger than 70 nm should be considered in the evaluation of the ability of a material to transport water.53 On the other hand, in larger pores, typically in those with a diameter >10 μm, the effect of gravity prevails against the capillary forces driving the moisture transport. In our case, the effective porosity in terms of water transport was considered for pores in the diameter range of 0.1–10 μm, similar to what is reported in the literature.54 The pore volume fraction obtained by MIP is shown in Fig. 12.
The effective porosity varied from 12.9% (ANS 0.1) to 17.2% (ANS 1.0). In this case, the pore size was not the prevailing parameter affecting the liquid water transport, and the total open porosity was the decisive parameter.43 Moreover, considering the effective porosity, the share of pores having a diameter between 0.1 μm and 0.07 μm, which was much lower for ANS samples compared to REF, the hygric parameters introduced in Table 6 can thus be justified.
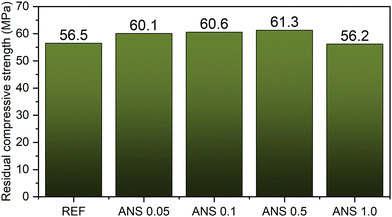
Since water resistance is one of the drawbacks of MOC-based materials, it was characterized by evaluating the softening coefficient and residual compressive strength. The softening coefficient varied in the 70.7–78.3% range and was the highest for the ANS 0.5 composite. This appeared consistent with its reduced ability to transport and accumulate moisture. To better characterize the water resistance of the tested materials, the residual compressive strength data are plotted in Fig. 13. Except for the nanomodified composite with 1 wt% of ANS, the ANS composites exhibited higher residual strength as compared to the control material REF, i.e., the use of the nanoadditive resulted in an improvement in water resistance to water damage. The negligibly reduced residual compressive strength of the ANS 1.0 sample may be caused by the aggregation of ANS due to their non-ideal distribution in the composite, which may pose a risk to its performance and durability.
Conclusions
This paper presents a study focused on the modification of basic structural, mechanical, and hygric properties of magnesium oxychloride cement-based composite filled with silica sand by alumina nanosheets. A series of experiments assessing the influence of the content of ANS were conducted. The experimental results reveal that the optimal ANS content for enhancing mechanical strength and water resistance is 0.05 and 0.1 wt%. These samples demonstrated compressive strength values between 78.0 and 79.0 MPa, a flexural strength of ∼15.8 MPa, and, most importantly, very high residual strength values after immersion in water for 24 hours (60.0–61.0 MPa). However, increasing the ANS content beyond 0.1 wt% proved somewhat counterproductive, as the microstructure of the tested samples was non-homogenous due to an uneven distribution of the nanosheets. This led to increased porosity, creating pathways for moisture penetration and ultimately reducing mechanical resistance in affected areas. The diminished structural integrity of these higher-content samples highlights the limitations of excessive ANS incorporation, particularly given the associated cost increase. To further refine and enhance MOC-based composites, future research should explore the integration of additional nanomaterials, such as multi-walled carbon nanotubes or graphene, which have previously shown beneficial effects on MOC properties. Additionally, incorporating waste-based fillers presents a promising approach to improving sustainability and reducing production costs. The development of such multi-component composites could pave the way for large-scale applications of MOC-based materials in the construction industry, ensuring both durability and economic viability.Author contributions
Conceptualization – Ondřej Jankovský, Anna-Marie Lauermannová, Milena Pavlíková, and Zbyšek Pavlík, data curation – Anna-Marie Lauermannová, Martina Záleská, Adéla Jiříčková, and Adam Pivák, funding acquisition – Ondřej Jankovský, Zbyšek Pavlík, and Milena Pavlíková, investigation – Adéla Jiříčková, Adam Pivák, and Martina Záleská, methodology – Ondřej Jankovský, Anna-Marie Lauermannová, Milena Pavlíková, and Zbyšek Pavlík, writing – original draft – Anna-Marie Lauermannová and Zbyšek Pavlík, writing – review & editing – Ondřej Jankovský, Anna-Marie Lauermannová, Milena Pavlíková, and Zbyšek Pavlík.Data availability
According to Open Science Principles, raw data can be found at https://doi.org/10.5281/zenodo.13383031.Conflicts of interest
There are no conflicts to declare.Acknowledgements
The authors greatly acknowledge the financial support from the Czech Science Foundation Grant No. 23-05194M. The infrastructure used for the characterization has been utilized in the frame of project No. CZ.02.01.01/00/22_008/0004631 Materials and technologies for sustainable development within the Jan Amos Komensky Operational Program financed by the European Union and from the state budget of the Czech Republic. The research carried out at the CTU Prague was supported by the Grant Agency of the Czech Technical University in Prague under project No SGS23/149/OHK1/3T/11 - Research and Development of High Performance Building Composites.References
- S. Ruan and C. Unluer, Comparative life cycle assessment of reactive MgO and Portland cement production, J. Cleaner Prod., 2016, 137, 258–273 CrossRef CAS.
- W. Han, H. Chen and S. Song, Thermodynamical analysis of the effects of modifiers and carbonation on the phase assemblages of magnesium oxychloride cement, Cem. Concr. Compos., 2023, 143, 105274 CrossRef CAS.
- O. Jankovský, M. Lojka, A.-M. Lauermannová, F. Antončík, M. Pavlíková and Z. Pavlík, et al., Carbon Dioxide Uptake by MOC-Based Materials, Appl. Sci., 2020, 10(7), 2254 CrossRef.
- F. Ahmad, S. Rawat and Y. Zhang, Magnesium Oxychloride Cement: Development, Opportunities and Challenges, Appl. Sci., 2024, 14(7), 3074 CrossRef CAS.
- J. Montle and K. Mayhan, The role of magnesium oxychloride as a fire-resistive material, Fire Technol., 1974, 10(3), 201–210 CrossRef.
- Y. Nie, J. Lu, Z. Liu, D. Meng, Z. He and J. Shi, Mechanical, water resistance and environmental benefits of magnesium oxychloride cement incorporating rice husk ash, Sci. Total Environ., 2022, 849, 157871 CrossRef CAS PubMed.
- Y. Xiong, H. Deng, M. Nemer and S. Johnsen, Experimental determination of the solubility constant for magnesium chloride hydroxide hydrate (Mg3Cl(OH)5·4H2O, phase 5) at room temperature, and its importance to nuclear waste isolation in geological repositories in salt formations, Geochim. Cosmochim. Acta, 2010, 74(16), 4605–4611 CrossRef CAS.
- B. Xu, H. Ma, C. Hu, S. Yang and Z. Li, Influence of curing regimes on mechanical properties of magnesium oxychloride cement-based composites, Constr. Build. Mater., 2016, 102, 613–619 CrossRef CAS.
- C. A. Sorrell and C. R. Armstrong, Reactions and Equilibria in Magnesium Oxychloride Cements, J. Am. Ceram. Soc., 1976, 59(1–2), 51–54 CrossRef CAS.
- M. Xu, Y. Bu, J. Du, L. Zhao, A. Zhou and Y. Zhang, et al., Magnesium oxychloride cement with hydrophobic pore network for utilizing as oil well cement, Constr. Build. Mater., 2023, 409, 133745 CrossRef CAS.
- P. He, C. S. Poon and D. C. W. Tsang, Using incinerated sewage sludge ash to improve the water resistance of magnesium oxychloride cement (MOC), Constr. Build. Mater., 2017, 147, 519–524 CrossRef CAS.
- S. Tang, Y. Hu, W. Ren, P. Yu, Q. Huang and X. Qi, et al., Modeling on the hydration and leaching of eco-friendly magnesium oxychloride cement paste at the micro-scale, Constr. Build. Mater., 2019, 204, 684–690 CrossRef CAS.
- H. Yu, The microstructure and properties of magnesium oxychloride cement admixture, New Build. Mater., 1995, 4, 38–41 Search PubMed.
- Y. Li, H. Yu, J. Dong, J. Wen and Y. Tan, Research development on hydration product, phase transformation and water resistance evaluation method of magnesium oxychloride cement, J. Chin. Ceram. Soc., 2013, 41(11), 1465–1473 CAS.
- D. Deng, The mechanism for soluble phosphates to improve the water resistance of magnesium oxychloride cement, Cem. Concr. Res., 2003, 33(9), 1311–1317 CrossRef CAS.
- X. Chen, T. Zhang, W. Bi and C. R. Cheeseman, Effect of tartaric acid and phosphoric acid on the water resistance of magnesium oxychloride (MOC) cement, Constr. Build. Mater., 2019, 213, 528–536 CrossRef CAS.
- Y. Li, Z. Li, H. Pei and H. Yu, The influence of FeSO4 and KH2PO4 on the performance of magnesium oxychloride cement, Constr. Build. Mater., 2016, 102, 233–238 CrossRef CAS.
- Y. Tan, Y. Liu and L. Grover, Effect of phosphoric acid on the properties of magnesium oxychloride cement as a biomaterial, Cem. Concr. Res., 2014, 56, 69–74 CrossRef CAS.
- The Effect of Aluminate Minerals on Magnesium Oxychloride Cement, ed. C. Zhang, D. Deng, Chinese Science Abstracts Series B, 1995 Search PubMed.
- H. Qing, L. Ying, W. Jing, Z. Weixin, C. Chenggong and D. Jinmei, et al., Effect of ethyl silicate on the water resistance of magnesium oxychloride cement, Ceram.-Silik., 2020, 64, 75–83 CAS.
- W. Shuiping, W. Rui, Z. Yingdan, L. Xuemei and X. Yang, Effects of EVA latex on the properties of glass-fiber/magnesium-oxychloride cement composites, J. Wuhan Univ. Technol., Mater. Sci. Ed., 2006, 21(1), 138–142 CrossRef.
- A.-M. Lauermannová, O. Jankovský, A. Jiříčková, D. Sedmidubský, M. Záleská and A. Pivák, et al., MOC Composites for Construction: Improvement in Water Resistance by Addition of Nanodopants and Polyphenol, Polymers, 2023,(21), 15 Search PubMed.
- X. Sun, Q. Ye, W. Zhou, Y. Han, S. Gong and W. Zhou, et al., Tannin-modified magnesium oxychloride cement with high-strength and reinforced water-resistance, J. Cleaner Prod., 2022, 374, 133543 CrossRef CAS.
- Z. J. Zhang, H. K. Li and P. A. Liu, Study on phenolic resin modified magnesium oxychloride cement, Adv. Mater. Res., 2012, 399, 1358–1362 Search PubMed.
- M. S. El-Feky, A. Mohsen, A. Maher El-Tair and M. Kohail, Microstructural investigation for micro - nano-silica engineered magnesium oxychloride cement, Constr. Build. Mater., 2022, 342, 127976 CrossRef CAS.
- Q. Huang, J. Wen, Y. Li, W. Zheng, C. Chang and J. Dong, et al., The effect of silica fume on the durability of magnesium oxychloride cement, Ceram.-Silik., 2019, 63(3), 338–346 CAS.
- O. Jankovský, A.-M. Lauermannová, F. Antončík, M. Záleská, M. Pavlíková and A. Pivák, et al., Case study on nanoscale modification of MOC-based construction composites: Introduction of molybdenum disulfide, Case Stud. Constr. Mater., 2023, 19, e02495 Search PubMed.
- Effect of carbon nanotubes (CNTs) on the physicomechanical properties of magnesium oxychloride cement pastes. ed. Kandeel A., Etman M., Sharara A., Sufe W., Shebl S., Proceedings of the International Conference On Nano-Technology for Green and Sustainable Construction, Cairo, Egypt, 2010 Search PubMed.
- Y. Karimi and A. Monshi, Effect of magnesium chloride concentrations on the properties of magnesium oxychloride cement for nano SiC composite purposes, Ceram. Int., 2011, 37(7), 2405–2410 CrossRef CAS.
- A.-M. Lauermannová, A. Jiříčková, D. Sedmidubský, M. Pavlíková, M. Záleská and A. Pivák, et al., Graphene- and MWCNT-reinforced magnesium oxychloride composite modified by tannic acid, FlatChem, 2023, 37, 100459 CrossRef.
- J. Wen, W. Zheng, C. Chang, P. Liu, Y. Li and X. Xiao, et al., The effect of nano-silica on the properties of magnesium oxychloride cement, Adv. Cem. Res., 2021, 33(9), 413–422 CrossRef.
- A.-M. Lauermannova, M. Lojka, M. Pavlíková, A. Pivák, M. Záleská and Z. Pavlík, et al., Grapene- and graphite oxide-reinforced magnesium oxychloride cement composites for the construction use, Ceram.-Silik., 2021, 65(1), 38–47 CAS.
- T. Horiuchi, T. Sugiyama and T. Mori, Factors for maintenance of a high surface area of silica-coated α-alumina after heating >1573 K, J. Mater. Chem., 1993, 3(8), 861–865 RSC.
- J. G. Li and X. Sun, Synthesis and sintering behavior of a nanocrystalline α-alumina powder, Acta Mater., 2000, 48(12), 3103–3112 CrossRef CAS.
- H. Ma, A. Krell and F. Buse, Nano-corundum – Synthesis and Use as Filtration Membranes, Catalyst Carriers, Wear Resistant Coatings and Sensors, Chem. Eng. Technol., 2001, 24(10), 1005–1009 CrossRef CAS.
- Y. C. Sharma, V. Srivastava and A. K. Synthesis Mukherjee, and Application of Nano-Al2O3 Powder for the Reclamation of Hexavalent Chromium from Aqueous Solutions, J. Chem. Eng. Data, 2010, 55(7), 2390–2398 CrossRef CAS.
- M. Heikal, M. Ismail and N. Ibrahim, Physico-mechanical, microstructure characteristics and fire resistance of cement pastes containing Al2O3 nano-particles, Constr. Build. Mater., 2015, 91, 232–242 CrossRef.
- A. M. Humad, A. J. Dakhil, S. A. Al-Mashhadi, Z. Al-Khafaji, Z. A. Mohammed and S. F. Jabr, Improvements of mechanical and physical features of cement mortar by nano Al2O3 and CaCO3 as additives, Res. Eng. Struct. Mater., 2023, 857–871 Search PubMed.
- S. Barbhuiya, S. Mukherjee and H. Nikraz, Effects of nano-Al2O3 on early-age microstructural properties of cement paste, Constr. Build. Mater., 2014, 52, 189–193 CrossRef.
- A. Nazari, S. Riahi, S. Riahi, S. F. Shamekhi and A. Khademno, Influence of Al2O3 nanoparticles on the compressive strength and workability of blended concrete, J. Am. Sci., 2010, 6(5), 6–9 Search PubMed.
- N. Farzadnia, A. A. A. Ali and R. Demirboga, Characterization of high strength mortars with nano alumina at elevated temperatures, Cem. Concr. Res., 2013, 54, 43–54 CrossRef CAS.
- H. Feng, P. Zhu, A. Guo, Z. Cheng, X. Zhao and D. Gao, Assessment of the mechanical properties and water stability of nano-Al2O3 modified high ductility magnesium potassium phosphate cement-based composites, Mater. Today Commun., 2022, 30, 103179 CrossRef CAS.
- A. Jiříčková, A.-M. Lauermannová, O. Jankovský, M. Lojka, M. Záleská and A. Pivák, et al., Impact of nano-dopants on the mechanical and physical properties of magnesium oxychloride cement composites–Experimental assessment, J. Build. Eng., 2024, 108981 CrossRef.
- O. Jankovský, M. Lojka, A.-M. Lauermannová, F. Antončík, M. Pavlíková and M. Záleská, et al., Towards novel building materials: High-strength nanocomposites based on graphene, graphite oxide and magnesium oxychloride, Appl. Mater. Today, 2020, 20, 100766 CrossRef.
- M. Pavlíková, A. Kapicová, M. Záleská, A. Pivák, O. Jankovský and A.-M. Lauermannová, et al., Ultra-high strength multicomponent composites based on reactive magnesia: Tailoring of material properties by addition of 1D and 2D carbon nanoadditives, J. Build. Eng., 2022, 50, 104122 CrossRef.
- K. Li, Y. Wang, X. Zhang, X. Wang and A. Zhang, Raw material ratio optimisation of magnesium oxychloride cement using response surface method, Constr. Build. Mater., 2021, 272, 121648 CrossRef CAS.
- F. Salari, P. Bosetti and V. M. Sglavo, Binder Jetting 3D Printing of Magnesium Oxychloride Cement-Based Materials: Parametric Analysis of Manufacturing Factors, J. Manuf. Mater. Process., 2022, 6(4), 86 CAS.
- X. Sun, W. Zhou, Q. Ye, A. Zhang, S. Gong and J. Li, A green magnesium oxychloride cement based adhesive synergistically reinforced by citric acid and polyvinyl alcohol fibers for wood, Constr. Build. Mater., 2024, 426, 136041 CrossRef CAS.
- Z. Wang, Z. Yi, L. W. Wong, X. Tang, H. Wang and H. Wang, et al., Oxygen Doping Cooperated with Co-N-Fe Dual-Catalytic Sites: Synergistic Mechanism for Catalytic Water Purification within Nanoconfined Membrane, Adv. Mater., 2024, 36(30), 2404278 CrossRef CAS PubMed.
- F. Ahmad, S. Rawat, R. Yang, L. Zhang, Y. Guo and D. J. Fanna, et al., Effect of hybrid fibres on mechanical behaviour of magnesium oxychloride cement-based composites, Constr. Build. Mater., 2024, 424, 135937 CrossRef CAS.
- K. Li, A. Zhang, Q. Wang, B. Wu, R. Liu and Y. Wang, et al., Study on the mechanical characteristics of magnesium oxychloride cement composites reinforced with polyformaldehyde fibers, Constr. Build. Mater., 2023, 409, 134048 CrossRef CAS.
- P. K. Mehta and P. J. M. Monteiro, Concrete: Microstructure, Properties, and Materials, McGraw-Hill Education, New York, 4th edn, 2014 Search PubMed.
- V. Revilla-Cuesta, F. Faleschini, C. Pellegrino, M. Skaf and V. Ortega-López, Water transport and porosity trends of concrete containing integral additions of raw-crushed wind-turbine blade, Dev. Built Environ., 2024, 17, 100374 CrossRef.
- O. Jankovský, A. Jiříčková, M. Záleská, M. Pavlíková, Z. Pavlík and A. Pivák, et al., Utilization of carbon-bonded magnesia refractory waste in MOC-based composites: Towards CO2-neutral building materials, Open Ceram., 2024, 18, 100592 CrossRef.
| This journal is © The Royal Society of Chemistry 2025 |

