
 Open Access Article
 This Open Access Article is licensed under a Creative Commons Attribution-Non Commercial 3.0 Unported Licence
Photoluminescence characteristics and optical temperature sensing of orange-red emitting oxyapatite phosphor Ca3La7(SiO4)5(PO4)O2:Sm3+
Abir Douziab,
Sami Slimi ac,
Eduard Madirovd,
Masood Ghotbia,
Andrey Turshatovd,
Rosa Maria Soléa,
Magdalena Aguilóa,
Francesc Díaza,
Ezzedine Ben Salemb,
Bryce S. Richardsd and
Xavier Mateos†
*a
ac,
Eduard Madirovd,
Masood Ghotbia,
Andrey Turshatovd,
Rosa Maria Soléa,
Magdalena Aguilóa,
Francesc Díaza,
Ezzedine Ben Salemb,
Bryce S. Richardsd and
Xavier Mateos†
*a
aUniversitat Rovira i Virgili (URV), Física i Cristal lografia de Materials (FiCMA), Marcel li Domingo 1, Tarragona, 43007, Spain. E-mail: xavier.mateos@urv.cat
bI.P.E.I. of Monastir, Research Laboratory: Physico-chemistry of Innovative Materials LR24ES16, University of Monastir 5019, UR17ES31, Tunisia
cEurecat, Centre Tecnològic de Catalunya, C. Marcel lí Domingo 2, Tarragona, 43007, Spain
dInstitute of Microstructure Technology, Karlsruhe Institute of Technology, Hermann-von-Helmholtz-Platz 1, 76344 Eggenstein-Leopoldshafen, Germany
First published on 30th April 2025
Abstract
In this study, we successfully synthesized a series of oxyapatite phosphors, Ca3La7(SiO4)5(PO4)O2 doped with Sm3+ ions, using a high-temperature solid-state reaction method. The synthesis process involved varying the concentrations of Sm3+ dopants to investigate their impact on the phosphors' structural and luminescent properties. The phase purity of the synthesized material was evaluated using X-ray diffraction (XRD) analysis, which confirmed a hexagonal crystal structure. Additionally, the XRD results validated the high phase purity of the prepared oxyapatite phosphors and demonstrated the successful incorporation of Sm3+ ions into two separate crystallographic sites within the lattice. Raman scattering spectra revealed distinct vibrational modes corresponding to the stretching and bending vibrations of the PO4 and SiO4 groups in the structure of the synthesized material. In addition, scanning electron microscopy (SEM) illustrated the morphology of the sample. The photoluminescence excitation and emission spectra of Ca3La7(SiO4)5(PO4)O2:Sm3+ phosphors were investigated. Upon excitation with near-ultraviolet (near-UV) light, the phosphors exhibited four distinct emission peaks at wavelengths of 565 nm, 598 nm, 648 nm, and 708 nm. Ca3La7(SiO4)5(PO4)O2:Sm3+ phosphors exhibit strong orange-red emission centered at 598 nm, attributed to multipole–multipole interactions, and demonstrate rapid decay rates, making them promising candidates for temperature sensing and supplementary solid-state lighting applications. The CIE chromaticity coordinates of phosphors with varying Sm3+ concentrations consistently fall within the orange-red region, confirming their characteristic light emission. Consequently, the synthesized Ca3La7(SiO4)5(PO4)O2:Sm3+ phosphor shows significant potential for use in white light-emitting diodes (WLEDs). The relative sensitivity of the Ca3La7(SiO4)5(PO4)O2:6 at% Sm3+ was measured to be approximately 0.212% K−1 at 293 K, underscoring their potential for temperature sensing applications. This sensitivity is distinct from thermal quenching, which is critical for LED performance. Collectively, these findings demonstrate the suitability of the novel synthesized oxyapatites for applications in solid-state lighting and optical thermometry.
1. Introduction
Temperature has consistently stood out as a widely employed physical measure in both contemporary daily life and scientific investigations, underscoring the crucial need for its precise measurement.1–4 Precise temperature monitoring plays a crucial role in process control within industrial production and scientific research, particularly in the fields of biomedicine and optoelectronics. High relative thermal sensitivity (Sr) has become a crucial indicator in the advancement of luminescent thermometers related to these fields.5,6 Fluorescence thermometry is a non-contact and non-invasive measurement technique characterized by high spatial resolution, rapid response, and temperature sensitivity.7 In addition, it is insensitive to fluctuations in the surrounding electromagnetic field and is therefore attracting growing interest in the field of temperature detection.8 In particular, fluorescence intensity ratio (FIR) technology has been widely adopted for tasks such as microbiological cell detection, high-temperature measurement, and monitoring in manufacturing.4,9,10 To further advance research in high-temperature sensing, the development of materials with exceptional FIR performance is essential. The ability to monitor discernible signals and high temperature sensitivity are all crucial criteria for assessing the excellence of FIR materials.11,12In addition to fluorescence thermometry, white light emitting diodes (WLEDs) have attracted considerable research attention. Today, WLEDs are commercially available, thanks to advancements in high performance, eco-friendliness, long lifespan, and other benefits.13 However, these WLEDs still struggle to achieve an optimal color rendering index, primarily due to the absence of a red component in their overall composition. To address this issue, europium-based red phosphors have been widely studied due to their superior red light emission properties.14,15 However, the search for alternative red-emitting ions to replace Eu3+ is still increasing due to the need for materials with enhanced performance and broader applicability. Samarium ions (Sm3+) have been identified as promising candidates, as they exhibited a narrow red-orange emission under near-UV excitation, making them suitable for solid-state lighting applications.16–18
In free Sm3+ ions, 4f–4f electric dipole transitions are strictly forbidden due to parity and symmetry selection rules. However, when Sm3+ ions are embedded in a crystalline host, the local crystal field disrupts the centrosymmetric environment around the ion, mixing electronic states of opposite parity. This phenomenon, known as forced electric dipole transitions, makes these transitions partially allowed.19 As a result, the excitation peaks of Sm3+-based phosphors align closely with the emission wavelengths of near-UV LED-InGaN chips, enabling effective excitation. This compatibility makes it straightforward to fabricate and integrate Sm3+-based phosphors with commercially available LED chips. The Sm3+ ion stands out as a favorable option due to its several promising emitting channels in the orange-red spectrum, notably the transitions at 4G5/2 → 6H7/2 and 4G5/2 → 6H9/2. Consequently, Sm3+ has been extensively studied for its potential in the development of phosphors that emit orange-red light.20–22 In addition, Sm3+ ions are well-suited for optical temperature sensing due to their rich set of low-lying excited energy levels. The lower energy states, specifically the 6HJ levels (J = 7/2, 9/2, 11/2, and 13/2), are thermally coupled with the ground state 6H5/2.23 The population distribution among these thermally accessible levels is highly temperature-dependent and follows the Boltzmann distribution,24 making them ideal for FIR-based thermometry. One of the notable advantages of Sm3+ ions is their excellent thermal stability when embedded in an appropriate host lattice. In such hosts, Sm3+ can maintain a relatively stable luminescence output even under extended thermal exposure, which is crucial for reliable temperature sensing applications. However, it's important to note that the emission efficiency of Sm3+-doped phosphors is still subject to thermal quenching at elevated temperatures. This sensitivity to temperature underscores the importance of choosing a suitable host material that can minimize non-radiative losses and ensure optimal luminescent performance across a wide temperature range.
Among these host materials, oxyapatite phosphors are attracting the interest of researchers due to their considerable advantages in solid-state lighting and optical thermometry, thanks to their high luminescence efficiency, low phonon energy (around 960 cm−1), thermal stability with high melting point (typically in the range of 1550–1650 °C), and tunable optical properties.25 The compound with an oxyapatite structure, represented by the general formula M10(XO4)6O2,26 offers key advantages such as excellent chemical stability and low symmetry, making it a promising candidate for use as the host material in rare earth ion-doped phosphors. The oxyapatite apatite structure is characterized by its compositional flexibility where the metal cation site (M) can accommodate a wide range of elements with different valence states, including monovalent ions such as Na+ and K+, divalent ions such as Ca2+, Sr2+, and Ba2+, and trivalent ions such as rare earth elements (e.g., La3+, Gd3+, Y3+) and Bi3+. Similarly, the X site in the crystal framework can be occupied by various high-valence cations such as P3+, Si4+, or Ge4+.27 This feature allowing it to easily form solid solutions and incorporate a variety of substituent rare earth ions. Previously, many of oxyapatite phosphors such as Ca8La2(PO4)6O2,28 Mn2Gd8(SiO4)6O2,29 Sr2Y8(SiO4)6O2,30 LiGd9(SiO4)6O2,31 Sr2Gd8(SiO4)6O2,32 Ca3Gd7(PO4)(SiO4)5O233 and others have been widely studied in detail. Detailed studies carried out on these materials have successfully demonstrated their potential as excellent luminescent hosts for diverse optical applications, including solid-state lighting, display technologies and optical thermometry. As a result, ongoing research continues to explore new oxyapatite compositions and dopant combinations, further advancing the development of innovative phosphor materials with optimized luminescent performance.
Inspired by the above considerations, herein, a novel series of oxyapatites-type phosphors, Ca3La7(SiO4)5(PO4)O2:Sm3+ was synthesized via a high-temperature solid-state reaction. The crystal structure, morphology, and luminescence characteristics of the Sm3+-doped Ca3La7(SiO4)5(PO4)O2 samples were thoroughly examined. Photoluminescence properties under near-UV excitation were evaluated across various Sm3+ doping concentrations, revealing intense orange-red emission, which positions these phosphors as promising candidates for WLEDs. Furthermore, temperature-dependent photoluminescence studies were conducted to investigate both the optical properties and the material's potential for temperature sensing applications, encouraging further research in this field.
2. Experimental section
2.1. Sample synthesis
A series of Ca3La7−x(SiO4)5(PO4)O2:xSm3+ phosphors (x being from 0 at% to 12 at% in the raw materials mixture) were prepared using the solid-state method in an open atmosphere. The starting materials included CaCO3 (99.99%), La2O3 (99.99%), SiO2 (99.99%), (NH4)2HPO4 (99.99%) and Sm2O3 (99.99%) from Sigma Aldrich, were systematically weighed according to the stoichiometric molar ratio. The materials were then transferred to an agate mortar and ground for several hours. The mixture was then placed in an aluminum crucible and heated to 1173 K for 240 minutes in a muffle furnace. The powder obtained was cooled, finely ground and calcined at 1423 K for 480 minutes in a muffle furnace. Finally, the powder was cooled to room temperature.The production of these phosphors was based on the following chemical reaction:

2.2. Characterization
Structural analysis of the synthesized Ca3La7(SiO4)5(PO4)O2:xSm3+ powders was realized by X-ray diffraction (XRD). Measurements were performed using a Bruker-AXS D8-Advance diffractometer equipped with a vertical q–q goniometer and Cu Kα radiation (1.5406 Å). A position-sensitive detector Lynx-Eye-XE-T with an aperture angle of 2.94° was employed to detect the diffracted X-rays. In the Rietveld refinement process, data were recorded with a step size of 0.02° and a step duration of 2 seconds in the 2θ range from 5° to 80°. Silicon (Si(510)) was chosen as the sampling medium due to its low background. Rietveld refinement calculations were performed using Match3! software. Raman spectra were acquired using a Renishaw InVia confocal Raman microscope, equipped with an edge filter, a 50× objective and an argon ion laser (Ar+) used for excitation (at a wavelength of 514 nm). A JEOL 1011 scanning electron microscopy (SEM) was used to examine the morphology of the powders. To determine their composition, electron dispersive X-ray spectroscopy (EDS) was used, performed with an environmental scanning electron microscope (ESEM, FEI Quanta 600) coupled to an Oxford Inca 3.0 microanalyzer.Photoluminescence (PL) spectra under 404 nm excitation were measured. This 404 nm-blue excitation source was obtained using fundamental femtosecond pulses provided by a Kerr-lens mode-locked (KLM) Ti:sapphire laser which produces tunable pulses across the spectral range of 700–900 nm with up to 2 W of average power and a repetition rate of 76 MHz. The generated fundamental pulses have a pulse duration 0 f–150 fs. The blue laser pulses are achieved using second harmonic generation of the fundamental pulses in a BiB3O6 nonlinear crystal that is specially cut and AR-coated for this purpose. A spectral analyzer (OSA, Ando AQ6315-E) was used for detection. Temperature-dependent photoluminescence assessments were conducted in a temperature range spanning from 293 K to 513 K, facilitated by a custom-made heating device in which very high-resolution thermocouple sensor was used for temperature monitoring. Photoluminescence excitation (PLE) spectra were measured by means of a spectrofluorometer (FS5, Edinburgh Instruments) fitted with an internal xenon lamp for excitation. Measurements of luminescence lifetime were carried out employing a photomultiplier tube (R928P, Hamamatsu) installed in a temperature cooling box (CoolOne, Horiba). The luminescence wavelength was chosen through the use of a dual monochromator (Bentham, DTMS300).
3. Results and discussion
3.1. Phase purity, crystal structure and morphology
XRD measurements were used to confirm the phase purity of the prepared samples. XRD patterns of the host Ca3La7(SiO4)5(PO4)O2 and Ca3La7(SiO4)5(PO4)O2:x at% Sm3+ (2 ≤ x ≤ 12) are shown in Fig. 1(a). These oxyapatites show similar diffractograms and correspond well to pure apatite-type structures crystallizing in the hexagonal system with space group P63/m. It can be noted that all diffraction peaks can be basically indexed to the corresponding standard data for the hexagonal phase of oxyapatite Ca2La8(SiO4)6O2 (CCDC file number 1922998, also available in the ICSD database under file number 140674) (see Fig. 1(b)), with no significant signals from impurities observed, even at Sm3+ concentrations of up to 12 at%. The sample therefore remains single-phase, and the doped ions have not caused any substantial changes in the crystal structure. Crystalline formations of the Ca3La7(SiO4)5(PO4)O2:6 at% Sm3+ were examined using Rietveld refinements and the results are shown in Fig. 2 and Table 1. Additionally, Table 2 provides a summary of the atomic coordinates, site locations, occupancy factors (O.F), and isotropic temperature factors (Biso) determined for Ca3La7(SiO4)5(PO4)O2:6 at% Sm3+ sample. | ||
| Fig. 1 (a) XRD patterns of Ca3La7(SiO4)5(PO4)O2 with different doping concentrations of Sm3+ ions (0–12 at%); (b) standard powder diffraction card of Ca2La8(SiO4)6O2; reference plot was downloaded from CCDC database, file number 1922998 (ICSD 140674). | ||
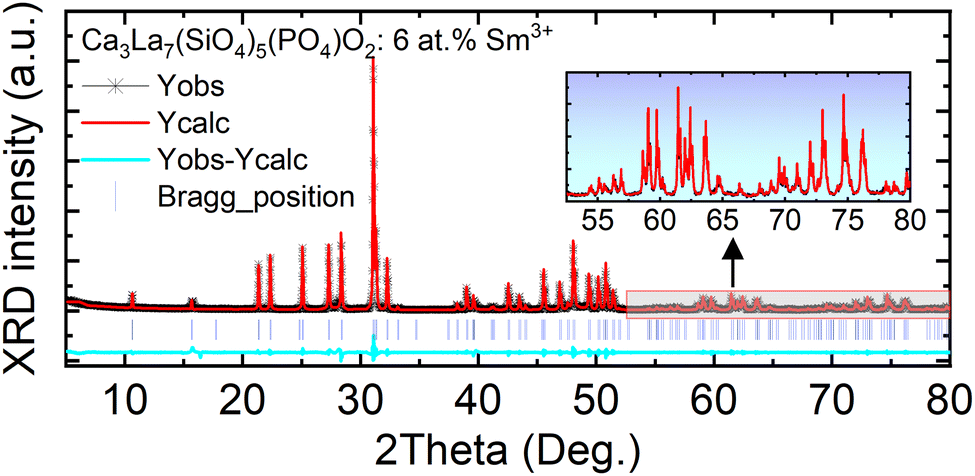 | ||
| Fig. 2 Rietveld refinement plots for Ca3La7(SiO4)5(PO4)O2:6 at% Sm3+: the experimental profile-black line; the calculated pattern-red line; the difference plot-blue line and the Bragg position-blue vertical line; (inset zoomed view in the range between 52 and 80°). | ||
| Parameters | Value |
|---|---|
| Sample | Ca3La7(SiO4)5(PO4)O2:6 at% Sm3+ |
| Crystallographic class | Hexagonal |
| Space group | P63/m |
| Laue group | 6/m |
| Cell formula units (Z) | 1 |
| Space group number (setting number) | 176 (1) |
| Lattice parameters | a = b = 9.614(1) Å c = 7.1047(1) Å |
| Lattice volume | 568.778 Å3 |
| Diffraction radiation type (wavelength) | Cu Kα (1.54188 Å) |
| Measurement temperature | 295 K |
| Software | Match 3 (crystal impact-demo version) |
| Reliability factors | X2 = 5.87 Rwp = 18.10 Rp = 10.80 |
| Atoms | Wyck. | x | y | z | O.F. | Biso |
|---|---|---|---|---|---|---|
| Ca1|La1|Sm1 | 4f | 1/3 | 2/3 | −0.0032(1) | 0.448|0.519|0.033 | 2.002(1) |
| Ca2|La2|Sm2 | 6h | 0.2318(5) | −0.0131(2) | 1/4 | 0.036|0.908|0.056 | 1.963(3) |
| Si|P | 6h | 0.4068(3) | 0.3773(1) | 1/4 | 0.893|0.107 | 1.234(2) |
| O1 | 6h | 0.3221(5) | 0.4929(4) | 1/4 | 1 | 2.423(5) |
| O2 | 6h | 0.5987(1) | 0.4705(8) | 1/4 | 1 | 2.964(1) |
| O3 | 2a | 0 | 0 | 1/4 | 1 | 1.234(2) |
| O4 | 12i | 0.3465(4) | 0.2623(1) | 0.0728(1) | 1 | 1.254(1) |
Based on the data obtained to determine the crystal structure of Ca3La7(SiO4)5(PO4)O2:Sm3+, a perspective view along the a–b crystallographic plane with a double-cell projection along the b axis was generated, as shown in Fig. 3(a). Two distinct categories of cationic sites have been distinguished, called Ca/La(I) and Ca/La(II). The 4f Ca/La(I) site is nine-coordinated with C3 symmetry, and the 6h Ca/La(II) site is seven-coordinated with Cs symmetry.34–36 The cations were linked by isolated PO4/SiO4 tetrahedra. The oxide ion O4 did not belong to any PO4/SiO4 tetrahedra, is known as free oxygen37 and had the ability to form a short, high covalent bond with the 6h site cation.38 Sm3+ dopant ions are likely to replace trivalent La3+ ions in the host matrix, in two types of sites with different point symmetries, C3 (with an oxygen coordination number of IX) and Cs (with an oxygen coordination number of VII), as shown in Fig. 3(b). The ionic radii of the Sm3+ ions are rSm(IX) = 1.123 Å and rSm(VII) = 1.02 Å, which are smaller than those of the La3+ cations making up the host, rLa(IX) = 1.216 Å and rLa(VII) = 1.1 Å.39 This demonstrates the reduction in cell volume caused by the incorporation of Sm3+ ions into the host matrix. The volume of the undoped host is 569.311 Å3,40 whereas the volume of the doped Ca3La7(SiO4)5(PO4)O2:6 at% Sm3+ is reduced to 568.778 Å3.
 | ||
| Fig. 3 Crystal structure of Ca3La7(SiO4)5(PO4)O2:Sm3+: (a) perspective view along the a–b crystallographic plan with double cells projection along b axis; (b) oxygen coordination environment of the two cationic crystallographic sites 4f and 6h. | ||
The average crystallite size of Ca3La7(SiO4)5(PO4)O2:Sm3+ phosphors was calculated using Debye–Scherrer equation:41
 | (1) |
The morphology and size distribution of the synthesized Ca3La7(SiO4)5(PO4)O2:6 at% Sm3+ phosphor were analyzed using scanning electron microscopy (SEM), as shown in Fig. 4(a). The image reveals spherical shaped, agglomerated particles with dimensions in the micrometer range. As illustrated by the size distribution in Fig. 4(b), the particles exhibit a narrow size distribution, centered around ∼0.65 μm. Although some variation in particle size is observed, the overall distribution remains consistent and the particles are morphologically uniform. Elemental analysis of the synthesized sample Ca3La7(SiO4)5(PO4)O2:6 at% Sm3+ was carried out by EDS analysis (Fig. 5(a)). This analysis confirmed the presence of Ca, La, Si, P, O, and Sm elements, supporting the elemental composition of the Ca3La7(SiO4)5(PO4)O2:Sm phosphor. However, phase formation was confirmed through XRD analysis, as discussed earlier. Notably, the concentration of Sm is relatively low, indicating that the prepared Ca3La7(SiO4)5(PO4)O2:6% Sm3+ sample is a single-phase material. The analysis of the element distribution map depicted in Fig. 5(b) suggests an even distribution of all elements across the surface of the studied area.
 | ||
| Fig. 4 (a) SEM image of the Ca3La7(SiO4)5(PO4)O2:6 at% Sm3+ phosphor; (b) the corresponding particle size distribution. | ||
 | ||
| Fig. 5 (a) EDS image and (b) elements mapping analysis of the Ca3La7(SiO4)(PO4)O2:6 at% Sm3+ phosphor. | ||
3.2. Raman spectroscopy
Fig. 6 shows the spectra obtained at room temperature, covering a range from 200 to 1200 cm−1. These spectra have been compared with recognized references for apatitic phases from previous research42 in order to discern the vibrational bands associated with (PO43−) and (SiO44−) groups. The vibrational modes associated with (PO43−) groups were observed only at 959 cm−1, representing symmetrical vibrational modes (υ1). The (SiO44−) groups exhibit characteristic peaks at 857 cm−1 and 399 cm−1, attributed to symmetrical (υ1) and symmetrical (υ2) vibrational modes, respectively. In addition, there are weaker lines at 525 and 287 cm−1, which can be attributed to the antisymmetric (υ4) and symmetrical (υ2) deformation modes, respectively. The maximum phonon energy measured for Ca3La7(SiO4)5(PO4)O2:Sm was absorbed at 959 cm−1. | ||
| Fig. 6 Raman scattering spectra for Ca3La7(PO4)5(SiO4)O2:x at% Sm3+ (x = 2, 6, 8, 10 and 12). | ||
3.3. Luminescence properties of Ca3La7(SiO4)5(PO4)O2:xSm3+ phosphors
The PLE and PL emission spectra of Ca3La7(SiO4)5(PO4)O2:xSm3+ (where x = 2, 6, 8, 10, and 12 at%) phosphors are shown in Fig. 7(a) and (b), respectively. The excitation spectrum displays distinct sharp peaks, which are attributed to the partially allowed f–f forbidden transitions of Sm3+.43,44 Specifically, the excitation peaks observed at 344, 361, 375, 389, 404, 424, 447, 461, 475, and 489 nm correspond to the following electronic transitions: 6H5/2 → 4K17/2, 6H5/2 → 4D3/2, 6H5/2→ 4D1/2, 6H5/2 → 4L15/2, 6H5/2→ 6F7/2, 6H5/2→ 4I15/2, 6H5/2 → 4M19/2, 6H5/2 → 4F5/2, 6H5/2 → 6I13/2, and 6H5/2 → 6I11/2 of Sm3+, respectively. It is clear that the most prominent peak occurs at 404 nm, corresponding to the 6H5/2 → 4F7/2 transition, signifying strong absorption in the near-UV region. This same 404 nm peak is also utilized to monitor the emission spectra in the range of 525 to 750 nm. Additionally, the excitation spectrum closely matches that of GaN-based LED chips in the near-UV range (350–420 nm), suggesting its potential as an effective material for GaN-based LED applications in the near-UV spectrum.43,45 | ||
| Fig. 7 (a) The PL excitation spectra (PLE; λem = 598 nm); (b) photoluminescence (PL; λexc = 404 nm) spectra of Ca3La7(SiO4)5(PO4)O2:xSm3+ (2 ≤ x ≤ 12 at%) phosphors, and inset shows the relationship between PL intensity and Sm3+ concentration; (c) fitting line of log(x) on log(I/x) in Ca3La7(SiO4)5(PO4)O2:xSm3+ phosphors beyond the quenching concentration. | ||
The PL spectra of Ca3La7(SiO4)5(PO4)O2:xSm3+ (x = 2, 6, 8, 10 and 12 at%), synthesized by the solid-state reaction method, are shown in Fig. 7(b) for an excitation wavelength of 404 nm. These spectra exhibit four distinct and intense emission peaks, appearing at around 565 nm, 598 nm, 648 nm and 708 nm, corresponding to the following electronic transitions of Sm3+ ions: 4G5/2 → 6H5/2, 4G5/2 → 6H7/2, 4G5/2 → 6H9/2, and 4G5/2 → 6H11/2, respectively. These transitions are characteristic of Sm3+ and align with previously reported data.46
The most prominent emission band, located at 598 nm, is attributed to the 4G5/2 → 6H7/2 transition of Sm3+ ions. This transition is characteristic of red-orange emission, resulting from a combination of forced magnetic dipole (MD) and electric dipole (ED) transitions.45 Moreover, the 4G5/2 → 6H9/2 transition occurring at 648 nm is associated with an electric dipole (ED) transition. Additionally, the 4G5/2 → 6H5/2 transition results in a band at 565 nm, which is attributed to a magnetic dipole (MD) transition.47 We detect a weak emission around 708 nm, attributed to the 4G5/2 → 6H11/2 transition, which is involved in defining the color index of LED.48
Under the 404 nm excitation wavelength, the emission intensity of Sm3+ ions in Ca3La7(SiO4)5(PO4)O2:xSm3+ phosphors is profoundly influenced by Sm3+ ion concentration (see the inset Fig. 7(b)). Emission intensity increases progressively with Sm3+ concentration, reaching a maximum at x = 6 at%. Consequently, the optimum concentration of Sm3+ ions in the Ca3La7(SiO4)5(PO4)O2 matrix was found to be 6 at%. Above this concentration (x > 6 at%), emission intensity begins to decrease due to a phenomenon known as “concentration quenching”. The phenomenon of concentration quenching occurs because, at higher concentrations of doped ions Sm3+, the distance between these ions decreases. This proximity leads to increased non-radiative energy loss, causing a gradual reduction in luminous intensity.49 The critical distance (Rc) between the doped ions plays a crucial role in characterizing the concentration quenching mechanism. If Rc is equal to or less than 5 Å, the concentration quenching mechanism is attributed to exchange interactions. Conversely, when Rc exceeds 5 Å, it is associated with electrical multipolar interactions. The evaluation of Rc can be accomplished by employing a specific equation to identify the fundamental interaction mechanism.50
 | (2) |
In this context, V represents the volume of the unit cell, Z represents the number of cationic sites available for Sm3+ ions in the unit cell, and xc indicates the atomic fraction of the activator at which quenching occurs. For the Ca3La7(SiO4)5(PO4)O2:6 at% Sm3+, the values are Z = 1, V = 568.778 Å3, and xc is 0.06 for the emission peak at 598 nm. Applying the given formula, the Rc for Sm3+ ions in Ca3La7(SiO4)5(PO4)O2:6 at% Sm3+ was calculated to be 26 Å, which exceeds 5 Å. This result suggests that exchange interactions are not the dominant quenching mechanism in the Sm3+-doped Ca3La7(SiO4)5(PO4)O2.
To gain deeper insight into the energy transfer (ET) mechanism responsible for the luminescence quenching observed in Ca3La7(SiO4)5(PO4)O2:xSm3+ phosphors at higher doping concentrations, Dexter and Schulman's theoretical framework is employed:50
 | (3) |
 | (4) |
As shown in Fig. 7(c), the relationship between the logarithm of (I/x) and the logarithm of x exhibits an almost linear behavior. The slope of the fitted linear trend was found to be −1.30, and the corresponding interaction parameter θ was calculated to be 3.9, a value that is reasonably close to 6. This indicates that nonradiative ET between Sm3+ ions taking place via d–d type interaction for the concentration quenching of Sm3+ ions in Ca3La7(SiO4)5(PO4)O2 phosphors. This mechanism becomes increasingly significant at higher Sm3+ concentrations, where the average distance between activator ions is reduced, thereby facilitating more efficient energy migration through dipole–dipole coupling.
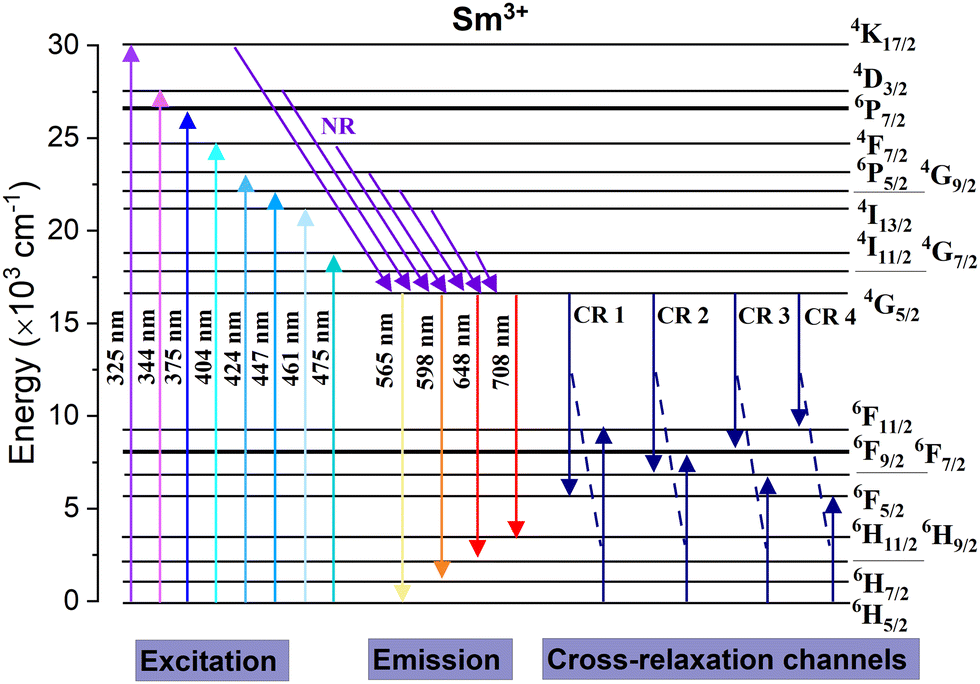
To better understand the luminescence mechanism of Sm3+ ions in the Ca3La7(SiO4)5(PO4)O2 host matrix, Fig. 8 illustrates a simplified energy level diagram of Sm3+, highlighting the key excitation and emission transitions, as well as the possible non-radiative cross-relaxation (CR) pathways involved. As shown in the excitation section of the diagram, when Sm3+ ions absorb photons (excited at 404 nm), electrons are promoted from the ground state (6H5/2) to various higher-lying excited states. However, these excited electrons do not always directly return to the ground state through radiative emission. Instead, they typically undergo a series of non-radiative relaxations (NR), eventually populating the lower 4G5/2 excited state. Once electrons accumulate in the 4G5/2 state, they relax radiatively to several lower-energy states of the Sm3+ ion, particularly to 6H5/2, 6H7/2, 6H9/2, and 6H11/2. These radiative transitions are responsible for the characteristic orange-red emissions observed in the photoluminescence spectra. In addition to the radiative pathways, the diagram also identifies CR channels, which represent non-radiative energy transfer processes between neighboring Sm3+ ions.51 These mechanisms become more prominent at higher doping concentrations and can lead to quenching effects by depleting the population of emitting states. Specifically, cross-relaxation can occur when an excited Sm3+ ion transfers part of its energy to a neighboring ion in the ground state, resulting in both ions settling into intermediate energy levels without photon emission.51 The possible transitions contributing to cross-relaxation in Sm3+-doped Ca3La7(SiO4)5(PO4)O2 are: 4G5/2 → 6F5/2 = 6H5/2 → 6F11/2 (CR1), 4G5/2 → 6F7/2 = 6H5/2 → 6F9/2 (CR2), 4G5/2 → 6F9/2 = 6H5/2 → 6F7/2 (CR3) and 4G5/2 → 6F11/2 = 6H5/2 → 6F5/2 (CR4).
 | ||
| Fig. 8 Energy level scheme showing excitation and emission transitions in Ca3La7(SiO4)5(PO4)O2:Sm3+ phosphors and the possible cross-relaxation channels; NR – non-radiative relaxation; CR – cross-relaxation channel. | ||
The decay curves for Ca3La7(SiO4)5(PO4)O2:xSm3+ doped with varying concentrations of Sm3+ ions (x = 2, 6, 8, 10, and 12 at%) are shown in Fig. 9(a). The data clearly demonstrate that decay times progressively decrease with increasing Sm3+ concentration. For samples with low Sm3+ concentrations, the decay curves are well approximated by a single exponential function. However, at higher Sm3+ concentrations, the decay curves deviate from a single exponential behavior. This deviation is attributed to non-radiative energy transfer processes between Sm3+ ions.52 Under these conditions, the average lifetime of Sm3+ can be calculated using the following equation:
 | (5) |
 | ||
| Fig. 9 (a) Decay curves of Ca3La7(SiO4)5(PO4)O2:xSm3+ (x = 2, 6, 8, 10, and 12 at%) (λexc = 404 nm, λem = 598 nm); (b) plot of the lifetime of Sm3+-doped matrix phosphor Ca3La7(SiO4)5(PO4)O2 as a function of Sm3+ concentration. | ||
3.4. Thermal stability and optical temperature sensing
The temperature-dependent emission response of Ca3La7(SiO4)5(PO4)O2:6 at% Sm3+ phosphors under 404 nm excitation was systematically investigated over the temperature range of 293–513 K (Fig. 10(a)). This study aimed to evaluate the thermal stability of Sm3+ emission and to assess the material's potential for temperature-sensing applications. The emission of the Ca3La7(SiO4)5(PO4)O2:6 at% Sm3+ phosphor remained unchanged in terms of wavelength positions, while the intensity showed a continuous decrease owing to the thermal quenching effect.53 Solid-state lighting systems, such as LEDs, typically operate at around 430 K. At this temperature, the emission intensity of the Ca3La7(SiO4)5(PO4)O2:6 at% Sm3+ phosphor retains 94.2% of its initial intensity at RT. In comparison with reported Sm3+-doped phosphors, the emission intensities recorded around this temperature for Ca3GdAl3B4O15,54 CaLa4Ti4O15,55 CaGd2(MoO4)4,56 and KLa0.97Sr3(PO4)3F57 are 90.8%, 81.6%, 70.9%, and 85.5%, respectively. These results demonstrate that the Ca3La7(SiO4)5(PO4)O2:Sm3+ phosphor exhibits superior thermal stability compared to many other Sm3+-doped hosts. Even at 493 K, the emission intensity shows only a modest decrease, retaining 86.1% of its initial value. To obtain a more comprehensive analysis of Ca3La7(SiO4)5(PO4)O2:Sm3+, the activation energy (Ea) was determined. The intensity of the 598 nm (4G5/2 → 6H7/2) emission peak was analyzed using the Arrhenius relationship:58
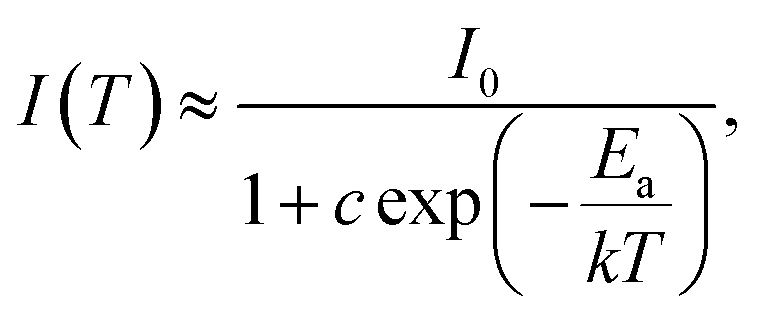 | (6) |
 | (7) |
 | ||
| Fig. 10 (a) Emission spectra as a function of temperature (293–513 K) of Ca3La7(SiO4)5(PO4)O2:6 at% Sm3+ under 404 nm excitation; (b) plot of Ln[(I0/I) − 1] versus activation energy 1/kT for thermal quenching of Ca3La7(SiO4)5(PO4)O2:6 at% Sm3+ for the 598 nm (4G5/2 → 6H7/2) transition; the bar graph shows the evolution of (c) P1 and P2, (d) P2 and P3 for Ca3La7(SiO4)5(PO4)O2 doped with 6% Sm3+ as a function of temperature. | ||
By analyzing the gradient of eqn (7), we can determine the activation energy (Ea). To obtain the value of Ea, a graph is created by correlating ln[(I0/I) −1] with 1/kT, giving a linear relationship with a slope of −Ea. As shown in Fig. 10(b), this plot shows a linear pattern, with a slope of around −0.226. As a result, for the phosphors synthesized in this work, we calculate that Ea has a value in agreement with previous results in phosphors doped with Sm3+ cations such as Ba2SiO4:Sm3+ (0.2707 eV),53 YVO4:Sm3+ (0.17 eV),59 NaKLa(Nb, Ta)O5:Sm3+ (0.22 eV),60 Mg3Y2Ge3O12:Sm3+ (0.20 eV).46
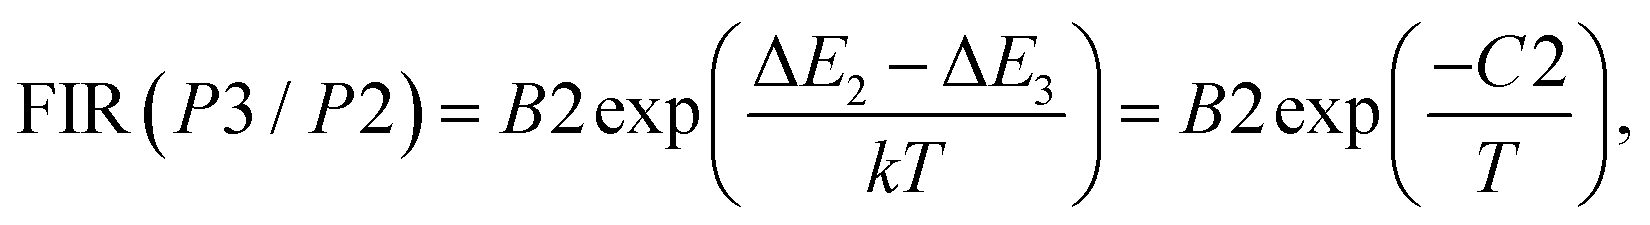
In the temperature range studied (293 K to 513 K), we observed clear differences in the luminescence intensity attributed to temperature changes for the three Sm3+ emission peaks. These emission peaks correspond to the P1 transition (4G5/2 → 6H5/2) and the P2 and P3 transitions, which are Stark sublevels of the 4G5/2 → 6H7/2 transition, as demonstrated in Fig. 10(a). For a more comprehensive analysis of the properties of the synthesized phosphors as a function of temperature, Fig. 10(c) and (d) show the intensities of the P1, P2 and P3 emission peaks. P1 exhibits relatively stable fluorescence intensity with temperature variations, while P2 and P3 display only slight changes. This observation highlights the importance of analyzing the fluorescence intensity ratios (FIRs) for P1/P2 and P3/P2 to better understand the thermometric performance of the material.
Furthermore, literature research has shown that the thermometric luminescence performance of the synthesized phosphors, in this study Ca3La7(SiO4)5(PO4)O2:x at% Sm3+, requires the determination of four specific parameters. These parameters are as follows:61
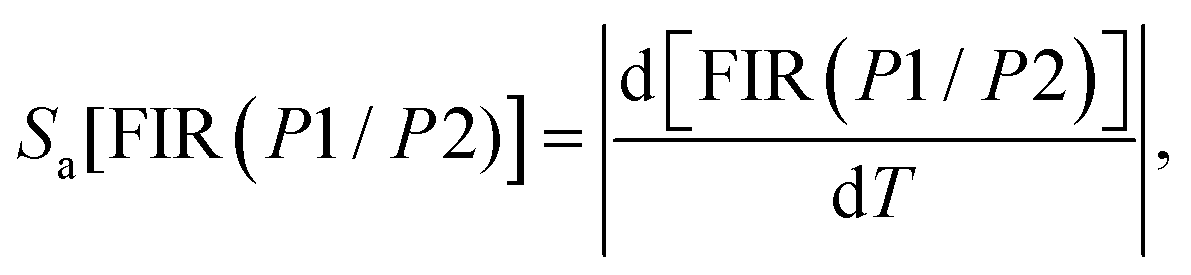
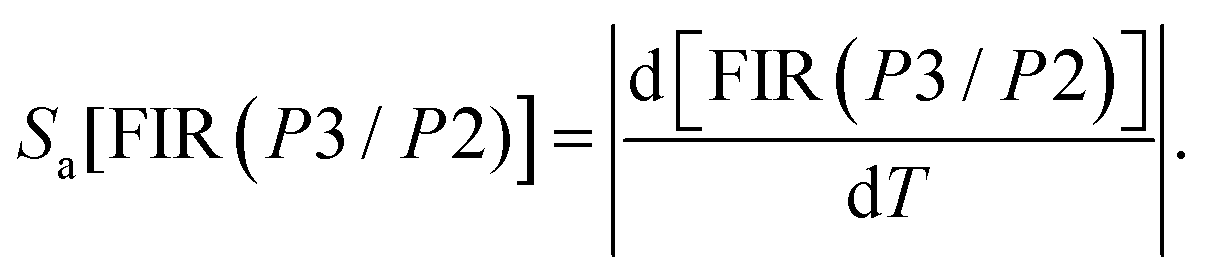
(I) Fluorescence intensity ratio, represented by FIR = P1/P2 and FIR = P3/P2, which serve as thermometric parameters.
(II) Absolute thermal sensitivity (Sa) in Kelvin (K−1).
(III) Relative thermal sensitivity (Sr) in Kelvin for a variation of 100% (K−1 %).
(IV) Temperature uncertainty (δT).
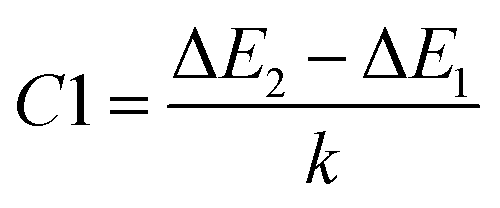
Firstly, the thermometric parameters FIR(P1/P2) and FIR(P3/P2) were determined by calculating the ratios of the fluorescence intensities of the emission peaks centered at the corresponding wavelengths. In a broader context, temperature dependence can be modeled following the approach reported by Brites et al. for lanthanide thermometers.62 This model is based on the fact that the total transition probability of an emission level is the sum of the non-radiative and radiative transition probabilities,63 and by relating the luminescence intensity to the inverse of the total transition probability,64 the temperature dependence of the intensity ratio will be expressed as follows:
 | (8) |
 | (9) |
 | ||
| Fig. 11 (a) FIR(P1/P2) values and fitting curve; (b) FIR values (P3/P2) and fitting curve, (c) Ln(FIR[P1/P2]) as a function of 1/[kT]; (d) Ln(FIR[P3/P2]) as a function of 1/[kT]; (e) Sa and Sr curves of (FIR[P1/P2]); and (f) Sa and Sr curves of (FIR[P3/P2]). | ||
In situations where the exponential term dominates the transition intensities, as observed in this work, and assuming a single dominant non-radiative deactivation channel (1 ≪ αi![[thin space (1/6-em)]](https://www.rsc.org/images/entities/char_2009.gif) exp(−ΔEi/kT)), eqn (8) and (9) simplify to reflect these relationships:
exp(−ΔEi/kT)), eqn (8) and (9) simplify to reflect these relationships:
 | (10) |
 | (11) |
 and
and 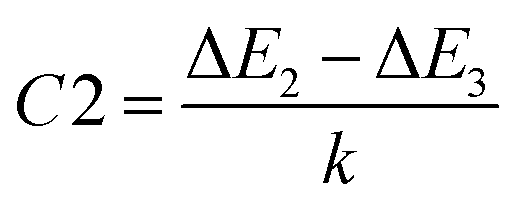 quantify the energy disparity driving the thermal redistribution among these sublevels. In this context, we have used a fitting procedure of eqn (9) and (10) to match the experimental relationship between emission and temperature in the sample examined Ca3La7(SiO4)5(PO4)O2:6 at% Sm3+. We have estimated the values of B1, B2, C1 and C2. They are respectively equal to 0.143, 0.929, 182.240 and 66.073 respectively.
Next, we plot Fig. 11(c) and (d), showing Ln(FIR[P1/P2]) and Ln(FIR[P3/P2]), respectively, as functions of 1/[kT] to determine the activation energy differences (ΔE2 − ΔE1 and ΔE2 − ΔE3) using the linear fitting method. These values, derived from the slopes of the fitted lines, correspond to 126.636 cm−1 and 45.935 cm−1, respectively. This result highlights distinct thermal quenching mechanisms influencing the luminescence behavior, which are essential for achieving reliable and accurate temperature sensing applications. The larger activation energy difference from the FIR(P3/P2) curve enables high sensitivity within specific temperature ranges, while the smaller activation energy difference broadens the overall detection scope. These complementary activation energy differences allow the fluorescence intensity ratio method to achieve both precise and versatile luminescent thermometry. Consequently, Sm3+-doped Ca3La7(SiO4)5(PO4)O2 phosphors prove highly effective for applications requiring both high precision and wide temperature coverage, underscoring their potential in advanced thermal sensing technologies.65
Furthermore, to evaluate the sensitivity of subsequent detection and determine the thermometric efficiency of our materials, it is crucial to calculate two key parameters, Sa and Sr. Based on eqn (10) and (11) for the phosphors Ca3La7(SiO4)5(PO4)O2:6 at% Sm3+, we can determine the absolute thermal sensitivity Sa, which was first established by dos Santos et al. in 1998 and is expressed as follows:66
 | (12) |
 | (13) |
In general, the relative thermal sensitivity Sr is regarded as a reference for evaluating and comparing the efficiency of various thermometers, whatever their type. On the other hand, Sa is not suitable for comparing the performance of different luminescent thermometers, as it depends on factors such as experimental setup, lifetimes, and absorption characteristics.62 Sr means the greatest change in the FIR intensity ratio for each degree of temperature. Sr values for FIR(P1/P2) and FIR(P3/P2) can be determined using the equations provided:67
 | (14) |
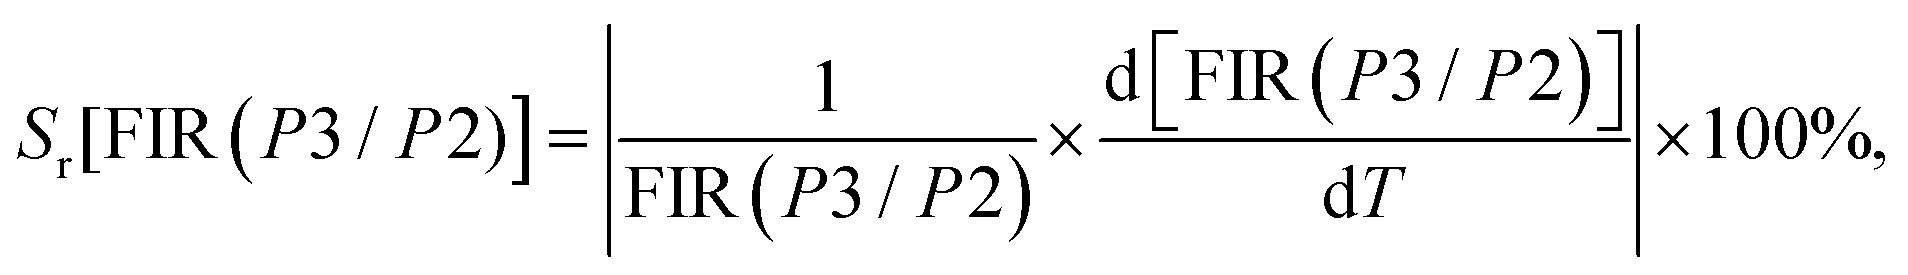 | (15) |
Following eqn (12)–(15), Sa and Sr of Ca3La7(SiO4)5(PO4)O2:6 at% Sm3+ in the temperature range 293–513 K are calculated and presented in Fig. 11(e) and (f) for FIR(P1/P2) and FIR(P3/P2), respectively. Both parameters decrease noticeably with increasing temperature, highlighting the dependence of sensitivity on the thermal environment.
For FIR(P1/P2), the optimum values for Sa and Sr are 1.722 × 10⁻⁴ K−1 and 0.212% K−1 respectively at 293 K. On the other hand, for FIR(P3/P2), the optimum values for Sa and Sr are 5.775 × 10⁻⁴ K−1 and 0.077% K−1 respectively at 293 K. In addition, evaluation of the temperature uncertainty (δT) is a crucial factor in assessing the material's temperature detection, and its value can be calculated using the following equations:68
 | (16) |
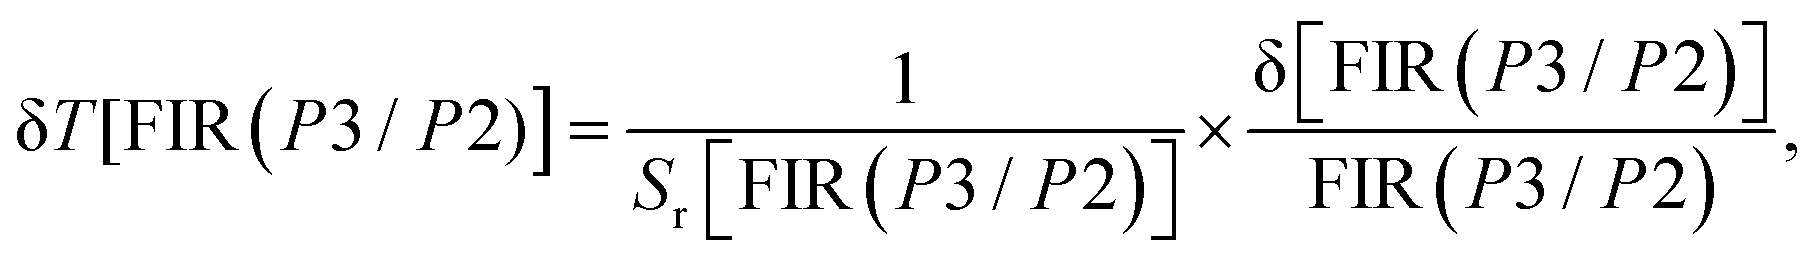 | (17) |
 | ||
| Fig. 12 (a) δT (K) of FIR(P1/P2), (b) FIR(P1/P2) stability of Ca3La7(SiO4)5(PO4)O2:6% Sm3+ for one cycle, (c) δT (K) of FIR(P3/P2), (d) FIR(P3/P2) stability of Ca3La7(SiO4)5(PO4)O2:6% Sm3+ phosphor for one cycle. | ||
Sm3+-doped phosphors are recognized for their susceptibility to thermal degradation. To assess the temperature-dependent repeatability of FIR, a crucial aspect linked to the prolonged utilization of phosphors for temperature sensing, a cyclic heating test of the Ca3La7(SiO4)5(PO4)O2:6% Sm3+ phosphors was conducted between 293 and 513 K, as depicted in Fig. 12(b) and (d). The results from the two cycles indicate promising repeatability of 98%. Compared with previously reported Sm3+-doped phosphors, the optimum Sr value obtained for Ca3La7(SiO4)5(PO4)O2:Sm3+ is relatively modest: for instance, YAG:Sm3+ has shown sensitivity as high as 0.5033% K−1 at 500 K,70 while Ca2LaNbO6:Sm3+ exhibits a comparable value of 0.22% K−1 at 313 K.71 In contrast, other hosts such as LSYW have achieved significantly higher sensitivities, reaching up to 1.58% K−1 at 301 K.72 Such variations in relative sensitivity are influenced significantly by the host matrix composition, the energy levels involved, and the selection of thermally coupled levels. The performance of the present material remains adequate for practical temperature sensing applications, particularly in systems where extremely high sensitivity is not required. The relatively lower sensitivity can be compensated by the advantages offered by the host material, including good thermal stability, reproducibility, and a simple excitation/emission scheme. Therefore, the moderate sensitivity does not represent a significant drawback for integration into temperature sensing platforms, especially in environments where robustness and reliability are more critical than maximum sensitivity.
3.5. Chromaticity coordinates
It is widely recognized that the three fundamental colors perceived by humans are red, blue and green, commonly referred to as 1931 chromaticity coordinates. As a general rule, a color can be represented by a set of International Commission on Illumination (CIE) parameters for any light source. CIE parameters, including chromaticity coordinates (x, y) and CCT (Correlated Color Temperature), were computed to describe the color emission.73Fig. 13(a) presents the CIE chromaticity diagram for Ca3La7(SiO4)5(PO4)O2:Sm3+ phosphors at various Sm3+ doping concentrations under 404 nm excitation. As observed, all the studied phosphors emit in the orange-red spectral region (see a real photograph of the color emitted in Fig. 13(b)), with CIE coordinates approximately constant at (x = 0.60, y = 0.39) across all doping concentrations. Notably, these calculated CIE coordinates match closely with the standard coordinates for orange-red emission. The minimal variation in chromaticity with increasing Sm3+ concentration indicates that Ca3La7(SiO4)5(PO4)O2:Sm3+ phosphors possess excellent color stability, making them promising candidates as orange-red emitting materials for solid-state lighting and semiconductor display applications. Chromaticity coordinates were calculated using Color Calculator software, and CCT was determined using McCamy's empirical formula:74
| CCT = −437n3 + 3601n2 − 6861n + 5514.31, | (18) |
 | ||
| Fig. 13 (a) Chromaticity coordinates of Ca3La7(SiO4)5(PO4)O2:x at% Sm3+ (x = 2, 6, 8, 10 and 12); (b) a photograph of the orange-red Ca3La7(SiO4)5(PO4)O2:6 at% Sm3+ phosphor under blue light illuminant at room temperature; (c) chromaticity coordinates of Ca3La7(SiO4)5(PO4)O2:6 at% Sm3 phosphors (at 293 K and 513 K) in the CIE 1931 chromaticity diagram. | ||
| Sm3+ concentration (at%) | CIE coordinates (x, y) | CCT (K) | Color purity (%) | |
|---|---|---|---|---|
| x | y | |||
| 2 | 0.602 | 0.397 | 1717.49 | 96.20 |
| 6 | 0.604 | 0.396 | 1721.86 | 96.42 |
| 8 | 0.603 | 0.396 | 1720.10 | 95.53 |
| 10 | 0.604 | 0.398 | 1721.79 | 97.66 |
| 12 | 0.603 | 0.396 | 1721.47 | 95.31 |
Furthermore, the CIE coordinates of the Ca3La7(SiO4)5(PO4)O2:6 at% Sm3+ sample underwent only minimal change during heating, rising only slightly from (0.602, 0.397) at 293 K to (0.595, 0.404) at 513 K (Fig. 13(c)). This high thermal stability, combined with excellent color purity, highlights the material's potential for high-performance applications. Color purity, which quantifies emission quality, can be calculated using the formula:75
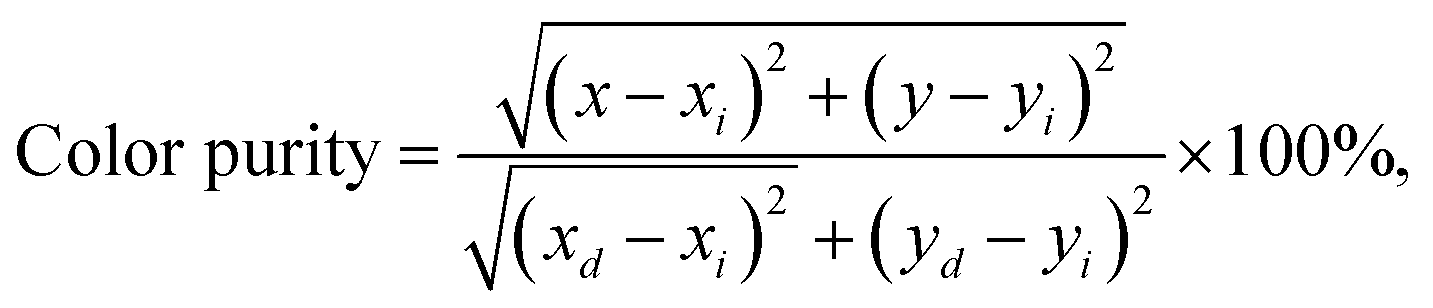 | (19) |
The color purity of the synthesized samples can also be observed in Table 3 for various Sm3+ concentrations. Notably, the color purity exceeds 95% across all doping concentrations, highlighting the phosphors’ excellent orange-red emission quality. The orange-red emission of Sm3+ phosphors complements other spectral components in WLEDs, addressing the red-light deficiency that commonly reduces the CRI in such systems. By contributing to a more balanced spectral distribution, these phosphors improve CRI, ensuring more accurate color reproduction. These findings, combined with stable CCT values around 1700 K, demonstrate the suitability of Ca3La7(SiO4)5(PO4)O2:Sm3+ phosphors for warm-white solid-state lighting applications that demand enhanced CRI alongside high color purity.
4. Conclusions
In summary, a series of Ca3La7(SiO4)5(PO4)O2:Sm3+ were fabricated using a solid-state synthesis method, followed by extensive structural and luminescence evaluations. XRD analysis verified the phase purity of the synthesized materials, identifying a hexagonal crystal structure with the space group P63/m. In addition, Rietveld refinement provided confirmation of the successful incorporation of Sm3+ ions into the crystal lattice. An analysis of the excitation spectra has confirmed that the phosphor material Ca3La7(SiO4)5(PO4)O2 doped with Sm3+ ions can be efficiently activated using near-UV light. The emission spectra of these Ca3La7(SiO4)5(PO4)O2:Sm3+ phosphors display prominent orange-red luminescence. This emission is influenced by multipole–multipole energy transfer mechanisms within the phosphor structure, contributing to its high luminescence intensity. The optimal concentration of Sm3+ in Ca3La7(SiO4)5(PO4)O2 matrix was determined by experimentation to be 6 at% for achieving maximum luminescence efficiency. The exchange interaction between Sm3+–Sm3+ ions being responsible for the concentration quenching that occurs at a critical distance of 26 Å. Furthermore, the phosphor demonstrated excellent color purity, reaching 97.66%, with CIE chromaticity coordinates of (0.604, 0.398) and a low correlated color temperature of approximately 1721 K. The decay time for Sm3+-doped phosphors was approximately 1 ms for samples with 6 at% Sm3+, a moderate response time suitable for various LED applications. Additionally, the relative sensitivity of Ca3La7(SiO4)5(PO4)O2 doped with 6 at% Sm3+ was measured to be around 0.212% K−1 at 293 K, highlighting the remarkable thermal sensitivity of these Sm3+-doped samples. In short, this work presents innovative Sm3+-doped oxyapatites with promising applications in both solid-state lighting technologies and thermal sensors.Data availability
The datasets generated and analyzed during this study are not publicly available to ensure compliance with institutional policies and potential confidentiality agreements. However, they can be made available upon reasonable request. Researchers interested in accessing the data should contact the corresponding author, Dr Xavier Mateos, at xavier.mateos@urv.cat. Requests should include a brief description of the intended use of the data and any relevant research context.Conflicts of interest
There are no conflicts of interest to declare.Acknowledgements
Grant PID2022-141499OB-100 of the Spanish Government funded by MICIU/AEI/10.13039/501100011033/ and by FEDER/UE. This research article has been possible with the support of the Secretaria d′Universitats i Recerca del Departament d′Empresa i Coneixement de la Generalitat de Catalunya, the European Union (UE) and the European Social Fund (ESF) (2024 FI-1 00193). The financial support provided by the Helmholtz Association is gratefully acknowledged: (i) a Recruitment Initiative Fellowship for B. S. R.; (ii) the funding of chemical synthesis equipment from the Helmholtz Materials Energy Foundry (HEMF); and (iii) Research Field Energy – Program Materials and Technologies for the Energy Transition – Topic 1 Photovoltaics (38.01.02). KIT is also grateful to financial support from the Helmholtz Association – Materials and Technologies for the Energy Transition (MTET) – Topic 1 Photovoltaics (38.01.05).References
- L. Michalski, K. Eckersdorf, J. Kucharski and J. McGhee, Temperature measurement, John Wiley & Sons, 2001, pp. 1–18 Search PubMed.
- B. A. Kuzubasoglu and S. K. Bahadir, Sens. Actuators, A, 2020, 315, 112282 CrossRef.
- Q. Li, W. Li, W. Chu, Y. Cao, W. Zhang, H. Ma, Z. Jin and Y. Dai, Chin. Opt. Lett., 2019, 17, 81402 CrossRef.
- X. D. Wang, O. S. Wolfbeis and R. J. Meier, Chem. Soc. Rev., 2013, 42, 7834–7869 RSC.
- C. D. S. Brites, S. Balabhadra and L. D. Carlos, Adv. Opt. Mater., 2019, 7, 1801239 CrossRef.
- Y. Zhou, Photoluminescent Lanthanide-based Materials for Probing Temperature and Pressure for Further Tribological Applications. Chemical Sciences, Université Claude Bernard - Lyon 1, 2023.
- F. Vetrone, R. Naccache, A. Zamarrón, A. J. de la Fuente, F. Sanz-Rodrıguez, L. M. Maestro, E. M. Rodriguez, D. Jaque, J. G. Solé and J. A. Capobianco, ACS Nano, 2010, 4, 3254 CrossRef CAS PubMed.
- C. D. S. Brites, K. Fiaczyk, J. F. C. B. Ramalho, M. Sójka, L. D. Carlos and E. Zych, Adv. Opt. Mater., 2018, 6, 1701318 CrossRef.
- R. G. Geitenbeek, A.-E. Nieuwelink, T. S. Jacobs, B. B. V. Salzmann, J. Goetze, A. Meijerink and B. M. Weckhuysen, ACS Catal., 2018, 8, 2397–2401 CrossRef CAS PubMed.
- J. Zhong, D. Chen, Y. Peng, Y. Lu, X. Chen, X. Li, Z. Ji, X. Wang, O. S. Wolfbeis and R. J. Meier, J. Alloys Compd., 2018, 763, 34–48 CrossRef CAS.
- B. Zhou, C. Q. E, Y. Y. Bu, L. Meng, X. H. Yan and X. F. Wang, Luminescence, 2017, 32, 195–200 CrossRef CAS PubMed.
- S. Stojadinović and A. Ćirić, J. Lumin., 2020, 226, 117403 CrossRef.
- P. Haritha, I. R. Martín, C. S. D. Viswanath, N. Vijaya, K. V. Krishnaiah, C. K. Jayasankar, D. Haranath, V. Lavín and V. Venkatramu, Opt. Mater., 2017, 70, 16–24 CrossRef CAS.
- P. Halappa, B. Devakumar and C. Shivakumara, New J. Chem., 2019, 43, 63–71 RSC.
- P. Halappa, A. Mathur, M.-H. Delville and C. Shivakumara, J. Alloys Compd., 2018, 740, 1086–1098 CrossRef CAS.
- A. Mathur, P. Halappa and C. Shivakumara, J. Mater. Sci.: Mater. Electron., 2018, 29, 19951–19964 CrossRef CAS.
- X. Shi, Y. Liu, J. Zhang, K. Zhang, P. Li, H. Zuo and J. Li, Ceram. Int., 2015, 41, 3162–3168 CrossRef CAS.
- R. Yu, H. M. Noh, B. K. Moon, B. C. Choi, J. H. Jeong, H. S. Lee, K. Jang and S. S. Yi, J. Lumin., 2014, 145, 717–722 CrossRef CAS.
- J.-C. G. Bünzli and S. V. Eliseeva, Chem. Sci., 2013, 4, 1939–1949 RSC.
- X. Zhao, Y. Wang, Z. Pan, Y. Lu, J. Li and M. Wu, Dalton Trans., 2023, 52, 4808–4818 RSC.
- M. K. Pradhan and S. Dash, J. Rare Earths, 2022, 40, 1837–1848 CrossRef CAS.
- Z. Han, X. Wang, B. Fu, H. Yan and J. Liao, J. Lumin., 2022, 252, 119405 CrossRef CAS.
- F. Hu, Y. Jiang, Y. Chen, R. Wei, H. Guo and C. Duan, J. Alloys Compd., 2021, 867, 159160 CrossRef CAS.
- J. Y. Chen, J. Q. Chen, L. J. Li, W. N. Zhang, L. P. Chen and H. Guo, Mater. Today Chem., 2023, 29, 101409 CrossRef CAS.
- H. Liu, L. Liao, X. Pan, K. Su, P. Shuai, Z. Yan, Q. Guo and L. Mei, Open Ceram., 2022, 10, 100251 CrossRef.
- S. Slimi, P. Loiko, K. Bogdanov, A. Volokitina, R. M. Solé, M. Aguiló, F. Díaz, E. Ben Salem and X. Mateos, J. Alloys Compd., 2022, 896, 163109 CrossRef CAS.
- S. Slimi, P. Loiko, A. Volokitina, K. Bogdanov, R. M. Solé, M. Aguiló, F. Díaz, E. Ben Salem and X. Mateos, J. Lumin., 2022, 241, 118523 CrossRef CAS.
- G. Zhu, Y. Shi, M. Mikami, Y. Shimomura and Y. Wang, MRS Online Proc. Libr., 2014, 1592, 13–1592 Search PubMed.
- H. Liu, L. Liao, Y. Zhang, T. Zhou, Q. Guo, L. Li and L. Mei, Dyes Pigm., 2017, 140, 87–91 CrossRef CAS.
- K. Li, J. Fan, M. Shang, H. Lian and J. Lin, J. Mater. Chem. C, 2015, 3, 9989–9998 RSC.
- Y. Zhang, J. Bin, L. Mei and Z. Huang, J. Lumin., 2019, 206, 645–648 CrossRef CAS.
- G. M. Rao, G. S. R. Raju, S. K. Hussain, E. Pavitra, P. S. V. S. Rao and J. S. Yu, New J. Chem., 2016, 40, 6214–6227 RSC.
- Y. Zhang, G. Li, D. Geng, M. Shang, C. Peng and J. Lin, Inorg. Chem., 2012, 51, 11655–11664 CrossRef CAS PubMed.
- Y. Xia, J. Chen, Y. G. Liu, M. S. Molokeev, M. Guan, Z. Huang and M. Fang, Dalton Trans., 2016, 45, 1007–1015 RSC.
- J. Cheng, J. Zhang, J. Lu, H. Zhang, S. Maryam, Z. Shen, X. Ni, X. Bian, P. Ma and J. Shi, Opt. Mater. Express, 2018, 8, 1850–1862 CrossRef CAS.
- J. Cheng, J. Zhang, H. Zhang, S. Maryam, X. Bian, Z. Shen, X. Ni and J. Lu, Chin. Opt. Lett., 2017, 15, 121602 CrossRef.
- G. Blasse, J. Solid State Chem., 1975, 14, 181–184 CrossRef CAS.
- N. Lakshminarasimhan and U. V. Varadaraju, J. Solid State Chem., 2004, 177, 3536–3544 CrossRef CAS.
- R. D. Shannon, Acta Crystallogr. Sect. A: Cryst. Phys., Diffraction, Theor. Gen. Crystallogr., 1976, 32, 751–767 CrossRef.
- J. Cheng, J. Zhang, X. Bian, Z. Zhai and J. Shi, Spectrochim. Acta, Part A, 2020, 230, 118057 CrossRef CAS PubMed.
- U. Holzwarth and N. Gibson, Nat. Nanotechnol., 2011, 6, 534 CrossRef CAS PubMed.
- A. Hassine, N. Jaba, G. Panczer and K. Bouzouita, C. R. Chim., 2010, 13, 1460–1467 CrossRef CAS.
- A. S. Priya, S. Ramachandran and H. P. Kumar, J. Mol. Struct., 2024, 1312, 138540 CrossRef CAS.
- X. Zou, L. He, R. Li, Q. Zheng, Y. Liu, C. Xu and D. Lin, J. Mater. Sci.: Mater. Electron., 2017, 28, 2826–2832 CrossRef CAS.
- L. Kong, X. Xiao, J. Yu, D. Mao and G. Lu, J. Mater. Sci., 2017, 52, 6310–6321 CrossRef CAS.
- C. Ji, Z. Huang, X. Tian, H. He, J. Wen and Y. Peng, J. Alloys Compd., 2020, 825, 154176 CrossRef CAS.
- V. Singh, S. Watanabe, T. K. G. Rao, J. F. D. Chubaci and H.-Y. Kwak, J. Non-Cryst. Solids, 2010, 356, 1185–1190 CrossRef CAS.
- S. Devi, M. Dalal, J. Dalal, A. Hooda, A. Khatkar, V. B. Taxak and S. P. Khatkar, Ceram. Int., 2019, 45, 7397–7406 CrossRef CAS.
- X. Liu, P. Xiong, H. Liu, S. Wu, Q. Liu, Y. Fu, Z. Ma, M. Peng and Q. Zhang, J. Mater. Chem. C, 2021, 9, 3455–3461 RSC.
- Z. Xia, H. Liu, X. Li and C. Liu, Dalton Trans., 2013, 42, 16588–16595 RSC.
- M. Malinowski, M. Kaczkan and S. Turczyński, Opt. Mater., 2017, 63, 128–133 CrossRef CAS.
- K. B. Eisenthal and S. Siegel, J. Chem. Phys., 1964, 41, 652–655 CrossRef CAS.
- R. Cao, X. Wang, X. Ouyang, Y. Jiao, Y. Li, H. Wan, W. Li and Z. Luo, J. Lumin., 2020, 224, 117292 CrossRef CAS.
- W. U. Khan, W. U. Khan, Z. Ye, M. Boubeche, T. Shi, D. Khan and Y. Zhang, Ceram. Int., 2022, 48, 5689–5697 CrossRef CAS.
- J. K. Lee, Y. Hua and J. S. Yu, J. Alloys Compd., 2023, 960, 170615 CrossRef CAS.
- L. Zhou, P. Du and J. S. Yu, J. Am. Ceram. Soc., 2019, 102, 5353–5364 CrossRef CAS.
- Q. Guo, C. Zhao, L. Liao, S. Lis, H. Liu, L. Mei and Z. Jiang, J. Am. Ceram. Soc., 2017, 100, 2221–2231 CrossRef CAS.
- K. J. Laidler, J. Chem. Educ., 1984, 61, 494 CrossRef CAS.
- I. E. Kolesnikov, E. V. Golyeva, M. A. Kurochkin, E. Y. Kolesnikov and E. Lähderanta, J. Lumin., 2020, 219, 116946 CrossRef CAS.
- B. Han, B. Liu, Y. Dai and J. Zhang, Mater. Res. Bull., 2020, 121, 110612 CrossRef CAS.
- A. Nexha, J. J. Carvajal, M. C. Pujol, F. Diaz and M. Aguilo, J. Mater. Chem. C, 2020, 8, 180–191 RSC.
- C. D. S. Brites, A. Millán and L. D. Carlos, Handbook on the Physics and Chemistry of Rare Earths, Elsevier, 2016, vol. 49, pp. 339–427 Search PubMed.
- N. F. Mott, Proc. R. Soc. London, Ser. A, 1938, 167, 384–391 Search PubMed.
- M. Duarte, E. Martins, S. L. Baldochi, N. D. Vieira Jr and M. M. F. Vieira, Opt. Commun., 1999, 159, 221–224 CrossRef CAS.
- A. Douzi, S. Slimi, P. Loiko, V. Llamas, J. M. Serres, R. M. Solé, M. Aguiló, F. Díaz, E. Ben Salem and X. Mateos, J. Mater. Sci.: Mater. Electron., 2024, 35, 1–16 CrossRef.
- P. V. Dos Santos, M. T. De Araujo, A. S. Gouveia-Neto, J. A. Medeiros Neto and A. S. B. Sombra, Appl. Phys. Lett., 1998, 73, 578–580 CrossRef CAS.
- G. Xiang, M. Yang, Q. Xia, S. Jiang, Y. Wang, X. Zhou, L. Li, L. Ma, X. Wang and J. Zhang, J. Am. Ceram. Soc., 2021, 104, 5784–5793 CrossRef CAS.
- L. Li, F. Qin, Y. Zhou, Y. Zheng, J. Miao and Z. Zhang, J. Lumin., 2020, 224, 117308 CrossRef CAS.
- K. Saidi, W. Chaabani and M. Dammak, RSC Adv., 2021, 11, 30926–30936 RSC.
- K. Zhu, H. Zhou, J. Qiu, L.-G. Wang and L. Ye, J. Alloys Compd., 2022, 890, 161844 CrossRef CAS.
- A. Zhang, Z. Sun, M. Jia, Z. Fu, B. C. Choi, J. H. Jeong and S. H. Park, J. Alloys Compd., 2021, 889, 161671 CrossRef.
- F. Ayachi, K. Saidi and M. Dammak, Mater. Adv., 2024, 5, 6162–6169 RSC.
- N. Guo, H. You, Y. Song, M. Yang, K. Liu, Y. Zheng, Y. Huang and H. Zhang, J. Mater. Chem., 2010, 20, 9061–9067 RSC.
- C. S. McCamy, Color Res. Appl., 1992, 17, 142–144 CrossRef.
- C.-H. Chiang, H.-H. Su, Y.-C. Fang and S.-Y. Chu, Ceram. Int., 2018, 44, 6278–6284 CrossRef CAS.
Footnote |
| † Serra Húnter Fellow. |
| This journal is © The Royal Society of Chemistry 2025 |