
 Open Access Article
 This Open Access Article is licensed under a Creative Commons Attribution-Non Commercial 3.0 Unported Licence
Highly photoluminescent carbon dots: a multifunctional platform for pH sensing, nano thermometry, and mercury(II) detection
Mouna Fhoulaa,
Ikhlas Kchaoua,
Christian Hernández-Álvarezd,
Mohamed Dammak *a,
Sami Boufib and
Inocencio R. Martínc
*a,
Sami Boufib and
Inocencio R. Martínc
aLaboratoire de Physique Appliquée, Faculté des Sciences de Sfax, Département de Physique, Université de Sfax, Sfax, B.P. 3000, Tunisia. E-mail: madidammak@yahoo.fr; mohamed.dammak@fss.usf.tn
bUniversity of Sfax, LMSE, Faculty of Science, BP 802, 3018 Sfax, Tunisia
cUniversidad de La Laguna, Departamento de Física, MALTA-Consolider Team and IMN. Apdo. Correos 456, E-38206, San Cristóbal de La Laguna, Santa Cruz de Tenerife, Spain
dAdam Mickiewicz University, Faculty of Chemistry, Uniwersytetu Poznańskiego 8, 61-614 Poznań, Poland
First published on 30th May 2025
Abstract
Carbon dots (CDs), a class of heavy-metal-free fluorescent nanomaterials, have attracted significant attention due to their excellent optical properties, chemical stability, low toxicity, and biocompatibility. In this study, highly photoluminescent N-CDs with small sizes and exceptional quantum yields (up to 90%) were successfully synthesized using citric acid and tri-(2-aminoethyl)amine via a hydrothermal method. The synthesized N-CDs exhibit a single emission band at 450 nm under 380 nm excitation and dual emission bands at 460 nm and 581 nm under 258 nm excitation. Notably, their fluorescence emission spectra display strong temperature dependence and pH-responsive behaviour, rendering them highly versatile as nano thermometric devices. Specifically, their emission intensity demonstrates remarkable sensitivity across the temperature range of 298–343 K, enabling precise thermal measurements. Moreover, these N-CDs function effectively as pH sensors, further expanding their utility. Additionally, the fluorescence of the N-CDs is rapidly and selectively enhanced in the presence of Hg2+ ions at room temperature, without requiring any surface modification. This enhancement exhibits a linear relationship within the concentration range of 0–10 μM, with a detection limit as low as 0.46 μM. These findings highlight the multifunctional nature of the synthesized N-CDs, which hold great promise for applications in pH sensing, nano thermometry, and the specific detection of mercury ions.
1. Introduction
Carbon dots (CDs), as a highly promising carbon-based nanomaterial, have gained significant attention due to their exceptional properties, including good biocompatibility, high fluorescence stability, high quantum yield (QY), low toxicity, excellent aqueous dispersibility, eco-friendliness, facile preparation and wide possibilities of functionalization.1–5 Recently, CDs have been widely utilized in diverse applications, including drug delivery, light-emitting diode (LED) materials, bioimaging, optical detection probes, biosensors, and medical imaging.6–16 With sizes typically below 10 nm, CDs can be readily synthesized through various methods, such as electrochemical oxidation, microwave treatment, ultrasonic processing, laser irradiation, strong acid oxidation, solvothermal, and hydrothermal methods, the latter being particularly simple and efficient for producing fluorescent CDs using wide arrays of organic affordable precursors.17–24However, the synthesis of CDs with high fluorescence intensity and tunable emission properties remains a challenging task for researchers in the field of nanomaterials. Notably, the photoluminescence (PL) properties of CDs are highly sensitive to their environment, making them ideal candidates for sensing applications. A broad range of ionic and molecular species can interact with the surface functional groups of CDs, inducing changes in their PL emission. Importantly, the PL properties of CDs are extremely responsive to their surrounding environment, which makes them valuable tools for sensing applications. Various ionic and molecular species can bind to or interact with the surface groups of CDs, causing alterations in their PL emission.25,26 Consequently, CDs have been effectively employed as fluorescent agents in sensing applications for detecting a variety of analytes, such as heavy metal ions, temperature, pH, and mercury ions.27–33 Their tunable optical properties, combined with high quantum yield and sensitivity, enable effective and precise detection in these applications.
Among the various strategies for tuning the properties of carbon dots (CDs), the pH-dependent photoluminescence (PL) behaviour has emerged as a key area of research. To date, numerous studies have reported successful examples of CDs with pH-responsive tuneable properties.32,34–37 The underlying mechanism in these systems typically involves luminescence enhancement or quenching of a single emission peak under varying pH conditions. However, this approach can be influenced by several interfering factors, such as fluctuations in the excitation source, environmental variations, and changes in probe concentration. To address these limitations, researchers have developed CDs with intrinsic pH-sensitive dual-emission characteristics, enabling the creation of label-free ratiometric fluorescence pH nanoprobes.38–40 Moreover, CDs have demonstrated significant potential for detecting heavy metal ions due to their unique photoluminescence properties and high selectivity toward specific metal ions, such as Co2+,41,42 Mg2+,43 Fe3+,28 Pb2+, Cu2+,44 Ag+,45 and Hg2+.33 Among these cations, CDs have shown exceptional performance in the selective detection of mercury(II) (Hg2+), alongside good water dispersibility. Hg(II) is one of the most hazardous heavy metal ions, capable of causing severe health issues even at extremely low concentrations.46 Recently, several fluorescent probes based on CDs have been developed for the selective detection of Hg(II) ions. Notably, the majority of these methods rely on fluorescence quenching (“turn-off”) mechanisms,33,45 while fewer reports focus on fluorescence enhancement (“turn-on”) approaches.47,48 Generally, “turn-on” mechanisms are preferred over “turn-off” mechanisms due to their higher selectivity and reduced likelihood of false positives.49 Consequently, there is considerable interest in developing new detection techniques based on the fluorescence-enhancement mechanism.
Despite recent progress in carbon dot (CD) research, existing systems often suffer from compromised functionality (e.g., single-application focus), moderate quantum yields (<60%), or reliance on surface modifications to achieve selective ion detection. In this study, we address these limitations by synthesizing nitrogen-doped carbon dots (N-CDs) via a simple hydrothermal method using citric acid and tri-(2-aminoethyl)amine (TREN). Unlike previous CD platforms, our N-CDs achieve three key advancements: Unprecedented quantum yield (90%), surpassing most reported CDs; intrinsic dual-emission behavior (450 nm under 380 nm excitation; 460/581 nm under 258 nm excitation) without requiring external dopants; and multifunctionality enabling Hg2+ detection, pH sensing, and temperature-responsive PL behavior within a single system. Remarkably, Hg2+ detection is achieved via a fluorescence-enhancement mechanism at ambient conditions, eliminating the need for surface modification a critical advantage over conventional CDs requiring complex functionalization. Furthermore, the temperature-dependent PL (298–343 K) and pH-responsive behavior demonstrate precision comparable to specialized nanosensors. This work represents the first demonstration of CDs combining such high efficiency, dual-emission versatility, and triple functionality, offering a transformative platform for environmental monitoring and multimodal analytical applications.
2. Experimental
2.1. Materials
Citric acid (CA), tri-(2-aminoethyl)amine (TREN), MnCl2, NiCl2, CdCl2, HgCl2, MgCl2, ZnCl2, CoSO4·H2O, NaNO3, Ca(NO3)2, Ba(NO3)2, Bi(NO3)3, and NaOH were all procured from Sigma-Aldrich. All chemicals were used as received without further purification. Deionized (DI) water was employed for the preparation of all solutions.2.2. Preparation of pure N-CDs
The carbon dots (CDs) were synthesized using the hydrothermal method with citric acid (CA) and tri-(2-aminoethyl)amine (TREN) as precursors (Fig. 1). Initially, 1 g of CA and 0.4 g of TREN were accurately weighed and dissolved in 25 mL of deionized (DI) water in a beaker. The solution was stirred vigorously at room temperature for 30 minutes to ensure complete homogenization. Subsequently, the resulting mixture was transferred to a Teflon-lined stainless-steel autoclave and heated in a furnace at 180 °C for 6 hours. After the reaction, the autoclave was allowed to cool naturally to room temperature. The resulting brown solution was then filtered through a 0.22 μm filter membrane to remove any insoluble impurities. To further purify the CDs, the filtrate was dialyzed against deionized (DI) water for 3 days using a dialysis bag with a molecular weight cut-off (MWCO) of 1000 Da, ensuring the removal of small molecular weight by-products. | ||
| Fig. 1 Schematic representation of the hydrothermal method for the synthesis of N-CDs. | ||
The purified solution inside the dialysis bag was collected and either stored at 4 °C for subsequent use in liquid form, or freeze-dried for 24 hours to obtain solid-state N-CDs when required. This process yielded high-quality nitrogen-doped carbon dots (N-CDs).
2.3. pH adjustment of N-CDs aqueous solution
The pH of the N-CDs solution was adjusted by adding 2 M NaOH to vary it within the range of 4 to 12. Fluorescence spectra were subsequently recorded at each pH level to investigate the effect of pH on the photoluminescence properties of the N-CDs.2.4. Detection of Hg(II) ions using CDs
The detection of Hg(II) ions was carried out at room temperature. Initially, carbon dots (CDs) were dispersed in deionized (DI) water to prepare a stock solution with a concentration of 1 mg mL−1. To evaluate the sensitivity of N-CDs toward Hg(II) ions, 2 mL of aqueous Hg(II) solutions at concentrations ranging from 0 to 250 μM were added to 2 mL of the N-CDs solution. The mixtures were then stirred for 10 minutes to ensure thorough interaction between the CDs and Hg(II) ions. Fluorescence spectra were subsequently recorded using an excitation wavelength of 380 nm.A similar procedure was employed for the detection of other metal ions, including Co2+, Mg2+, Ba2+, Ca2+, Zn2+, Cd2+, Mn2+, Ni2+, Na+, and Bi3+, all at a uniform concentration of 250 μM. This allowed for a comparative analysis of the selectivity of the N-CDs toward Hg(II) ions relative to other common metal ions.
2.5. Characterization
•Transmission electron microscopy (TEM): this technique was used to observe the morphology and estimate the size of the N-CDs at the nanoscale. TEM measurements were made on a HITACHI H-8100 electron microscope with an accelerating voltage of 200 kV.•The particle size and zeta potential: to evaluate the hydrodynamic diameter and surface charge stability of the N-CDs in solution, dynamic light scattering (DLS) analysis was performed. The particle size distribution and surface charge were measured with a Nano-ZS 90 instrument from Malvern at 25 °C.
•Fourier transform infrared (FT-IR) spectroscopy: FT-IR analysis was conducted to identify the surface functional groups and chemical bonds present in the N-CDs. Spectra of N-CDs powder were recorded at room temperature using a PerkinElmer Spectrum 1000 FT-IR spectrometer in the range of 400–4000 cm−1.
•Thermogravimetric analysis (TGA): this test was performed to assess the thermal stability and decomposition behavior of the N-CDs. TGA was conducted using a TG 209 F1 Iris thermal-microbalance (Netzsch) in a nitrogen atmosphere, with a flow rate of 30 mL min−1 and a heating ramp of 3 °C min−1 up to 600 °C.
•UV-Vis absorption: to investigate the optical absorption features and electronic transitions of the N-CDs, UV-Vis absorption spectroscopy was employed. Measurement were made using a PerkinElmer Lambda 365 UV-Vis-NIR spectrometer.
•Emission and excitation spectra: these spectra were recorded to analyze the luminescent properties and excitation-dependent behavior of the N-CDs. Measurement were carried out at room temperature using a Fluoromax 4P model Horiba spectrometer with a xenon arc lamp as the excitation source.
•Photoluminescence quantum yield (PLQY): PLQY was determined to quantify the fluorescence efficiency of the N-CDs. Measurements were performed using a compact integrating sphere coupled with a Horiba spectrometer.
•Temperature-dependent emission: this test aimed to study the thermal sensitivity of the luminescence for potential applications in optical thermometry. Emission Measurements were conducted using a JOBIN YVON HR 320 spectrometer with temperature control.
3. Results and discussion
3.1. Structural characterization of N-CDs
As shown in Fig. 2a and b, the morphology of the carbon dots (CDs) was obtained through transmission electron microscopy (TEM) observations of a dilute drop of the prepared suspension, which revealed tiny spherical nanoparticles (NPs) with sizes in the range of [9–10 nm]. Additional information about the size of the N-CDs was provided by dynamic light scattering (DLS), which measures the size distribution based on the hydrodynamic volume of the particles (Fig. 2c). The DLS results show a monomodal distribution with a peak at approximately 10 nm. The ζ-potential of the QDs at pH 6 was around −15 mV, indicating that the CDs were negatively charged. Though the ζ-potential is moderate in absolute value, the presence of these negative charge contributed to prevent the aggregation of the CDs NPs, and ensure long term colloidal stability without any risk of aggregation. | ||
| Fig. 2 (a) TEM image (b) the histogram of the size for the N-CDs, (c) the hydrodynamic size, (d) FTIR spectra of CA and N-CDs, and (e) thermogravimetric analysis curve of CDs. | ||
The FTIR spectra of N-CDs is shown in Fig. 2d and was superimposed with that of CA to highlight the change in the band after the hydrothermal treatment. The spectrum of CDs is characterized by bands at 1750, 1695, 1650, 1550, 1400, 1340, 1300, 1160, and 1150 cm−1. We assign the band at 1695, 1650 and 1550 cm−1 to amid groups (amid II and amide I) most likely resulting from the reaction between the carboxylic acid groups of CA and the amine groups of TREN.50,51 This region encompasses also the stretching vibration of C![[double bond, length as m-dash]](https://www.rsc.org/images/entities/char_e001.gif) C polycyclic aromatic hydrocarbons. The presence of band at 1750 cm−1 suggested also the existence of carbonyl (CO) groups.52 The 1300–1000 cm−1 region included the contribution of different groups including C–O, C–N, CC and phenol.53–59
C polycyclic aromatic hydrocarbons. The presence of band at 1750 cm−1 suggested also the existence of carbonyl (CO) groups.52 The 1300–1000 cm−1 region included the contribution of different groups including C–O, C–N, CC and phenol.53–59
The absence of symmetric and asymmetric peaks of CH2 at 2920 and 2850 cm−1, in the N-CDs FTIR spectra indicate that the carbon source was fully carbonized into graphitic structure.
The TGA of a lyophilised sample of N-CDs, shown in Fig. 2e, is characterized by a first weight loss of about 5% due to the evaporation of residual water in the lyophilized powder, followed by a steep degradation starting at 200 °C and continuing up to 600 °C. The loss from 200 to 350 °C, and involving the decomposition and oxidation of the carbon skeleton. The decomposition of the different functional groups (carbonyl, amide, amine, phenol and groups) from the surface of the N-CDs occurred in the range of 350–400 °C, while scission of the aromatic skeletal rings should occur over 500 °C.
3.2. Optical characterization of N-CDs
The optical properties of the N-CDs were investigated using UV-Vis absorption spectroscopy. Fig. 3 shows the UV-Vis spectrum of a diluted aqueous solution of the N-CDs. Two distinct absorption peaks are clearly observed in the spectrum. The peak at approximately 217 nm is attributed to π–π* transitions within the aromatic CC bonds, which are indicative of the sp2-π conjugation domain.60,61 Furthermore, an absorption band ranging from 285 to 400 nm is associated with n–π* transitions, originating from surface functional groups that contain lone electron pairs.62,63 These findings highlight the presence of both conjugated structures and surface-functionalized moieties in the N-CDs, contributing to their unique optical characteristics.
 | ||
| Fig. 3 UV Vis absorption spectrum of N-CDs. | ||
The fluorescence properties of the N-CDs were thoroughly investigated using photoluminescence (PL) spectroscopy. As shown in Fig. 4a, the excitation spectrum (red line) exhibits two peaks at 258 nm and 380 nm. Upon excitation at 380 nm, the fluorescence emission spectrum reveals a strong emission peak at 450 nm. The high fluorescence performance of the N-CDs is demonstrated in the inset of Fig. 4a, where the bright blue emission underscores their exceptional photoluminescent properties. This remarkable fluorescence intensity and stability make the N-CDs highly suitable for applications such as bioimaging, chemical sensing, and optoelectronic devices.
 | ||
| Fig. 4 (a) Excitation spectrum of the CDs recorded by monitoring the emission at 450 nm, and emission spectrum obtained under excitation at 380 nm. Inset shows blue fluorescence under 375 nm laser excitation, (b) emission spectrum of N-CDs under 258 nm excitation, and (c) chromaticity coordinates of N-CDs under 258 nm and 380 nm excitation. | ||
Furthermore, under an excitation wavelength of 258 nm (Fig. 4b), dual emission bands are observed, cantered at 460 nm and 581 nm, corresponding to blue and red emissions, respectively. The origins of these distinct emission bands can be rationalized based on the UV-Vis absorption spectrum. The blue emission at 460 nm is attributed to the absorption band between 285 and 400 nm, which is often associated with energy trapping by surface states.64,65 On the other hand, the red emission at 581 nm corresponds to the visible-range absorption bands (as seen in the inset of Fig. 3), typically linked to transitions involving surface functional groups.66–68
To further explore the fluorescence characteristics of the N-CDs, excitation-dependent emission spectra were recorded by varying the excitation wavelengths from 350 nm to 390 nm in 5 nm increments (Fig. 5). The results indicate that the emission intensity gradually increases with higher excitation wavelengths. Notably, unlike many previously reported CDs,69,70 the PL emission peaks of the synthesized N-CDs remain constant regardless of changes in the excitation wavelength. This unique behaviour is likely due to π–π* transitions within the graphitic carbon cores,71 highlighting the robust optical properties of the CDs.
 | ||
| Fig. 5 Fluorescence emission spectra of N-CDs obtained at different excitation wavelengths progressively increasing from 350 to 390 nm in 5 nm increments. | ||
The quantum yield (QY) of the CDs was determined using the integrating sphere method, which provides an absolute measurement by directly quantifying the emitted and absorbed photons. The general formula is as follows:72
 | (1) |
The synthesized N-CDs exhibited an exceptionally high QY of 90.85%, which can be attributed to the efficient energy transfer mechanisms enabled by their well-defined structural and surface properties. The use of citric acid as a carbon source, coupled with TREN as a nitrogen-rich passivating agent, likely contributed to the formation of surface states that enhance radiative recombination. Additionally, the hydrothermal process promoted uniform size distribution and minimized non-radiative pathways, further boosting the fluorescence efficiency.
3.3. Temperature-dependent fluorescence
To investigate the thermometric behaviour of the N-CDs, emission spectra were recorded under 380 nm excitation across a temperature range of 298 K to 343 K (Fig. 6a). The results clearly demonstrate a progressive decrease in luminescence intensity and integrated emission area by approximately 64% as the temperature increased, without any spectral shifts. This temperature-dependent luminescence behaviour can be attributed to thermal activation, which promotes increased non-radiative decay pathways.73–75 | ||
| Fig. 6 (a) PL spectra of N-CDs as function of temperature under 380 nm excitation (Inset: Integrated intensity as function of temperature), (b) temperature dependence of the integrated intensity (linear dependence with R2 = 0.998) and relative thermal sensitivity Sr. | ||
As illustrated in Fig. 6b, the fluorescence intensity ratio Δ = I/I0 (where I0 is the maximum fluorescence intensity) decreases linearly with rising temperature, exhibiting a highly linear response with a coefficient of determination R2 = 0.998. This linearity enabled the calculation of relative thermal sensitivity (Sr) using the following formula:73
 | (2) |
3.4. Effect of pH on optical properties of N-CDs
The luminescence behaviour of N-CDs was further investigated across a pH range from 4 to 12. Fig. 7a shows the fluorescence spectra of N-CDs measured at an excitation wavelength of 380 nm. In order to estimate the pH sensitivity, the integrated intensity, the peak position and full widths at half-maximum (FWHM) of the fluorescence band are plotted as a function of pH, as shown in Fig. 7b–d, respectively. The PL intensity increases gradually with increase in pH, in contrast to the FWHM widths, which decreased by 22% at pH = 12. Moreover, a shift of the emission peak as a function of pH was observed from 464 nm for pH 4 to 447 nm for pH 12. The peak position of the emission bands change significantly with pH of the solution is likely due to the presence of functional groups liable to protonation like amide, amine, carboxylic function decorating the surface of the CDs.76 The presence of these functional groups was supported by FTIR analysis. | ||
| Fig. 7 (a) PL emission spectra, (b) PL intensity, (c) FWHM, and (d) peak center position of N-CDs in aqueous solution at pH values ranging from 4 to 12, under 380 nm excitation wavelength. | ||
Under 258 nm excitation, the fluorescence spectra shown in Fig. 8a reveal a dominant emission band cantered at 581 nm (red band) at low pH (pH = 4), while the band cantered at 450 nm (blue band) appeared weaker. The 446 nm emission band is primarily associated with surface amino-related impurity levels, which are influenced by the acidity of the solution.77 As the pH increased, the intensity of the blue band progressively rose, eventually becoming the dominant feature (Fig. 8b).
 | ||
| Fig. 8 (a) The emission spectra of N-CDs as a function of pH under 258 nm excitation, (b) the variation of fluorescence intensity of Band I and band II, (c) the Chromaticity diagram, and (d) the corresponding intensity ratio as a function of pH and the fitted curve. | ||
The chromaticity diagram (Fig. 8c) indicates a significant blue shift in fluorescence emission at pH 12. According to Kumari et al.,78 this shift is attributed to changes in the surface state of the N-CDs. The presence of COO− groups on the surface modifies the electronic structure by removing certain energy levels, reducing the number of electronic transitions, and causing a blue shift in photoluminescence (PL) emission.
Furthermore, Fig. 8d plots the intensity ratio of the blue band to the red band as a function of pH, showing a linear increase with rising pH. These results confirm that the PL intensities of the blue and red bands are highly sensitive to pH changes, making the N-CDs suitable candidates for use in ratiometric fluorescence-based pH sensing applications.
3.5. Selective fluorescence amplification of N-CDs aqueous solution in the presence of Hg2+
Mercury ion (Hg2+) is a highly toxic heavy metal and a persistent pollutant that poses a significant threat to human health due to its non-biodegradable nature. Previous studies have reported that carboxylic groups can bind to metal ions through metal–ligand interactions.79 Consequently, the synthesized N-CDs solution serves as a promising sensor for Hg2+ detection in aqueous environments. All experiments were performed using the as-prepared N-CDs solution with a natural pH of ∼4. This mildly acidic condition enhances the fluorescence response by favoring protonation of surface functional groups (e.g., amino and carboxyl), which promotes effective coordination with Hg2+ ions.Fig. 9a displays the emission spectra of N-CDs at various Hg2+ ion concentrations. The fluorescence intensity progressively increased with higher concentrations of Hg2+ under 380 nm excitation, without any shift in the emission peak position or change in spectral shape. As shown in Fig. 9b, the fluorescence intensity ratio I/I0 (where I0 and I represent the fluorescence intensities in the absence and presence of Hg2+, respectively) demonstrated a linear increase with Hg2+ concentration, exhibiting excellent linearity with a correlation coefficient of 0.994 over the range of 0–10 μM (Fig. 9c).
 | ||
| Fig. 9 (a) Fluorescent emission spectra of N-CDs in the presence of difference Hg2+ concentrations, (b) The dependence of I/I0 on the concentrations of Hg2+ within the range of 0–250 μM, (c) the dependence of I/I0 on the concentrations of Hg2+ within the range of 0–10 μM, and (d) relative fluorescence intensities of N-CDs in the presence of different metal ions under 380 nm excitation (the concentration of metal ions is 250 μM). | ||
The limit of detection (LOD) for Hg2+ was calculated using the equation:
 | (3) |
The calculated LOD was approximately 0.46 μM. Table 1 compares the detection limits of various fluorescence-based sensors for Hg2+, demonstrating that the synthesized N-CDs exhibit superior performance, with a notably lower LOD than many previously reported materials. However, although this LOD represents an improvement over existing methods, it remains higher than the maximum permissible levels for Hg2+ in drinking water, as set by the European Union (5 nM) and the US Environmental Protection Agency (10 nM).90 Therefore, further optimization of the sensing platform is necessary to enable ultra-trace detection suitable for regulatory environmental monitoring.
| Materials | Sources of CDs | Linear range (μM) | LOD (μM) | Ref. |
|---|---|---|---|---|
| CQDs | Citric acid | 20–200 | 5.7 | 81 |
| CDs | Eggshell membrane | 10–100 | 2.6 | 82 |
| CDs-LAPONITE® | — | 1–40 | 2.5 | 83 |
| Eu/CDs | EDTA, L-cysteinec, and ethylene glycol | 5–250 | 2.2 | 84 |
| N,S/C-dots | Citric acid, urea and L-cysteine | 0–40 | 2 | 85 |
| N,S-CDs | Citric acid and L-glutathione | 5–50 | 1.78 | 86 |
| N,S-CDs | Glycerol and cysteine | 1–75 | 0.5 | 47 |
| AuNPs/CDs | Glutathione and ethyl alcohol | 0.5–15 | 0.5 | 87 |
| N-CDs | Citric acid and tri-(2-aminoethyl)amine | 0–10 | 0.46 | This work |
| N-CDs | Citric acid and melamine | 2–14 | 0.44 | 46 |
| N/S-CDs | Gardenia fruits | 2–20 | 0.32 | 88 |
| S-CDs | citric acid and sodium sulfite | 0.5–180 | 0.2 | 89 |
To assess the selectivity of the N-CDs for Hg2+, the fluorescence enhancement efficiency in the presence of various metal ions, including Co2+, Mg2+, Ba2+, Ca2+, Zn2+, Cd2+, Mn2+, Ni2+, and Na+, was measured. Fig. 9d illustrates the relative fluorescence intensity ratio I/I0 for each metal ion. The results clearly indicate that the N-CDs exhibited a specific and strong response to Hg2+ ions compared to other metal ions. This exceptional selectivity confirms the potential of the CDs for sensitive and selective Hg2+ detection in aqueous solutions.
To evaluate the practical applicability of the developed N-CDs-based fluorescence sensor, we applied the method to the detection of Hg2+ ions in real water samples. Tap water was collected, filtered to remove particulates, and subsequently spiked with known concentrations of Hg2+ (2 μM, 4 μM, 6 μM, 8 μM and 10 μM). The samples were then analysed under the same experimental conditions described previously, and the detected Hg2+ concentrations were determined using the calibration curve based on the fluorescence intensity ratio (I/I0). The recoveries were calculated using the formula:91
 | (4) |
| Sample Type | Added Hg2+ (μM) | Detected Hg2+ (μM) | Recovery (%) | RSD (%) (n = 3) |
|---|---|---|---|---|
| Tap water | 2.00 | 1.96 | 98.0 | 2.1 |
| Tap water | 5.00 | 5.18 | 103.6 | 1.8 |
| Tap water | 8.00 | 7.62 | 95.3 | 2.5 |
3.6. Sensing mechanism of N-CDs toward Hg2+ ions
The fluorescence enhancement observed upon addition of Hg2+ ions to the N-CDs solution is attributed to a “turn-on” mechanism. This behavior is likely due to specific coordination between Hg2+ ions and the electron-rich functional groups (e.g., amino, hydroxyl, and carboxyl) present on the surface of the N-CDs. The coordination with Hg2+ may passivate surface defect states that otherwise act as non-radiative recombination centers, thereby improving the radiative recombination efficiency and enhancing the fluorescence intensity. In addition, this interaction may rigidify the surface structure or alter the electronic environment of the fluorophores, further promoting fluorescence emission. A schematic illustration of the proposed sensing mechanism is presented in Fig. 10.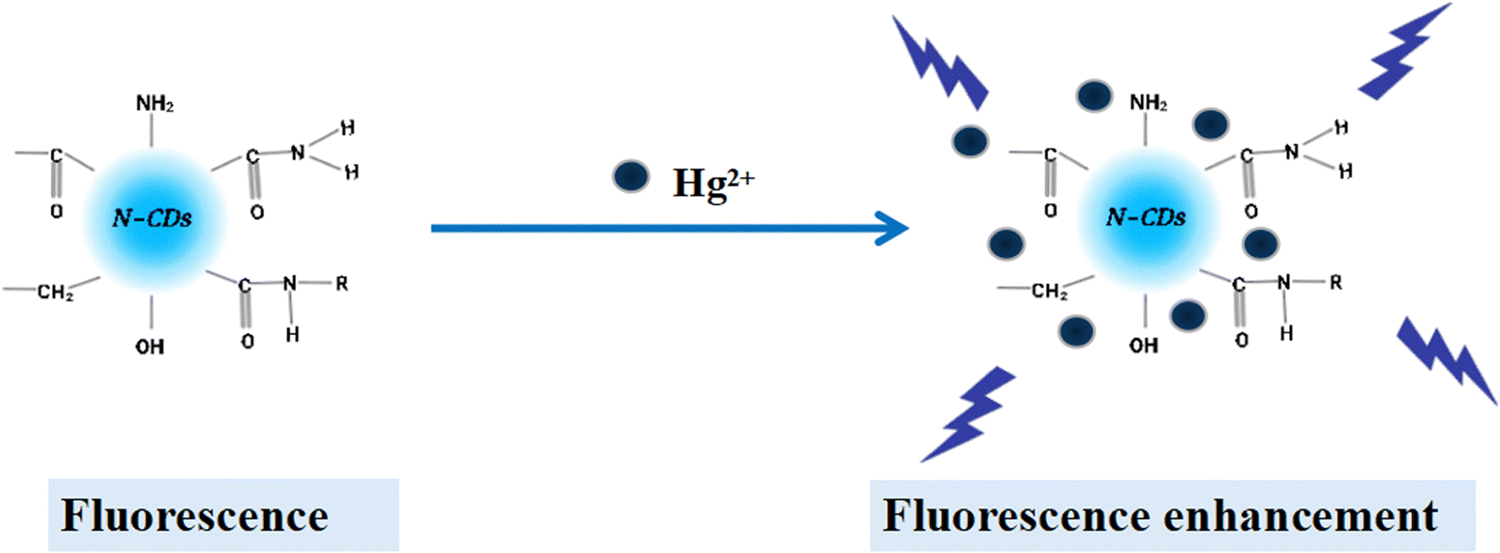 | ||
| Fig. 10 The schematic mechanism of fluorescence emission enhancement of the N-CDs by Hg2+. | ||
4. Conclusion
In this study, highly photoluminescent nitrogen-doped carbon dots (N-CDs) were synthesized via a hydrothermal method using citric acid and tri(2-aminoethyl)amine. The N-CDs exhibited an exceptional quantum yield of 90%, among the highest reported for undoped carbon dots, along with dual fluorescence emission at 450 nm (under 380 nm excitation) and 460/581 nm (under 258 nm excitation). These optical properties enabled multifunctional applications, including temperature-dependent fluorescence with a linear sensitivity of 1.21% K−1 over the range of 298–343 K. The N-CDs also demonstrated pH-responsive behavior, with the fluorescence intensity ratio (I450/I581) showing a linear response across the pH range of 4–12. Furthermore, the N-CDs enabled selective detection of Hg2+ ions through fluorescence enhancement, displaying a linear response over the range of 0–10 μM and a detection limit of 0.46 μM outperforming many surface-modified carbon dot systems. The synergy of high quantum efficiency, dual-emission versatility, and quantitative sensitivity across temperature, pH, and Hg2+ detection underscores the potential of these N-CDs as a versatile platform for environmental monitoring and biomedical diagnostics. Notably, their detection limit for Hg2+ complies with stringent regulatory standards for water quality. This work advances the development of multifunctional nanomaterials, offering a promising blueprint for unmodified carbon dots with real-world applicability in sensing technologies.Data availability
All data underlying the results are available as part of the article and no additional source data are required.Conflicts of interest
There are conflcts to declare.References
- N. K. Tan, H. Chan, Z. Lu, H. Zreiqat, G. Lakhwani, P. Lesani and E. J. New, Advancements in Bioactive Nanomaterials for Tissue Engineering Applications, ACS Appl. Mater. Interfaces, 2024, 16, 47303–47313 CrossRef CAS PubMed.
- Y. Hailing, L. Xiufang, W. Lili, L. Baoqiang, H. Kaichen, H. Yongquan, Z. Qianqian, M. Chaoming, R. Xiaoshuai, Z. Rui, L. Hui, P. Pengfei and S. Hong, Nanoparticle-Based Drug Delivery Systems for Cancer Therapy, Nanoscale, 2020, 12, 17222 RSC.
- L. Vallan and H. Imahori, Recent Advances in Organic Photovoltaics: From Molecular Design to Device Performance, ACS Appl. Electron. Mater., 2022, 4, 4231–4257 CrossRef CAS.
- M. Alafeef, I. Srivastava, T. Aditya and D. Pan, Carbon Quantum Dots for Biomedical Imaging and Sensing, Small, 2024, 20, 2303937 CrossRef CAS PubMed.
- P. Zhu, Z. Cheng, L. Du, Q. Chen and K. Tan, Surface Chemistry of Graphene Oxide and Its Applications in Environmental Remediation, Langmuir, 2018, 34, 9982–9989 CrossRef CAS PubMed.
- A. Truskewycz, H. Yin, N. Halberg, D. T. H. Lai, A. S. Ball, V. K. Truong, A. M. Rybicka and I. Cole, Antimicrobial Nanocoatings for Medical Devices: A Review, Small, 2022, 18, 2106342 CrossRef CAS PubMed.
- T. Feng, X. Ai, G. An, P. Yang and Y. Zhao, Luminescent Metal Nanoclusters for Bioimaging and Theranostics, ACS Nano, 2016, 10, 4410 CrossRef CAS PubMed.
- L. Cao, M. Meziani, S. Sahu and Y. Sun, Carbon Dots: Synthesis, Properties, and Applications, Acc. Chem. Res., 2013, 46, 171 CrossRef CAS PubMed.
- W. Li, Z. Zhang, B. Kong, S. Feng, J. Wang, L. Wang, J. Yang, F. Zhang, P. Wu and D. Zhao, Mesoporous Silica Nanoparticles for Controlled Drug Delivery, Angew. Chem., Int. Ed., 2013, 52, 8151 CrossRef CAS PubMed.
- K. Qu, J. Wang, J. Ren and X. Qu, Functionalized Graphene Oxide for Targeted Drug Delivery, Chem. – Eur. J., 2013, 19, 7243 CrossRef CAS PubMed.
- Y. Chen, M. Zheng, Y. Xiao, H. Dong, H. Zhang, H. Hu, B. Lei and Y. Liu, Graphene Quantum Dots for Optoelectronic Applications, Adv. Mater., 2016, 28, 312 CrossRef CAS PubMed.
- S. K. Panda, S. G. Hickey, H. V. Demir and A. Eychmüller, Colloidal Semiconductor Nanocrystals for Light-Emitting Diodes, Angew. Chem., Int. Ed., 2011, 50, 4432 CrossRef CAS PubMed.
- Z. Sheffield, M. Alafeef, P. Moitra, P. Ray and D. Pan, Carbon Dots for Environmental Monitoring and Remediation, Nanoscale, 2022, 14, 5112 RSC.
- M. Alafeef, K. Dighe, P. Moitra and D. Pan, Sustainable Synthesis of Carbon Dots for Biosensing Applications, ACS Sustainable Chem. Eng., 2022, 10, 245 CrossRef CAS PubMed.
- P. Ray, P. Moitra and D. Pan, Carbon Dots as Versatile Nanomaterials for Energy Conversion and Storage, View, 2022, 3, 26 CrossRef.
- D. Sar, F. Ostadhossein, P. Moitra, M. Alafeef and D. Pan, Carbon Dot-Based Nanocomposites for Enhanced Photocatalytic Activity, Adv. Sci., 2022, 9, 2202414 CrossRef CAS PubMed.
- Y. Sun, B. Zhou, Y. Lin, W. Wang, K. A. S. Fernando, P. Pathak, M. J. Meziani, B. A. Harruff, X. Wang, H. Wang, P. G. Luo, H. Yang, M. E. Kose, B. Chen, L. M. Veca and S. Xie, Quantum-Sized Carbon Dots for Bright and Colorful Photoluminescence, J. Am. Chem. Soc., 2006, 128, 7756–7757 CrossRef CAS PubMed.
- H. Peng and J. Travas-Sejdic, Simple Aqueous Solution Route to Luminescent Carbon Dots from Carbohydrates, Chem. Mater., 2009, 21, 5563–5565 CrossRef CAS.
- Z. Ma, H. Ming, H. Huang, Y. Liu and Z. Kang, One-Step Hydrothermal Synthesis of Highly Luminescent Carbon Dots, New J. Chem., 2012, 36, 861 RSC.
- R. Zhang and W. Chen, Carbon Dots for Electrochemical Sensing of Biomolecules, Biosens. Bioelectron., 2014, 55, 83–90 CrossRef CAS PubMed.
- Y. Guo, Z. Wang, H. Shao and X. Jiang, Synthesis of Fluorescent Carbon Dots with Tunable Emission Using Citric Acid and Urea, Carbon, 2013, 52, 583–589 CrossRef CAS.
- R. Fan, Q. Sun, L. Zhang, Y. Zhang and A. Lu, Green Synthesis of Carbon Dots from Glucose and Their Application as a Fluorescent Probe, Carbon, 2014, 71, 87–93 CrossRef CAS.
- Y. Zhang, D. Ma, Y. Zhuang, X. Zhang, W. Chen, L. Hong, Q. Yan, K. Yu and S. Huang, Fluorescent Carbon Dots Derived from Citric Acid and Ethylenediamine for Cell Imaging, J. Mater. Chem., 2012, 22, 16714 RSC.
- Y. Liu, N. Xiao, N. Gong, H. Wang, X. Shi, W. Gu and L. Ye, A Facile One-Step Hydrothermal Synthesis of Photoluminescent Carbon Dots, Carbon, 2014, 68, 258–264 CrossRef CAS.
- X. Gao, Y. Lu, R. Zhang, S. He, J. Ju, M. Liu, L. Lia and W. Chen, One-Pot Hydrothermal Synthesis of Nitrogen-Doped Carbon Dots for Cell Imaging, J. Mater. Chem. C, 2015, 3, 2302–2309 RSC.
- W. Lu, Y. Jiao, Y. Gao, J. Qiao, M. Mozneb, S. Shuang, C. Dong and C. Li, Nitrogen-Doped Carbon Dots for Fluorescent Detection of Fe3+ Ions, ACS Appl. Mater. Interfaces, 2018, 10, 42915–42924 CrossRef CAS PubMed.
- P. Das, M. Maruthapandi, A. Saravanan, M. Natan, G. Jacobi, E. Banin and A. Gedanken, Carbon Dots for Heavy-Metal Sensing, pH-Sensitive Cargo Delivery, and Antibacterial Applications, ACS Appl. Nano Mater., 2020, 3, 11777–11790 CrossRef CAS.
- G. Dong, K. Lang, H. Ouyang, W. Zhang, L. Bai, S. Chen, Z. Zhang, Y. Gao, Z. Mu and X. Zhao, Carbon Dots Prepared by Hydrothermal Treatment of Dopamine as an Effective Fluorescent Sensing Platform for the Label-Free Detection of Iron(III) Ions, RSC Adv., 2020, 10, 33483 RSC.
- C. Wang, H. Lin, Z. Xu, Y. Huang, M. G. Humphrey and C. Zhang, Tunable Carbon-Dot-Based Dual-Emission Fluorescent Nanohybrids for Ratiometric Optical Thermometry in Living Cells, ACS Appl. Mater. Interfaces, 2016, 8(10), 6621–6628 CrossRef CAS PubMed.
- C. Wang, Z. Xu, H. Cheng, H. Lin, M. G. Humphrey and C. Zhang, A hydrothermal route to water-stable luminescent carbon dots as nanosensors for pH and temperature, Carbon, 2015, 82, 87–95 CrossRef CAS.
- P. Yu, X. Wen, Y. Toh and J. Tang, Synthesis of Highly Fluorescent Carbon Dots via Microwave Heating, J. Phys. Chem. C, 2012, 116, 25552–25557 CrossRef CAS.
- Z. L. Wu, M. X. Gao, T. T. Wang, X. Y. Wan, L. L. Zheng and C. Z. Huang, Facile Synthesis of Nitrogen-Doped Carbon Dots for Multicolor Imaging, Nanoscale, 2014, 6, 3868–3874 RSC.
- F. Ahmed, S. Iqbal, L. Zhao and H. Xiong, Highly Fluorescent Carbon Dots for Selective Detection of Cr(VI), Anal. Chim. Acta, 2021, 1183, 338977 CrossRef CAS PubMed.
- C. Wang, Z. Xu, H. Cheng, H. Lin, M. G. Humphrey and C. Zhang, Photoluminescent Carbon Dots from Citric Acid and Urea: Formation Mechanism and Application in Cell Imaging, Carbon, 2015, 82, 87–95 CrossRef CAS.
- X. Jia, J. Lia and E. Wang, One-Pot Hydrothermal Synthesis of Highly Luminescent Nitrogen-Doped Carbon Dots, Nanoscale, 2012, 4, 5572–5575 RSC.
- P. Das, S. Ganguly, P. Khoshbakht Marvi, M. Sherazee, X. Tang, S. Srinivasan and A. R. Rajabzadeh, Carbon Dots Infused 3D Printed Cephalopod Mimetic Bactericidal and Antioxidant Hydrogel for Uniaxial Mechano-Fluorescent Tactile Sensor, Adv. Mater., 2024, 36, 2409819 CrossRef CAS PubMed.
- R. Long, C. Tang, T. Li, X. Tong, C. Tong, Y. Guo, Q. Gao, L. Wu and S. Shi, Dual-emissive carbon dots for dual-channel ratiometric fluorometric determination of pH and mercury ion and intracellular imaging, Microchim. Acta, 2020, 187, 307 CrossRef CAS PubMed.
- C. Xia, M. Cao, J. Xia, G. Zhou, D. Jiang, D. Zhang, J. Wang and H. Li, Nitrogen-Doped Carbon Dots for Fluorescent Detection of Cu2+ Ions, J. Mater. Chem. C, 2019, 7, 2563–2569 RSC.
- W. Song, W. Duan, Y. Liu, Z. Ye, Y. Chen, H. Chen, S. Qi, J. Wu, D. Liu and L. Xiao, Fluorescent Carbon Dots for Sensitive Detection of Mercury Ions, Anal. Chem., 2017, 89, 13626–13633 CrossRef CAS PubMed.
- J. Shangguan, D. He, X. He, K. Wang, F. Xu, J. Liu, J. Tang, X. Yang and J. Huang, Carbon Dots for Fluorescent Detection of Cr(VI) in Water Samples, Anal. Chem., 2016, 88, 7837–7843 CrossRef CAS PubMed.
- C. Zhou, S. Wu, S. Qi, W. Song and C. Sun, Development of Carbon Dots for Heavy Metal Ion Detection, J. Anal. Methods Chem., 2021, 6695354 Search PubMed.
- J. Pei, H. Li, F. Chen, Z. Chen, X. Yuan, Z. Han, D. Chen, D. Yu and D. Zhang, Functionalized Carbon Dots for Sensitive Detection of Fe3+ Ions, ACS Appl. Mater. Interfaces, 2024, 16, 60819–60827 CrossRef CAS PubMed.
- S. Mandal, J. Pal, R. Subramanian and P. Das, Highly Luminescent Carbon Dots for White Light Emission, Nano Res., 2020, 13, 2770–2776 CrossRef CAS.
- Z. Wang, X. Yu, F. Li, F. Kong, W. Lv, D. Fan and W. Wang, Carbon Dots for Fluorescent Detection of Cu2+ Ions in Water, Microchim. Acta, 2017, 184, 4775–4783 CrossRef CAS.
- K. Jiang, S. Sun, L. Zhang, Y. Wang, C. Cai and H. Lin, Red-Emitting Carbon Dots for Two-Photon Fluorescence Bioimaging, ACS Appl. Mater. Interfaces, 2015, 7, 23231–23238 CrossRef CAS PubMed.
- M. Szmyt, B. Buszewski and R. Kopciuch, Characterization of Carbon Dots by FTIR Spectroscopy, Spectrochim. Acta, Part A, 2020, 236, 118320 CrossRef PubMed.
- Y. Xu, H. Li, B. Wang, H. Liu, L. Zhao, T. Zhou, M. Liu, N. Huang, Y. Li, L. Ding and Y. Chen, One-Step Hydrothermal Synthesis of Carbon Dots for Fluorescent Detection of Fe3+ Ions, Microchim. Acta, 2018, 185, 156 CrossRef PubMed.
- K. Zhang, Y. Sang, Y. Gao, Q. Sun and W. Li, Synthesis of Nitrogen-Doped Carbon Dots for Detection of Fe3+ Ions, Spectrochim. Acta, Part A, 2022, 264, 120281 Search PubMed.
- Q. Meng, F. Zhang, L. Wang, S. Xiang, S. Zhu, G. Zhang, K. Zhang and B. Yang, Carbon Dots for Fluorescent Detection of Cr(VI), RSC Adv., 2014, 4, 713–716 Search PubMed.
- D. Qu and Z. Sun, The formation mechanism and fluorophores of carbon dots synthesized via a bottom-up route, Mater. Chem. Front., 2020, 4, 400–420 RSC.
- Z. Zhang, J. Hao, J. Zhang, B. Zhang and J. Tang, Protein as the source for synthesizing fluorescent carbon dots by a one-pot hydrothermal route, RSC Adv., 2012, 2, 8599–8601 RSC.
- Y. Di, W. Liu, S. Shi, T. Wu, M. Wang and X. Liu, One-step synthesis of color-tunable carbon dots-based organic long persistent luminescence materials, Chem. Eng. J., 2024, 479, 147589 CrossRef CAS.
- H. Huang, H. Ge, Z. Ren, Z. Huang, M. Xu and X. Wang, Biocompatible Carbon Dots for Cellular Imaging and Drug Delivery, Front. Bioeng. Biotechnol., 2021, 9, 617097 CrossRef PubMed.
- S. Chandra, A. R. Chowdhuri, T. K. Mahto, D. Laha and S. K. Sahu, Green Synthesis of Carbon Dots for Biological Applications, Nano-Struct. Nano-Objects, 2017, 12, 10–18 Search PubMed.
- Q. H. Ye, F. Y. Yan, Y. M. Luo, Y. Y. Wang, X. G. Zhou and L. Chen, Fluorescent Carbon Dots for Selective Detection of Fe3+ Ions, Spectrochim. Acta, Part A, 2017, 173, 854–862 CrossRef CAS PubMed.
- M. Y. Xue, Z. H. Zhan, M. B. Zou, L. L. Zhang and S. L. Zhao, One-Step Hydrothermal Synthesis of Carbon Dots for Detection of Fe3+ Ions, New J. Chem., 2016, 40, 1698–1703 RSC.
- C. P. Han, R. Wang, K. Y. Wang, H. T. Xu, M. R. Sui, J. J. Li and K. Xu, Carbon Dots for Fluorescent Detection of Cu2+ Ions, Biosens. Bioelectron., 2016, 83, 229–236 Search PubMed.
- M. N. Egorova, A. N. Kapitonov, A. A. Alekseev and E. A. Obraztsova, Carbon Dots for Photodynamic Therapy, J. Struct. Chem., 2020, 61, 811–817 CrossRef CAS.
- W. J. Niu, Y. Li, R. Zhu, D. Shan, Y. Fan and X. Zhang, Carbon Dots for Electrochemical Detection of Heavy Metals, Sens. Actuators, B, 2015, 218, 229–236 CrossRef CAS.
- B. Y. Han, X. S. Lei, D. Li, Q. D. Liu, Y. J. Chen, J. Wang and G. H. He, Carbon Dots for Photocatalytic Degradation of Organic Pollutants, Adv. Opt. Mater., 2023, 11, 2202293 CrossRef CAS.
- Z. Yu, F. Li and Q. Xiang, Carbon Dots for Solar Energy Conversion, J. Mater. Sci. Technol., 2024, 175, 244–257 CrossRef CAS.
- K. Jiang, S. Sun, L. Zhang, Y. Lu, A. Wu, C. Cai and H. Lin, Red-Emitting Carbon Dots for Two-Photon Fluorescence Imaging, Angew. Chem., Int. Ed., 2015, 54, 5360–5363 CrossRef CAS PubMed.
- W. Kwon, G. Lee, S. Do, T. Joo and S. W. Rhee, Size-Dependent Photoluminescence of Carbon Dots, Small, 2014, 10, 506–513 CrossRef CAS PubMed.
- Y. Dong, H. Pang, H. B. Yang, C. Guo, J. Shao, Y. Chi, C. M. Li and T. Yu, Carbon-Based Dots Co-doped with Nitrogen and Sulfur for High Quantum Yield Fluorescence, Angew. Chem., Int. Ed., 2013, 52, 7800–7804 CrossRef CAS PubMed.
- P. Anilkumar, X. Wang, L. Cao, S. Sahu, J. H. Liu, P. Wang, K. Korch, K. N. Tackett, A. Parenzan and Y. P. Sun, Tunable Luminescent Carbon Nanodots, Nanoscale, 2011, 3, 2023–2027 RSC.
- T. Zhang, J. Zhu, Y. Zhai, H. Wang, X. Bai, B. Dong, H. Wang and H. Song, Carbon Dots for Fluorescent Detection of Heavy Metals, Nanoscale, 2017, 9, 13042–13051 RSC.
- H. Ding, S. B. Yu, J. S. Wei and H. M. Xiong, Full-Color Emission Carbon Dots, ACS Nano, 2016, 10, 484–491 Search PubMed.
- D. Gao, X. Liu, D. Jiang, H. Zhao, Y. Zhu, X. Chen, H. Luo, H. Fan and X. Zhang, Nitrogen-Doped Carbon Dots for Fluorescent Detection of Cu2+ Ions, Sens. Actuators, B, 2018, 277, 373–380 CrossRef CAS.
- H. Sadhanala, S. Pagidi, S. Yadav, M. Beiderman, I. Grinberg, D. Fixler and A. Gedanken, Carbon Dots for Detection of Toxic Ions in Water, ChemistrySelect, 2022, 7, e202201261 CrossRef CAS.
- C. Ma, Z. Zhu, H. Wang, X. Huang, X. Zhang, X. Qi, H. Zhang, Y. Zhu, X. Deng, Y. Peng, Y. Han and H. Zhang, Nitrogen-Doped Carbon Dots for Fluorescent Detection of Fe3+ Ions, Nanoscale, 2015, 7, 10162–10169 Search PubMed.
- V. Arul and M. G. Sethuraman, Fluorescent Carbon Dots for Detection of Heavy Metal Ions, Opt. Mater., 2018, 78, 181–190 CrossRef CAS.
- Z. Yi, X. Li, H. Zhang, X. Ji, W. Sun, Y. Yu, Y. Liu, J. Huang, Z. Sarshar and M. Sain, Carbon Dots for Detection of Heavy Metals in Water, Talanta, 2021, 222, 121663 CrossRef CAS PubMed.
- R. Wang, K. Q. Lu, Z. R. Tang and Y. J. Xu, Recent Progress in Carbon Dots: Synthesis, Properties and Applications in Photocatalysis, J. Mater. Chem. A, 2017, 5, 3717–3734 RSC.
- A. Sharma and J. Das, Small Molecules Derived Carbon Dots: Synthesis and Applications in Sensing, Catalysis, Imaging, and Biomedicine, J. Nanobiotechnol., 2019, 17, 92 CrossRef PubMed.
- X. T. Zheng, A. Ananthanarayanan, K. Q. Luo and P. Chen, Glowing Graphene Quantum Dots and Carbon Dots: Properties, Syntheses, and Biological Applications, Small, 2015, 11, 1620–1636 CrossRef CAS PubMed.
- J. Zhang, W. Shen, D. Pan, Z. Zhang, Y. Fang and M. Wu, Controlled Synthesis of Green and Blue Luminescent Carbon Nanodots for Bioimaging Applications, J. Mater. Chem. B, 2013, 1, 5023–5028 Search PubMed.
- S. N. Baker and G. A. Baker, Luminescent Carbon Nanodots: Emergent Nanolights, Angew. Chem., Int. Ed., 2010, 49, 6726–6744 CrossRef CAS PubMed.
- X. Li, M. Rui, J. Song, Z. Shen and H. Zeng, Carbon and Graphene Quantum Dots for Optoelectronic and Energy Applications: A Review, Adv. Funct. Mater., 2015, 25, 4929–4947 CrossRef CAS.
- S. T. Yang, L. Cao, P. G. Luo, F. Lu, X. Wang, H. Wang, M. J. Meziani, Y. Liu, G. Qi and Y. P. Sun, Carbon Dots for Optical Imaging in Vivo, J. Am. Chem. Soc., 2009, 131, 11308–11309 CrossRef CAS PubMed.
- M. L. Liu, B. B. Chen, C. M. Li and C. Z. Huang, Carbon Dots: Synthesis, Formation Mechanism, Fluorescence Origin and Sensing Applications, Green Chem., 2019, 21, 449–471 RSC.
- Y. Wang, K. Kalantar-Zadeh, A. Kis, J. N. Coleman and M. S. Strano, Electronics and Optoelectronics of Two-Dimensional Transition Metal Dichalcogenides, Nat. Nanotechnol., 2012, 7, 699–712 CrossRef PubMed.
- M. Zheng, S. Ruan, S. Liu, T. Sun, D. Qu, H. Zhao, Z. Xie, H. Gao, X. Wang, K. Ge, H. Su, Y. Xiong, Y. Li and J. Tang, Self-Targeting Fluorescent Carbon Dots for Diagnosing and Mapping Hepatocellular Carcinoma, Nanoscale, 2019, 11, 22092–22099 Search PubMed.
- Y. P. Sun, B. Zhou, Y. Lin, W. Wang, K. A. S. Fernando, P. Pathak, M. J. Meziani, B. A. Harruff, X. Wang, H. Wang, P. G. Luo, H. Yang, M. E. Kose, B. Chen, L. M. Veca and S. Y. Xie, Quantum-Sized Carbon Dots for Bright and Colorful Photoluminescence, J. Am. Chem. Soc., 2006, 128, 7756–7757 CrossRef CAS PubMed.
- A. Cayuela, M. L. Soriano, C. Carrillo-Carrión and M. Valcárcel, Semiconductor and Carbon-Based Fluorescent Nanodots: The Need for Consistency, Chem. Commun., 2016, 52, 1311–1326 Search PubMed.
- C. Wang, Z. Xu, C. Zhang, Q. Qiao, L. Zhang, R. Zhang, Y. Yu and X. Liu, Highly Efficient and Stable Green-Emitting Carbon Dots for Bioimaging, Nanoscale, 2014, 6, 1775–1781 RSC.
- P. Szmyt, B. Buszewski and R. Gadzała-Kopciuch, Mater. Chem. Phys., 2020, 242, 122484 Search PubMed.
- R. Atchudan, T. N. J. I. Edison, K. R. Aseer, S. Perumal, N. Karthik and Y. R. Lee, Highly Fluorescent Nitrogen-Doped Carbon Dots Derived from Phyllanthus acidus for Selective Detection of Ferric Ions, J. Photochem. Photobiol., B, 2018, 185, 242–252 Search PubMed.
- D. Sun, T. Liu and C. Wang, et al., Hydrothermal Synthesis of Fluorescent Carbon Dots from Gardenia Fruit for Sensitive onoff-on Detection of Hg2+ and Cysteine, Spectrochim. Acta, Part A, 2020, 240, 118598 CrossRef CAS PubMed.
- C. Wang, Y. Wang, H. Shi, Y. Yan, E. Liu, X. Hu and J. Fan, A strong blue fluorescent nanoprobe for highly sensitive and selective detection of mercury(II)based on sulfur doped carbon quantum dots, Mater. Chem. Phys., 2019, 145–151 CrossRef.
- B. B. Wang, J. Cheng Jin, Z. Qiang Xu, Z. Wen Jiang, X. Li, F. Lei Jiang and F. Liu, Single-step synthesis of highly photoluminescent carbon dots for rapid detection of Hg2+ with excellent sensitivity, J. Colloid Interface Sci., 2019, 551, 101–110 CrossRef CAS PubMed.
- B. S. Onishi, A. N. Carneiro Neto and S. J. Ribeiro, Carbon Dot-LAPONITE® Hybrid Nanocomposites as Selective Turn-Off Sensors for Hg2+ Detection and Photoluminescence Quenching Mechanism, ACS Omega, 2024, 9(52), 51204–51212 CrossRef CAS PubMed.
| This journal is © The Royal Society of Chemistry 2025 |