
 Open Access Article
 This Open Access Article is licensed under a Creative Commons Attribution-Non Commercial 3.0 Unported Licence
Phase selective hydrothermal synthesis of 1T MoS2 and Janus 1T MoSSe for the hydrogen evolution reaction†
Kushal Mazumder ac,
Chob Singha,
N. J. Hemavathia,
Suman Kalyan Sahooa,
Arvind H. Jadhava and
Pramoda K. Nayak*ab
ac,
Chob Singha,
N. J. Hemavathia,
Suman Kalyan Sahooa,
Arvind H. Jadhava and
Pramoda K. Nayak*ab
aCentre for Nano and Material Sciences, Jain (Deemed-to-be University), Jain Global Campus, Kanakapura, Bangalore 562112, Karnataka, India. E-mail: pramoda.nayak@jainuniversity.ac.in
bDepartment of Physics, 2D Materials Research and Innovation Group, Indian Institute of Technology Madras, Chennai 600036, India
cDepartment of Physics, School of Basic and Applied Sciences, IILM University, Plot No. 16-18, Knowledge Park II, Greater Noida, Uttar Pradesh 201306, India
First published on 8th May 2025
Abstract
Octahedral 1T-MoS2, a transition metal dichalcogenide (TMD), is a promising and cost-effective alternative to Pt for the electrochemical hydrogen evolution reaction (HER) compared to its hexagonal 2H phase. However, the metastable nature of 1T-MoS2 makes its synthesis challenging. Janus TMDs, such as MoSSe, with their intrinsic structural asymmetry, are emerging as efficient HER catalysts, and their 1T phase demonstrates improved stability. This study compares hydrothermally synthesized 1T-MoS2 and solvothermally grown 1T-MoSSe with commercially available 2H-MoS2 for the HER. Janus 1T-MoSSe exhibits superior performance with an overpotential of 87.8 mV at a current density of 10 mA cm−2, a Tafel slope of 148 mV decade−1, and an enhanced long-term stability of 10![[thin space (1/6-em)]](https://www.rsc.org/images/entities/char_2009.gif) 000 cycles over 5 hours. Its low electrochemical impedance of 21 Ω indicates efficient charge transfer. Density functional theory (DFT) calculations validate the Janus material as the best catalyst with a hydrogen adsorption free energy (ΔGH) of 0.46 eV. Bader charge analysis reveals the lowest charge on the Se atom in the MoSeS Janus material. The upshifted p-band center in Janus materials, compared to their pristine counterpart, optimizes the S/Se–H bond strength, enhancing hydrogen adsorption. This work highlights how structural engineering of TMDs into Janus structures can optimize their HER performance, providing a route for cost-effective and efficient hydrogen production technologies.
000 cycles over 5 hours. Its low electrochemical impedance of 21 Ω indicates efficient charge transfer. Density functional theory (DFT) calculations validate the Janus material as the best catalyst with a hydrogen adsorption free energy (ΔGH) of 0.46 eV. Bader charge analysis reveals the lowest charge on the Se atom in the MoSeS Janus material. The upshifted p-band center in Janus materials, compared to their pristine counterpart, optimizes the S/Se–H bond strength, enhancing hydrogen adsorption. This work highlights how structural engineering of TMDs into Janus structures can optimize their HER performance, providing a route for cost-effective and efficient hydrogen production technologies.
1. Introduction
Two-dimensional (2D) layered TMDs possess a high surface-to-volume ratio, unique electronic structures, and tunable catalytic sites, making them highly efficient and versatile catalysts for electrocatalysis applications, particularly in energy conversion processes like hydrogen evolution and CO2 reduction.1 MoS2, a prominent TMD, is widely recognized for its tunable electronic behaviour,2 high catalytic activity,3 excellent mechanical flexibility,4 and potential in various technological applications ranging from transistors to electrocatalysts.5 In general, MoS2 showcases two different polymorphs, 2H and 1T, which differ significantly in their structure and properties.6 The 2H phase with trigonal prismatic coordination7 is semiconducting8 and exhibits strong photoluminescence,9 making it suitable for electronic and optoelectronic applications. In contrast, the 1T phase with octahedral coordination10 is metallic11 and often shows ferromagnetism.12 In terms of electrocatalytic properties, the 1T phase is more active due to its higher conductivity and abundance of active sites,13 particularly for the HER14 compared to the 2H phase.3 But the 1T phase of MoS2 is inherently less stable than the 2H phase,15 which tends to transform to the more thermodynamically stable 2H form over time16 or under certain conditions such as high temperature,17 stoichiometry,18 and mechanical stress.19 This phase instability poses challenges in maintaining the desired properties of 1T MoS2 in practical applications, necessitating strategies such as chemical doping20 or strain engineering21 to stabilize the 1T phase for extended use. However, the processes involved in these approaches are quite arduous and complex. For these reasons, the researchers have slowly shifted their attention towards Janus structures like MoSSe, i.e. replacing one sulphur layer in MoS2 with Se. Janus TMDs are a class of 2D materials, where different chalcogen atoms are present on each side of the transition metal layer, resulting in unique electronic, optical, and catalytic properties due to the broken out-of-plane symmetry.22 Janus TMDs are superior to normal TMDs due to their asymmetric structure, which creates an intrinsic dipole moment,23 enhancing charge separation and leading to unique electronic and optical properties.24 This asymmetry results in more diverse and active sites,25 making them more versatile in various applications. For example, 1T MoSSe is more stable than 1T MoS226 and it possesses more defect states than 1T-MoS2 because of the combination of sulfur and selenium atoms.27 This introduces variations in binding energy28 and its electronic properties, thereby optimizing the material's performance in areas such as electrocatalysis, sensing, and photonics.Hydrogen (H2) is considered as a promising renewable energy source due to its high energy density and zero pollution.29 Currently, industrial H2 production relies on methane reforming and coal gasification, which emit significant greenhouse gases.30 In contrast, the electrochemical HER from water-splitting is more eco-friendly, especially when powered by renewable energy sources like solar energy.31 However, the high cost and scarcity of platinum (Pt), the best HER catalyst, drive the need for developing efficient, low-cost, non-noble metal catalysts for industrial use. As a typical 2D material, MoS2, particularly in its 1T phase, has demonstrated significant potential to replace Pt in both theoretical and experimental studies.32 Over the past few decades, extensive research has focused on the HER activity of 1T MoS2. Hinnemann et al. demonstrated that for an effective HER, the binding free energy of atomic hydrogen to the catalyst should be nearly zero. They found that MoS2 nanoparticles supported on graphite serve as promising catalysts with a moderate overpotential of 0.1–0.2 V.33 Voiry et al. showed 2H to 1T phase transformation by chemical exfoliation of MoS2 nanosheets, which exhibit brilliant catalytic activity toward H2 evolution with a particularly low Tafel slope of 40 mV dec−1.14 Tang et al.,34 through density functional theory (DFT) calculations, suggested that unlike the nonreactive basal plane of 2H-MoS2, the catalytic activity of 1T-MoS2 stems from its ability to bind hydrogen at surface sulfur sites. The binding free energy (ΔGH) indicates that the HER process is most favourable at surface hydrogen coverage between 12.5% and 25%, where hydrogen prefers bonding to surface sulfur atoms. Lukowski et al.35 reported significantly enhanced HER performance from metallic 1T-MoS2 nanosheets, chemically exfoliated via lithium intercalation from 2H-MoS2 grown on graphite, achieving a current density of 10 mA cm−2 at an overpotential of 187 mV vs. reversible hydrogen electrode (RHE) and a Tafel slope of 43 mV decade−1. Cai et al.36 produced 1T phase enriched MoS2 nanosheets by using a graphene-oxide-template assisted two-step hydrothermal synthetic strategy. With an enhanced 1T phase, there is an improvement in conductivity for MoS2 as well as an increment in the number of active sites. A low overpotential of 126 mV at 10 mA cm−2 with a small Tafel slope of 35 mV dec−1 is achieved when the system has a 50% 1T phase content.
Elemental doping of 1T-MoS2 is an effective scheme for enhancing the HER activity of the material. Certain elements when doped into MoS2 tune the d-band structure of the material, resulting in a decrement in the hydrogen adsorption free energy (ΔGH), a crucial condition for better hydrogen evolution. Qi et al.37 reported a single-atom Co-doped distorted 1T-MoS2 nanosheet with an overpotential of only 42 mV at 10 mA cm−2. Zheng et al. employed a co-confining method in MoS2 nanofoam, incorporating selenium onto the surface and cobalt into the inner layer, achieving a high current density of 1000 mA cm−2 and a lower overpotential of 382 mV compared to 671 mV in commercial Pt/C. First-principles calculations revealed that cobalt stimulates neighbouring sulfur atoms, while selenium stabilizes the structure, jointly optimizing hydrogen adsorption and generating abundant active sites.38 To address stability issues, some studies39 have explored “chemical tuning” to enhance MoS2 activity. Alloyed nanoflakes, particularly MoSSe, demonstrate improved activity and stability compared to MoS2 or MoSe2.40 The introduction of Se modulates the d-band electronic structure of Mo, thereby optimizing the hydrogen adsorption free energy and boosting electrocatalytic performance.41 Gong et al.40 demonstrated that tuning of the Se composition in MoS2(1−x)Se2x alloys (x = 0, 1/3, 1/2, 2/3, 1) can achieve a hydrogen adsorption free energy (ΔGH) close to the ideal value of 0 meV. The nanoflake morphology, with monolayer and multilayer structures, offers a high surface area and exposed edges, which are thermodynamically more favourable for the electrocatalytic HER than basal planes.42 Wang et al.43 showed an enhanced HER activity by optimizing the Se-to-S ratio in MoSSe alloys, improving electrical conductivity and active site accessibility in 2H-MoSSe. The best performance was observed in 2H-MoS0.2Se1.8 synthesized at 160 °C, with a Tafel slope of 50 mV decade−1 and an overpotential of 136 mV, attributed to the controlled disorder and improved conductivity. All these reports for the superior electrocatalytic properties of Janus MoSSe are based on some composite formation as well as for the 2H phase. While 2H-MoSSe, the Janus counterpart of MoS2, has been moderately explored as a hydrogen evolution catalyst, there is a lack of comprehensive analysis comparing the electrocatalytic HER performance of 1T-MoS2 and 1T-MoSSe in isolation. Most studies include additional materials in the form of composites or doping, making it difficult to assess their intrinsic catalytic properties directly.
This study investigates the 1T phase of MoS2 and Janus MoSSe as HER catalysts, prepared via simple hydrothermal and solvothermal methods. Comprehensive characterization using X-ray diffraction (XRD), Raman spectroscopy, photoluminescence (PL), high resolution transmission electron microscopy (HR-TEM) and X-ray photoelectron spectroscopy (XPS) confirmed the phase purity and detailed structural, morphological, and optical properties. Janus 1T-MoSSe outperformed MoS2, showing an overpotential of 87.8 mV at 10 mA cm−2, a Tafel slope of 148 mV decade−1, long-term stability over 10000 cycles, and lower electrochemical impedance. Computational DFT studies revealed that its superior HER performance arises from lower hydrogen adsorption free energy, enhanced active sites, and efficient charge transport due to its unique structure, making Janus 1T-MoSSe a promising HER catalyst.
2. Experimental section
2.1. Synthesis of 1T-MoS2
Ammonium molybdate tetrahydrate ((NH4)6Mo7O24·4H2O) and thiourea (NH2CSNH2) were used as Mo and S sources, respectively. Here, thiourea also acts as a reductant to reduce Mo(VI) to Mo(IV). In a typical hydrothermal synthesis procedure, stoichiometric amounts of Mo and S precursors were added to DI water and were stirred magnetically for 2 hours until they are fully dissolved. Careful attention was paid to maintaining a Mo:S molar ratio of 1:2.14 as followed by Liu et al.,44 since any deviation from this ratio makes the formation of the 1T phase challenging. The solution with a total volume of 70 mL was transferred to a 100 mL Teflon lined stainless steel autoclave, which was kept in a muffle furnace for 24 hours at 200 °C. The final product was collected after repeated cleaning in DI water and ethanol through centrifugation followed by vacuum drying in an oven at 60 °C for 6 hours. The main purpose behind this synthesis method is the in situ intercalation of ammonium ions between the spacing of MoS2 interlayers.
2.2. Synthesis of 1T-MoSSe
To synthesize 1T-MoSSe, 1 mmol of ammonium molybdate tetrahydrate and 7 mmol of thiourea were added to a water–ethanol–N–methyl pyrrolidone mixture (50 mL, 2:2:1 v/v) and stirred for homogeneous dispersion. Separately, 3.5 mmol of selenium powder was sonicated in 20 mL of hydrazine hydrate, forming a black dispersion. Both the solutions were then combined, stirred, and transferred to a 100 mL Teflon-lined autoclave and heated at 200 °C for 24 hours. The final product was obtained using the same washing and drying process as for MoS2. For a better understanding of the phase selective growth of 1T-MoSSe, see Scheme S1 in the ESI.†
2.3. Material characterization
The physiochemical properties of the synthesized catalysts were analyzed using various advanced analytical techniques. Crystallinity and phase development were determined using powder XRD, with the patterns recorded on a Rigaku X-ray diffractometer using Cu Kα radiation (λ = 1.5406 Å) over a range of 5–80° at a scan rate of 3° min−1. Raman and PL studies were conducted using a HORIBA Jobin Yvon HR800 UV Raman spectrometer with 488 nm and 632 nm laser excitations. 600 lines per mm grating were used for PL, and 1800 lines per mm (∼1 cm−1 resolution) were used for Raman measurements. HRTEM (JEOL Japan, JEM-2100 Plus) was used to obtain structural and morphological details, while XPS (model no: PerkinElmer PHI1257) was used to analyze the elemental composition and chemical states having an excitation source (1486.7 eV) with non-monochromatic Al-Kα X-rays at an ambient pressure of ∼4 × 10⁻¹⁰ Torr. Electrochemical measurements were performed in a three-electrode system using a CHI 760E electrochemical workstation.2.4. Electrochemical analysis set-up for the HER
For HER electrochemical measurements, 2 mg of synthesized MoS2 (or MoSSe) powder was mixed with 1 mL of ethanol and 10 μL of Nafion binder and then ultra-sonicated for 30 minutes to form a uniform slurry. A 15 μL portion was drop-cast onto a glassy carbon electrode and dried at room temperature for 3 hours. Measurements were conducted in 0.5 M H2SO4 using a CHI 760E workstation, with cyclic voltammetry (CV) at 0.1 V s−1 and linear sweep voltammetry (LSV) at 5 mV s−1 over 0 to −1 V. No external gas purging was performed. Potentials were converted from Ag/AgCl to a RHE using the Nernst equation,
 | (1) |
 is the potential for the Ag/AgCl electrode, which is equal to 0.197 V and the pH of the 0.5 M H2SO4 solution is equal to 1. The characterization of HER performance involved evaluating various parameters to assess the electrochemical kinetics, efficiency, and overall effectiveness of the catalysts or materials involved in promoting the HER.
3. Results and discussion
3.1. Characterization of 2H-MoS2, 1T-MoS2, and 1T-MoSSe
To confirm the formation of the 1T phase in the synthesized samples, basic characterization studies were conducted on the as-grown 1T-MoS2 and 1T-MoSSe, alongside commercially purchased 2H-MoS2 for comparison. A detailed analysis of XRD, Raman spectroscopy, PL, HRTEM and XPS results was performed to verify that the laboratory-grown samples exhibit the 1T phase, different from the 2H-MoS2.Fig. 1(a) shows the XRD spectra of 2H-MoS2 (Panel-III), 1T-MoS2 (Panel-II) and 1T-MoSSe (Panel-I), which match with JCPDS card no. 37-1492. For 1T-MoS2, the key observation is the presence of characteristic first- and second-order Bragg reflection peaks at 2θ values of ∼9° and 17°, corresponding to the (002) and (004) planes of the 1T phase, respectively.45 In contrast, the 2H-MoS2 spectra show (002) and (004) peaks at 14° and 29°, indicating a shift in the interplanar distance from 6.1 Å to 9.4 Å due to lattice expansion in the 1T phase.46 The strong 9° peak suggests the predominance of the 1T phase with a preferential orientation along the (002) plane, a trend also seen in 1T-MoSSe. However, the absence of the (004) peak in 1T-MoSSe, along with the broader peaks, indicates the lower crystallinity of the prepared material. Additional minor reflections are indexed as (100), (102), and (110) planes of 1T MoS2, consistent with the JCPDS data.
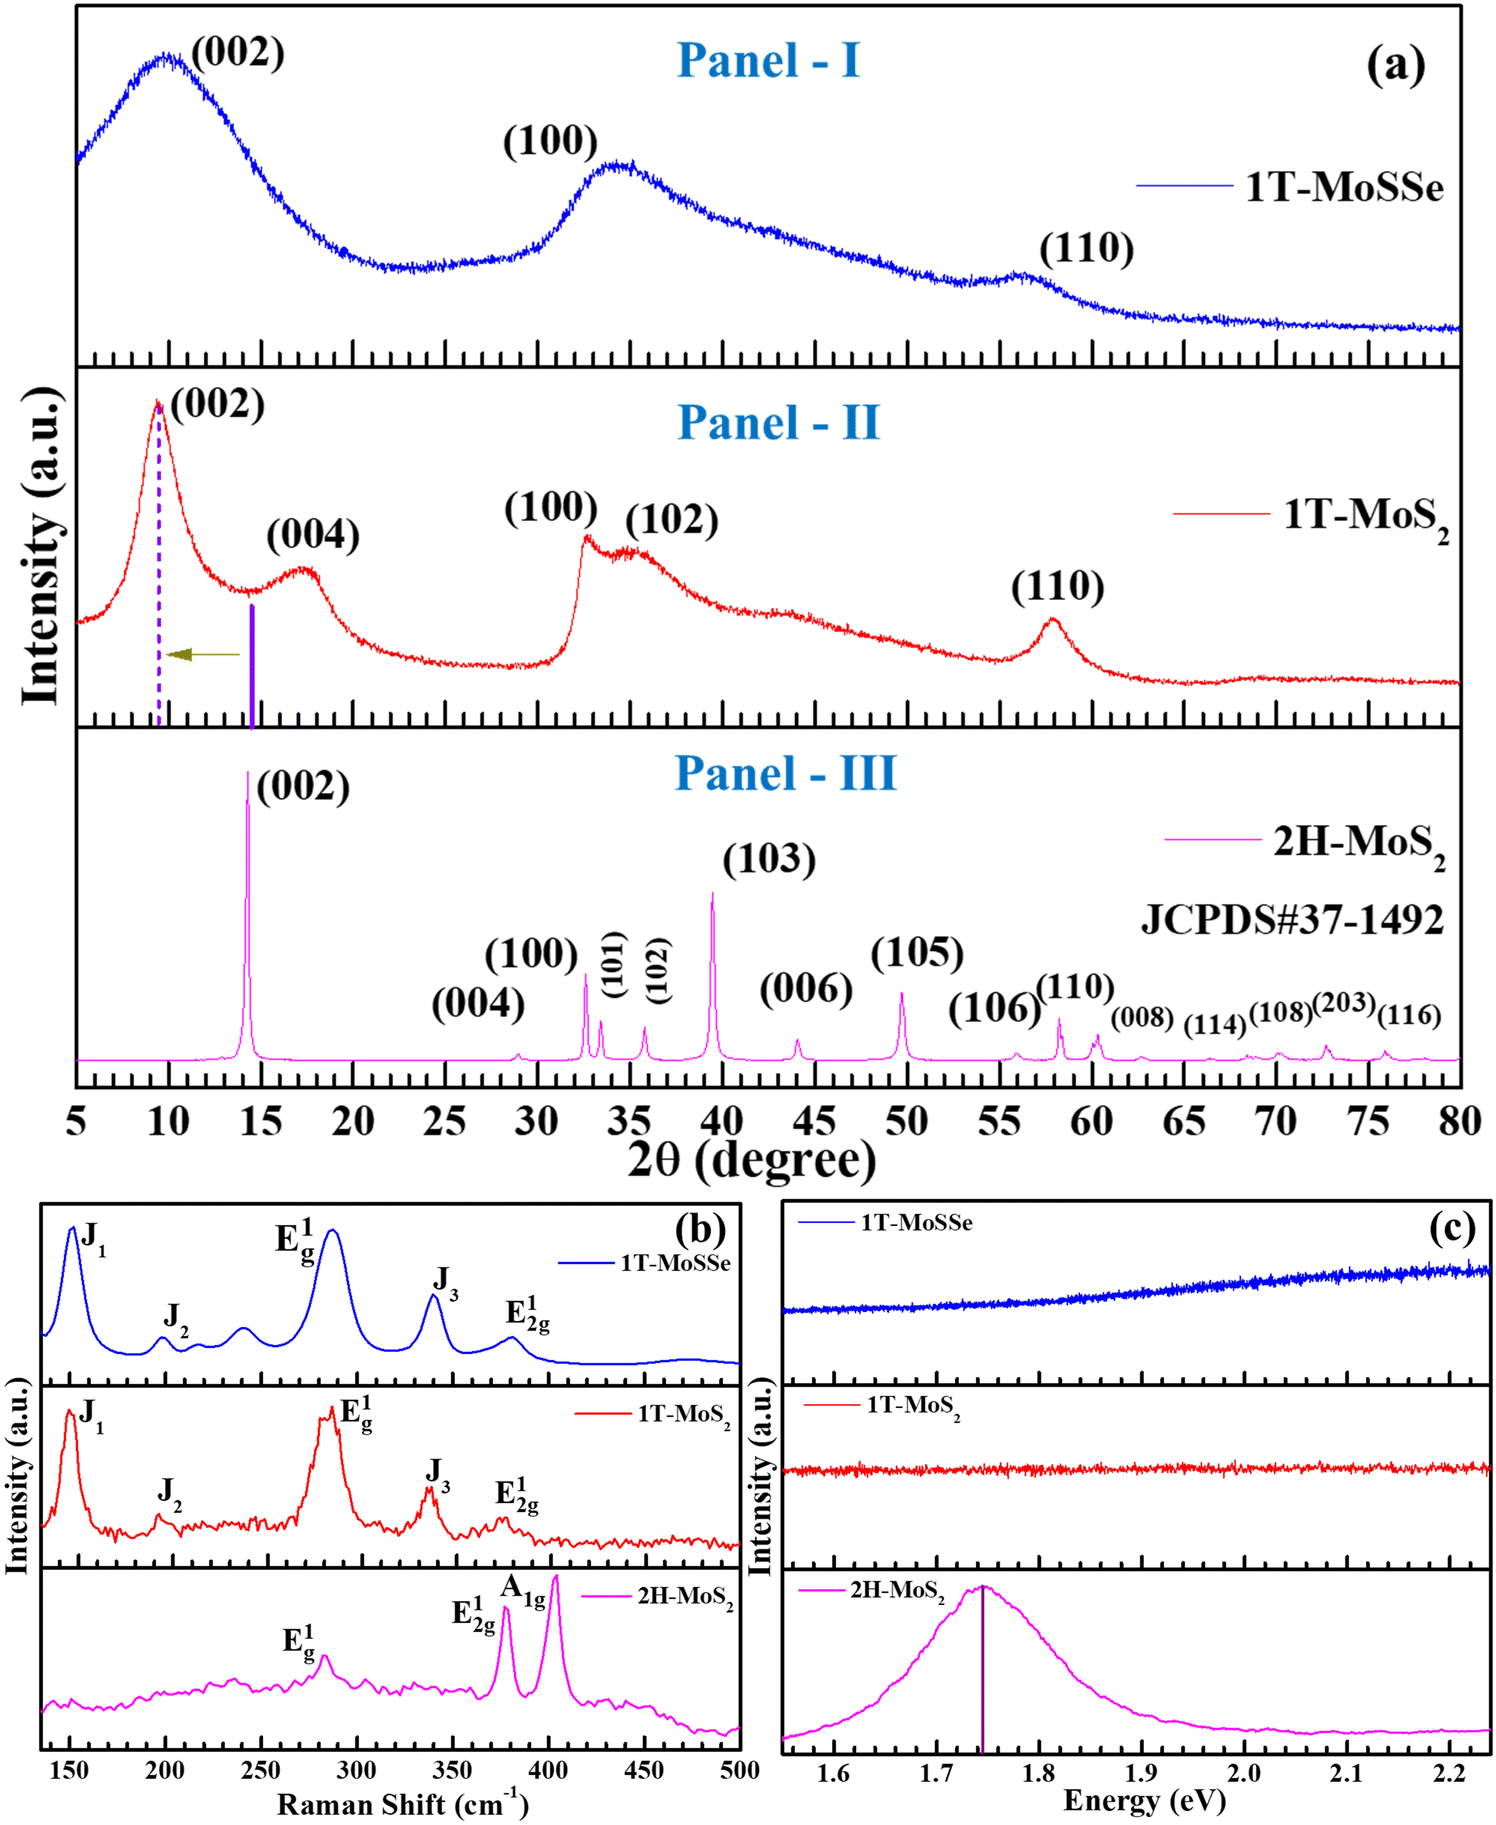 | ||
| Fig. 1 (a) XRD patterns of (I) 1T-MoSSe, (II) 1T-MoS2, and (III) commercial 2H-MoS2, highlighting a shift of the (002) peak to lower 2θ in the 1T phase. (b) Raman spectra of 1T-MoS2 and 1T-MoSSe showing characteristic 1T phase peaks (J1, J2, and J3) absent in the 2H phase. (c) PL spectra of 1T-MoS2 and 1T-MoSSe showing no significant peaks, in contrast to 2H-MoS2, which exhibits a peak at 1.74 eV. | ||
The Raman spectra of the synthesized MoS2 clearly demonstrate phase differentiation between the 2H and 1T structures as shown in Fig. 1(b). In the 2H-MoS2 sample, two prominent peaks are observed: one at 380 cm−1, corresponding to the E12g mode, which arises from the in-plane opposite vibrations of two sulfur atoms relative to the molybdenum atom, and the other at 404 cm−1, attributed to the A1g mode, associated with the out-of-plane vibrations of sulfur atoms in opposite directions.47 However, in the case of the as-prepared 1T-MoS2 sample, the E12g peak at 380 cm−1 is present, its intensity is significantly diminished, and the A1g peak at 404 cm−1 is entirely absent. Instead, the Raman spectrum exhibits signature peaks at around 147 cm−1 (J1), 196 cm−1 (J2), 284 cm−1 (E1g), and 335 cm−1 (J3), characteristic of the 1T phase.48 Among these, the E1g peak, associated with the octahedral coordination of molybdenum in the 1T phase, is particularly notable. The strong intensities of the J1, E1g, and J3 peaks further confirm the dominance of the 1T phase in the sample, indicating that the phase transition from 2H to 1T has been successfully achieved. Similarly, the Raman spectra of the as-grown MoSSe sample follow the same trend, displaying the characteristic peaks of the 1T structure, affirming its phase.49 The absence of the A1g peak and the pronounced presence of J1, J2, E1g, and J3 peaks in both MoS2 and MoSSe indicate that the synthesis method has predominantly resulted in the formation of the 1T phase for both the materials. This transition is vital for their enhanced catalytic and electronic properties. The 2H phase of MoS2 is semiconducting in nature with a band gap of around 1.8 eV, whereas 1T-MoS2 is metallic.
Fig. 1(c) shows the PL spectroscopy results of the 1T-MoS2 and MoSSe samples along with the 2H MoS2 sample. It is evident from the spectra that the as-synthesized samples of the 1T phase are metallic in nature since no PL emission is observed, confirming the 1T phase formation for MoS2 and MoSSe. On the other hand, a desired emission peak is observed at ∼1.75 eV for the 2H phase, suggesting its semiconducting nature.
For the further structural confirmation of the as-synthesized material 1T-MoSSe, HRTEM analysis was performed. The TEM images with different magnifications and scales are shown in Fig. 2(a)–(c), where a flake-type morphology is observed. The HRTEM image depicted in Fig. 2(d) displays clear individual planes of 1T-MoSSe. The lattice d-spacing between two consecutive planes was calculated from the HRTEM images using ImageJ software at the 5 nm scale, which is ∼0.44 nm as illustrated in Fig. 2(e), consistent with the (002) planes of MoSSe. This value is consistent with the theoretical and experimental reports of Janus structures, confirming successful synthesis. The clear lattice fringes suggest high crystallinity, which is crucial for ensuring efficient electron transport during catalysis. The interplanar spacing is slightly larger than that of pure MoS2 (typically ∼0.32 nm), reflecting the influence of selenium incorporation. The selected area electron diffraction (SAED) pattern was calculated (Fig. 2(f)) and showed the characteristic rings corresponding to (100), (002), and (110) planes of 1T-MoSSe, which are very well matched with the diffraction planes from the XRD results.
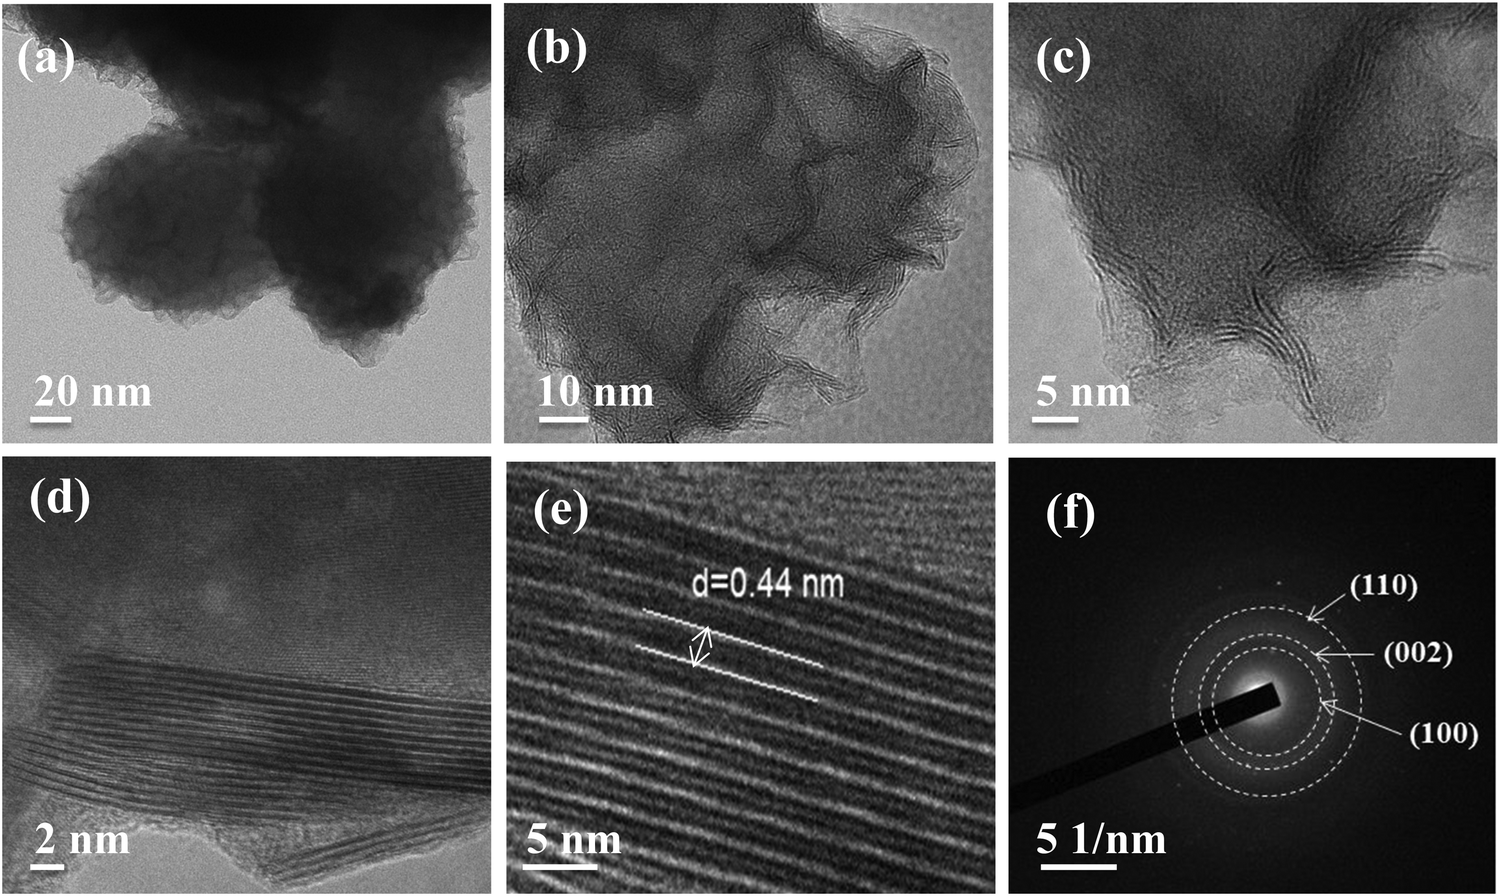 | ||
| Fig. 2 (a)–(c) TEM images, (d) HRTEM image, and (e) HRTEM image showing an interplanar spacing of 0.44 nm, and (f) SAED pattern of 1T-MoSSe. | ||
As shown in Fig. 3(a), the peaks in the XPS spectrum of the Mo 3d orbitals correspond to the binding energies of Mo 3d5/2 and Mo 3d3/2. The deconvolution reveals contributions from the 1T phase (blue curves) and the 2H phase (green curves). The 1T phase shows lower binding energies compared to the 2H phase due to the electron-rich metallic nature of 1T-MoS2, which reduces the core-level binding energies. The identification of these peaks validates the presence of mixed phases and emphasizes the stabilization of the 1T phase, which is essential for catalytic activities like the HER. The literature corroborates that the 1T phase typically has higher catalytic activity due to the increased electron density and active sites compared to the semiconducting 2H phase.50
 | ||
| Fig. 3 The XPS spectra for 1T-MoS2 of (a) Mo 3d orbitals, (b) Mo 3p orbitals, and (c) S 2p orbitals. The XPS spectra for 1T-MoSSe: (d) survey scan and of (e) S 2p as well as Se 2p orbitals, and (f) Mo 3d orbitals. | ||
The Mo 3p XPS spectra in Fig. 3(b) similarly show contributions from the 1T and 2H phases. The Mo 3p3/2 and Mo 3p1/2 peaks (blue and green) reflect the spin–orbit splitting characteristic of molybdenum. The lower binding energies of the 1T phase peaks further confirm the metallic nature of this polymorph. The proximity of these peaks to their 2H counterparts signifies the phase coexistence, which could aid HER activity through synergistic effects. The S 2p spectrum (Fig. 3(c)) shows the doublet corresponding to S 2p3/2 and S 2p1/2 due to spin–orbit coupling. The peaks for the 1T phase (red) appear at slightly lower binding energies than the 2H phase, consistent with the metallic character of the 1T phase, as sulfur atoms in 1T-MoS2 experience a higher electron density. This peak separation is consistent with earlier studies, e.g., the study by Chhowalla et al.,51 which reported the distinct chemical environments of sulfur in different phases.
The introduction of selenium (Se) into the lattice to form Janus 1T-MoSSe induces new spectral features as can be seen in the survey scan depicted in Fig. 3(d). As shown in Fig. 3(e), peaks for Se 2p3/2 and Se 2p1/2 (purple and cyan) appear at distinct binding energies due to the heavier atomic mass and different electronegativity of Se compared to S. The shift in S 2p peaks (green and red) suggests changes in the local electronic environment upon Se substitution, corroborating successful Janus heterostructure formation. For 1T-MoSSe, the Mo 3d5/2 and Mo 3d3/2 peaks show splitting similar to 1T-MoS2 but with subtle shifts due to the introduction of Se as presented in Fig. 3(f). The chemical shift is attributed to the stronger Mo–Se bonds compared to Mo–S bonds, as Se has a larger covalent radius and lower electronegativity. Such shifts are indicative of structural asymmetry and heterostructure formation, which are vital for optimizing the electronic and catalytic properties for the HER.
The combination of XPS and HRTEM results validates the phase-selective hydrothermal synthesis for 1T-MoS2 and solvothermal synthesis for Janus 1T-MoSSe. The presence of 1T and Janus structures is confirmed through binding energy shifts, spectral deconvolutions, and interplanar spacings. Such structural and electronic modifications enhance the HER activity by providing more active sites, improving conductivity, and optimizing the hydrogen adsorption free energy (ΔGH+). Earlier studies, such as the study by Voiry et al.,52 have demonstrated the superior catalytic performance of 1T and Janus structures, which is consistent with these findings.
3.2. Electro-catalytic activities toward the HER
The electrocatalytic HER performance of the MoS2 sample was evaluated under acidic conditions using 0.5 M H2SO4 as an electrolyte, in a standard three-electrode setup. The working electrode comprised the MoS2 or MoSSe samples, which were supported on a conductive substrate, typically a glassy carbon electrode (GCE). A high-surface-area platinum electrode served as a counter electrode, while the reference electrode used was Ag/AgCl in 3 M KCl. Cyclic voltammetry (CV) and linear sweep voltammetry (LSV) methods were employed to assess the HER activity, with measurements conducted at a scan rate of 100 mV s−1 for CV and 5 mV s−1 for LSV. This configuration allows for precise evaluation of the electrocatalytic properties of the samples, including overpotential, current density, and the overall efficiency of the hydrogen evolution process, providing critical insights into the catalytic behaviour of the materials under acidic conditions.Cyclic voltammetry (CV) measures the current response as a function of applied potential, allowing the determination of the onset potential, overpotential, and electrochemical activity for the HER. Fig. 4(a) presents the CV curves of 2H-MoS2, 1T-MoS2, and 1T-MoSSe, recorded at a scan rate of 0.1 V s−1 with a sensitivity of 0.002 A V−1. A significant increase in the current density is observed from 2H-MoS2 to 1T MoS2, with a further substantial increase for 1T-MoSSe, showing current densities of 18.95 mA cm−2, 68.57 mA cm−2, and 285.24 mA cm−2, respectively, at −0.74 V within the same potential window. Similar to CV, LSV provides insights into the onset potential and overpotential for the HER. From the LSV curves (Fig. 4(b)), a gradual decrease in overpotential is observed, with values dropping from 684.44 mV for 2H-MoS2 to 391.65 mV for 1T-MoS2 and further to 87.8 mV for 1T-MoSSe at a current density of 10 mA cm−2. These results establish 1T-MoSSe as the most efficient HER catalyst, with an overpotential of 87.8 mV, which approaches the performance of the Pt/C reference electrode (45.5 mV). Previous studies indicate that 2H-MoS2 is active mainly at the edge planes, while 1T-MoS2 is active on both basal and edge planes, explaining its superior HER activity.14,35 The enhanced catalytic performance of MoSSe is attributed to its Janus structure, where sulfur and selenium atoms create an intrinsic dipole,53 improving charge separation54 and optimizing hydrogen adsorption.55 The presence of Se also fine tunes the binding energy,56 further boosting the reaction kinetics and reducing the overpotential for the HER. The alloyed Janus structure brings the hydrogen adsorption free energy closer to the thermodynamically ideal value, leading to improved catalytic performance.40 Fig. 4(c) presents the Tafel plots for the samples, with the Tafel slope serving as a key indicator of reaction kinetics. It reflects how the current density changes with respect to the applied potential, offering insights into the rate-determining step and overall reaction kinetics.57 The Tafel plots are fitted to the Tafel equation:
|
η = blogj + a,
| (2) |
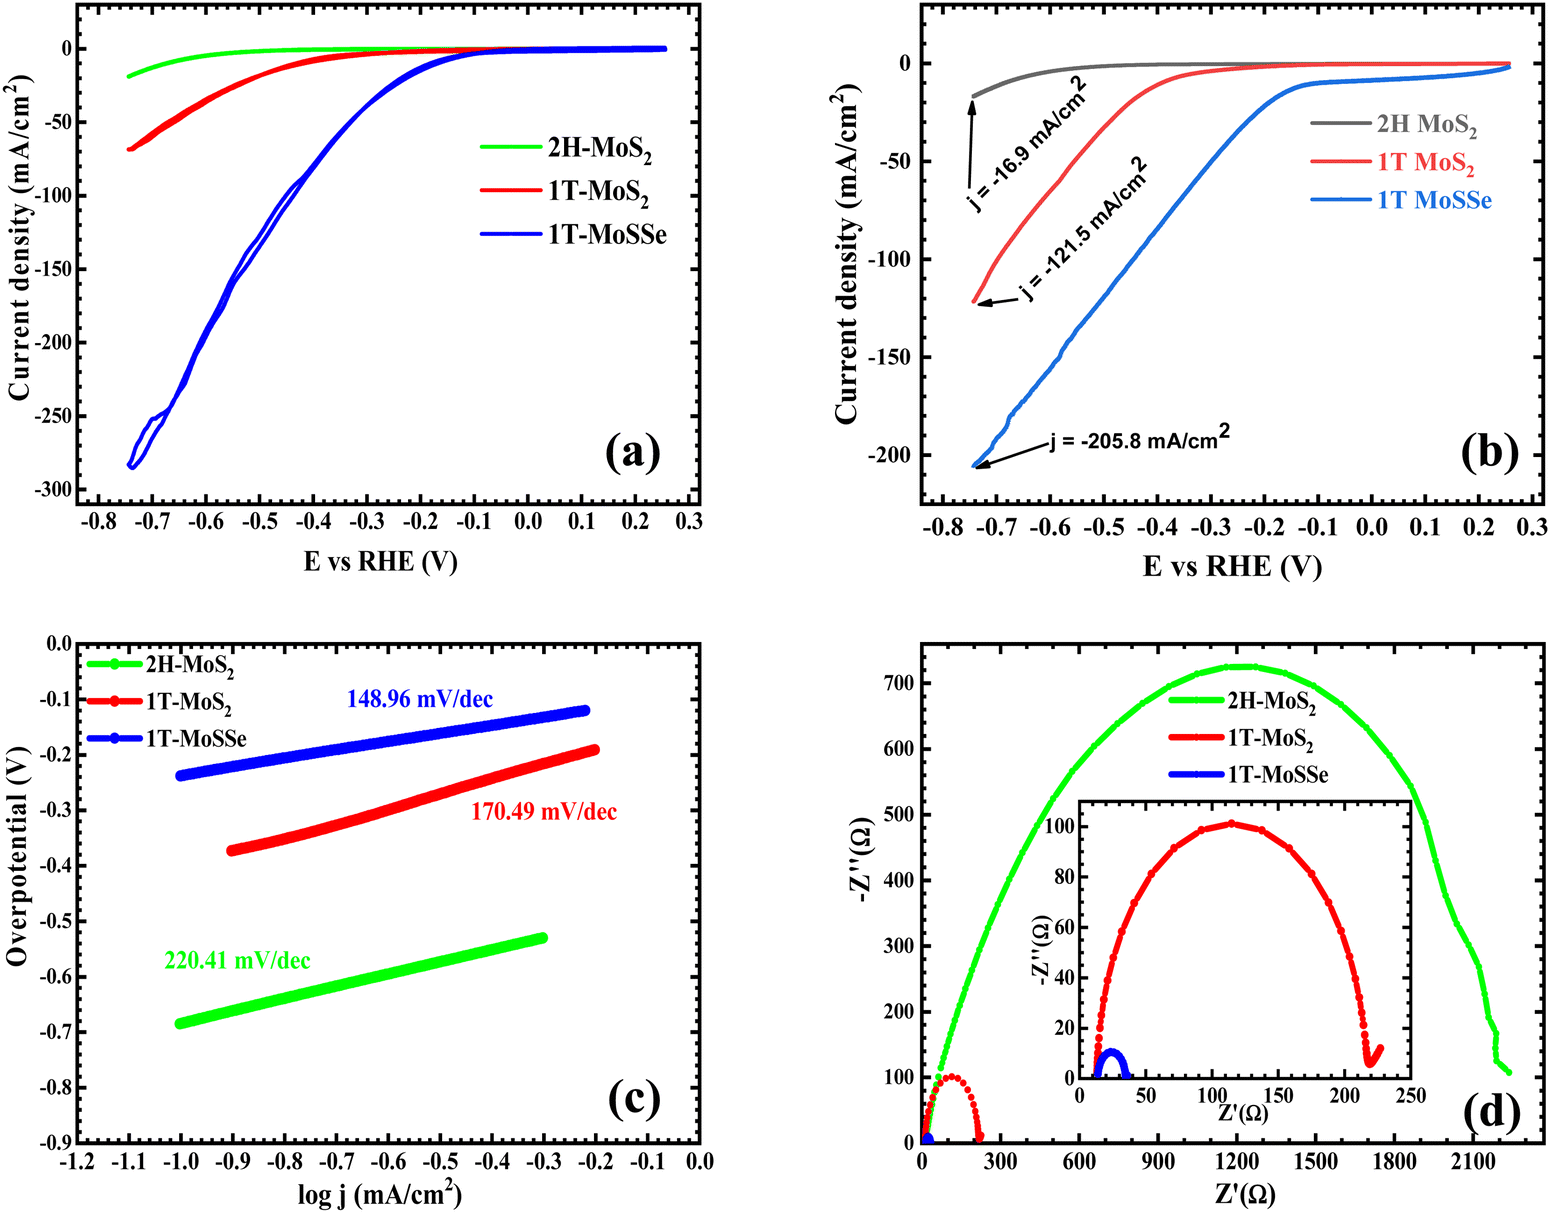 | ||
| Fig. 4 (a) HER CV curves, (b) LSV comparison, (c) Tafel slopes, and (d) electrochemical impedance spectroscopy (EIS) spectra for 2H-MoS2 (green), 1T-MoS2 (red) and 1T-MoSSe (blue) samples. The inset shows impedance spectra in the range of 0 to 250 Ω along with the equivalent circuit for the EIS. | ||
Electrochemical impedance spectroscopy (EIS) is a powerful technique for investigating the impedance response at the electrode–electrolyte interface, particularly in electrocatalytic reactions like the HER. EIS provides critical insights into charge transfer resistance (Rct), a key parameter that reflects the ease with which electrons are transferred between the electrode and the reactants during the HER process. Fig. 4(d) presents the EIS plots for three materials: 2H-MoS2, 1T-MoS2, and 1T-MoSSe. Each plot shows a semi-circular shape, which is characteristic of charge transfer resistance in electrochemical systems. Among the three, 2H-MoS2 exhibits the largest semi-circle, corresponding to a significantly higher Rct value, which is measured at 750 Ω. A lower Rct value indicates more efficient electron transfer and faster reaction kinetics, both of which are essential for optimizing the performance of a catalyst. This high Rct suggests that electron transfer is hindered in 2H-MoS2, resulting in slow HER kinetics. This outcome is consistent with the semiconducting nature of 2H-MoS2, where charge transport is limited primarily to the edge sites, leaving the basal plane inactive for catalytic processes. In contrast, 1T-MoS2, with an Rct value of 202 Ω, shows a substantial reduction in charge transfer resistance compared to 2H-MoS2. The metallic nature of the 1T phase provides a more favourable environment for electron transfer, activating both the basal and edge planes for the HER. This improvement in conductivity and activation of more catalytic sites results in better HER performance, which is reflected in the lower Rct value. The most remarkable finding is for 1T-MoSSe, which exhibits an Rct value of only 21 Ω, an order of magnitude lower than that of 1T-MoS2. This dramatic reduction in charge transfer resistance highlights the enhanced catalytic performance of 1T-MoSSe. The Janus structure of MoSSe, with sulfur and selenium atoms on opposite sides of the molybdenum layer, creates an intrinsic dipole that further improves charge separation and electron mobility. Additionally, the mixed composition of sulfur and selenium provides optimal hydrogen adsorption energies, leading to more efficient catalytic activity. The stark differences in Rct values between 2H-MoS2, 1T-MoS2, and 1T-MoSSe demonstrate a clear trend: as the materials transition from the semiconducting 2H phase to the metallic 1T phase and further to the Janus structure of 1T-MoSSe, there is a significant improvement in charge transfer kinetics. This is evidenced by the progressively lower Rct values, with 1T-MoSSe showing the fastest electron transfer and, consequently, the highest HER efficiency. In conclusion, 1T-MoSSe exhibits the lowest charge transfer resistance and superior HER kinetics, making it a far more efficient and effective hydrogen evolution catalyst compared to both 2H-MoS2 and 1T-MoS2. The observed Rs value, or solution resistance, for 2H-MoS2 is 202 Ω, while both 1T-MoS2 and 1T-MoSSe have significantly lower Rs values of 13 Ω. This notable difference in Rs signifies that 1T-MoS2 and 1T-MoSSe exhibit much better electrical conductivity compared to 2H-MoS2. In electrochemical processes like the HER, a lower Rs value indicates lower resistance to ionic and electronic transport within the electrolyte and between the electrode and the electrolyte. This results in more efficient charge transfer processes. The higher Rs value for 2H-MoS2 suggests that its semiconducting nature hinders efficient electron movement through the material, leading to poor conductivity. In contrast, 1T-MoS2 and 1T-MoSSe, being metallic, allow for faster and more efficient electron flow, leading to lower Rs values and improved performance in electrocatalytic applications like the HER. The much lower Rs in 1T-MoS2 and 1T-MoSSe implies that they are more suitable for the HER, as their superior conductivity allows for better electron transport, reducing energy loss and enhancing reaction kinetics. This also highlights the advantage of the 1T phase and the Janus structure (in the case of MoSSe) over the 2H phase in terms of electrochemical performance. Overall, these results clearly demonstrate that 1T-MoSSe has, with its drastically reduced Rct value, the lowest Tafel slope and the highest current density and the considerably lower overpotential value offers significantly superior HER kinetics, which makes 1T-MoSSe the most efficient hydrogen evolution catalyst compared to both 2H- and 1T-MoS2.
To evaluate the practical viability of 1T-MoSSe as a hydrogen evolution catalyst, long-term stability tests and electrochemical active surface area (ECSA) measurements were conducted. Long-term stability assessments are crucial to determine the catalyst's durability under continuous operation, ensuring consistent performance over extended periods. ECSA measurements were performed to quantify the number of electrochemically active sites available for catalysis, which directly correlates with the catalyst's efficiency in promoting the hydrogen evolution reaction. These tests provide comprehensive insights into both the operational longevity and the active site accessibility of 1T-MoSSe, which are critical factors in assessing its effectiveness for large-scale H2 production.
Fig. 5(a) presents the chronoamperometry curve of 1T-MoSSe measured at a fixed potential of −0.6 V vs. RHE over a duration of 3 hours. The stable current density, without noticeable degradation or fluctuations, indicates excellent electrochemical stability under prolonged HER operation. To further validate the durability, an extended chronoamperometry test was conducted for 5 hours under identical conditions. The corresponding data, shown in Fig. S4 of the ESI,† reaffirm the long-term operational stability of 1T-MoSSe. Similarly, Fig. 5(b) presents the LSV curves taken before and after 5000 cycles, revealing no noticeable change in current density, further demonstrating the catalyst's durability for extended use. Moreover, to assess the ECSA, CV graphs at different scan rates were analyzed, as shown in Fig. 5(c). The measured electrochemical double-layer capacitance (Cdl), used as a proxy for ECSA, for 1T-MoSSe was approximately 11.68 mF cm−2, as depicted in Fig. 5(d), indicating a large surface area with abundant active sites, thereby confirming the catalyst's efficient charge transfer and faster kinetics for hydrogen production. These results highlight the material's practical potential for long-term applications in the HER.
 | ||
| Fig. 5 (a) Chronoamperometry (i–t) curve for 1T-MoSSe at an onset potential of −0.6 V for 3 h, (b) electrochemical durability curves recorded for the 1st cycle and after 5000 cycles, (c) CV measurements for ECSA in the non-faradaic region (between −0.15 V and 0.01 V) of 1T-MoSSe at various scan rates of 10, 20, 40, 60, 80, and 100 mV s−1 in 0.5 M H2SO4, and (d) charging current density differences plotted against scan rate. | ||
The solvothermal synthesis of Janus 1T-MoSSe offers significant advantages as a HER catalyst compared to other MoS2 polymorphs listed in Table 1. While materials such as 1T-MoS2 quantum dots and hybrid 1T/2H-MoS2 nano-flowers exhibit impressive HER performances with lower Tafel slopes and onset potentials, the Janus structure of 1T-MoSSe distinguishes itself through its unique catalytic features. It demonstrates an overpotential of 87.8 mV at 10 mA cm−2 and a Tafel slope of 148 mV dec−1, outperforming most hydrothermally synthesized counterparts. The Janus structure, characterized by asymmetric chalcogen atoms (S and Se), introduces an intrinsic dipole moment, optimizing hydrogen adsorption energy and enhancing charge transfer dynamics. Compared to 1T-MoS2, its Janus counterpart provides additional active sites, lower electrochemical impedance (21 Ω), and enhanced stability over 10000 cycles. These features result in more efficient and durable catalytic activity. Unlike complex synthesis methods (e.g., lithium intercalation or chemical vapor deposition), our hydrothermal and solvothermal approach is straightforward, scalable, and environmentally benign. This synthesis method, coupled with the structural advantages of Janus TMDs, positions 1T-MoSSe as a cost-effective and highly efficient alternative for sustainable hydrogen production. These findings underline the potential of Janus materials in advancing HER technologies.
| MoS2 polymorph | Synthesis technique | ηHER (mV) −10 mA cm−2 | Tafel slope (mV dec−1) | Ref. |
|---|---|---|---|---|
| 1T-MoS2 nanosheets | Lithium intercalation | 187 | 43 | 35 |
| 1T@2H-MoS2 | Template-assisted strategy by RGO | 126 | 35 | 36 |
| Co array bound to 1T MoS2 nanosheets | Assembly/leaching process | 42 | 32 | 37 |
| MoS2 nanofoam catalyst co-confining selenium onto the surface and cobalt in the inner layer | 3-Step chemical synthesis process over the SiO2 template | 104 | 67 | 38 |
| Hybrid 1T/2H-MoS2 nano-flower | Solvothermal process with DMF | 146.6 | 71.7 | 58 |
| Hydrothermal process with a guest ion agent (ammonium bicarbonate) | 214.1 | 66.6 | ||
| 1T/2H-MoS2 | NH4+ intercalation – hydrothermal method | 234 | 46 | 59 |
| Porous 1T-MoS2 | Liquid ammonia-assisted lithiation route | 153 | 43 | 60 |
| 1T/2H-MoS2 – hierarchical nanorods | NH4+ intercalation – hydrothermal method | 156 | 47.9 | 61 |
| 1T-MoS2 quantum dots | Electrochemical Li+ – intercalation | 92 | 44 | 62 |
| MoS2(1−x)Se2x nanobelts | Chemical vapor deposition method | 139 (@20 mA cm−2) | 65 | 63 |
| MoSSe@RGO nanocomposite heterostructures | Chemical vapor transport followed by liquid exfoliation followed by self-assembly through the hydrothermal process | 153 | 51 | 64 |
| MoS2(1−x)Se2x alloys | High temperature solid state reaction technique | ∼200 | 56 | 65 |
| 2H-MoS2xSe2(1−x) nanosheets | Hydrothermal synthesis | 136 | 50 | 41 |
| 1T-MoSSe | Solvothermal synthesis | 87.8 | 148 | This work |
3.3. DFT calculations
To demonstrate the catalytic activity of the prepared materials, we performed DFT calculations as implemented in the VASP code and the details of the computation are given in the ESI.†66 From our experiment, we have considered 2H-MoS2, 1T-MoS2, MoSSe, and MoSeS for the DFT study. All the modelled surfaces are shown in Fig. 6(a)–(d).
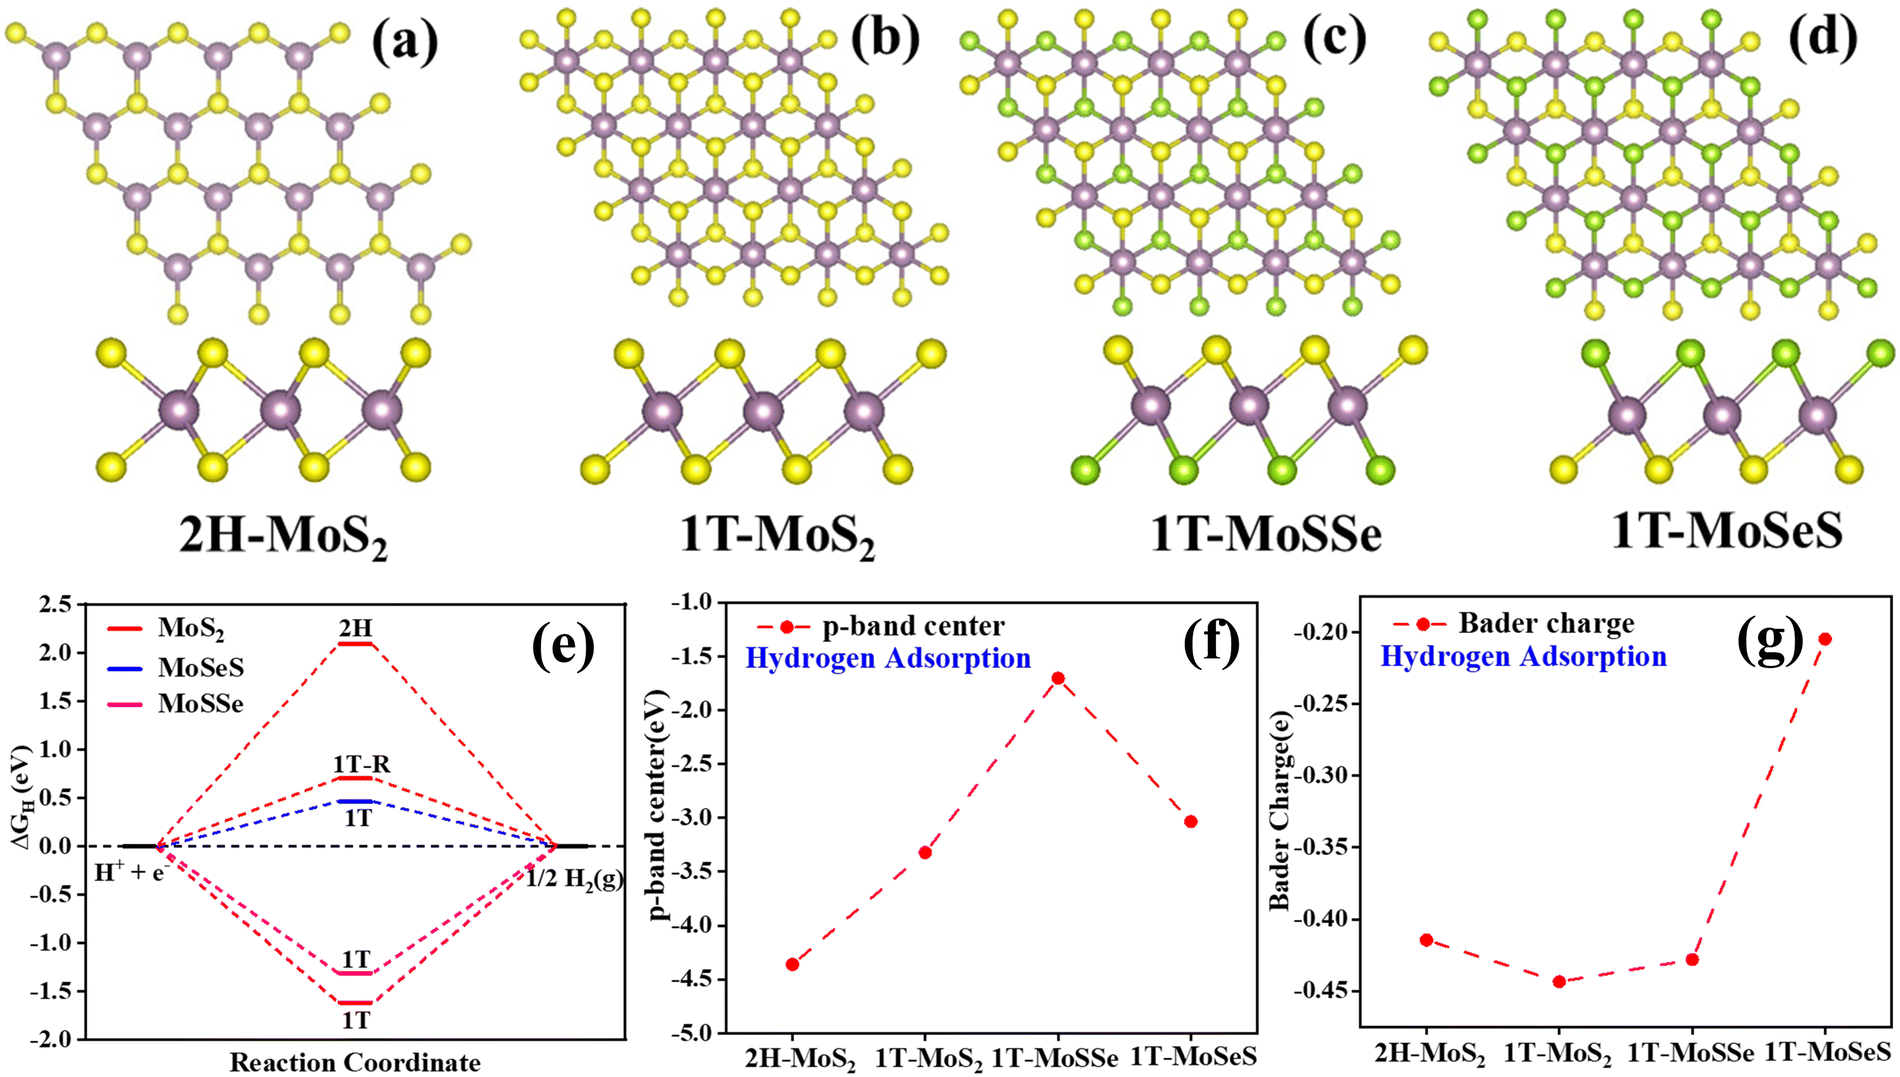 | ||
| Fig. 6 The top and side views of (a) 2H-MoS2, (b) 1T-MoS2, (c) 1T-MoSSe, and (d) 1T-MoSeS. (e) Calculated free energy diagram for the HER at a potential of U = 0 relative to the standard hydrogen electrode. The 1T-R is for reconstruction corrected ΔGH of 1T-MoS2. (f) The p-band center of the catalysts with respect to the Fermi level. (g) Bader charges on the S/Se atom (considered for hydrogen adsorption) from the catalyst surface. | ||
The ΔGH of a catalyst surface is considered to be a theoretical descriptor to evaluate the HER activity. It is well established that the closer the absolute value of ΔGH to zero, the better the HER activity.67,68 So, we performed a DFT calculation to evaluate the ΔGH of our catalyst. In this study, H atoms were absorbed on the S/Se atom of the 2H-MoS2, 1T-MoS2, 1T-MoSSe, and 1T-MoSeS surface as shown in Fig. 6(e). We found a strong hydrogen adsorption value for the 1T phase. It is due to the high instability of this phase which undergoes reconstruction during hydrogen adsorption, which is in line with the previous findings.69 Janus 1T-MoSeS is the best catalyst in our studied series with an absolute ΔGH value of 0.46 eV. Furthermore, the Bader charge analysis depicted in Fig. 6(g) shows the lowest charge present on the Se atom of the MoSeS Janus material among the studied catalysts. As the hydrogen atom directly interacts with the S/Se atom, we calculated the p-band center of the catalyst (Fig. 6(f)), to correlate it with the S/Se–H bond strength. The p-band center of the Janus materials is upshifted from their pristine counterpart. It is observed that up-shifting in the p-band center helps in optimum hydrogen adsorption.
A tactical analysis has been performed based on some strategic observations of the DFT results to explain why Janus 1T-MoSeS shows the best catalytic properties for hydrogen evolution among the materials, which is depicted in Fig. 7(a). The derived results are shown in tabular form in Table S1 of the ESI.† For 1T-MoSeS, significant changes in bond length are observed upon hydrogen adsorption. Without hydrogen adsorption, the Mo(1)–Se/S bonds are longer compared to other materials, although with hydrogen adsorption, the bond lengths slightly decrease but still show a considerable variation compared to 2H-MoS2 and 1T-MoS2. The larger bond lengths in 1T-MoSeS indicate a more stretched lattice, which can reduce rigidity and enhance the ability to interact with adsorbed hydrogen atoms. Nonetheless, the bond angles in 1T-MoSeS show substantial changes. Without hydrogen adsorption, the Mo(1)–Se–Mo(2) and Mo(2)–Se–Mo(1) angles deviate significantly from 90° (76.40°). With hydrogen adsorption, the angles approach a more distorted but stabilized geometry (e.g., ∼96° for one angle). Such changes in bond angles upon adsorption suggest a moderate coupling between the adsorbed hydrogen and the electronic structure of the material, which is vital for the HER. Also, the lattice distortion facilitates charge redistribution, which is crucial for the HER.
 | ||
| Fig. 7 (a) The DFT results showing the change in the values of bond lengths and bond angles of (i) 2H-MoS2, (ii) 1T-MoS2, (iii) 1T-MoSeS, and (iv) 1T-MoSSe with the adsorption of a hydrogen atom. (b) A schematic representation of the plausible mechanism responsible for the HER. | ||
The significant changes in bond lengths and angles upon hydrogen adsorption indicate that the lattice structure of 1T-MoSeS undergoes notable distortion, enhancing electronic conductivity and charge transfer.70 This also bolsters the fact that the Gibbs free energy of hydrogen adsorption (ΔGH) for 1T-MoSeS is closer to the optimal value (∼0 eV) compared to the other materials, which suggests that hydrogen adsorption and desorption occur more readily on 1T-MoSeS, facilitating the efficient HER. Also, the mixed chalcogen environment in 1T-MoSeS (Se and S atoms) contributes to a unique electronic structure that promotes selective and efficient HER activity. Other materials like 2H-MoS2 and 1T-MoS2 show fewer structural changes and suboptimal adsorption energies, indicating their relatively low catalytic efficiency.
The plausible mechanism of the hydrogen evolution reaction (HER) on MoSeS involves a sequence of crucial steps, as depicted in Fig. 7(b). Initially, water molecules (H2O) from the surrounding electrolyte are adsorbed onto the active sites of the MoSeS surface. These active sites are predominantly located on both the basal and edge planes of the 1T-MoSeS sheets, with selenium (Se) sites playing a particularly important role due to their enhanced reactivity and ability to facilitate the HER process effectively. Following the adsorption, the adsorbed water molecules undergo protonation, wherein protons (H+) from the electrolyte interact with the adsorbed water species. This step involves the transfer of an electron from the MoSeS catalyst to the protonated water molecules, leading to the formation of hydrogen atoms (H*) adsorbed onto the Se sites. The electron transfer is facilitated by the metallic 1T phase of MoSeS, which offers superior electrical conductivity and active site accessibility.
Subsequently, two adsorbed hydrogen atoms (H*) on adjacent or nearby Se sites combine to form molecular hydrogen (H2). This step, known as the Volmer step, represents the coupling of H* species into a stable H2 molecule. The formation of molecular hydrogen is critical, as it is the primary output of the HER process. In the final stage, the formed H2 molecule desorbs from the surface of MoSeS, which regenerates the active sites for further HER. This desorption step is referred to as the Tafel step, ensuring the release of H2 gas into the electrolyte or surrounding environment and resetting the catalyst surface to continue the catalytic cycle. The seamless progression through these steps – adsorption, protonation, H* coupling, and desorption – is key to the efficiency of MoSeS as a catalyst for the HER. The overall process highlights the catalytic significance of selenium sites in optimizing hydrogen evolution performance by enhancing both the adsorption and desorption kinetics. The combination of significant lattice distortions, near-optimal Gibbs free energy, and the synergistic effects of selenium and sulfur makes 1T-MoSeS the most effective material for the hydrogen evolution reaction among the materials studied. Its ability to facilitate electron transfer through structural flexibility underpins its superior catalytic performance.
4. Conclusions
In this study, we successfully synthesized the 1T phase of MoS2 and Janus 1T-MoSSe via a phase-selective hydrothermal and solvothermal method, respectively, and evaluated their performance in the electrocatalytic HER. The metallic 1T-MoS2 demonstrated superior catalytic performance compared to the semiconducting 2H phase due to its enhanced conductivity and increased density of active sites. A further improvement was achieved with the asymmetric Janus 1T-MoSSe structure, which exhibited an overpotential of 87.8 mV at 10 mA cm−2 and a Tafel slope of 148 mV dec−1, outperforming 1T-MoS2. Electrochemical impedance spectroscopy revealed a lower charge transfer resistance of 21 Ω for 1T-MoSSe, ensuring efficient charge transport during the HER. Additionally, the 1T-MoSSe catalyst displayed remarkable durability, maintaining stability for over 10000 cycles and 5 hours of continuous operation. High-resolution characterization techniques confirmed the structural integrity and phase stability of these materials. Also, the DFT calculations confirm 1T-MoSeS as the most effective catalyst, exhibiting an optimal hydrogen adsorption free energy (ΔGH) of 0.46 eV. The Bader charge analysis highlights the lowest charge on the Se atom in the MoSeS Janus material, while the upshifted p-band center in the Janus structure, relative to its pristine counterpart, enhances hydrogen adsorption by optimizing the S/Se–H bond strength. The exceptional catalytic performance of 1T-MoSeS in the hydrogen evolution reaction arises from a combination of substantial lattice distortions, near-optimal Gibbs free energy, and the synergistic interplay between selenium and sulfur. Its structural flexibility enhances electron transfer, making it the most efficient material among those studied. The synergistic effect of phase engineering and Janus structural asymmetry enhances the catalytic efficiency, making the 1T-MoSSe material a promising candidate for HER applications. These results provide critical insights into the design of advanced electrocatalysts for sustainable hydrogen production.
Author contributions
KM contributed to conceptualization, experimental work, writing the draft, investigations, experiments, and data acquisition. CS contributed to data acquisition of the electrochemical experiments for the HER and review and editing. NJH contributed to theoretical studies for the HER. SKS contributed to supervision of the software and theoretical studies for the HER. AHJ contributed to supervision of the electrochemical experiments for the HER. PKN contributed to conceptualization, supervision, funding acquisition, review and editing, and project administration.Data availability
We confirm that all relevant data supporting the findings of our study are available within the manuscript and its ESI.† Any additional data that may be required can be provided upon reasonable request.Conflicts of interest
The authors declare no competing financial interest.Acknowledgements
K. M. acknowledges the postdoctoral fellowship from the Centre for Nano and Material Sciences (CNMS), JAIN (Deemed-to-be University). P. K. N. acknowledges the financial support from the Anusandhan National Research Foundation (ANRF), Government of India, under grant number CRG/2023/002425. P. K. N. also acknowledges the financial support from the Quantum Research Park, IISc Bengaluru, Karnataka, India, with grant no. QuRP, FSID/2024-25/QP/03, and the support from the Institute of Eminence scheme at IIT-Madras, through the 2D Materials Research and Innovation Group.References
- Q. Fu, J. Han, X. Wang, P. Xu, T. Yao, J. Zhong, W. Zhong, S. Liu, T. Gao, Z. Zhang, L. Xu and B. Song, Adv. Mater., 2021, 33, 1907818 CrossRef CAS PubMed.
- S. Mukherjee, S. Biswas, A. Ghorai, A. Midya, S. Das and S. K. Ray, J. Phys. Chem. C, 2018, 122, 12502–12511 CrossRef CAS.
- G. Li, D. Zhang, Q. Qiao, Y. Yu, D. Peterson, A. Zafar, R. Kumar, S. Curtarolo, F. Hunte, S. Shannon, Y. Zhu, W. Yang and L. Cao, J. Am. Chem. Soc., 2016, 138, 16632–16638 CrossRef CAS PubMed.
- H.-Y. Chang, S. Yang, J. Lee, L. Tao, W.-S. Hwang, D. Jena, N. Lu and D. Akinwande, ACS Nano, 2013, 7, 5446–5452 CrossRef CAS PubMed.
- B. Radisavljevic, A. Radenovic, J. Brivio, V. Giacometti and A. Kis, Nat. Nanotechnol., 2011, 6, 147–150 CrossRef CAS PubMed.
- G. Eda, H. Yamaguchi, D. Voiry, T. Fujita, M. Chen and M. Chhowalla, Nano Lett., 2011, 11, 5111–5116 CrossRef CAS PubMed.
- A. Kumar and P. K. Ahluwalia, Mater. Chem. Phys., 2012, 135, 755–761 CrossRef CAS.
- R. Addou, S. McDonnell, D. Barrera, Z. Guo, A. Azcatl, J. Wang, H. Zhu, C. L. Hinkle, M. Quevedo-Lopez, H. N. Alshareef, L. Colombo, J. W. P. Hsu and R. M. Wallace, ACS Nano, 2015, 9, 9124–9133 CrossRef CAS PubMed.
- Y. Wang, J. Z. Ou, S. Balendhran, A. F. Chrimes, M. Mortazavi, D. D. Yao, M. R. Field, K. Latham, V. Bansal, J. R. Friend and S. Zhuiykov, ACS Nano, 2013, 7, 10083–10093 CrossRef CAS PubMed.
- W. Zhao, J. Pan, Y. Fang, X. Che, D. Wang, K. Bu and F. Huang, Chem. – Eur. J., 2018, 24, 15942–15954 CrossRef CAS PubMed.
- Z. D. Lei, J. Zhan, L. Tang, Y. Zhang and Y. Wang, Adv. Energy Mater., 2018, 8, 1703482 CrossRef.
- L. Cai, J. He, Q. Liu, T. Yao, L. Chen, W. Yan, F. Hu, Y. Jiang, Y. Zhao, T. Hu, Z. Sun and S. Wei, J. Am. Chem. Soc., 2015, 137, 2622–2627 CrossRef CAS PubMed.
- M. Acerce, D. Voiry and M. Chhowalla, Nat. Nanotechnol., 2015, 10, 313–318 CrossRef CAS PubMed.
- D. Voiry, M. Salehi, R. Silva, T. Fujita, M. Chen, T. Asefa, V. B. Shenoy, G. Eda and M. Chhowalla, Nano Lett., 2013, 13, 6222–6227 CrossRef CAS PubMed.
- S. Wang, D. Zhang, B. Li, C. Zhang, Z. G. Du, H. M. Yin, X. F. Bi and S. B. Yang, Adv. Energy Mater., 2018, 8, 1801345 CrossRef.
- W. Zhao and F. Ding, Nanoscale, 2017, 9, 2301–2309 RSC.
- L. Li, J. Chen, K. Wu, C. Cao, S. Shi and J. Cui, Nanomaterials, 2019, 9, 1366 CrossRef CAS PubMed.
- A. Ambrosi, Z. Sofer and M. Pumera, Chem. Commun., 2015, 51, 8450–8453 RSC.
- J. Jung, H. Bark, D. Byun, C. Lee and D.-H. Cho, 2D Mater., 2019, 6, 025024 CrossRef CAS.
- Q. Tang and D.-e Jiang, Chem. Mater., 2015, 27, 3743–3748 CrossRef CAS.
- S. Shi, Z. Sun and Y. H. Hu, J. Mater. Chem. A, 2018, 6, 23932–23977 RSC.
- L. Zhang, Z. Yang, T. Gong, R. Pan, H. Wang, Z. Guo, H. Zhang and X. Fu, J. Mater. Chem. A, 2020, 8, 8813–8830 RSC.
- X. Tang and L. Kou, Phys. Status Solidi B, 2022, 259, 2100562 CrossRef CAS.
- L. Zhang, Y. Xia, X. Li, L. Li, X. Fu, J. Cheng and R. Pan, J. Appl. Phys., 2022, 131, 230902 CrossRef CAS.
- D. Er, H. Ye, N. C. Frey, H. Kumar, J. Lou and V. B. Shenoy, Nano Lett., 2018, 18, 3943–3949 CrossRef CAS.
- R. N. Jenjeti, R. Kumar, A. Sellam and S. Sampath, J. Phys. Chem. C, 2021, 125, 8407–8417 CrossRef CAS.
- J.-W. Li, S.-S. Ke, H.-X. Deng, X. Sun, Y. Guo and H.-F. Lü, Chem. Phys., 2022, 555, 111440 CrossRef CAS.
- F. Zhao, J. Li, Y. Chen, M. Zhang and H. Zhang, Appl. Surf. Sci., 2021, 544, 148741 CrossRef CAS.
- H. I. Lee, H.-S. Cho, M. Kim, J. H. Lee, C. Lee, S. Lee, S.-K. Kim, C.-H. Kim, K. B. Yi and W.-C. Cho, Front. Chem., 2021, 9, 787787 CrossRef CAS PubMed.
- S. Li, M. Cai, Y. Liu, C. Wang, R. Yan and X. Chen, Adv. Powder Mater., 2022, 2, 100073 CrossRef.
- S. Ye, W. Shi, Y. Liu, D. Li, H. Yin, H. Chi, Y. Luo, N. Ta, F. Fan, X. Wang and C. Li, J. Am. Chem. Soc., 2021, 143, 12499–12508 CrossRef CAS PubMed.
- J. Cao, Y. Zhang, C. Zhang, L. Cai, Z. Li and C. Zhou, Surf. Interfaces, 2021, 25, 101305 CrossRef CAS.
- B. Hinnemann, P. G. Moses, J. Bonde, K. P. Jørgensen, J. H. Nielsen, S. Horch, I. Chorkendorff and J. K. Nørskov, J. Am. Chem. Soc., 2005, 127, 5308–5309 CrossRef CAS PubMed.
- Q. Tang and D.-E. Jiang, ACS Catal., 2016, 6, 4953–4961 CrossRef CAS.
- M. A. Lukowski, A. S. Daniel, F. Meng, A. Forticaux, L. Li and S. Jin, J. Am. Chem. Soc., 2013, 135, 10274–10277 CrossRef CAS PubMed.
- L. Cai, W. Cheng, T. Yao, Y. Huang, F. Tang, Q. Liu, W. Liu, Z. Sun, F. Hu, Y. Jiang and W. Yan, J. Phys. Chem. C, 2017, 121, 15071–15077 CrossRef CAS.
- K. Qi, X. Cui, L. Gu, S. Yu, X. Fan, M. Luo, S. Xu, N. Li, L. Zheng, Q. Zhang, J. Ma, Y. Gong, F. Lv, K. Wang, H. Huang, W. Zhang, S. Guo, W. Zheng and P. Liu, Nat. Commun., 2019, 10, 5231 CrossRef.
- Z. Zheng, L. Yu, M. Gao, X. Chen, W. Zhou, C. Ma, L. Wu, J. Zhu, X. Meng, J. Hu, Y. Tu, S. Wu, J. Mao, Z. Tian and D. Deng, Nat. Commun., 2020, 11, 3315 CrossRef CAS PubMed.
- Q. Feng, Y. Zhu, J. Hong, M. Zhang, W. Duan, N. Mao, J. Wu, H. Xu, F. Dong, F. Lin, C. Jin, C. Wang, J. Zhang and L. Xie, Adv. Mater., 2014, 26, 2648–2653 CrossRef CAS PubMed.
- Q. Gong, L. Cheng, C. Liu, M. Zhang, Q. Feng, H. Ye, M. Zeng, L. Xie, Z. Liu and Y. Li, ACS Catal., 2015, 5, 2213–2219 CrossRef CAS.
- C. Xu, S. Peng, C. Tan, H. Ang, H. Tan, H. Zhang and Q. Yan, J. Mater. Chem. A, 2014, 2, 5597–5601 RSC.
- J. Kibsgaard, Z. Chen, B. N. Reinecke and T. F. Jaramillo, Nat. Mater., 2012, 11, 963–969 CrossRef CAS PubMed.
- R. Wang, X. Li, T. Gao, T. Yao, S. Liu, X. Wang, J. Han, P. Zhang, X. Cao, X. Zhang, Y. Zhang and B. Song, ChemCatChem, 2019, 11, 3200–3207 CrossRef CAS.
- Q. Liu, X. Li, Q. He, A. Khalil, D. Liu, T. Xiang, X. Wu and L. Song, Small, 2015, 11, 5556–5564 CrossRef CAS PubMed.
- Y. Li, K. Chang, Z. Sun, E. Shangguan, H. Tang, B. Li, J. Sun and Z. Chang, ACS Appl. Energy Mater., 2020, 3, 998–1009 CrossRef CAS.
- W. Ding, L. Hu, J. Dai, X. Tang, R. Wei, Z. Sheng, C. Liang, D. Shao, W. Song, Q. Liu, M. Chen, X. Zhu, S. Chou, X. Zhu, Q. Chen, Y. Sun and S. X. Dou, ACS Nano, 2019, 13, 1694–1702 CAS.
- X. Fan, P. Xu, D. Zhou, Y. Sun, Y. C. Li, M. A. T. Nguyen, M. Terrones and T. E. Mallouk, Nano Lett., 2015, 15, 5956–5960 CrossRef CAS PubMed.
- Y. Fang, J. Pan, J. He, R. Luo, D. Wang, X. Che, K. Bu, W. Zhao, P. Liu, G. Mu, H. Zhang, T. Lin and F. Huang, Angew. Chem., Int. Ed., 2018, 57, 1232–1235 CrossRef CAS PubMed.
- Y. Huang, Z. Wang, M. Guan, F. Wu and R. Chen, Adv. Mater., 2020, 32, 2003534 CrossRef CAS PubMed.
- X. Cong, X.-L. Liu, M.-L. Lin and P.-H. Tan, npj 2D Mater. Appl., 2020, 4, 13 CrossRef CAS.
- M. Chhowalla, H. S. Shin, G. Eda, L.-J. Li, K. P. Loh and H. Zhang, Nat. Chem., 2013, 5, 263–275 CrossRef PubMed.
- D. Voiry, R. Fullon, J. Yang, C. de Carvalho Castro e Silva, R. Kappera, I. Bozkurt, D. Kaplan, M. J. Lagos, P. E. Batson, G. Gupta, A. D. Mohite, L. Dong, D. Er, V. B. Shenoy, T. Asefa and M. Chhowalla, Nat. Mater., 2016, 15, 1003–1009 CrossRef CAS PubMed.
- F. Li, W. Wei, H. Wang, B. Huang, Y. Dai and T. Jacob, J. Phys. Chem. Lett., 2019, 10, 559–565 CrossRef CAS PubMed.
- W. Yin, B. Wen, Q. Ge, D. Zou, Y. Xu, M. Liu, X. Wei, M. Chen and X. Fan, Prog. Nat. Sci.: Mater. Int., 2019, 29, 335–340 CrossRef CAS.
- W. J. Yin, B. Wen, G. Z. Nie, X. L. Wei and L. M. Liu, J. Mater. Chem. C, 2018, 6, 1693–1700 RSC.
- P. Khichi, P. Siwach, L. Gaba, V. Kumar, J. Kumar, A. Ohlan and R. Tripathi, FlatChem, 2024, 30, 46 Search PubMed.
- Q. Yin, Z. Xu, T. Lian, D. G. Musaev, C. L. Hill and Y. V. Geletii, Catalysts, 2021, 11, 87 CrossRef CAS.
- Y. Zhang, Y. Kuwahara, K. Mori, C. Louis and H. Yamashita, Nanoscale, 2020, 12, 11908–11915 RSC.
- D. Wang, X. Zhang, S. Bao, Z. Zhang, H. Fei and Z. Wu, J. Mater. Chem. A, 2017, 5, 2681–2688 RSC.
- Y. Yin, J. Han, Y. Zhang, X. Zhang, P. Xu, Q. Yuan, L. Samad, X. Wang, Y. Wang, Z. Zhang, P. Zhang, X. Cao, B. Song and S. Jin, J. Am. Chem. Soc., 2016, 138, 7965–7972 CrossRef CAS PubMed.
- C. Wang, H. Wang, Z. Lin, W. Li, B. Lin, W. Qiu, Y. Quan, Z. Liu and S. Chen, CrystEngComm, 2019, 21, 1984–1991 RSC.
- W. Chen, J. Gu, Q. Liu, R. Luo, L. Yao, B. Sun, W. Zhang, H. Su, B. Chen, P. Liu and D. Zhang, ACS Nano, 2018, 12, 308–316 CrossRef CAS PubMed.
- L. Yang, W. Wang, Q. Fu, J. Zhang and B. Xiang, Electrochim. Acta, 2015, 185, 236–241 CrossRef CAS.
- B. Konkena, J. Masa, W. Xia, M. Muhler and W. Schuhmann, Nano Energy, 2016, 29, 46–53 CrossRef CAS.
- V. Kiran, D. Mukherjee, R. N. Jenjeti and S. Sampath, Nanoscale, 2014, 6, 12856–12863 RSC.
- G. Kresse and J. Furthmüller, Comput. Mater. Sci., 1996, 6, 15–50 CrossRef CAS.
- J. K. Nørskov, T. Bligaard, A. Logadottir, J. R. Kitchin, J. G. Chen, S. Pandelov and U. Stimming, J. Electrochem. Soc., 2005, 152, J23 CrossRef.
- J. Greeley, T. F. Jaramillo, J. Bonde, I. B. Chorkendorff and J. K. Nørskov, Nat. Mater., 2006, 5, 909–913 CrossRef CAS PubMed.
- J. Zhu, Z.-C. Wang, H. Dai, Q. Wang, R. Yang, H. Yu, M. Liao, J. Zhang, W. Chen, Z. Wei, N. Li, L. Du, D. Shi, W. Wang, L. Zhang, Y. Jiang and G. Zhang, Nat. Commun., 2019, 10, 1348 CrossRef PubMed.
- P. M. Austeria, P. V. Babu and S. Sampath, J. Phys. Chem. C, 2020, 124, 11669–11680 CrossRef.
Footnote |
| † Electronic supplementary information (ESI) available. See DOI: https://doi.org/10.1039/d5ma00395d |
| This journal is © The Royal Society of Chemistry 2025 |