
 Open Access Article
 This Open Access Article is licensed under a
 Creative Commons Attribution 3.0 Unported Licence
Thermodynamic and kinetic study of the effect of LiCl and NaCl on the thermal dehydrogenation of Ca(AlH4)2†
Franziska Habermanna,
Anneliese Wirtha,
Konrad Burkmann a,
Jakob Krausb,
Bianca Störra,
Hartmut Stöckercd,
Jürgen Seidela,
Jens Kortusb,
Roman Gumeniukc,
Klaus Bohmhammela and
Florian Mertens*a
a,
Jakob Krausb,
Bianca Störra,
Hartmut Stöckercd,
Jürgen Seidela,
Jens Kortusb,
Roman Gumeniukc,
Klaus Bohmhammela and
Florian Mertens*a
aInstitut für Physikalische Chemie, TU Bergakademie Freiberg, Lessingstraße 45, 09599 Freiberg, Germany. E-mail: florian.mertens@chemie.tu-freiberg.de; Tel: +493731393737
bInstitut für Theoretische Pysik, TU Bergakademie Freiberg, Leipziger Straße 23, 09599 Freiberg, Germany
cInstitut für Experimentelle Pysik, TU Bergakademie Freiberg, Leipziger Straße 23, 09599 Freiberg, Germany
dCenter for Efficient High Temperature Processes and Materials Conversion, TU Bergakademie Freiberg, Winklerstraße 5, 09599 Freiberg, Germany
First published on 13th May 2025
Abstract
The presented work sets out to investigate the dehydrogenation behaviour of Ca(AlH4)2 + 2MCl (M = Li, Na) mixtures. In contrast to the by-product NaCl, which does not affect the decomposition of Ca(AlH4)2, LiCl influences its dehydrogenation onward from the formation of CaAlH5. Thermodynamic calculations were used to support and explain these findings as well as to investigate the potential of Ca(AlH4)2 and CaAlH5 for reversible hydrogen storage applications. For this purpose, their heat capacity functions and absolute entropies were determined in this study.
1 Introduction
In the context of the transition to a renewable energy-based economy, alloys, metal hydrides or complex hydrides are widely discussed regarding their suitability for solid-state hydrogen storage applications.1–11 In this context, light metal complex hydrides have been intensively studied since Bogdanovic and Schwickwardi reported reversible hydrogen storage in Ti-doped NaAlH4.12 However, these investigations were mainly focused on the alkaline metal alanates LiAlH4 and NaAlH4, leaving the alanates of the earth alkaline metals less studied.Ca(AlH4)2 was first synthesised by Finholt et al. in 1955.13 The alanate was prepared in dimethyl ether starting from AlX3 (X = Cl, Br) and CaH2. Since the mechanochemical synthesis route was established for complex hydrides, Ca(AlH4)2 was also produced mechanochemically via metathesis reactions between MAlH4 (M = Li, Na) and CaCl2.14–16
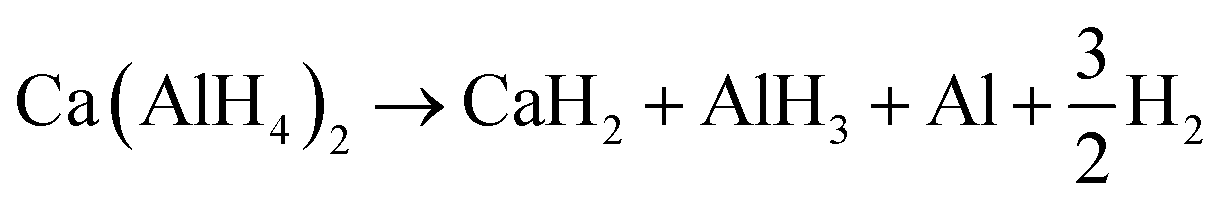
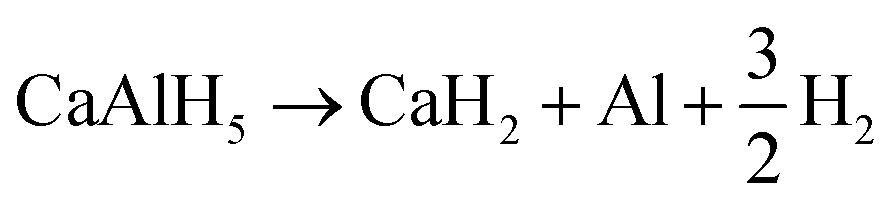
The thermal dehydrogenation of Ca(AlH4)2 proceeds via four steps. First, the alanate decomposes to CaAlH5 and Al (reaction (1)). In the second step CaAlH5 dehydrogenates to CaH2 and Al (reaction (2)). The formed CaH2 decomposes in the following accompanied by the formation of CaAl4 in the third (reaction (3)) and CaAl2 (reaction (4)) in the fourth step. Besides the first step, which occurs exothermically, all other reactions are endothermic.16–18
 | (1) |
 | (2) |
| xCaH2 + 4xAl → xCaAl4 + xH2 | (3) |
| (1 − x)CaH2 + xCaAl4 + (2 − 4x)Al → CaAl2 + (1 − x)H2 | (4) |
Recently, we disproved the common assumption that the by-products of the mechanochemical synthesis of complex hydrides behave inertly by showing that the pathway of the thermal dehydrogenation of Sr(AlH4)2 depends on them.10 In this study, the influence of LiCl and NaCl on the decomposition route and dehydrogenation kinetics of Ca(AlH4)2 was investigated. Thermodynamic computations were employed to support and explain our findings as well as to assess the potential of the complex hydrides for reversible hydrogen storage applications. For that purpose and to complete their thermodynamic characterisation, the heat capacity functions and absolute entropies of Ca(AlH4)2 and CaAlH5 were determined by means of calorimetry and DFT calculations.
2 Experimental
2.1 Materials
All reactions as well as the handling and storage of the samples were performed under dry argon atmosphere using Schlenk line technique or a MBraun glove box (H2O and O2 < 0.1 ppm).Argon was obtained from Nippon Gases specified as 99.999% pure. Sodium aluminium hydride (NaAlH4, Sigma Aldrich, 90%, technical grade) and Copper foil (Cu, Puratronic, 99.999%) were used without further purification. Calcium chloride (CaCl2, Alfa Aesar, >96.0%, anhydrous) was dried before use at 150 °C under an argon purge gas flow in a self-built horizontal tube furnace for 24 h. Lithium aluminium hydride (LiAlH4, abcr, 97%) was purified by first dissolving it in diethyl ether and then filtering off the impurities. Subsequently, the solvent was distilled off in vacuum. The residue was dried in vacuum at 55 °C for 12 h. The used diethyl ether (C4H10O, Honeywell Riedel-de-Haen, 99.8%, p.a.) was dried in a MB SPS-800 drying plant.
2.2 Synthetic procedures
![[thin space (1/6-em)]](https://www.rsc.org/images/entities/char_2009.gif) :2, was performed by means of a Fritsch Pulverisette 6. The milling vial (12 mL) and balls (each 7 g) were made of tungsten carbide. Three balls were used, resulting in a bpr of ca. 40. A milling cycle consisted of 15 min of milling at 500 rpm and a pause of 5 min. For the synthesis of Ca(AlH4)2 + 2NaCl 32 cycles were run adding up to a total milling time of 8 h. Only 12 cycles (3 h of milling) were necessary for the complete conversion of CaCl2 and LiAlH4.
:2, was performed by means of a Fritsch Pulverisette 6. The milling vial (12 mL) and balls (each 7 g) were made of tungsten carbide. Three balls were used, resulting in a bpr of ca. 40. A milling cycle consisted of 15 min of milling at 500 rpm and a pause of 5 min. For the synthesis of Ca(AlH4)2 + 2NaCl 32 cycles were run adding up to a total milling time of 8 h. Only 12 cycles (3 h of milling) were necessary for the complete conversion of CaCl2 and LiAlH4.The phase composition of the cooled down samples was analysed using X-ray diffraction.
2.3 Characterisation techniques
Reference diffractograms from the ICSD19 were used to identify the present phases.
To ensure a good thermal contact between the sample and the sample platform during the measurement, Apiezon N grease was applied. The heat capacity of the encased sample was automatically calculated by the PPMS software Multivu by subtracting the addenda measurements (sample platform and grease) from that of the encased sample (encased sample, sample platform, and grease).22 Using eqn (5) and literature data for copper,23 the heat capacity of the sample was obtained from that of the encased one.
| Cencased samplep = xsampleCsamplep + xCuCCup | (5) |
A DSC 111 (Setaram) was used to carry out heat capacity measurements in the temperature range from 283 K to 360 K. These measurements were performed using a Cp-by-step technique as described in ref. 20. After weighing the samples in under inert atmosphere (144.9 mg Ca(AlH4)2 + 2NaCl and 153.8 mg Ca(AlH4)2 + 2LiCl) they were placed in an aluminium crucible which was then sealed with an aluminium cap. The applied temperature programme consisted of four temperature steps (6 K, 3 K min−1) in the temperature range between 303 K and 363 K and six temperature steps (10 K, 3 K min−1) between 303 K and 363 K. Before and after each temperature step, the temperature was kept constant for one hour. The same method was applied to the sample, the reference (sapphire), and the blank (empty capped aluminium crucible).
The heat capacity of the sample (cp) at the mean temperature of the step was derived using eqn (6). The start and end time of the respective heat flow peak (![[q with combining dot above]](https://www.rsc.org/images/entities/i_char_0071_0307.gif) ) are denoted by ti and ti+1 and the masses of the reference and sample are given by mref and msam. The symbol cp,ref represents the heat capacity of the reference material at the mean temperature of the step. The corresponding data were taken from ref. 24.
) are denoted by ti and ti+1 and the masses of the reference and sample are given by mref and msam. The symbol cp,ref represents the heat capacity of the reference material at the mean temperature of the step. The corresponding data were taken from ref. 24.
 | (6) |
2.4 Calculations using density functional theory (DFT)
Density functional theory (DFT25,26) computations were performed to complement the experimental characterisation techniques. All computations were conducted using the plane-wave Quantum ESPRESSO program,27–29 version 6.7, in combination with PAW pseudopotentials30 obtained from version 1.0.0 of the PSlibrary.31 The generalised-gradient exchange–correlation functional by Perdew, Burke, and Ernzerhof (PBE32) was applied in all cases.3 Results & discussion
3.1 Synthesis of Ca(AlH4)2 + 2MCl (M = Li, Na)
Ca(AlH4)2 + 2MCl samples were synthesised converting CaCl2 and MAlH4 (reactions (7) and (8)). Both samples were characterised using X-ray diffraction. Since only reflections belonging to the expected products (Ca(AlH4)2 and MCl) can be observed in the measured diffractograms (Fig. 1), we deem both syntheses successful.| CaCl2 + 2LiAlH4 → Ca(AlH4)2 + 2LiCl | (7) |
| CaCl2 + 2NaAlH4 → Ca(AlH4)2 + 2NaCl | (8) |
 | ||
| Fig. 1 X-ray powder diffraction patterns of Ca(AlH4)2 + 2MCl (M = Li, Na). | ||
3.2 Thermal dehydrogenation of Ca(AlH4)2 + 2MX (M = Li, Na)
The influence of LiCl and NaCl on the thermal decomposition behaviour of Ca(AlH4)2 was investigated by means of TG-DSC (Fig. 2). It has to be noted that the weight losses were normalised to Ca(AlH4)2 in order to enable a comparison of both mixtures. The theoretical weight losses according to the proceeding of reactions (1)–(4) are indicated by dashed horizontal lines. Since the value of x is unknown, only the weight loss corresponding to both eqn (3) and (4) is depicted. | ||
| Fig. 2 TG-DSC measurements of Ca(AlH4)2 + 2MCl (M = Li, Na), heating rate 5 K min−1, H2 traces are given in a.u. | ||
The total weight loss of both mixtures is smaller than the theoretical one, indicating a minor decomposition of the alanate during the milling procedure.
The proceeding of the thermal dehydrogenation of the Ca(AlH4)2 + 2NaCl mixture agrees with the literature reports.16–18,33 According to both the TG and DSC measurement, the decomposition takes place in four separate steps. As expected, each step is accompanied by a release of hydrogen.
The unknown variable x in the decomposition reactions (3) and (4) was determined to be 0.5 from the ratio of the weight losses associated with the third and fourth step.
The only point where the results differ from the literature reports is the DSC effect belonging to the first dehydrogenation event. Contrary to the literature,16–18 where eqn (1) occurs exothermically, we observe a DSC effect consisting of both an endothermic and an exothermic signal. This behaviour becomes more pronounced at higher heating rates as can be seen in Fig. 6. In recent studies on Mg(AlH4)2 (ref. 9) and Sr(AlH4)2 (ref. 10) we found the DSC events corresponding to their decomposition to be composed of an endo- and exothermic peak as well.
This behaviour indicates two overlapping reactions. Since Ca(AlH4)2 and Sr(AlH4)2 dehydrogenate similarly,34 we propose reactions (9) and (10) based on those suggested for Sr(AlH4)2 in ref. 10. Then, the endothermic signal would result from the dehydrogenation of Ca(AlH4)2 to CaH2 and AlH3 and the exothermic one from the consecutive formation of CaAlH5.
 | (9) |
| CaH2 + AlH3 → CaAlH5 | (10) |
While no significant differences between the decomposition of Ca(AlH4)2 + 2NaCl and Ca(AlH4)2 + 2LiCl are apparent in the first dehydrogenation step, the following decomposition behaviour seems to depend on the halide. Hence, the by-product does not influence the decomposition of Ca(AlH4)2 itself but that of CaAlH5.
The difference in the dehydrogenation behaviour becomes especially apparent in the second decomposition step. In contrast to the NaCl sample, which dehydrogenates in one step, the LiCl mixture decomposes in two sub-steps. Both sub-steps correlate with a hydrogen release. Moreover, the effects associated with the third and fourth step overlap in case of Ca(AlH4)2 + 2LiCl.
Furthermore, the comparison of the onset temperatures of the decomposition reactions (Table 1) shows that the first dehydrogenation event occurs at higher temperatures for the LiCl mixture than for the NaCl one. This difference is probably due to the different milling periods, which result in different particle sizes and thus different decomposition kinetics. Since the NaCl mixture was milled longer, its Ca(AlH4)2 probably dehydrogenates at lower temperatures.
In contrast to the first step, the opposite trend can be observed for the onset temperatures of the second step. Therefore, it seems unlikely that this behaviour is due to different decomposition kinetics. Instead, the proceeding reaction probably changes depending on the by-product.
In order to further investigate the effect of the by-product on the dehydrogenation behaviour, the corresponding decomposition products were identified by means of X-ray diffraction. Since the quality of the X-ray diffraction patterns of the samples after the TG-DSC measurements was poor, samples similar to those had to be synthesised ex situ. For this purpose, the Ca(AlH4)2 + 2MCl mixtures were heated to the respective temperature of interest with a heating rate of 5 K min−1 in a self-built horizontal tube furnace. The X-ray diffraction patterns shown in Fig. 3 and 4 were measured after cooling down the samples.
 | ||
| Fig. 3 X-ray powder diffraction patterns of the decomposition products of Ca(AlH4)2 + 2NaCl. | ||
 | ||
| Fig. 4 X-ray powder diffraction patterns of the decomposition products of Ca(AlH4)2 + 2LiCl. | ||
In the case of the NaCl mixture the decomposition products were identified after the second (290 °C) and fourth step (400 °C). In accordance with the dehydrogenation pathway reported in the literature (reactions (1)–(4)),16–18 reflections of CaH2 and Al were found after decomposing the mixture at 290 °C. The CaAl2 phase, formed at 400 °C, also coincides with the established dehydrogenation reactions.
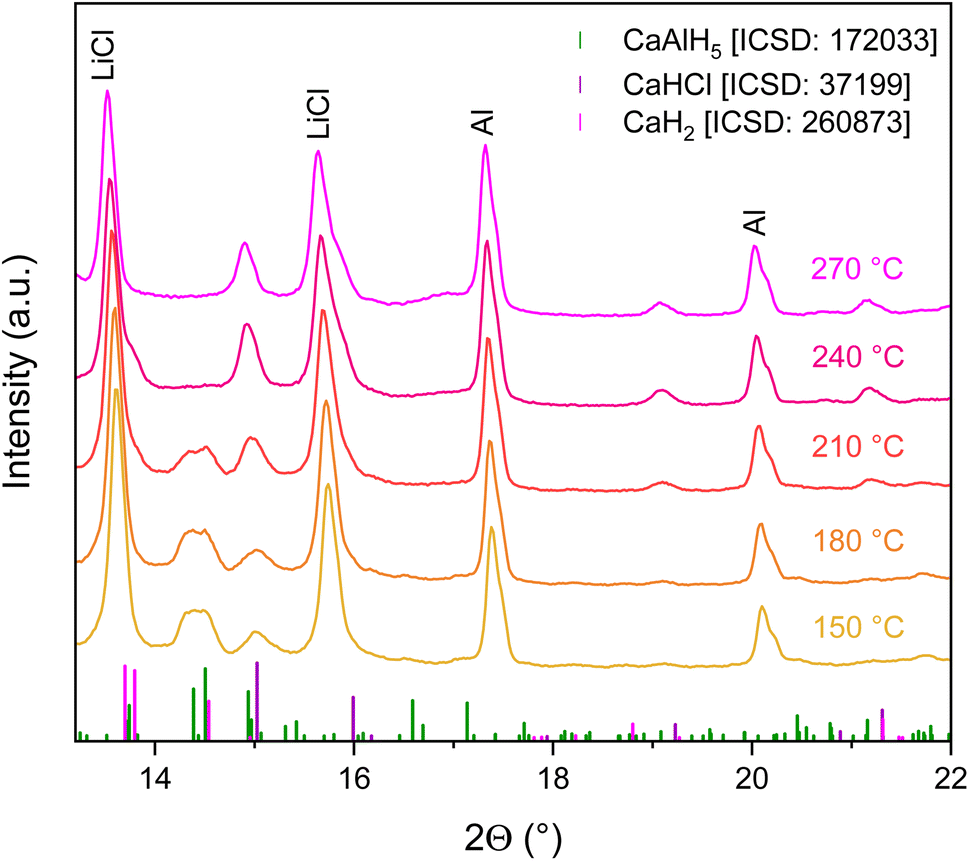
In contrast to Ca(AlH4)2 + 2NaCl, the decomposition of the LiCl mixture appears to be more complex. Considering the TG-DSC measurements, especially the proceeding of the second step which consists of two sub-steps is of interest. Accordingly Ca(AlH4)2 + 2LiCl was decomposed at 260 °C (sub-step 1 of the second step, DSC effect L2.1) and at 290 °C (sub-step 2 of the second step, DSC effect L2.2). Unfortunately, the corresponding diffractograms do not allow a clear understanding of the respective dehydrogenation reactions due to their similarity.
While Al can clearly be detected, the identification of the present hydride phase(s) is difficult due to overlapping reflections. The mixture heated to 260 °C most likely still contains CaAlH5. This assignment seems sensible since the TG measurement shows that CaAlH5 is not yet fully decomposed at 260 °C. Additionally, both dehydrogenation products probably contain CaH2 and CaHCl. Analogously to Sr(AlH4)2 + 2LiCl,10 the CaHCl phase is probably formed from CaH2 and LiCl eqn (11).
| CaH2 + LiCl → CaHCl + LiH | (11) |
Like the Ca(AlH4)2 + 2NaCl mixture, Ca(AlH4)2 + 2LiCl decomposes to CaAl2 in the fourth step.
To further investigate the second dehydrogenation step of the LiCl mixture, the decomposition of Ca(AlH4)2 + 2LiCl was also followed in situ by means of X-ray diffraction. The collected diffractograms are shown in Fig. 5.
 | ||
| Fig. 5 In situ X-ray powder diffraction patterns of the Ca(AlH4)2 + 2LiCl dehydrogenation. | ||
According to these, the decomposition of CaAlH5 appears to be completed at 240 °C under the measuring conditions, as its reflections can no longer be observed at this temperature. Shoulders, which can be assigned to the formation of CaH2 and CaHCl, respectively, emerge on the LiCl reflections at 13.6° and 15.7° with the onset of the CaAlH5 dehydrogenation at 210 °C. Moreover, the intensity of the signal at 15° increases, also indicating the formation of CaHCl. Since the reflections of CaH2 and CaHCl appear at the same temperature, it seems that both hydrides are formed simultaneously from CaAlH5. Hence, these in situ measurements do not allow a significantly deeper understanding of the decomposition pathway of Ca(AlH4)2 + 2LiCl. However, the decomposition of CaAlH5 to Al is confirmed once more by the observed increase of the Al reflection intensities during the in situ decomposition experiment.
3.3 Determination of the apparent activation energy of the Ca(AlH4)2 and CaAlH5 dehydrogenation
In order to verify that the shift in the onset temperatures of the dehydrogenation reactions of the different mixtures is not due to varying decomposition kinetics, the apparent activation energies (Ea) of the respective reactions were determined using Kissinger plots. This method is based on eqn (12),36 where β is the heating rate and TP denotes the peak temperature.
 | (12) |
The Kissinger plots shown in Fig. 6 were derived from the peak temperatures obtained from DSC measurements at different heating rates (2 K min−1, 5 K min−1, 8 K min−1, and 10 K min−1). Two measurements were performed at each heating rate. The exothermic peak was used for the Kissinger plot of the 1st dehydrogenation event.
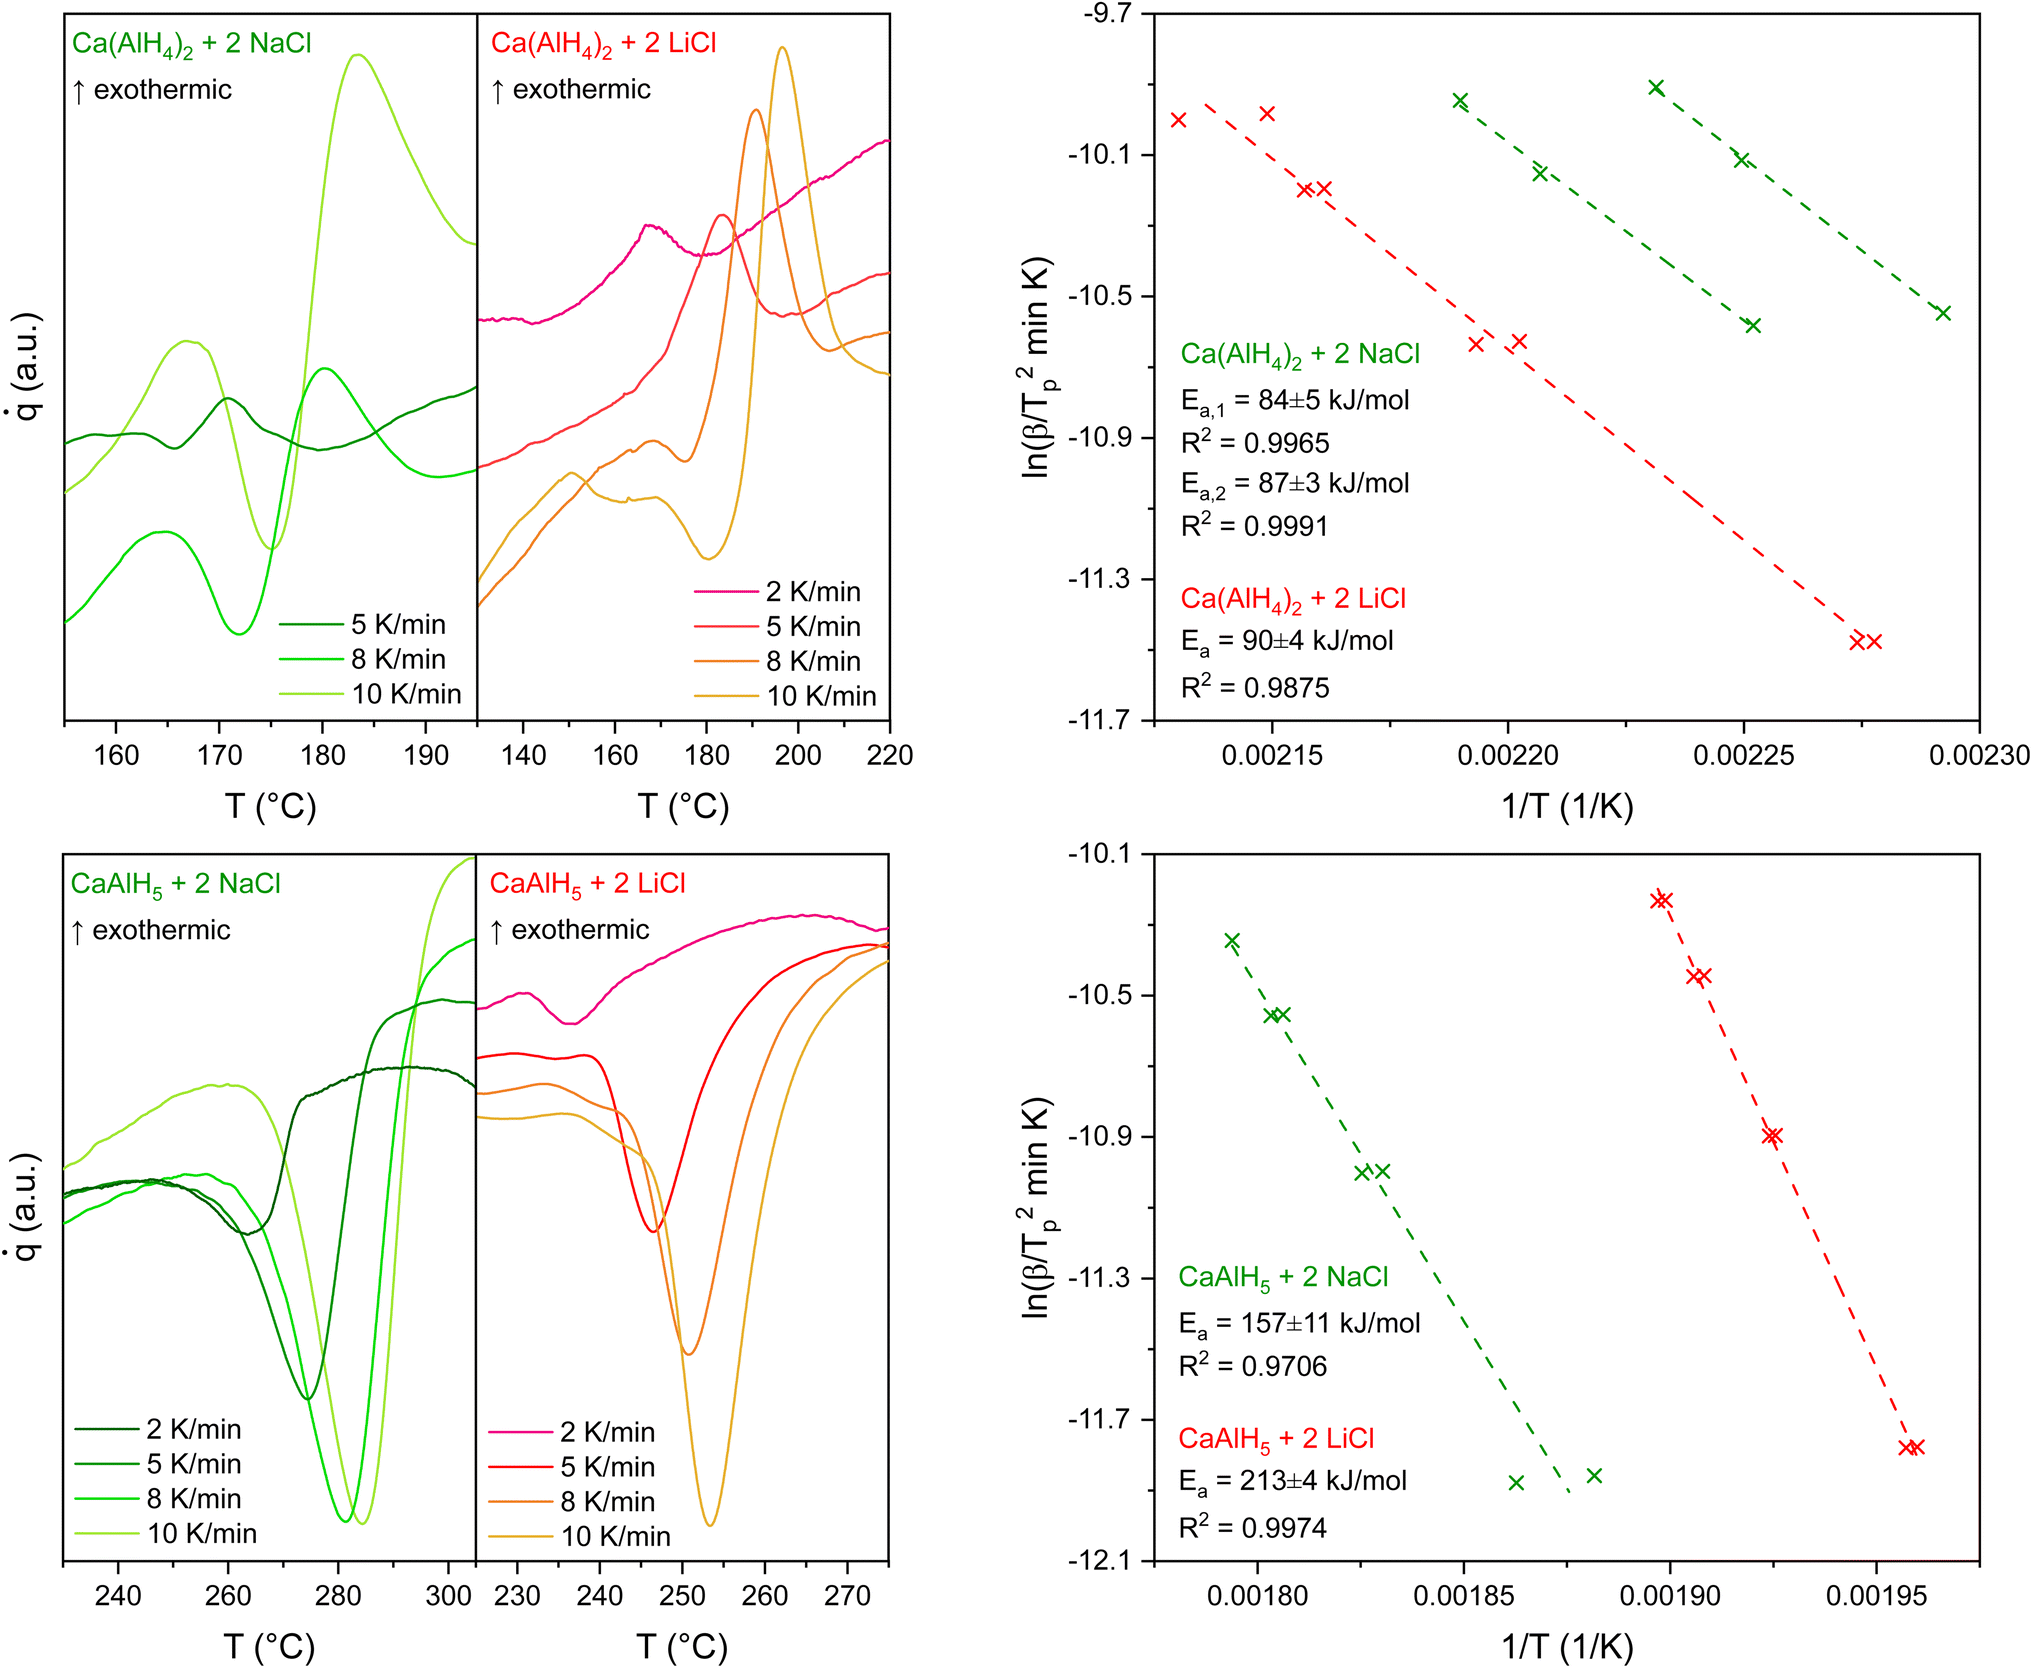 | ||
| Fig. 6 DSC measurements and Kissinger plots for the first (above) and second (beneath) decomposition step of Ca(AlH4)2 + 2MCl (M = Li, Na). | ||
In the case of Ca(AlH4)2 + 2NaCl, the quality of the measurements made at heating rates of 2 K min−1 did not allow the determination of the peak temperature of the first step. Therefore, only the other ones, performed at higher heating rates, were used to generate the corresponding Kissinger plot. Moreover, due to the deviating peak temperatures for the Ca(AlH4)2 decomposition of the NaCl mixture, two different fits were necessary to obtain the apparent activation energy of its dehydrogenation. However, the determined values are in good agreement, so only their mean value is given in Table 2. The obtained apparent activation energies for the decomposition reactions of Ca(AlH4)2 + 2LiCl and Ca(AlH4)2 + 2NaCl are summarised in Table 2.
The results confirm that the first decomposition step is not influenced by the by-product as the respective values are in good agreement. Furthermore, the determined activation energies show that the different milling times do not affect the dehydrogenation kinetics significantly. Therefore, a comparison between the two mixtures is legitimate.
In contrast to the first decomposition step, the values obtained for the second one deviate from each other. Although CaAlH5 + 2LiCl dehydrogenates at lower temperatures than the NaCl mixture (see Table 1), the opposite trend can be observed for the apparent activation energies. Thus, it appears likely that those correspond to different reactions which further supports the previously stated influence of the halides on the dehydrogenation pathway of CaAlH5.
The comparison of the determined activation energies with literature values shows significant differences between those obtained for the first step. The ones determined for the second step lie in the same range. Since apparent activation energies are generally strongly dependent on the synthesis procedure, differences in these are probably the cause of the observed deviations.
3.4 Heat capacity and absolute entropy of Ca(AlH4)2 and CaAlH5
:MCl of 1:2 and using literature heat capacity data for LiCl (0–20 K,38 20–300 K,39 and 300–360 K (ref. 40)) and NaCl,10 the heat capacity of the alanate was obtained from that of the mixture. The determined values are depicted in Fig. 7.
 | (13) |
 | ||
| Fig. 7 Temperature dependency of the molar heat capacity of Ca(AlH4)2 derived from that of the mixtures. The relative deviation of the experimental values from the fitted curve is shown in the insert. | ||
Although this method was already verified in our studies on Mg(AlH4)2 (ref. 9) and Sr(AlH4)2,10 its applicability to Ca(AlH4)2 was checked nevertheless. For this means, the heat capacities of the alanate were calculated from the measurements of both mixtures in the temperature range from 283 K to 360 K. Since the obtained values agree well with each other (see Fig. 7), the applied method is also suitable to determine the heat capacity function of Ca(AlH4)2 from that of Ca(AlH4)2 + 2MCl (M = Li, Na). Additionally, the good agreement of the values indicates that the heat capacity of Ca(AlH4)2 is not affected by the halides NaCl and LiCl.
The measured heat capacities show no indication of the occurrence of phase transitions of Ca(AlH4)2 in the investigated temperature range. After dividing this range in four appropriate intervals, the respective data were fitted using established polynomial functions (eqn (14)–(17)) to obtain the heat capacity of Ca(AlH4)2 as a function of the temperature. The respective fit functions are stated in the following and the determined coefficients are listed in Table 3.
 | (14) |
 | (15) |
 | (16) |
 | (17) |
| T interval (K) | 0–5 | 5–100 | 100–290 | 290–360 |
|---|---|---|---|---|
| a | 7.43414 | 1.69018 × 101 | 3.47691 × 10² | |
| b | 6.56561 × 10⁻⁴ | −1.02199 | 4.38790 × 10⁻¹ | −4.96854 × 10⁻¹ |
| c | 6.57500 × 10⁻² | −7.99252 × 10⁻⁵ | 5.34273 × 10⁻⁴ | |
| d | 4.36985 × 10⁻⁴ | −1.21000 × 10⁻³ | ||
| e | 1.13315 × 10⁻⁵ | |||
| f | −4.66147 × 10⁻⁸ | |||
| g | 3.62645 × 10⁻¹³ | |||
| h | 3.13462 × 101 | −4.38967 × 10⁴ | −9.36430 × 10⁶ | |
| i | −2.50748 × 101 | |||
| R2 | 0.9997 | 1.0000 | 0.9995 | 0.9813 |
| FitStdErr | 0.00026 | 0.01403 | 0.00822 | 1.52100 |
In Fig. 7 the fitted functions are compared to the measured data. The relative deviation of the experimental values from the fit, which is ±14% below 20K and ±2% above 20 K, is shown in the insert of the same graph.
The absolute entropy of Ca(AlH4)2 at 298.15 K was calculated to be 141.3 ± 3.0 J (K mol)−1 from the herein reported heat capacity functions using eqn (18).
 | (18) |
 | ||
| Fig. 8 Temperature dependency of the molar heat capacity of CaAlH5 in comparison to values approximated by the modified Neumann–Kopp rule. The data for the approximation were taken from ref. 42. The relative deviation of the experimental values from the fitted curve is shown in the insert. | ||
To validate the DFT computed heat capacity values, the modified Neumann–Kopp rule, which allows to estimate the heat capacities of complex compounds from the heat capacities of their simple constituents,43 was used. The suitability of the modified Neumann–Kopp rule for estimating the heat capacities of complex aluminium hydrides was already established by us in ref. 10. Consequently, no general review of this approach is provided in this study.
According to the modified Neumann–Kopp rule, the heat capacity of CaAlH5 can be described by the sum of those of CaH2 and AlH3. The required literature data were taken from the HSC database.42 Since no data are available below 298 K and above 500 K for CaH2 and AlH3, respectively, the validation of the computed heat capacity data is only possible in the temperature range between 298 K and 500 K. However, as AlH3 is reported to decompose at 398–473 K,44 the Neumann–Kopp rule was only applied up to a temperature of 398 K. As can be seen from the comparison of the approximated and DFT values depicted in Fig. 8, both methods are generally in good agreement with each other. Therefore, we consider the DFT calculated heat capacities to be realistic.
In order to obtain the heat capacity of CaAlH5 as a function of the temperature, the calculated values were fitted using polynomial functions as described previously for Ca(AlH4)2. The used fit functions can be found in the following and the determined coefficients are summarised in Table 4. A comparison of the fitted functions with the original data as well as the relative deviation between them, which is less than ±3% over the whole temperature range, are shown in Fig. 8.
 | (19) |
 | (20) |
 | (21) |
| T interval (K) | 4–20 | 20–110 | 110–530 |
|---|---|---|---|
| a | −10.52682 | −2.83845 | |
| b | 2.71600 × 10⁻² | 5.41020 × 10⁻¹ | 3.18030 × 10⁻¹ |
| c | −1.29000 × 10⁻³ | −1.65435 × 10⁻⁴ | |
| d | 2.70327 × 10⁻⁴ | ||
| e | −8.13679 × 10⁻⁸ | ||
| f | 1.06475 × 10³ | 3.99282 × 10⁴ | |
| R2 | 1.0000 | 1.0000 | 0.9999 |
| FitStdErr | 2.15 × 10⁻³ | 0.06768 | 0.21586 |
3.5 Thermodynamic evaluation of the influence of LiCl and NaCl on the thermal dehydrogenation of CaAlH5
As both the XRD and kinetic investigations did not provide a full understanding of the influence of the halides on the dehydrogenation of CaAlH5, we performed thermodynamic calculations to gain a deeper insight into their effect. For this purpose, the literature value in ref. 35 for the enthalpy of formation of CaAlH5, which was calculated for 0 K using DFT, was extrapolated to 298.15 K applying Kirchhoff's law (eqn (22)).
 | (22) |
The needed heat capacity data for Ca, Al, and H2 were taken from the references listed in Table 5. If only heat capacity values were reported, those were fitted using eqn (23). The parameters of these fits are stated in Table 5. For CaAlH5 the heat capacity function reported in this study was used. An enthalpy of formation of −240 kJ mol−1 was obtained. It has to be noted, that no reliable heat capacity data are available for H2 below 50 K. However, we consider the resulting uncertainty of the extrapolated enthalpy value to be small due to the small contribution of  at low temperatures.
 | (23) |

| Compound | T1 (K) | T2 (K) | a | b | c | d | e | Ref. |
|---|---|---|---|---|---|---|---|---|
| AlFit | 15 | 80 | −1.180 | 42.456 | 0 | 1133.179 | 0 | 45 |
| 80 | 350 | 21.18 | 24.45 | −1.791 | −30.17 | 7.654 | 46 | |
| 298.15 | 933 | 32.974 | −20.677 | −4.138 | 23.753 | 0 | 42 | |
| AlH3 | 298.15 | 500 | 49.387 | 24.072 | −14.588 | 0.637 | 0 | 42 |
| CaFit | 5 | 45 | −0.695 | 51.370 | 0 | 4064.848 | 0 | 47 |
| Fit | 50 | 150 | 10.220 | 163.293 | −0.136 | −485.063 | 0 | 47 |
| Fit | 150 | 300 | 25.535 | −0.980 | −0.561 | 12.903 | 0 | 47 |
| CaAlNK2 | 298.15 | 716 | 82.259 | −19.136 | −5.603 | 47.499 | 0 | 42 |
| CaAlNK4 | 298.15 | 716 | 148.207 | −60.49 | −13.879 | 95.005 | 0 | 42 |
| CaH2 | 298.15 | 1053 | 29.928 | 37.133 | 0 | 0 | 0 | 42 |
| CaHCl | 308 | 748 | 57.806 | 16.42 | −10.06 | 0 | 0 | 48 |
| H2 | 50 | 298.15 | 22.496 | 17.044 | 0.365 | 11.122 | 0 | 42 |
| 298.15 | 5000 | 25.855 | 4.837 | 1.584 | −0.372 | 0 | 42 | |
| LiCl | 298.15 | 883 | 44.707 | 17.924 | −1.946 | 1.865 | 0 | 42 |
| LiH | 298.15 | 965 | 21.006 | 43.713 | −4.525 | 0.01 | 0 | 42 |
| NaCl | 298.15 | 900 | 56.297 | −13.015 | −3.423 | 21.862 | 0 | 42 |
| NaH | 298.15 | 911 | 31.401 | 35.326 | −4.92 | 0.008 | 0 | 42 |
In the thermodynamic assessment of the effect of LiCl and NaCl on the dehydrogenation of CaAlH5 CaH2, CaHCl, and Al, which were detected in the XRD measurements, were considered as possible decomposition products. Furthermore, presuming a similar behaviour of CaAlH5 and SrAlH5 we assume the formation of CaHCl eqn (24) to proceed analogously to that of SrHCl.10
 | (24) |
In order to evaluate the influence of the two halides, the Gibbs free reaction energies for the possible decomposition reactions were calculated as a function of the temperature using the thermodynamic data listed in Tables 5 and 6. Their temperature dependence is shown in Fig. 9 and 10.
| Compound | ΔFH (298.15 K) (kJ mol−1) | S (298.15 K) (J (K mol)−1) | Ref. |
|---|---|---|---|
| Al | 0 | 28.280 | 42 |
| CaAl2 | −108.000Opt. | 83.065 | 49 |
| CaAl4 | −121.000Opt. | 127.238 | 49 |
| Ca(AlH4)2 | −247 | 141.3 ± 3.0 | 50, 51 and this study |
| CaAlH5 | −240 | 78.0 | 52 and this study |
| CaH2 | −181.558 | 41.401 | 42 and 53 |
| CaHCl | −504.172 | 71.8 | 53 and 54 |
| H2 | 0 | 130.700 | 42 |
| LiCl | −408.270 | 59.300 | 42 |
| LiH | −90.542 | 20.041 | 42 |
| NaCl | −411.120 | 72.132 | 42 |
| NaH | −56.379 | 39.999 | 42 |
 | ||
| Fig. 9 Thermodynamic assessment of the decomposition of CaAlH5 + 2MCl (M = Li, Na). The coloured dotted lines represent the onset temperatures of the second decomposition step of Ca(AlH4)2 + 2MCl. The right figure was created to allow a differentiation of the lines overlapping in the figure on the left. | ||
 | ||
| Fig. 10 Thermodynamic assessment of the decomposition of CaHX (X = H, Cl). The coloured dotted lines represent the onset temperatures of the third decomposition step of Ca(AlH4)2 + 2MCl. | ||
In accordance with the previous investigations, it can be seen in Fig. 9 that NaCl does not affect the dehydrogenation of CaAlH5 as its decomposition to CaH2, Al, and H2 is thermodynamically most likely.
In contrast, when the mixture contains LiCl both the formation of CaHCl and CaH2 are feasible from a thermodynamic point of view as the corresponding Gibbs free energies are very similar in the temperature region of the CaAlH5 + 2LiCl dehydrogenation (see Fig. 9). Thus, the sub-steps of the second dehydrogenation event in the TG-DSC measurements could be the result of the parallel formation of the two hydrides.
Furthermore, we found the apparent activation energies for the decomposition of CaAlH5 + 2LiCl and CaAlH5 + 2NaCl to differ significantly. Therefore, it seems likely that they belong to two different reactions. Since the dehydrogenation of CaAlH5 + 2NaCl to CaH2 occurs at higher temperatures than the decomposition of the LiCl mixture and since the thermodynamic driving force for the formation of CaHCl is initially slightly higher, we believe that the first sub-step belongs to the dehydrogenation of CaAlH5 to CaHCl and the second one to the formation of CaH2.
The thermodynamic calculations depicted in Fig. 10 show that the decomposition of the hydrides CaH2 and CaHCl to first CaAl4 and then to CaAl2 occurs at similar temperatures, respectively. This result agrees with the dehydrogenation behaviour observed in the TG-DSC measurements. It has to be noted, that the enthalpies of formation of CaAl4 and CaAl2 used in the computations were determined by optimising the literature values49 considering their formation temperatures.
Furthermore, the calculations support the notion that NaCl does not alter the decomposition pathway of CaAlH5 as the formation of CaHCl from CaH2 and NaCl is thermodynamically not feasible in the investigated temperature range.
In conclusion, CaAlH5 + 2NaCl dehydrogenates according to the reactions (25)–(27). Thus, the DSC effects N2, N3, and N4 result from eqn (25)–(27), respectively.
 | (25) |
 | (26) |
 | (27) |
In contrast, in the presence of LiCl, CaHCl is formed in addition to CaH2. In this case the DSC effects L2.1 and L2.2 may be assigned to eqn (28) and (29), respectively. The effects L3 and L4 then correspond to eqn (30) and (31).
 | (28) |
 | (29) |
 | (30) |
 | (31) |
As in the case of Sr(AlH4)2, the different effects of LiCl and NaCl on the decomposition behaviour of CaAlH5 are probably the result of the differing thermodynamic stabilities of LiH (ΔFH° (298.15 K) = −90.5 kJ mol−1 (ref. 42)) and NaH (ΔFH° (298.15 K) = −56.4 kJ mol−1 (ref. 42)).10 Due to the high stability of LiH, its formation is thermodynamically favoured. As a consequence, LiCl alters the dehydrogenation pathway of CaAlH5.
3.6 Thermodynamic assessment of the potential of Ca(AlH4)2 and CaAlH5 for reversible hydrogen storage applications
Using the determined thermodynamic data as well as the literature data in Tables 5 and 6, the ability of Ca(AlH4)2 and CaAlH5 to reversibly store hydrogen was evaluated from a thermodynamic point of view by computing their respective dehydrogenation pressures in dependence of the temperature (Fig. 11). For this purpose, the literature values for the enthalpy of formation of Ca(AlH4)2,50,51 which were calculated for 0 K using DFT, were extrapolated to 298.15 K as described previously for CaAlH5. We obtained values of −235 kJ mol−1 and −258.3 kJ mol−1. The presented calculations were made using the mean value of the enthalpies of formation obtained, which is −247 kJ mol−1. | ||
| Fig. 11 Temperature dependency of the hydrogen pressure of the decomposition of Ca(AlH4)2. | ||
Ca(AlH4)2 can be considered unsuitable for reversible hydrogen storage applications due to its high hydrogenation pressure. In contrast, the hydrogenation of CaH2 and Al to CaAlH5 at a pressure of 200 bar is thermodynamically possible up to 200 °C.
Since we were not able to fully clarify the decomposition pathway of CaAlH5 in the presence of LiCl, its hydrogenation behaviour could not be assessed thermodynamically.
4 Conclusions
Within this study we investigated the influence of the by-products LiCl and NaCl on the thermal decomposition of Ca(AlH4)2 by means of X-ray diffraction, the Kissinger method and thermodynamic computations. While we found no effect of the halides on the dehydrogenation of the alanate itself, the decomposition of its dehydrogenation product CaAlH5 depends on the halides. No change of the dehydrogenation pathway occurs in the presence of NaCl. In contrast, the second decomposition step splits into two sub-steps when the mixture contains LiCl. Additionally, CaHCl is formed in this step alongside the normally produced CaH2.Besides the study of the thermal dehydrogenation of Ca(AlH4)2, the alanate and CaAlH5 were characterised thermodynamically. The heat capacity function in the temperature range from 2 K to 360 K and the absolute entropy of Ca(AlH4)2 were determined by means of calorimetry. DFT calculations were used to obtain the heat capacity function (4–530 K) and the absolute entropy of CaAlH5. The values for the absolute entropies of Ca(AlH4)2 and CaAlH5 at 298.15 K are 141.3 ± 3.0 J (K mol)−1 and 78.0 J (K mol)−1, respectively. The enthalpies of formation of Ca(AlH4)2 and CaAlH5 were calculated to be −247 kJ mol−1 and −240 kJ mol−1, respectively.
Finally, the hydrogenation behaviour of the complex hydrides was evaluated thermodynamically. While Ca(AlH4)2 has to be considered unsuited for reversible hydrogen storage applications, reversible hydrogen storage may be achieved in the CaAlH5 system at 200 °C and 200 bar.
Data availability
The data supporting this article have been included as part of the ESI.†Author contributions
Franziska Habermann: investigation, visualization, writing – original draft. Anneliese Wirth: investigation, writing – review & editing. Konrad Burkmann: validation, writing – review & editing. Jakob Kraus: investigation, writing – original draft. Bianca Störr: investigation. Hartmut Stöcker: investigation, writing – original draft. Jürgen Seidel: writing – review & editing. Jens Kortus: resources, writing – review & editing. Roman Gumeniuk: investigation, resources. Klaus Bohmhammel: investigation, writing – review & editing. Florian Mertens: funding acquisition, Resources, writing – review & editing.Conflicts of interest
There are no conflicts to declare.Acknowledgements
The reported research activities have been financially supported by the Deutsche Forschungsgemeinschaft (DFG, project number 449160425). The heat capacity measurements in this study were performed on the DynaCool-12 system acquired within the DFG project 422219901. We also thank the URZ in Freiberg for computational time and support. The computations at the URZ were performed on the computing cluster of the Faculty of Mathematics and Computer Science of the Technische Universität Bergakademie Freiberg; this cluster is funded by the DFG (project number 397252409). Additionally, we thank Dirk Meyer for providing the Bruker D8 Advance X-ray diffractometer for the in situ measurements at the Centre for Efficient High Temperature Processes and Materials Conversion.References
- M. Hirscher, V. A. Yartys, M. Baricco, J. Bellosta von Colbe, D. Blanchard, R. C. Bowman, D. P. Broom, C. E. Buckley, F. Chang, P. Chen, Y. W. Cho, J.-C. Crivello, F. Cuevas, W. I. David, P. E. de Jongh, R. V. Denys, M. Dornheim, M. Felderhoff, Y. Filinchuk, G. E. Froudakis, D. M. Grant, E. M. Gray, B. C. Hauback, T. He, T. D. Humphries, T. R. Jensen, S. Kim, Y. Kojima, M. Latroche, H.-W. Li, M. V. Lototskyy, J. W. Makepeace, K. T. Møller, L. Naheed, P. Ngene, D. Noréus, M. M. Nygård, S.-I. Orimo, M. Paskevicius, L. Pasquini, D. B. Ravnsbæk, M. Veronica Sofianos, T. J. Udovic, T. Vegge, G. S. Walker, C. J. Webb, C. Weidenthaler and C. Zlotea, J. Alloys Compd., 2020, 827, 153548–153588 CrossRef CAS.
- Y. Liu, D. Chabane and O. Elkedim, Energies, 2021, 14, 5758 CrossRef.
- Z. Cao, F. Habermann, K. Burkmann, M. Felderhoff and F. Mertens, Hydrogen, 2024, 5, 241–279 CrossRef CAS.
- J. J. Vajo, F. Mertens, C. C. Ahn, R. C. Bowman and B. Fultz, J. Phys. Chem. B, 2004, 108, 13977–13983 CrossRef CAS.
- J. J. Vajo, S. L. Skeith and F. Mertens, J. Phys. Chem. B, 2005, 109, 3719–3722 CrossRef CAS PubMed.
- J. Ortmeyer, A. Bodach, L. Sandig-Predzymirska, B. Zibrowius, F. Mertens and M. Felderhoff, ChemPhysChem, 2019, 20, 1360–1368 CrossRef CAS PubMed.
- L. Sandig-Predzymirska, J. Ortmeyer, J. Wagler, E. Brendler, F. Habermann, M. Anders, M. Felderhoff and F. Mertens, Dalton Trans., 2020, 49, 17689–17698 RSC.
- F. Habermann, K. Burkmann, B. Hansel, B. Störr, C. Schimpf, J. Seidel, M. Bertau and F. Mertens, Dalton Trans., 2023, 52, 4880–4890 RSC.
- F. Habermann, A. Wirth, K. Burkmann, B. Störr, J. Seidel, R. Gumeniuk, K. Bohmhammel and F. Mertens, ChemPhysChem, 2024, 25, e202300748–e202300759 CrossRef CAS PubMed.
- F. Habermann, K. Burkmann, J. Kraus, B. Störr, J. Seidel, J. Kortus, R. Gumeniuk, K. Bohmhammel and F. Mertens, J. Alloys Compd., 2024, 980, 173476–173488 CrossRef CAS.
- K. Burkmann, F. Habermann, E. Schumann, J. Kraus, B. Störr, H. Schmidt, E. Brendler, J. Seidel, K. Bohmhammel, J. Kortus and F. Mertens, New J. Chem., 2024, 48, 2743–2754 RSC.
- B. Bogdanović and M. Schwickardi, J. Alloys Compd., 1997, 253–254, 1–9 CrossRef.
- A. E. Finholt, G. D. Barbaras, G. K. Barbaras, G. Urry, T. Wartik and H. I. Schlesinger, J. Inorg. Nucl. Chem., 1955, 1, 317–325 CrossRef CAS.
- M. Fichtner, C. Frommen and O. Fuhr, Inorg. Chem., 2005, 44, 3479–3484 CrossRef CAS PubMed.
- H. Kabbour, C. C. Ahn, S.-J. Hwang, R. C. Bowman and J. Graetz, J. Alloys Compd., 2007, 446–447, 264–266 CrossRef CAS.
- M. Mamatha, B. Bogdanovic, M. Felderhoff, A. Pommerin, W. Schmidt, F. Schuth and C. Weidenthaler, J. Alloys Compd., 2006, 407, 78–86 CrossRef CAS.
- C. Li, X. Xiao, P. Ge, J. Xue, S. Li, H. Ge and L. Chen, Int. J. Hydrogen Energy, 2012, 37, 936–941 CrossRef CAS.
- M. Mamatha, C. Weidenthaler, A. Pommerin, M. Felderhoff and F. Schüth, J. Alloys Compd., 2006, 416, 303–314 CrossRef CAS.
- Crystallographic Databases, ed. F. H. Allen, G. Bergerhoff and R. Sievers, International Union of Crystallography, Chester, 1987 Search PubMed.
- D. Thomas, M. Abdel-Hafiez, T. Gruber, R. Hüttl, J. Seidel, A. U. Wolter, B. Büchner, J. Kortus and F. Mertens, J. Chem. Thermodyn., 2013, 64, 205–225 CrossRef CAS.
- S. Loos, D. Gruner, M. Abdel-Hafiez, J. Seidel, R. Hüttl, A. U. Wolter, K. Bohmhammel and F. Mertens, J. Chem. Thermodyn., 2015, 85, 77–85 CrossRef CAS.
- Q. Shi, C. L. Snow, J. Boerio-Goates and B. F. Woodfield, J. Chem. Thermodyn., 2010, 42, 1107–1115 CrossRef CAS.
- G. K. White and S. J. Collocott, J. Phys. Chem. Ref. Data, 1984, 13, 1251–1257 CrossRef CAS.
- G. Della Gatta, M. J. Richardson, S. M. Sarge and S. Stølen, Pure Appl. Chem., 2006, 78, 1455–1476 CrossRef CAS.
- P. Hohenberg and W. Kohn, Phys. Rev., 1964, 136, B864–B871 CrossRef.
- W. Kohn and L. J. Sham, Phys. Rev., 1965, 140, A1133–A1138 CrossRef.
- P. Giannozzi, S. Baroni, N. Bonini, M. Calandra, R. Car, C. Cavazzoni, D. Ceresoli, G. L. Chiarotti, M. Cococcioni, I. Dabo, A. Dal Corso, S. de Gironcoli, S. Fabris, G. Fratesi, R. Gebauer, U. Gerstmann, C. Gougoussis, A. Kokalj, M. Lazzeri, L. Martin-Samos, N. Marzari, F. Mauri, R. Mazzarello, S. Paolini, A. Pasquarello, L. Paulatto, C. Sbraccia, S. Scandolo, G. Sclauzero, A. P. Seitsonen, A. Smogunov, P. Umari and R. M. Wentzcovitch, J. Phys.: Condens. Matter, 2009, 21, 395502–395521 CrossRef PubMed.
- P. Giannozzi, O. Andreussi, T. Brumme, O. Bunau, M. Buongiorno Nardelli, M. Calandra, R. Car, C. Cavazzoni, D. Ceresoli, M. Cococcioni, N. Colonna, I. Carnimeo, A. Dal Corso, S. de Gironcoli, P. Delugas, R. A. DiStasio, A. Ferretti, A. Floris, G. Fratesi, G. Fugallo, R. Gebauer, U. Gerstmann, F. Giustino, T. Gorni, J. Jia, M. Kawamura, H.-Y. Ko, A. Kokalj, E. Küçükbenli, M. Lazzeri, M. Marsili, N. Marzari, F. Mauri, N. L. Nguyen, H.-V. Nguyen, A. Otero-de-la Roza, L. Paulatto, S. Poncé, D. Rocca, R. Sabatini, B. Santra, M. Schlipf, A. P. Seitsonen, A. Smogunov, I. Timrov, T. Thonhauser, P. Umari, N. Vast, X. Wu and S. Baroni, J. Phys.: Condens. Matter, 2017, 29, 465901–465931 CrossRef CAS PubMed.
- P. Giannozzi, O. Baseggio, P. Bonfà, D. Brunato, R. Car, I. Carnimeo, C. Cavazzoni, S. de Gironcoli, P. Delugas, F. Ferrari Ruffino, A. Ferretti, N. Marzari, I. Timrov, A. Urru and S. Baroni, J. Chem. Phys., 2020, 152, 154105–154116 CrossRef CAS PubMed.
- P. E. Blöchl, Phys. Rev. B: Condens. Matter Mater. Phys., 1994, 50, 17953–17979 CrossRef PubMed.
- A. Dal Corso, Comput. Mater. Sci., 2014, 95, 337–350 CrossRef CAS.
- J. P. Perdew, K. Burke and M. Ernzerhof, Phys. Rev. Lett., 1996, 77, 3865–3868 CrossRef CAS PubMed.
- R. Varin, E. Kościuczyk and T. Czujko, Materials, 2015, 8, 3479–3490 CrossRef CAS.
- K. Suárez-Alcántara, J. R. Tena-Garcia and R. Guerrero-Ortiz, Materials, 2019, 12, 2724–2787 CrossRef PubMed.
- V. V. Gavrilenko, Y. N. Karaksin and L. I. Zakharkin, Zh. Obshch. Khim., 1972, 42, 1564–1569 CAS.
- H. E. Kissinger, Anal. Chem., 1957, 29, 1702–1706 CrossRef CAS.
- X. Xiao, C. Li, L. Chen, X. Fan, H. Kou and Q. Wang, J. Alloys Compd., 2011, 509S, S743–S746 CrossRef.
- D. F. Moyer, J. Phys. Chem. Solids, 1965, 26, 1459–1462 CrossRef CAS.
- D. A. Shirley, J. Am. Chem. Soc., 1960, 82, 3841–3843 CrossRef CAS.
- M. W. Chase, NIST-JANAF Thermochemical Tables, American Institute of Physics, Woodbury, NY, 4th edn, 1998 Search PubMed.
- T. Sato, M. H. Sørby, K. Ikeda, S. Sato, B. C. Hauback and S. Orimo, J. Alloys Compd., 2009, 487, 472–478 CrossRef CAS.
- A. Roine, HSC Chemistry, 2021 Search PubMed.
- L. Qiu and M. A. White, J. Chem. Educ., 2001, 78, 1076–1079 CrossRef CAS.
- G. Sandrock, J. Reilly, J. Graetz, W.-M. Zhou, J. Johnson and J. Wegrzyn, Appl. Phys. A, 2005, 80, 687–690 CrossRef CAS.
- W. F. Giauque and P. F. Meads, J. Am. Chem. Soc., 1941, 63, 1897–1901 CrossRef CAS.
- Y. Takahashi, T. Azumi and Y. Sekine, Thermochim. Acta, 1989, 139, 133–137 CrossRef CAS.
- B. S. Hemingway and R. A. Robie, J. Chem. Thermodyn., 1997, 29, 211–220 CrossRef CAS.
- S. S. Kumar, S. Ghosh, M. Sahu and R. Ganesan, J. Chem. Sci., 2019, 131, 100–106 CrossRef.
- D. Kevorkov, R. Schmid-Fetzer, A. Pisch, F. Hodaj and C. Colinet, Int. J. Mater. Res., 2001, 92, 953–958 CrossRef CAS.
- O. M. Løvvik and P. N. Molin, AIP Conf. Proc., 2006, 837, 85–90 CrossRef.
- A. Klaveness, P. Vajeeston, P. Ravindran, H. Fjellvåg and A. Kjekshus, Phys. Rev. B: Condens. Matter Mater. Phys., 2006, 73, 094122–094128 CrossRef.
- A. Klaveness, P. Vajeeston, P. Ravindran, H. Fjellvåg and A. Kjekshus, J. Alloys Compd., 2007, 433, 225–232 CrossRef CAS.
- P. Ehrlich, K. Peik and E. Koch, Z. Anorg. Allg. Chem., 1963, 324, 113–224 CrossRef CAS.
- K. Fiedler, dissertation, TU Bergakademie Freiberg, Freiberg, 2012.
Footnote |
| † Electronic supplementary information (ESI) available. See DOI: https://doi.org/10.1039/d4mr00140k |
| This journal is © The Royal Society of Chemistry 2025 |